
Human Impacts on Estuarine Erosion-Deposition in Southern Central Vietnam: Observation and Hydrodynamic Simulation


Abstract
:1. Introduction
2. Materials and Methods
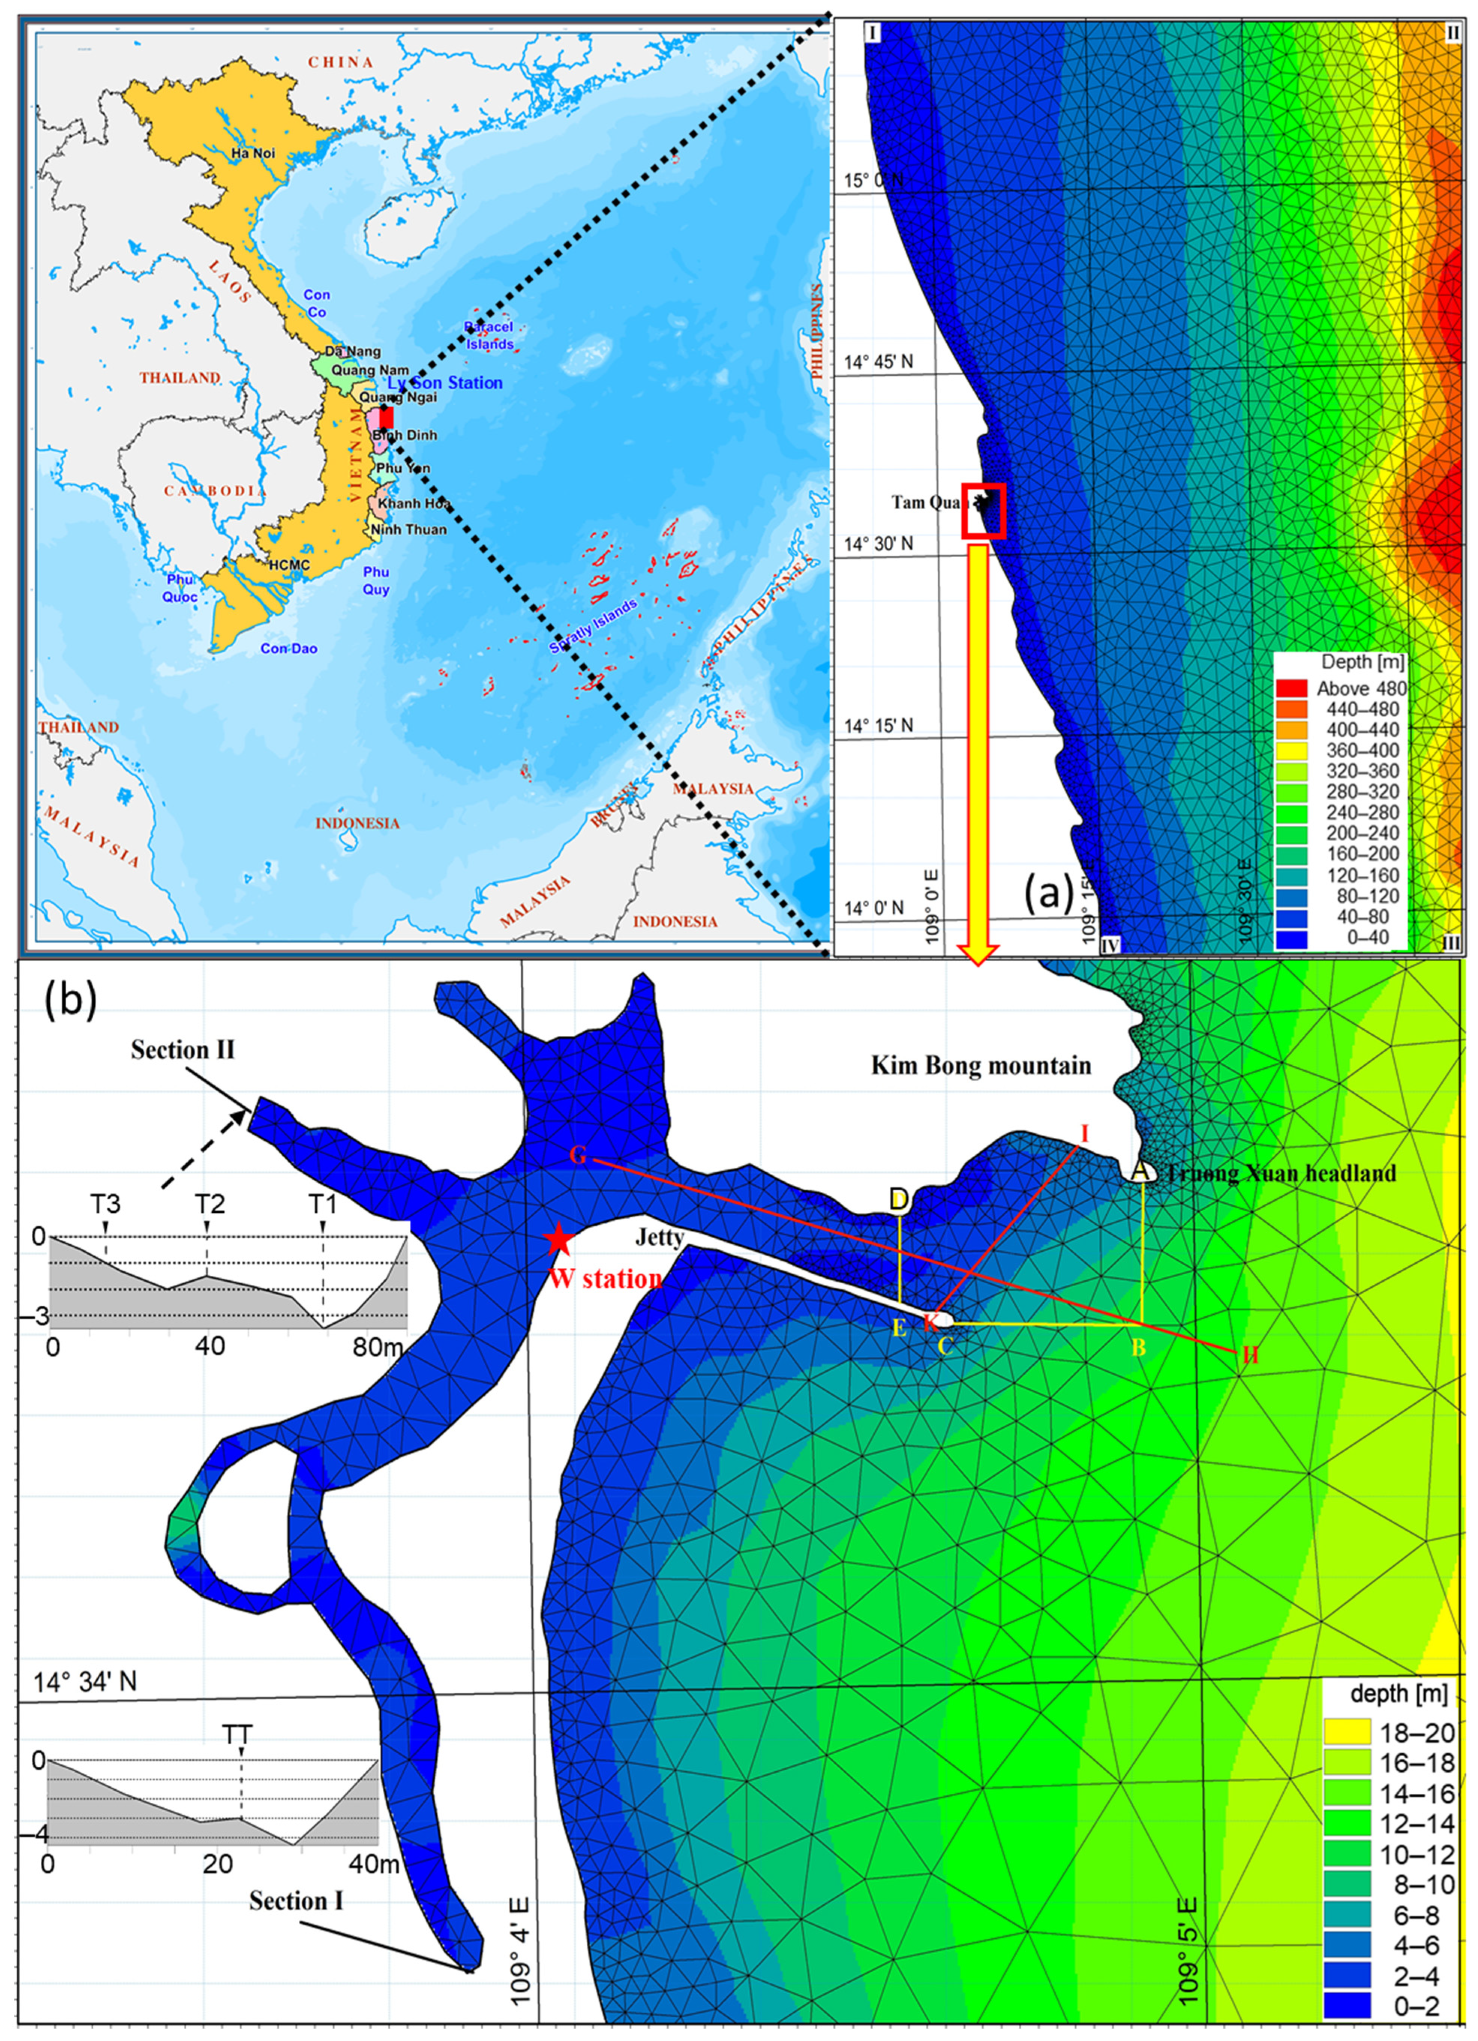
2.1. Study Area
2.2. Materials
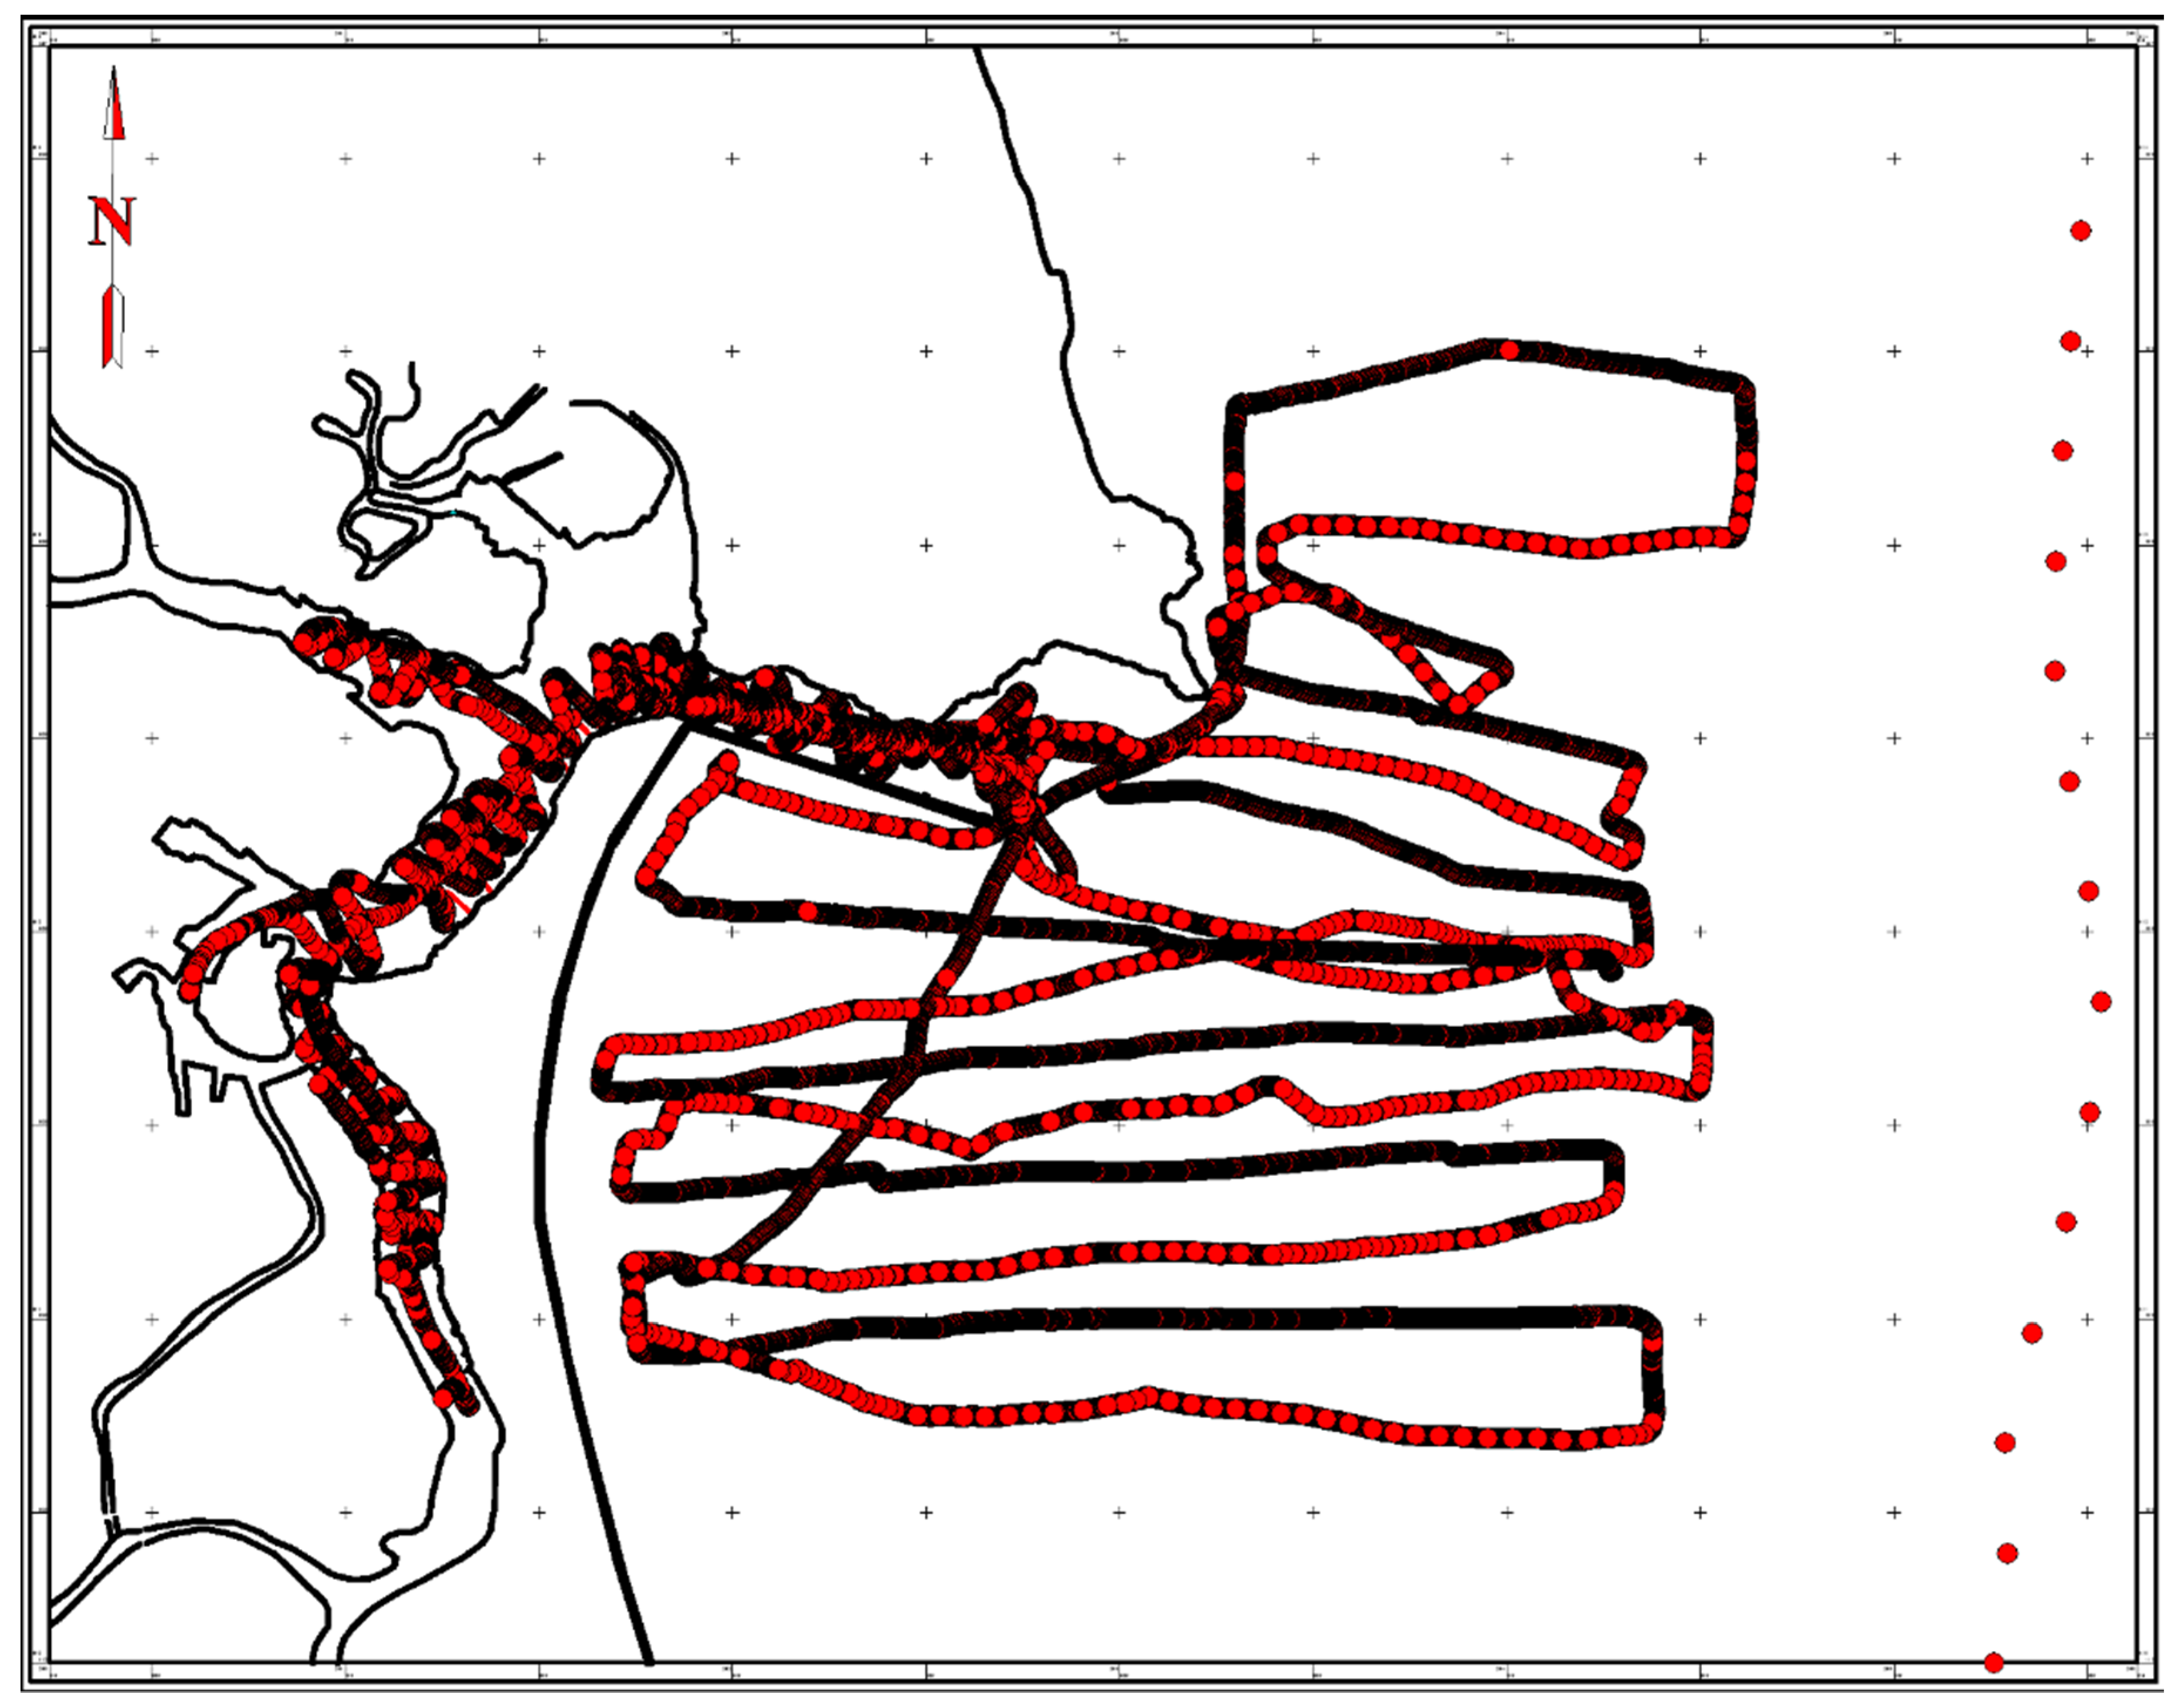
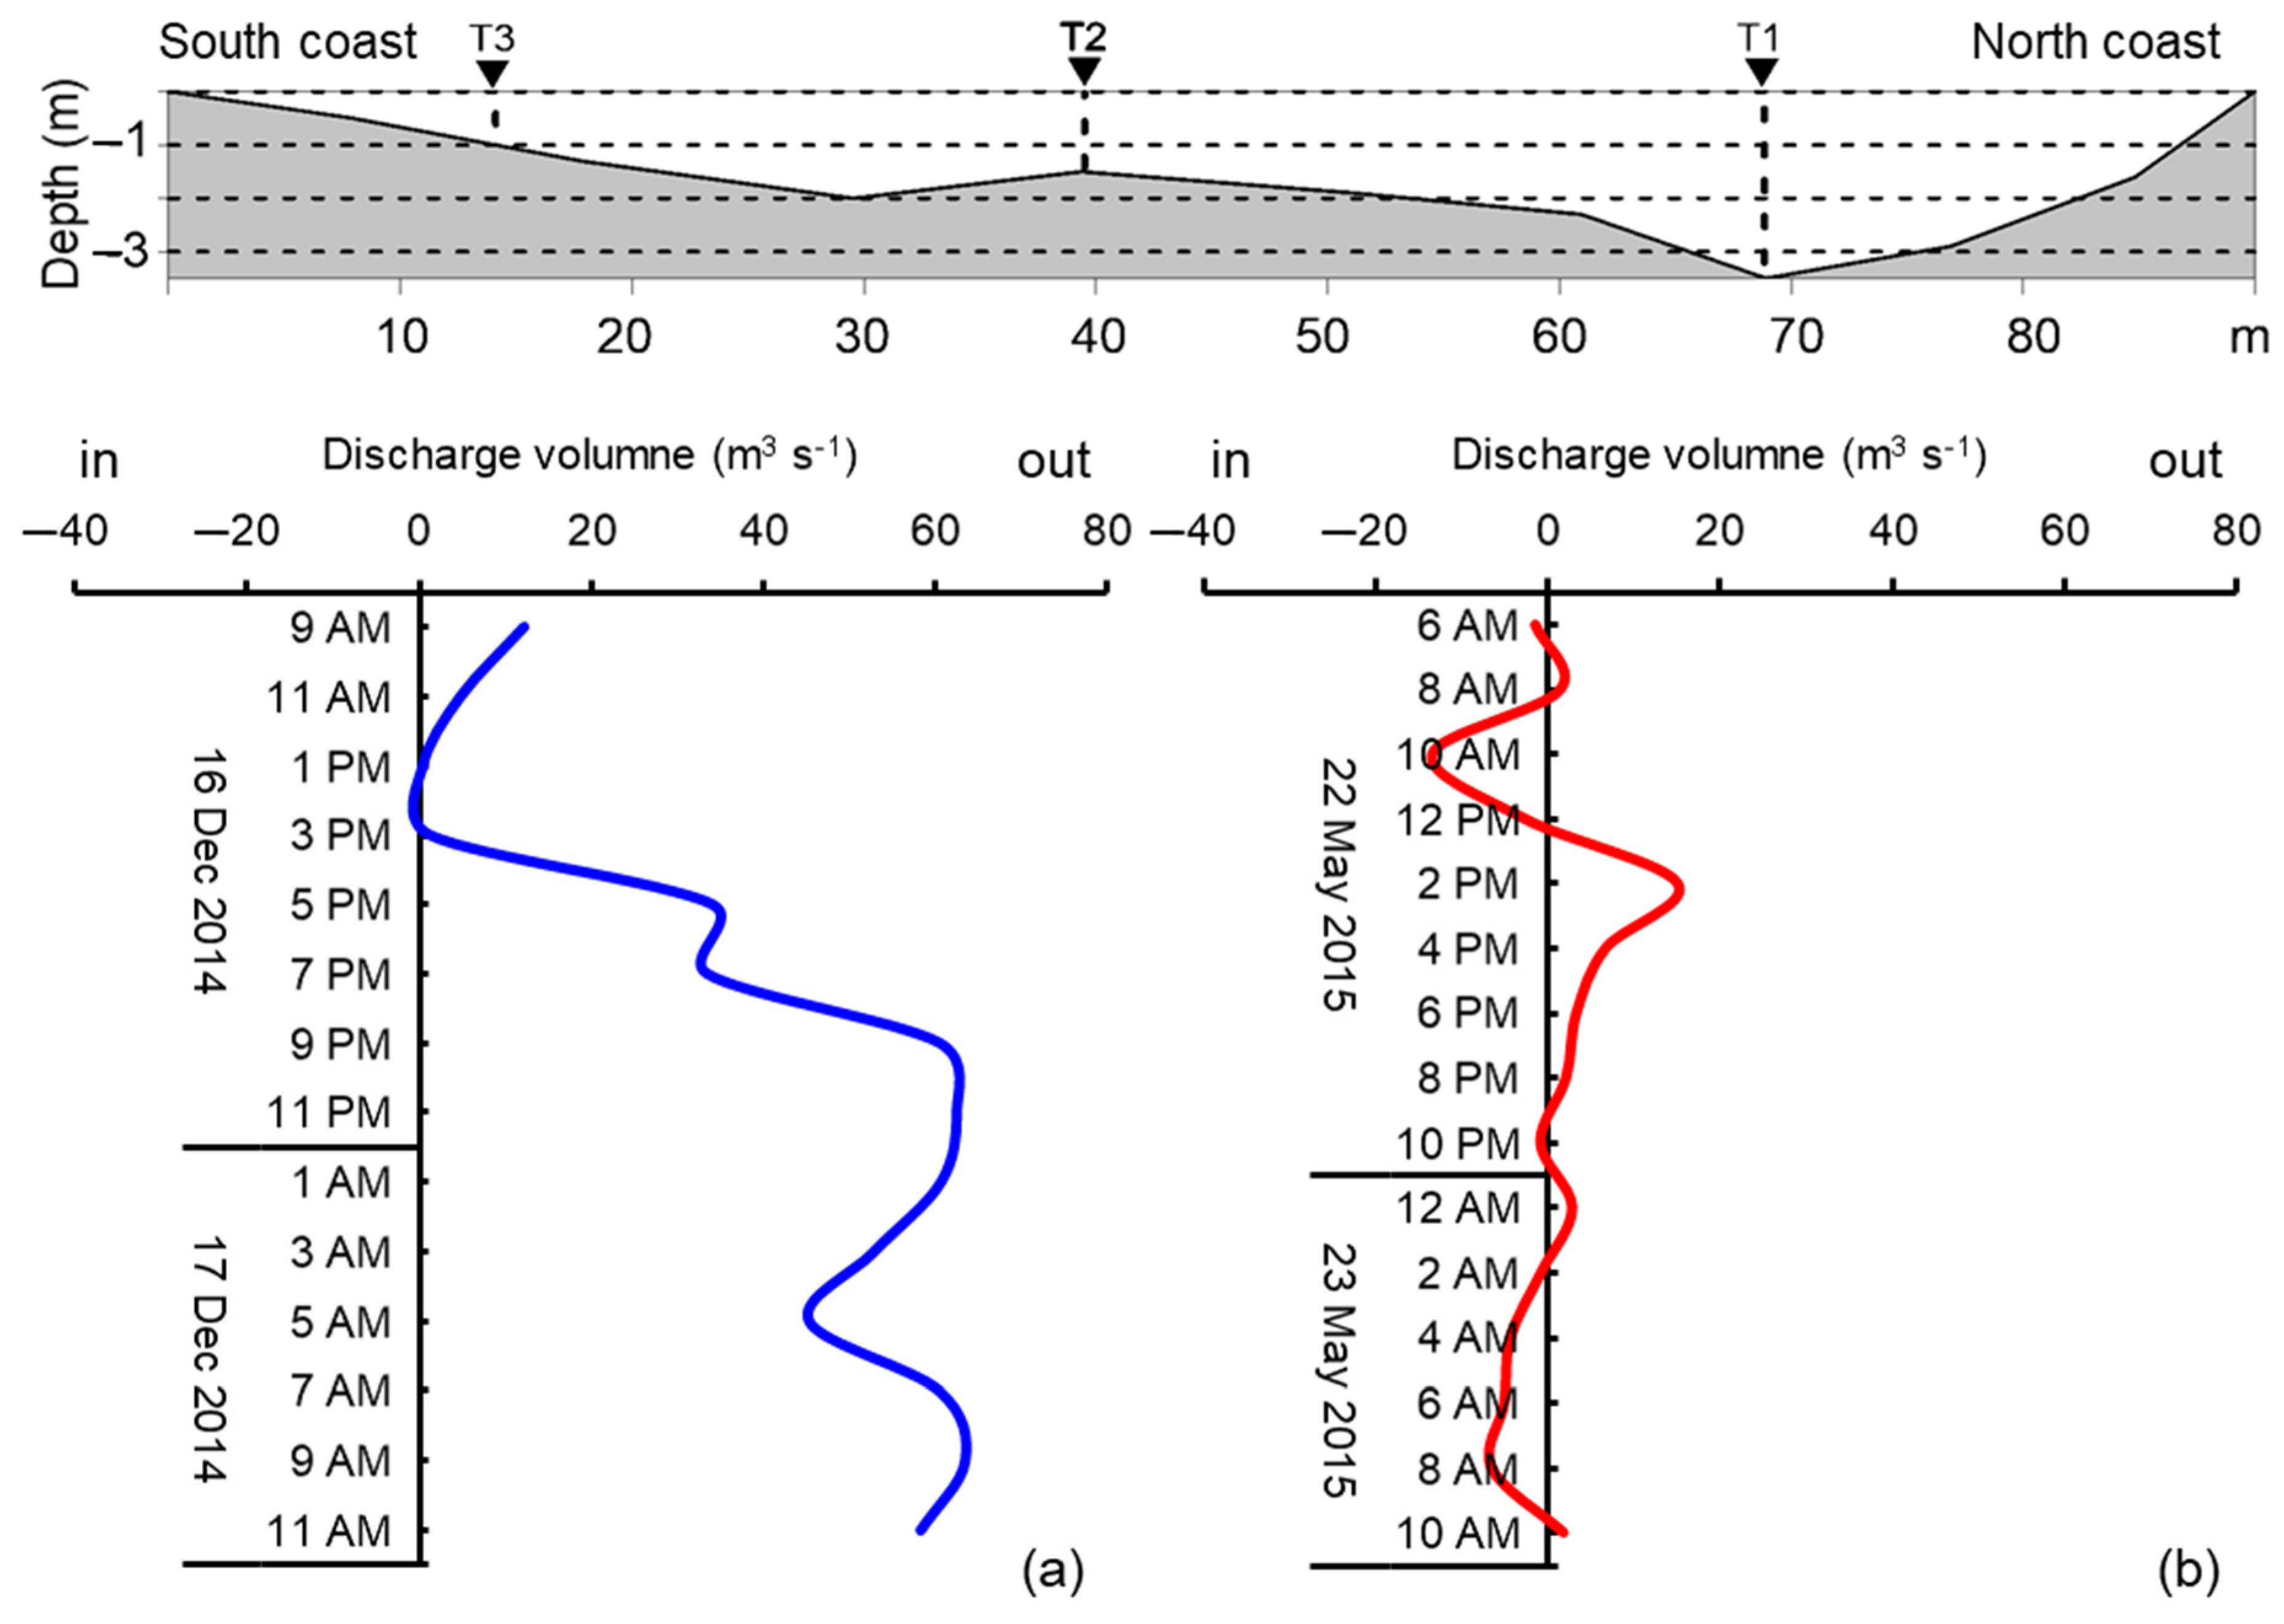
2.3. Data Collection
2.4. Modeling
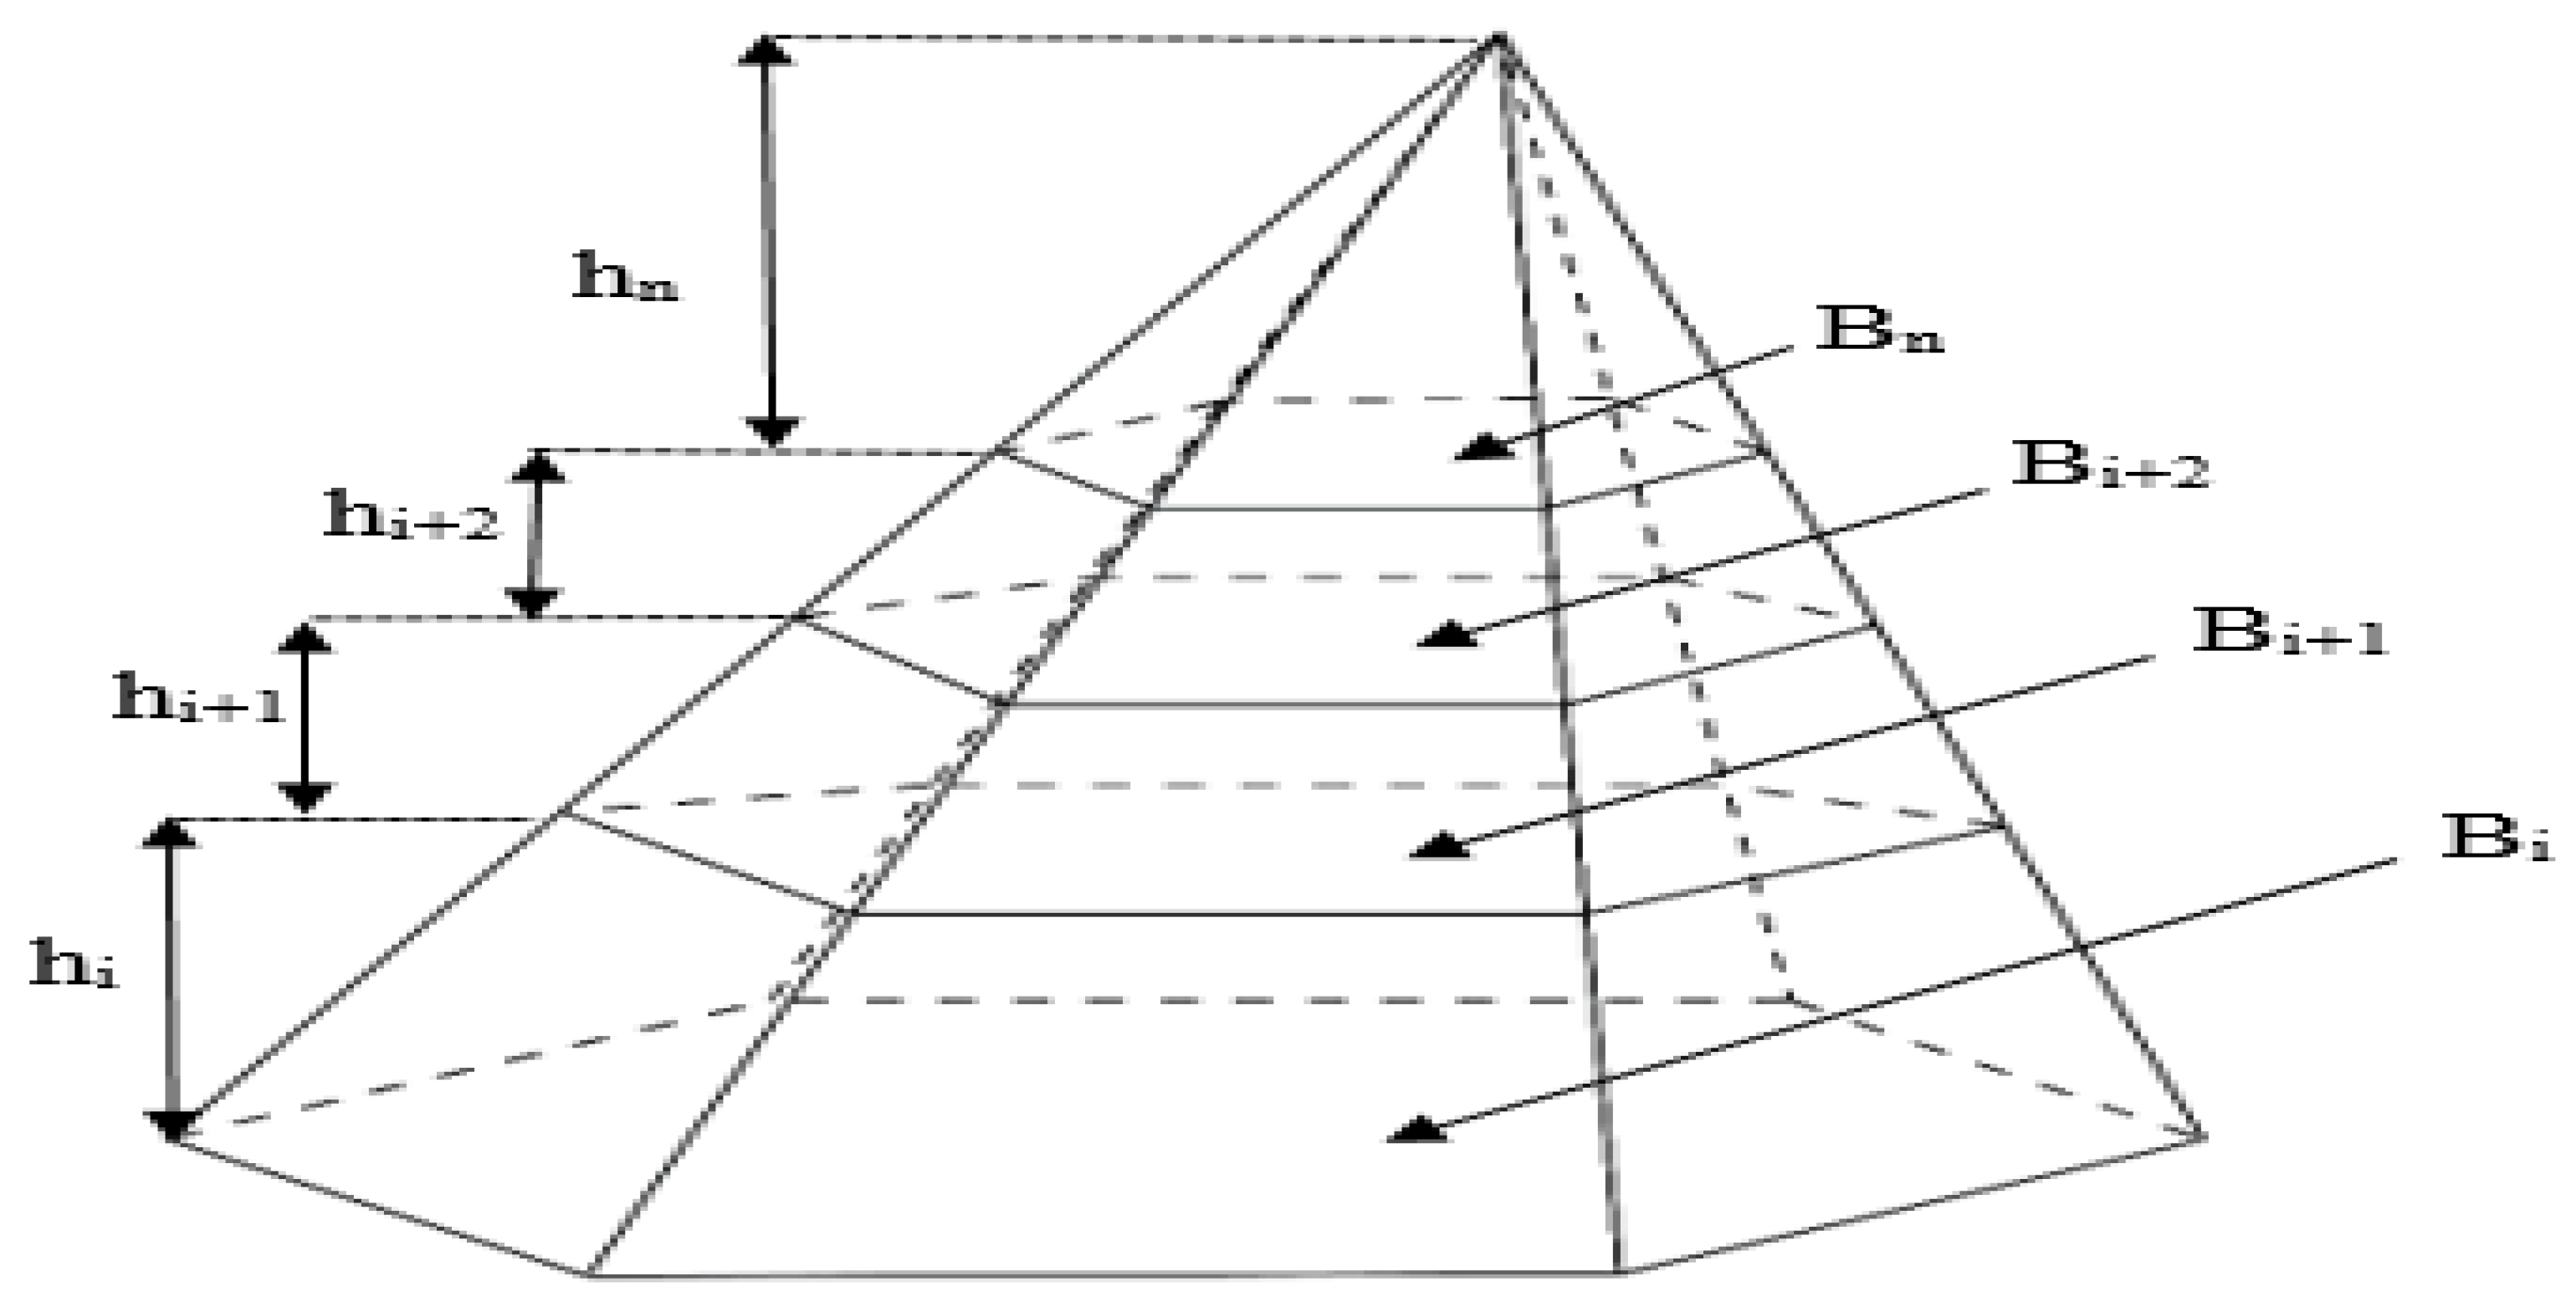
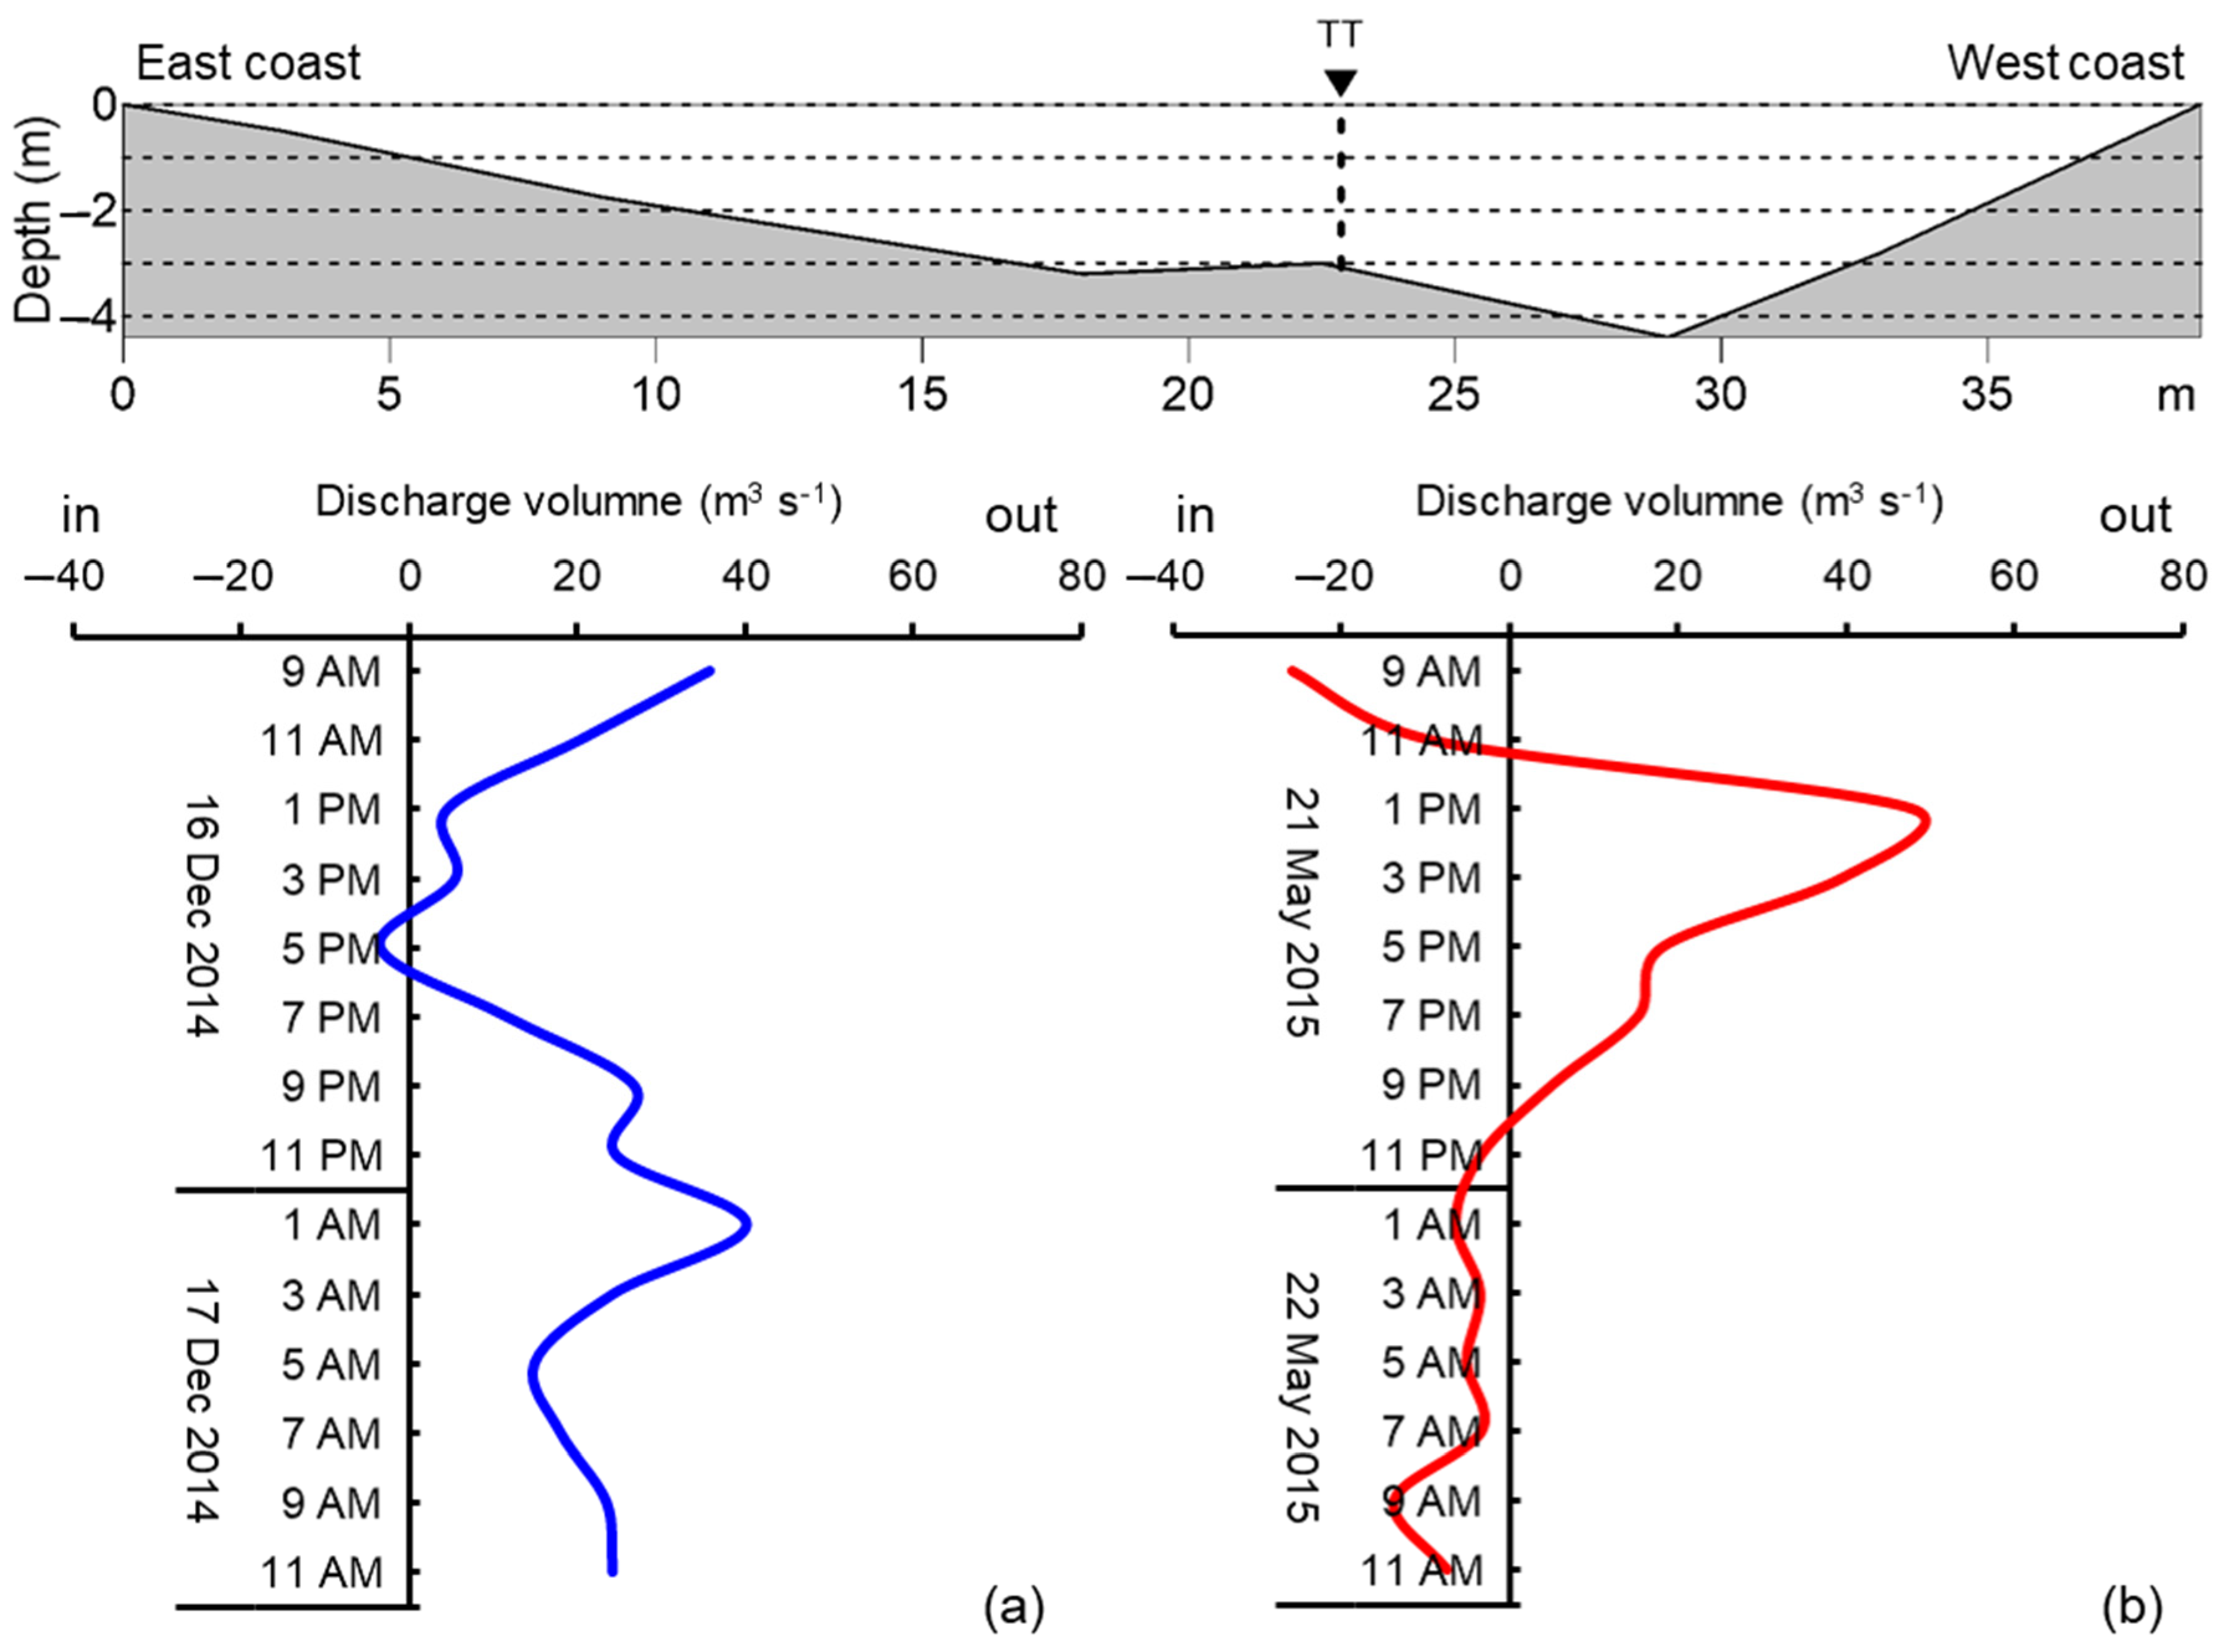
2.5. Data Analysis
3. Results
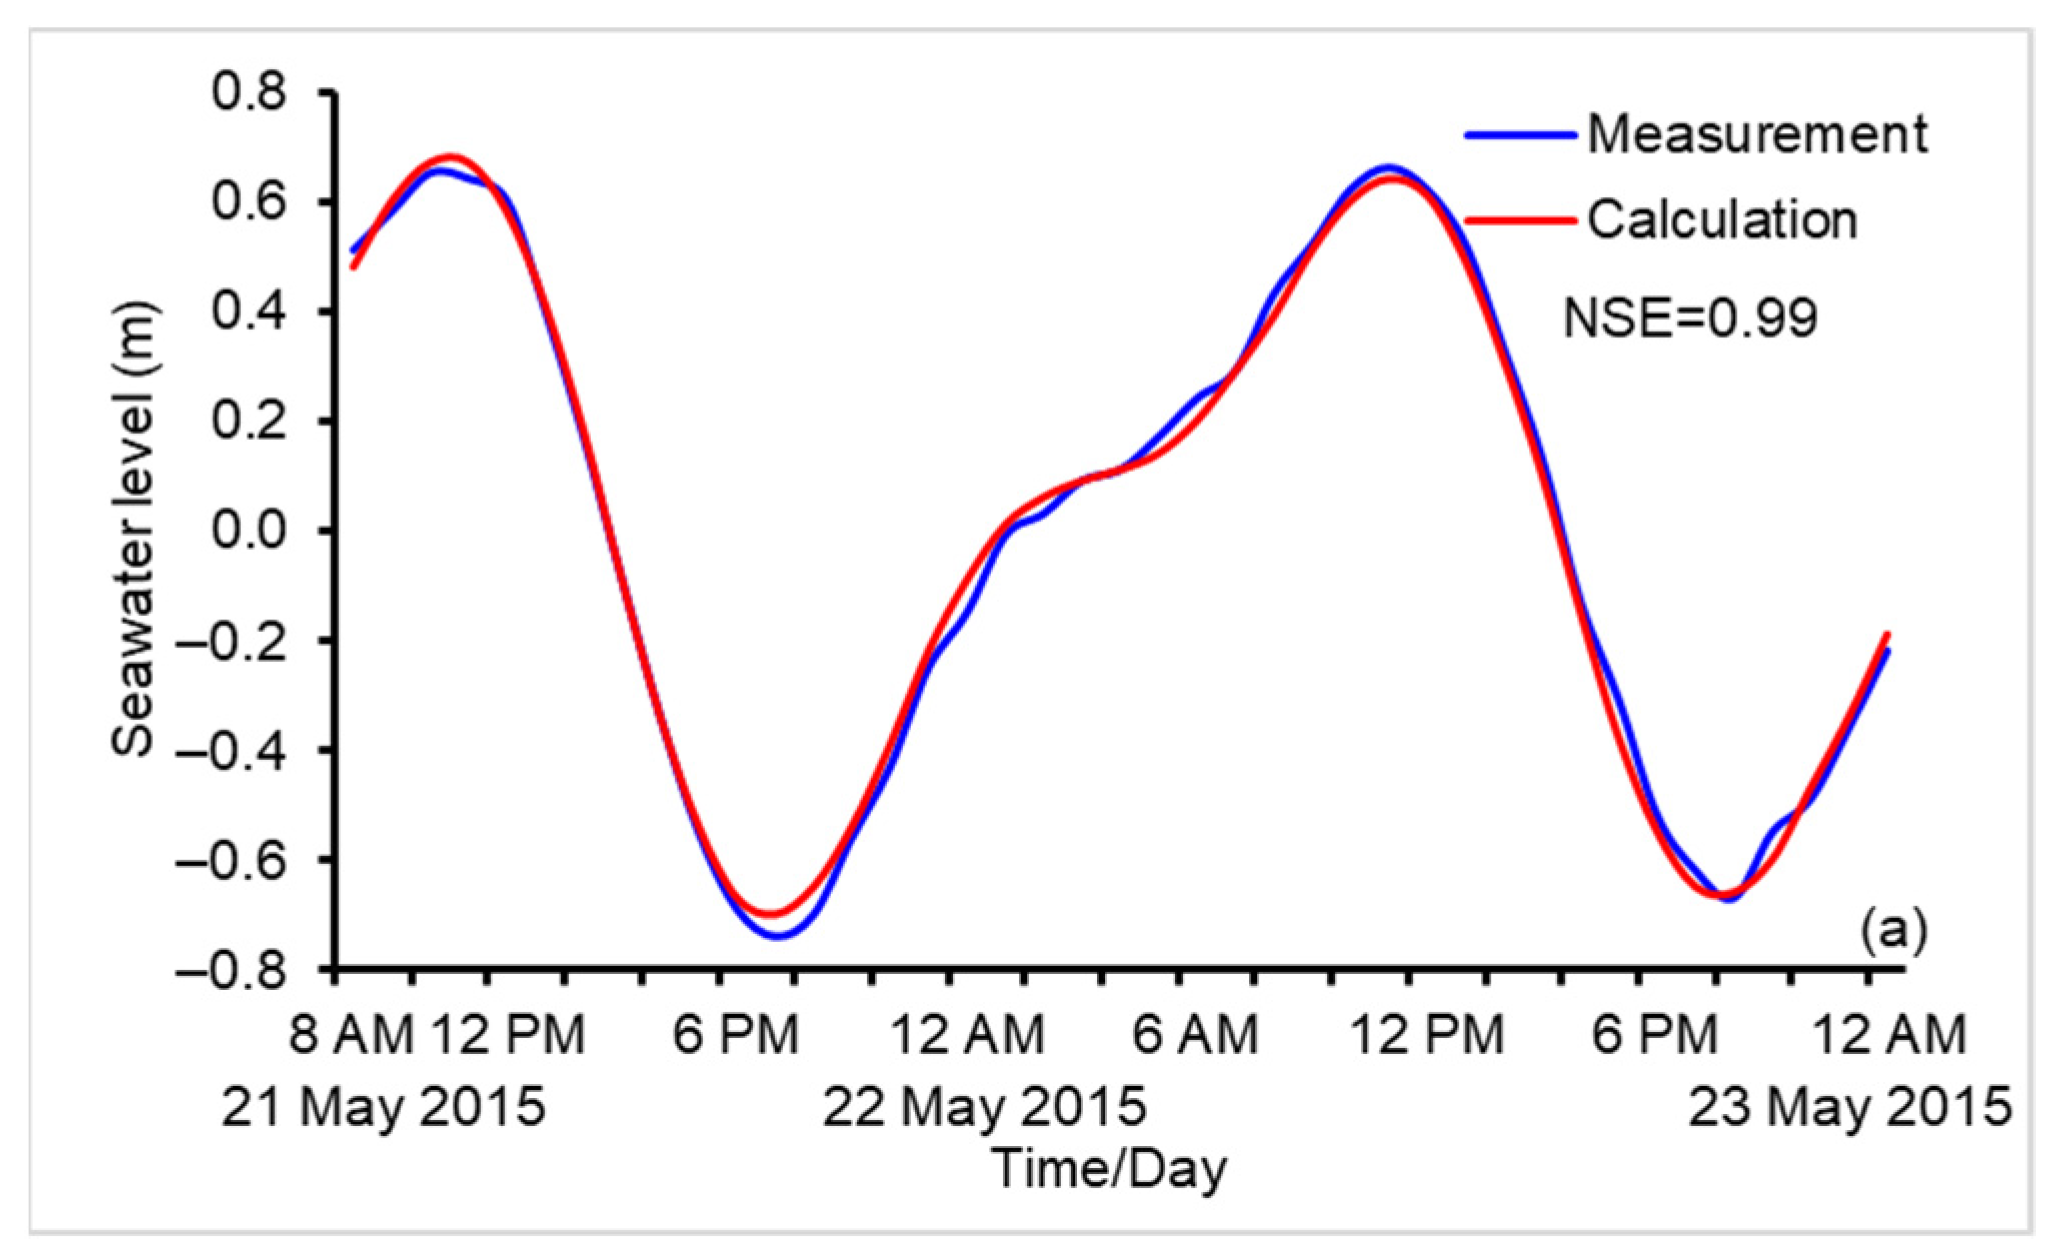
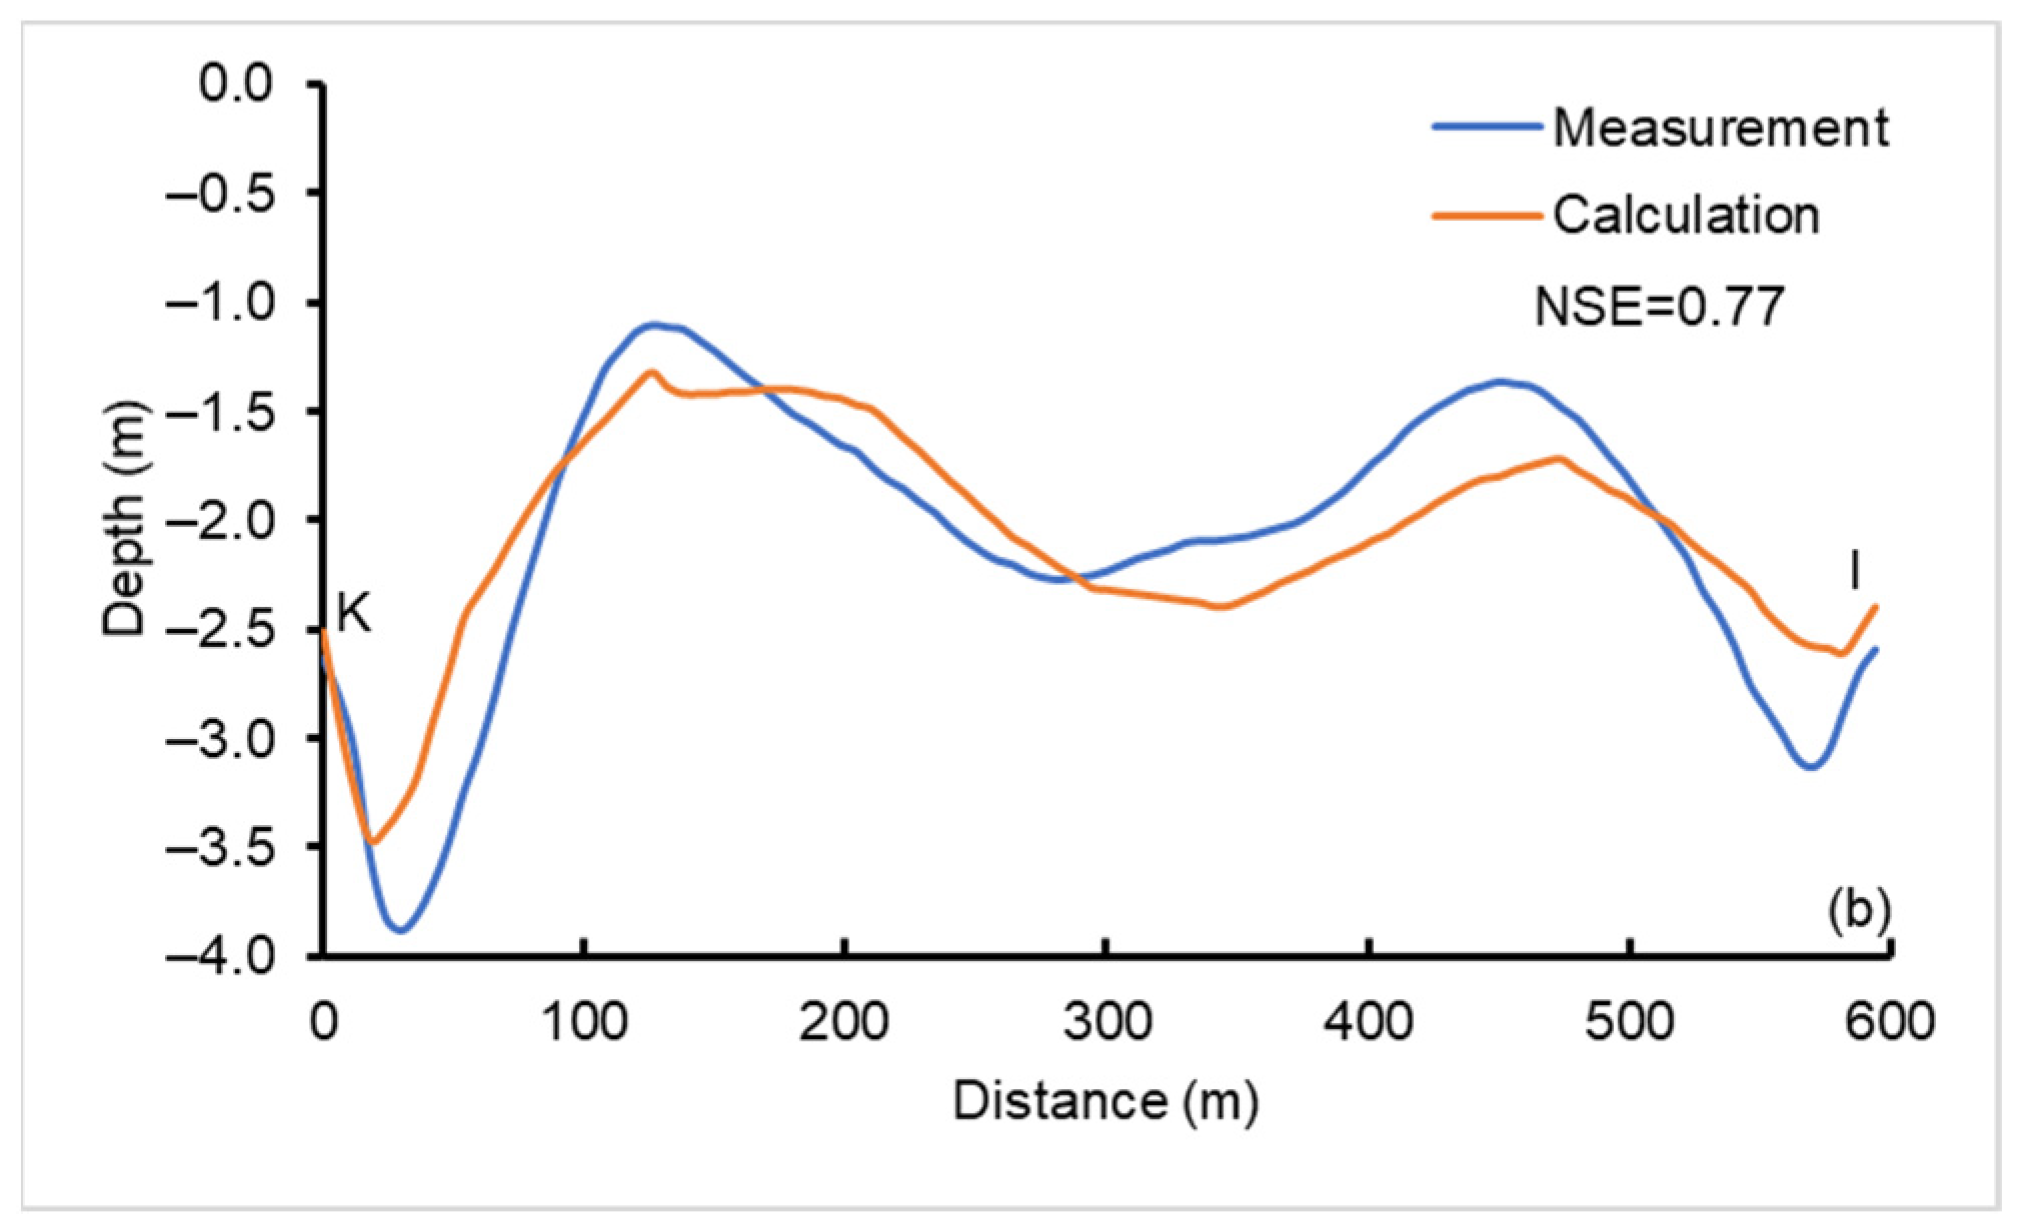
3.1. Observation Data and Calibration of Model
3.2. Hydrodynamic System
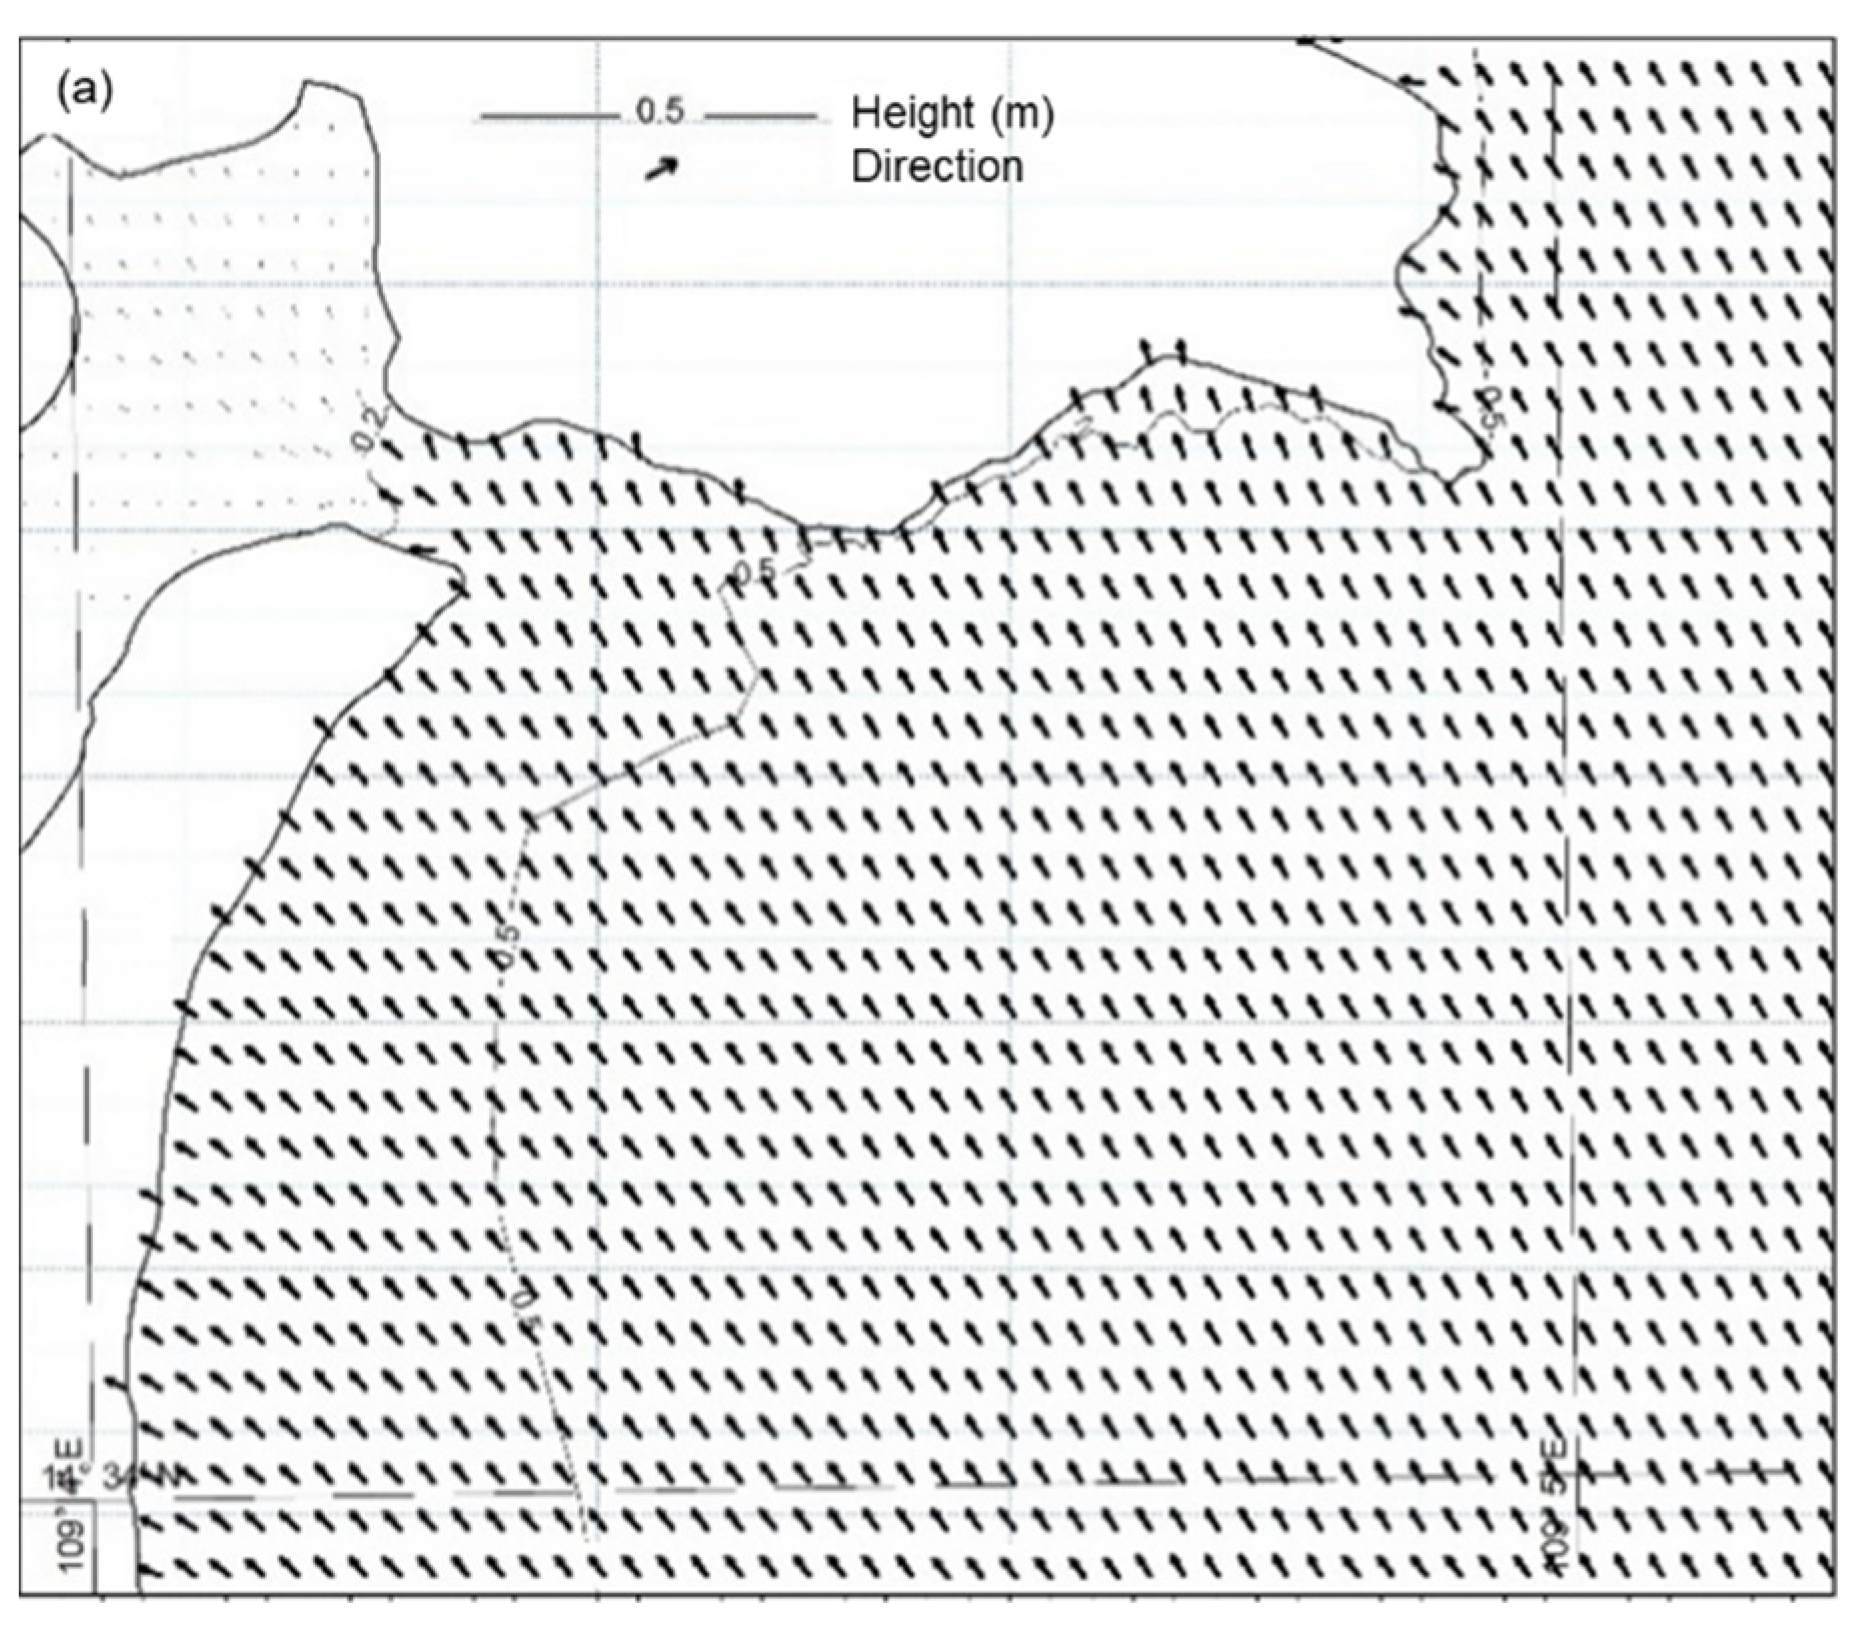
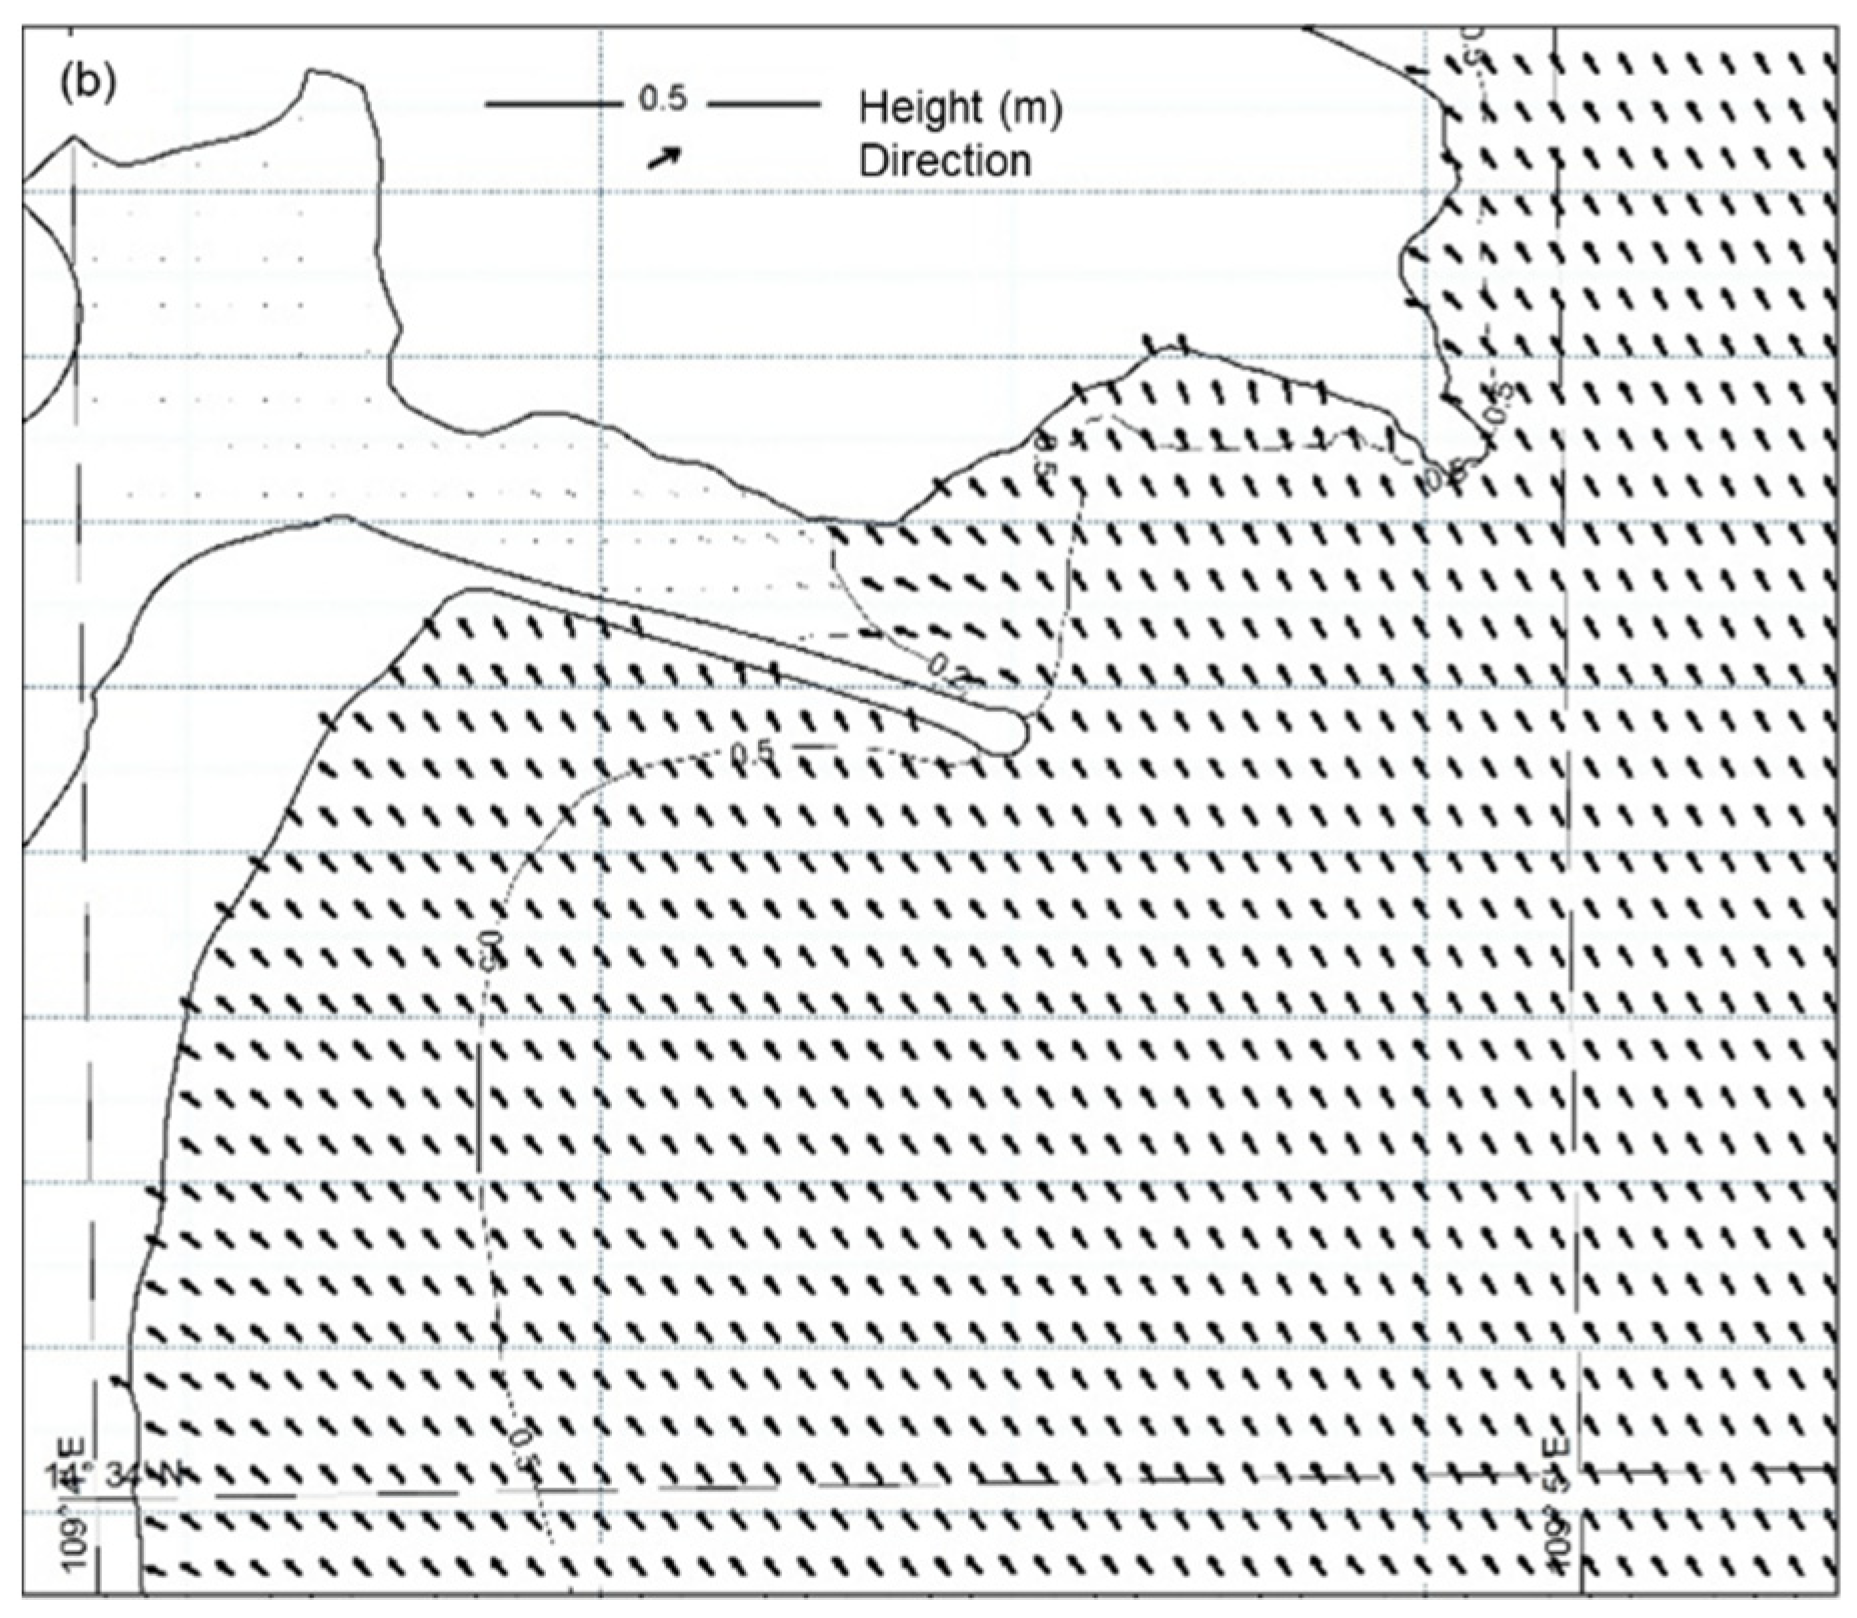
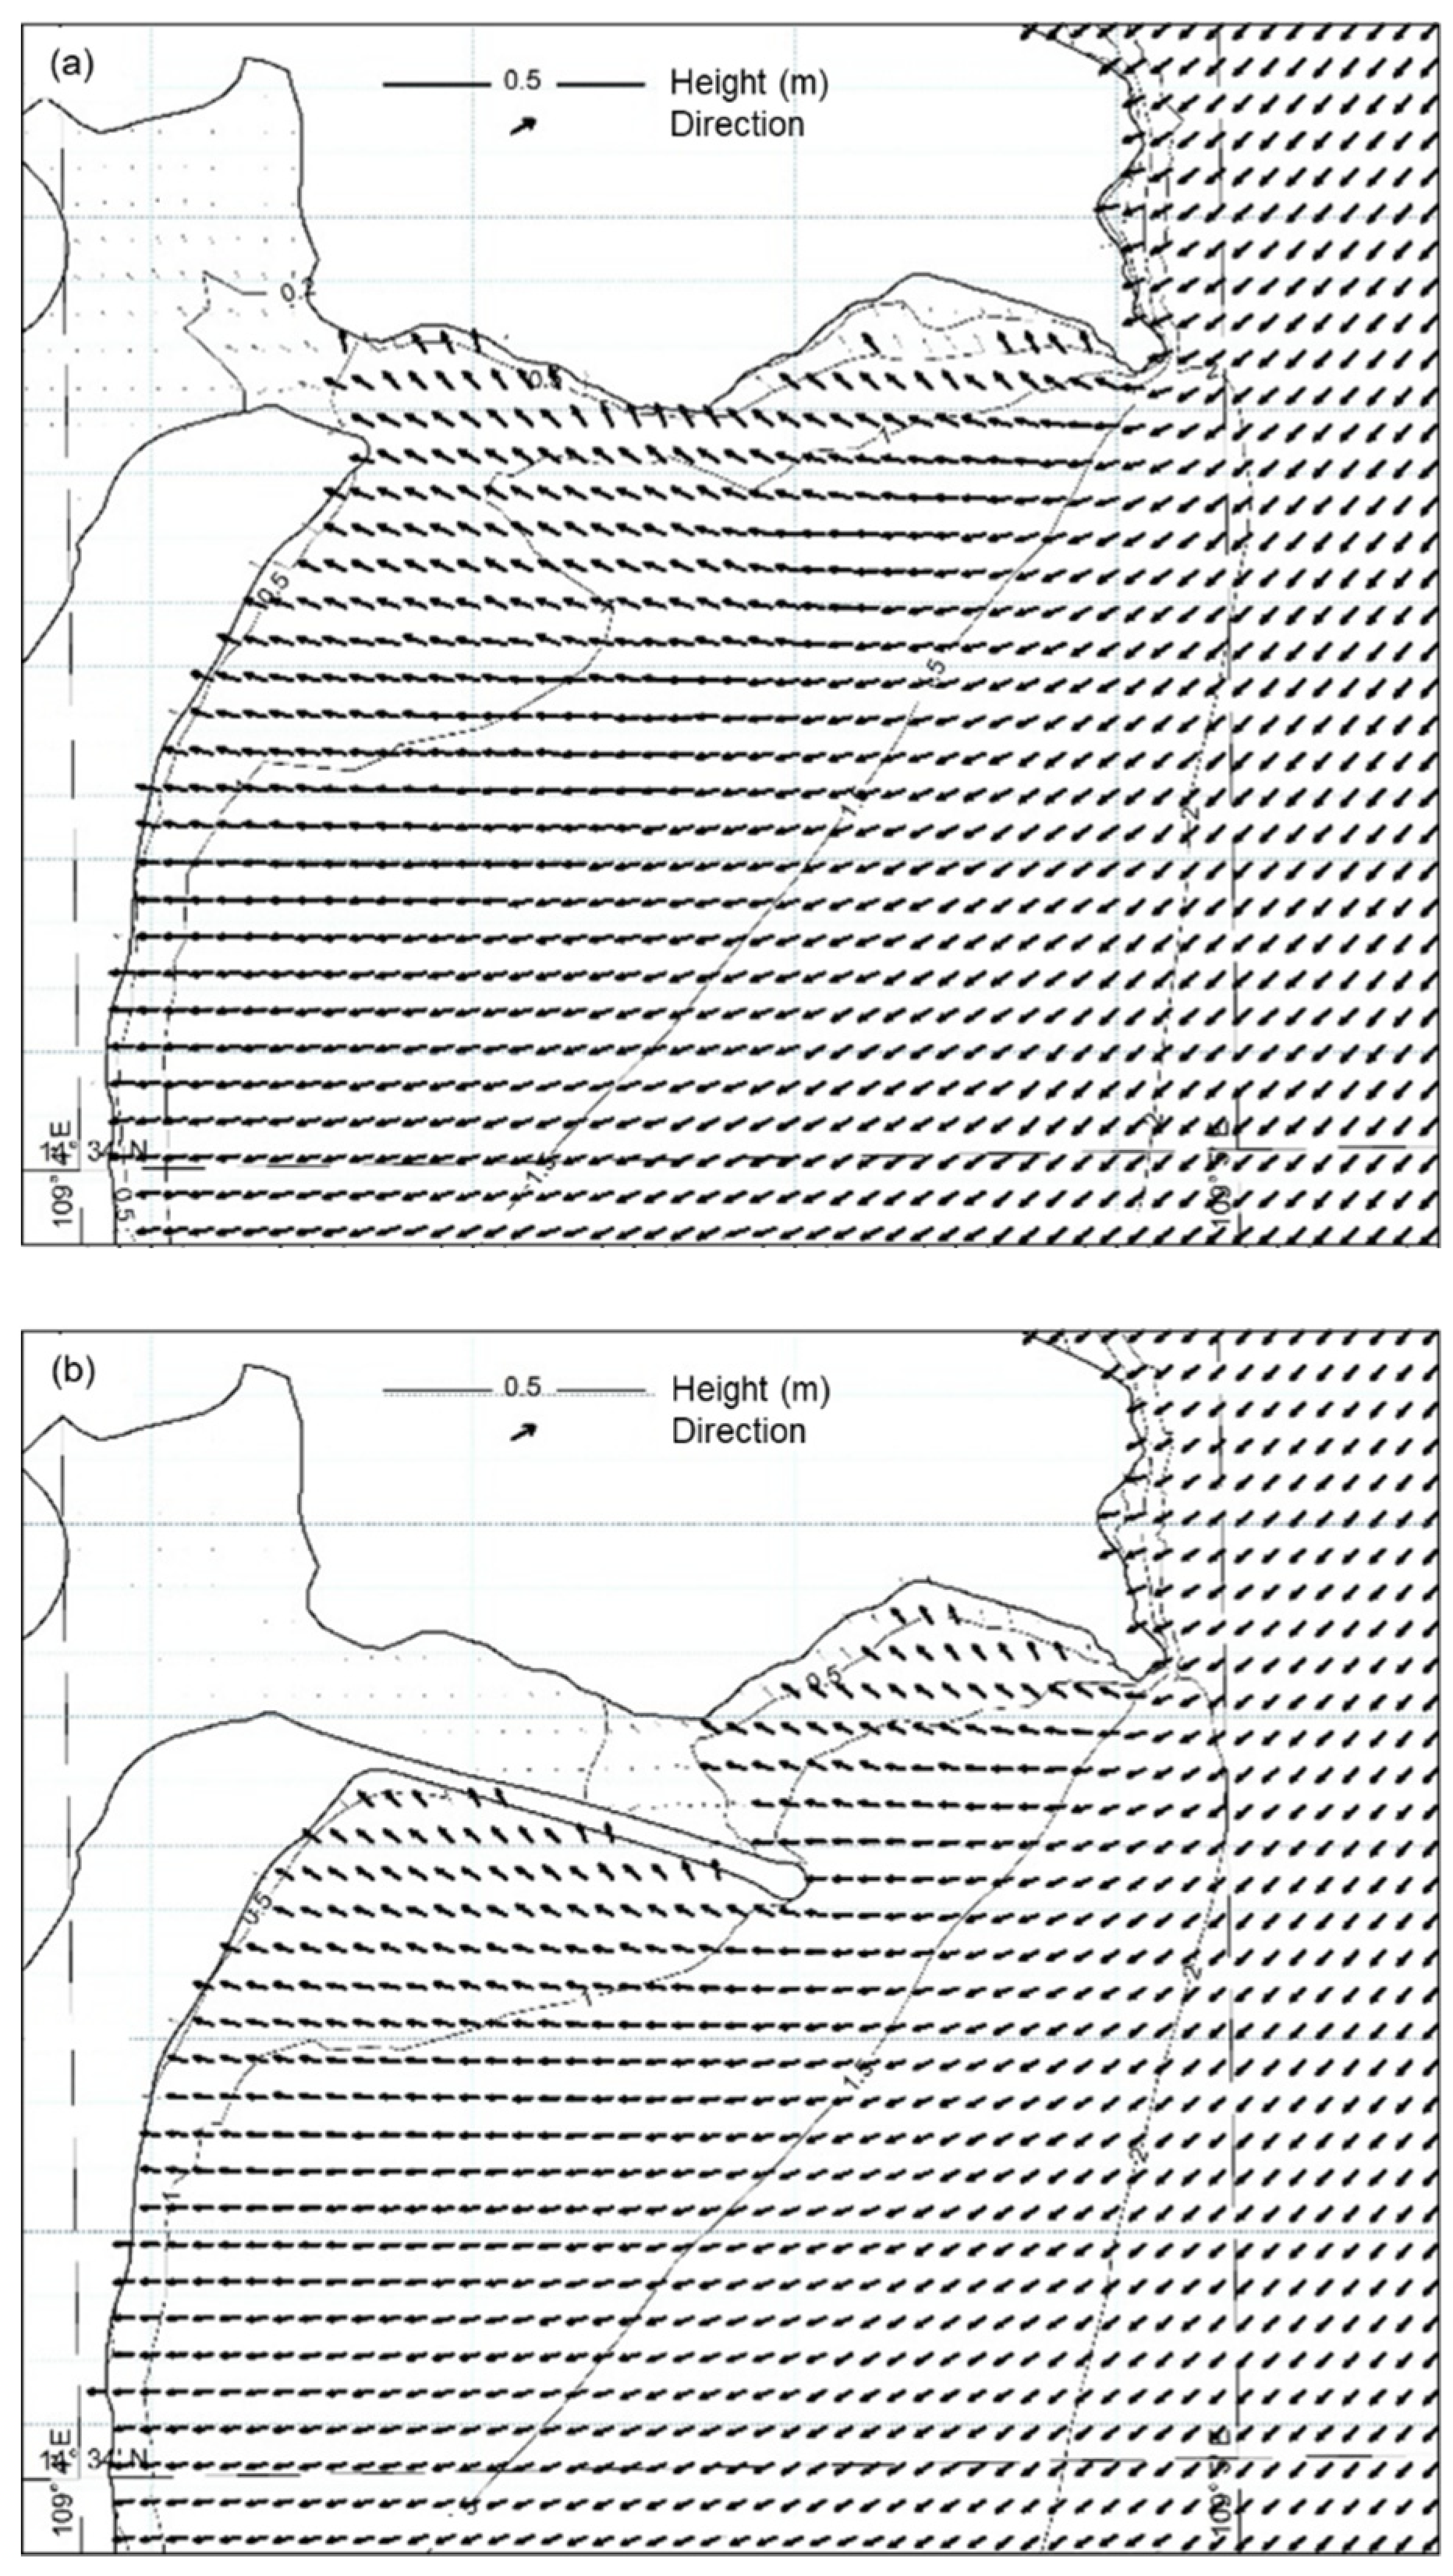
3.2.1. Waves
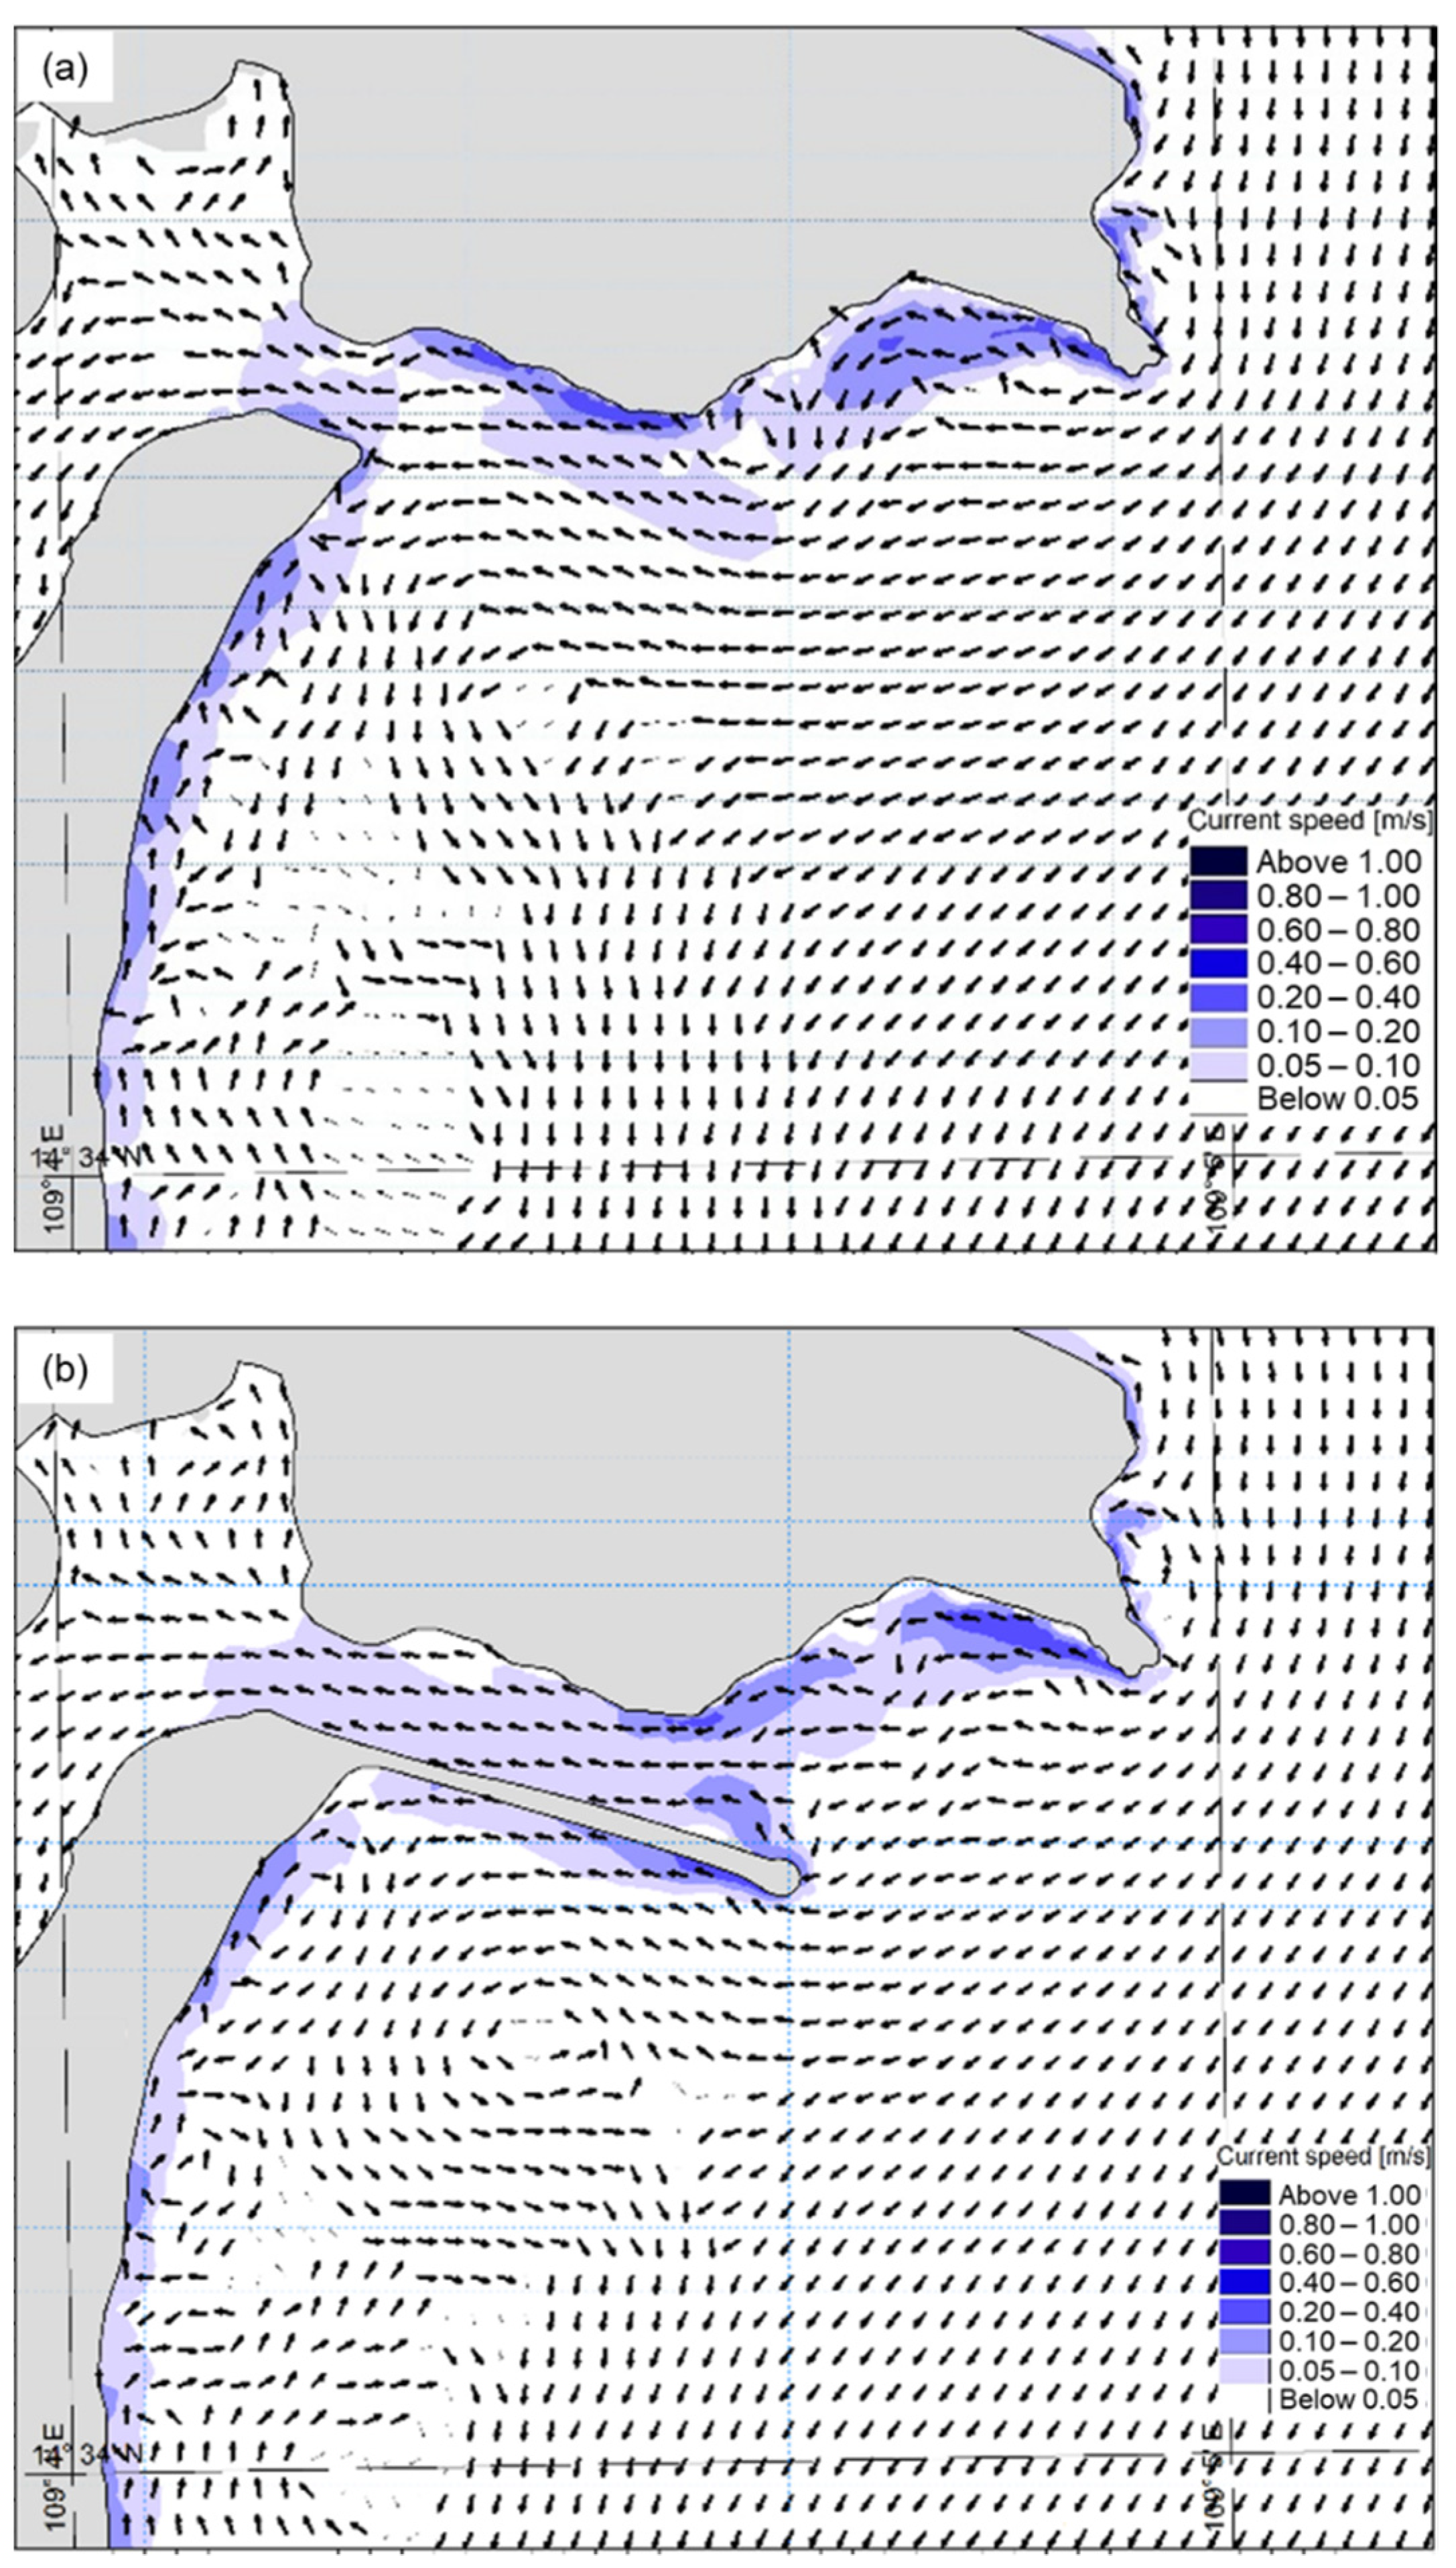
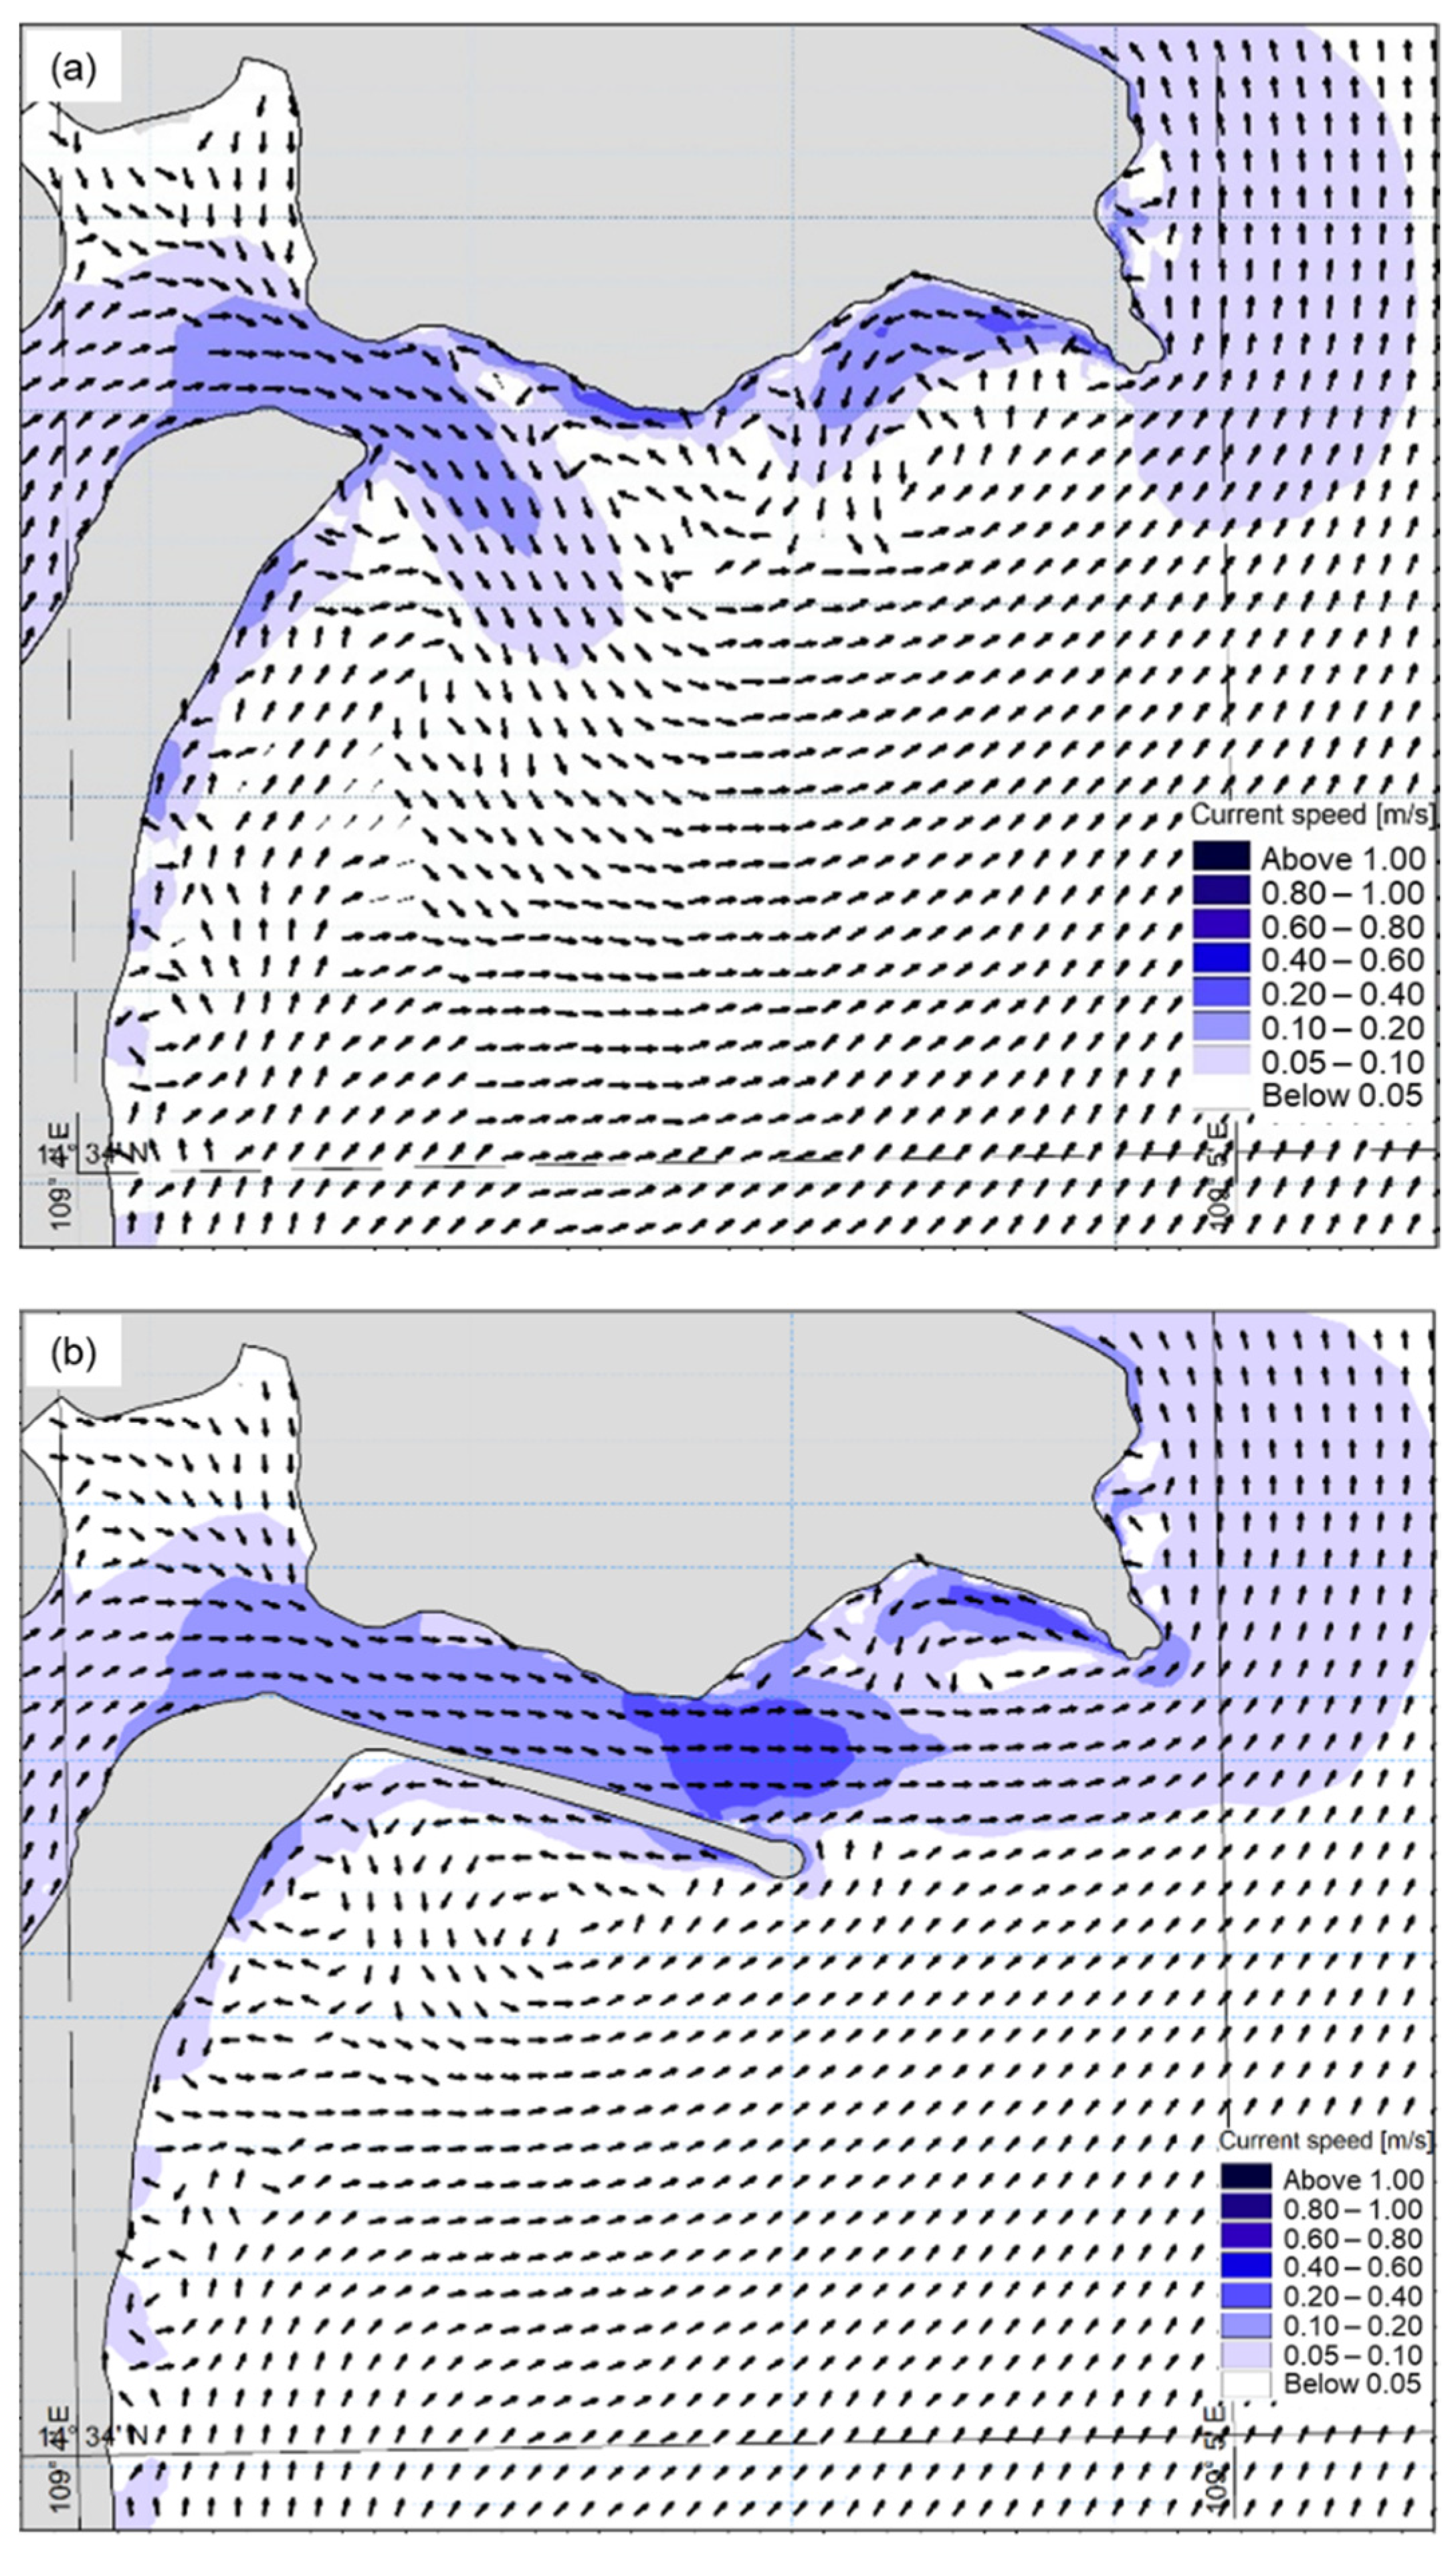
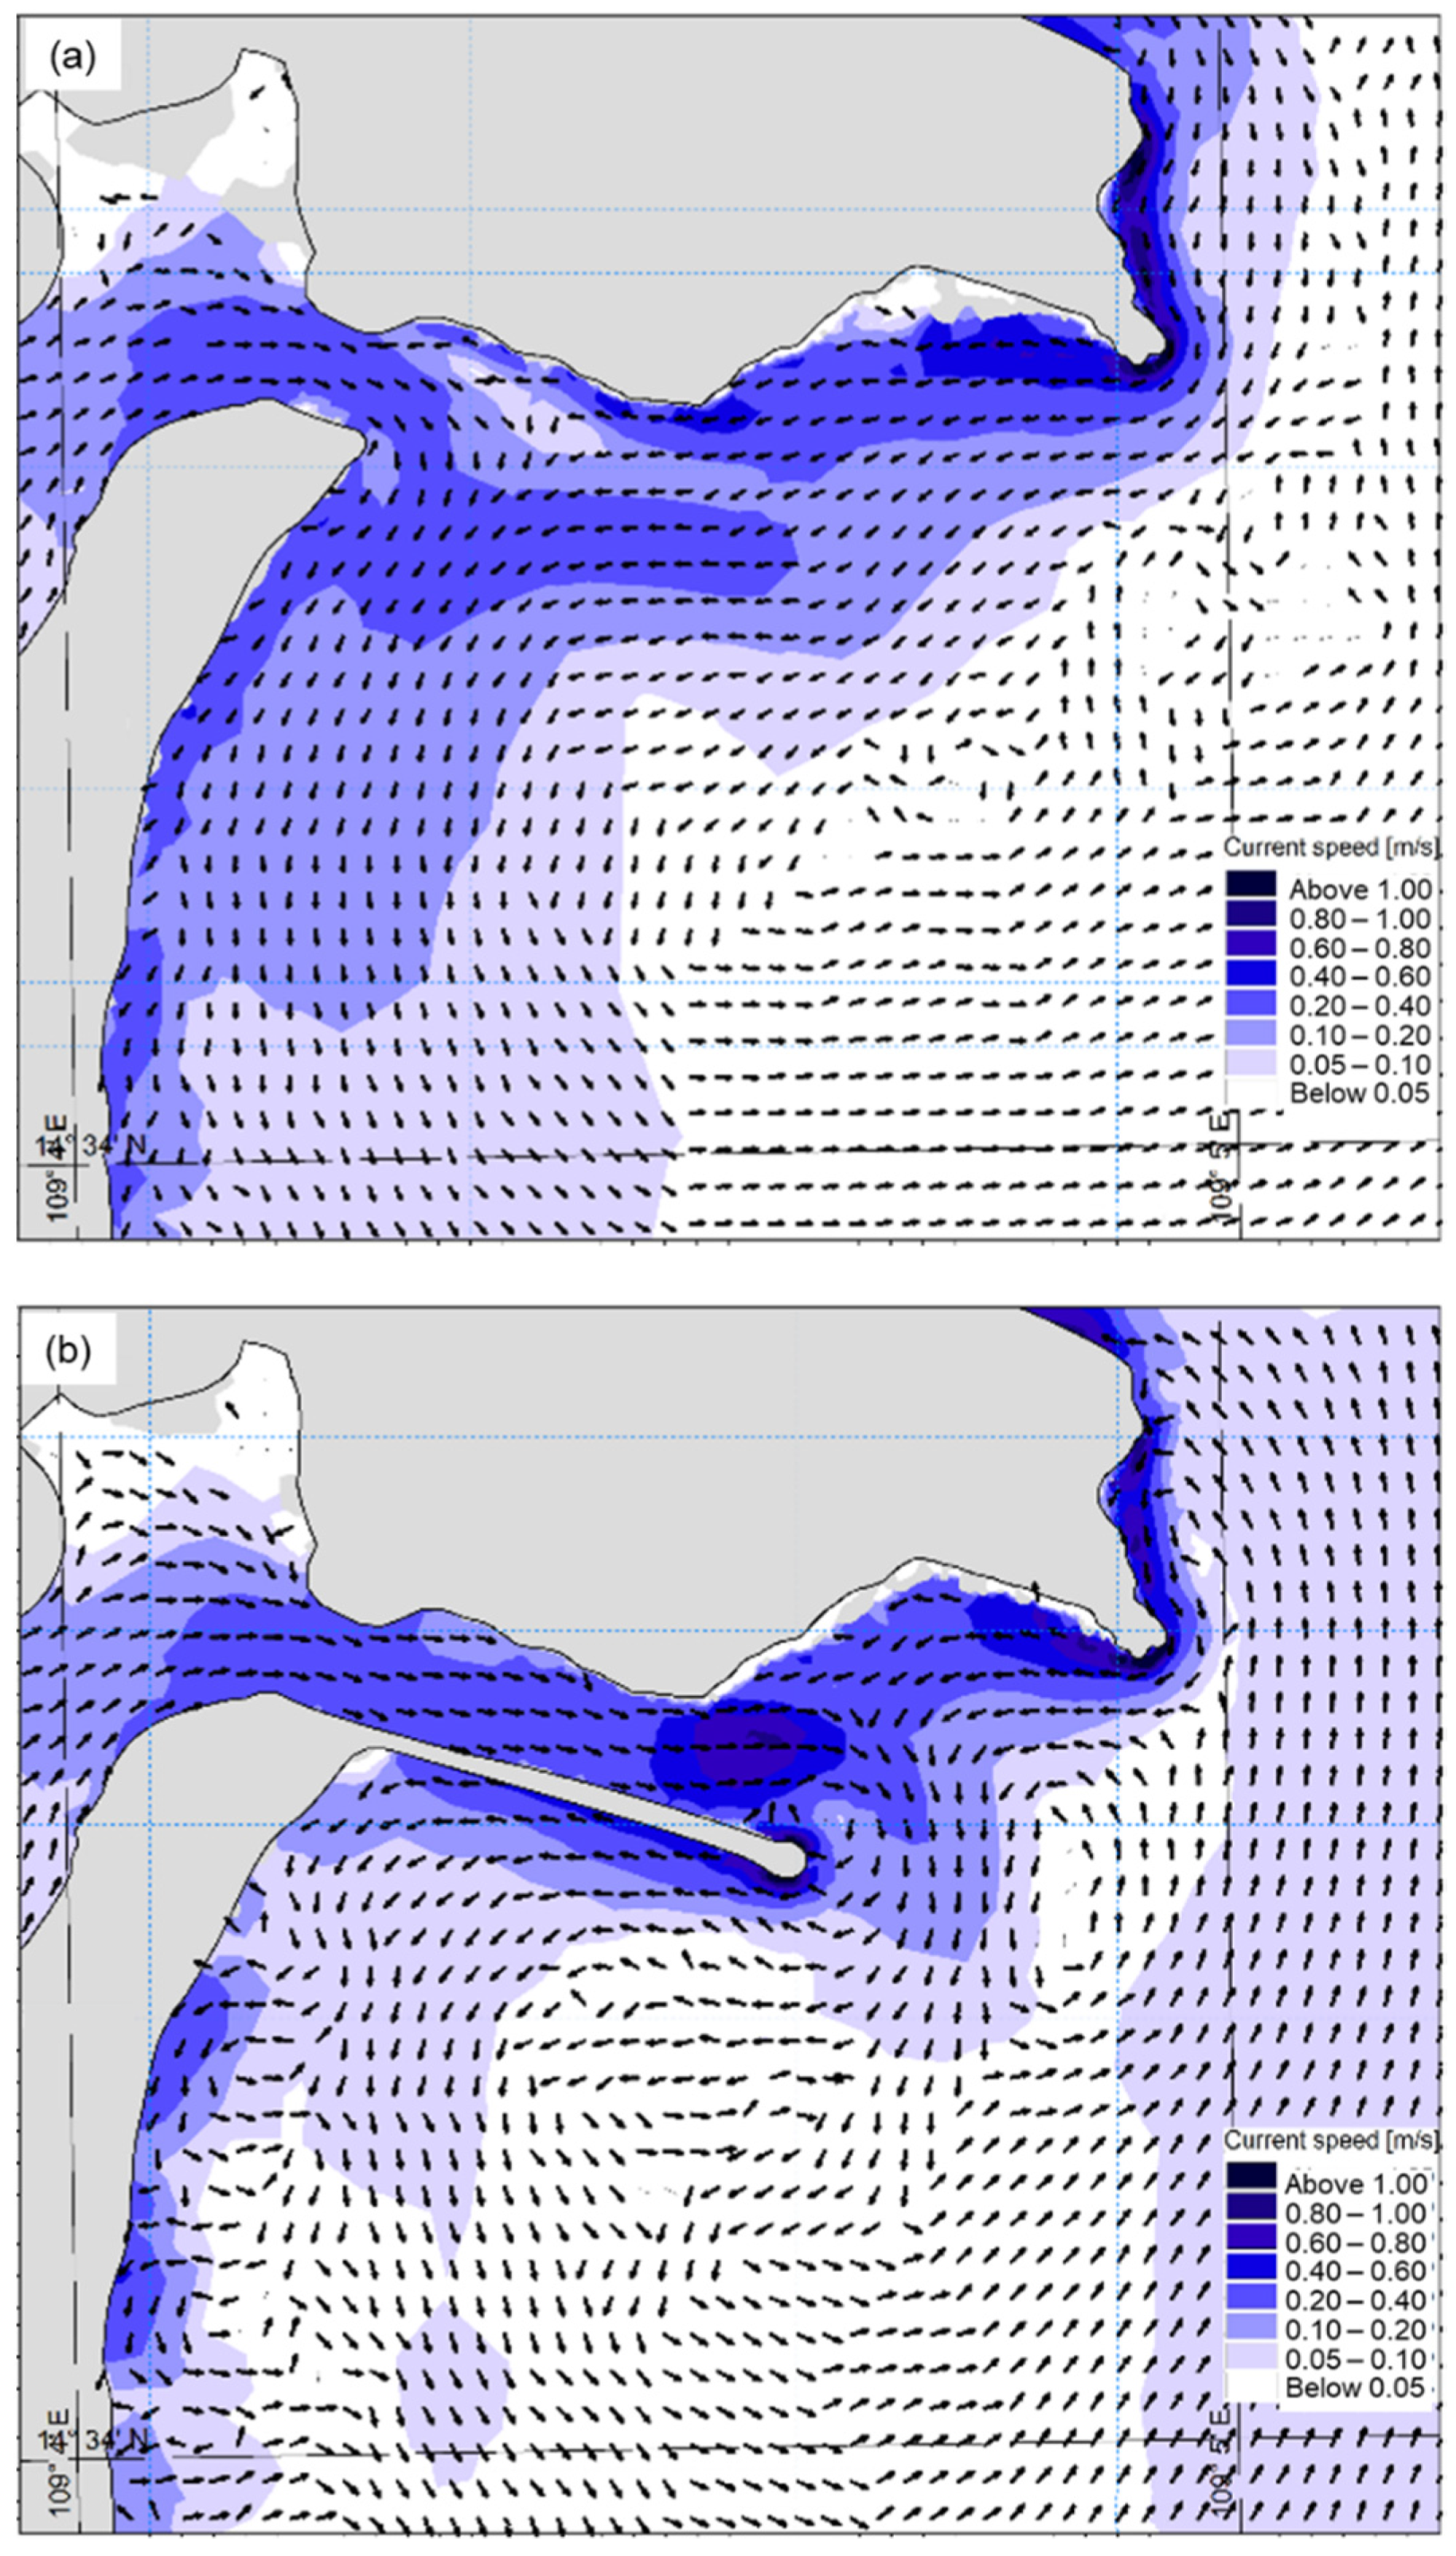
3.2.2. Current Regimes
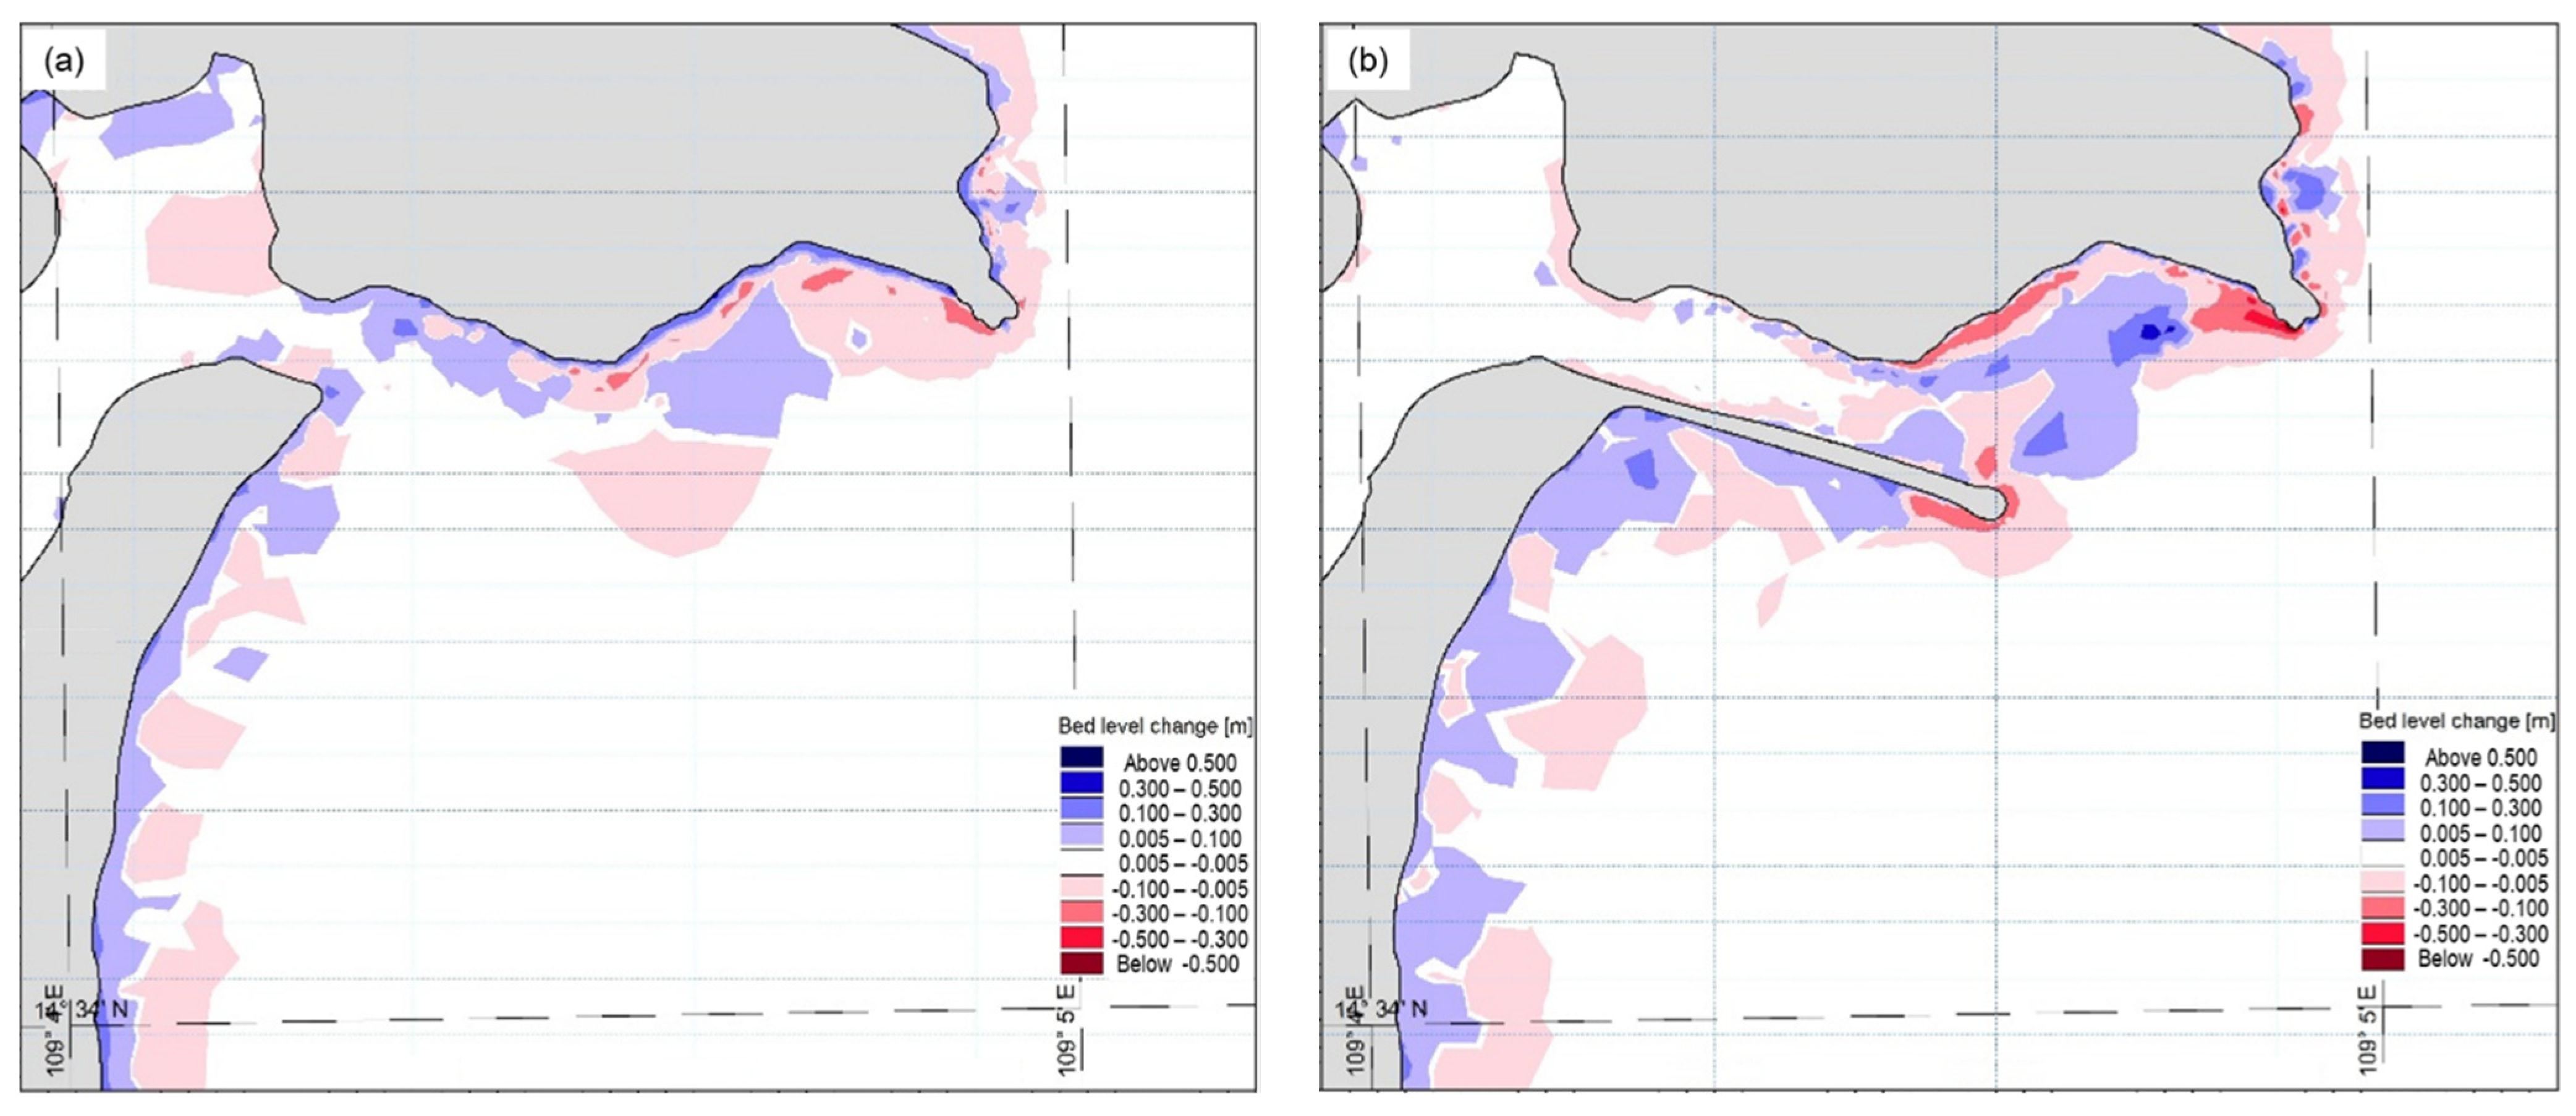
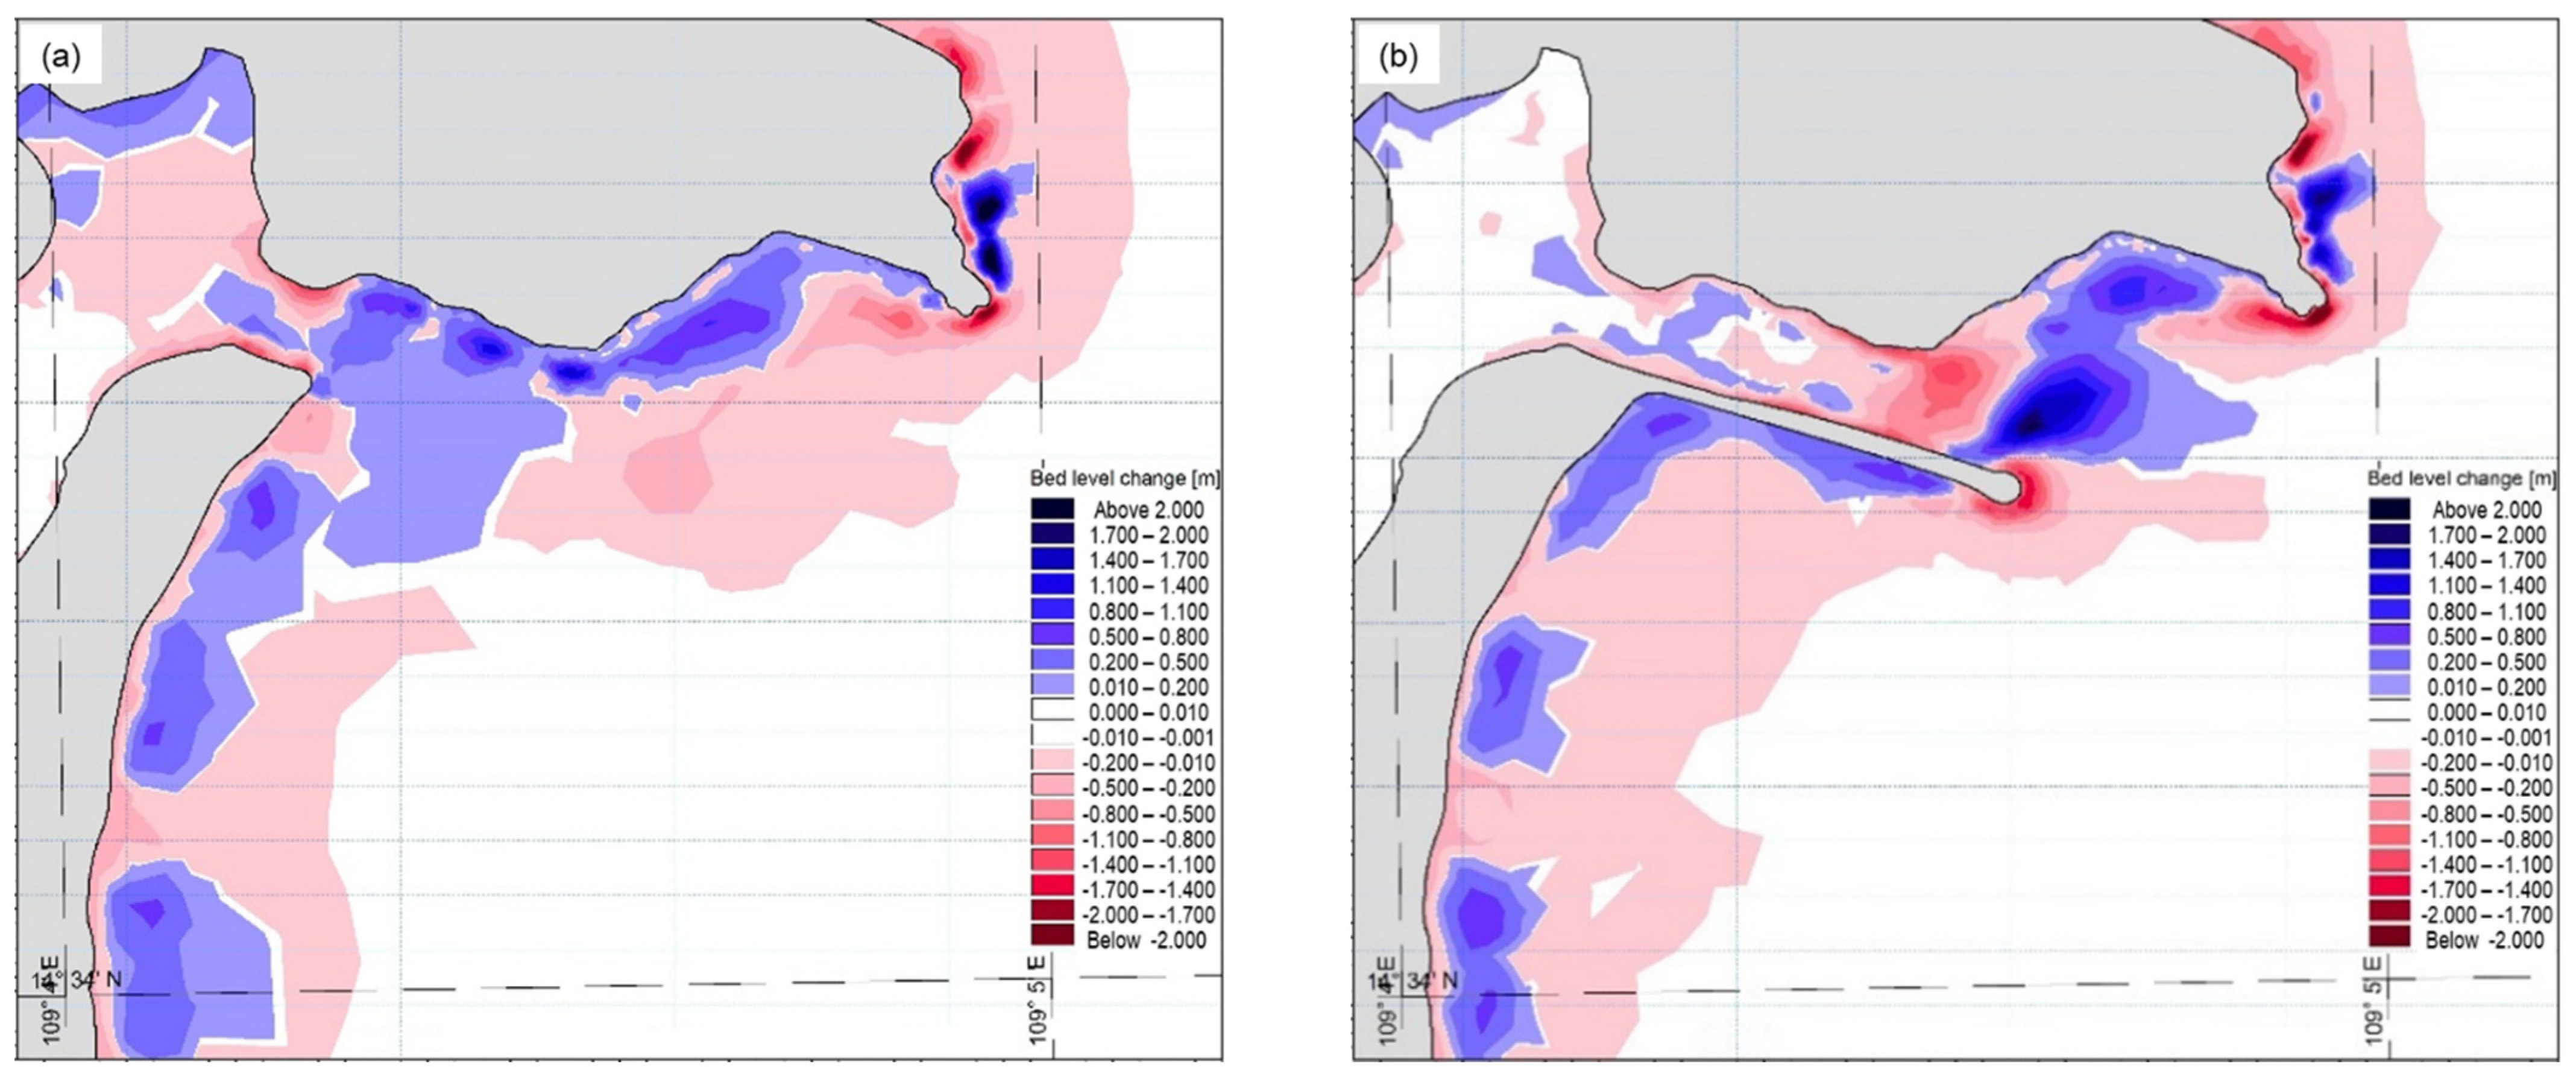
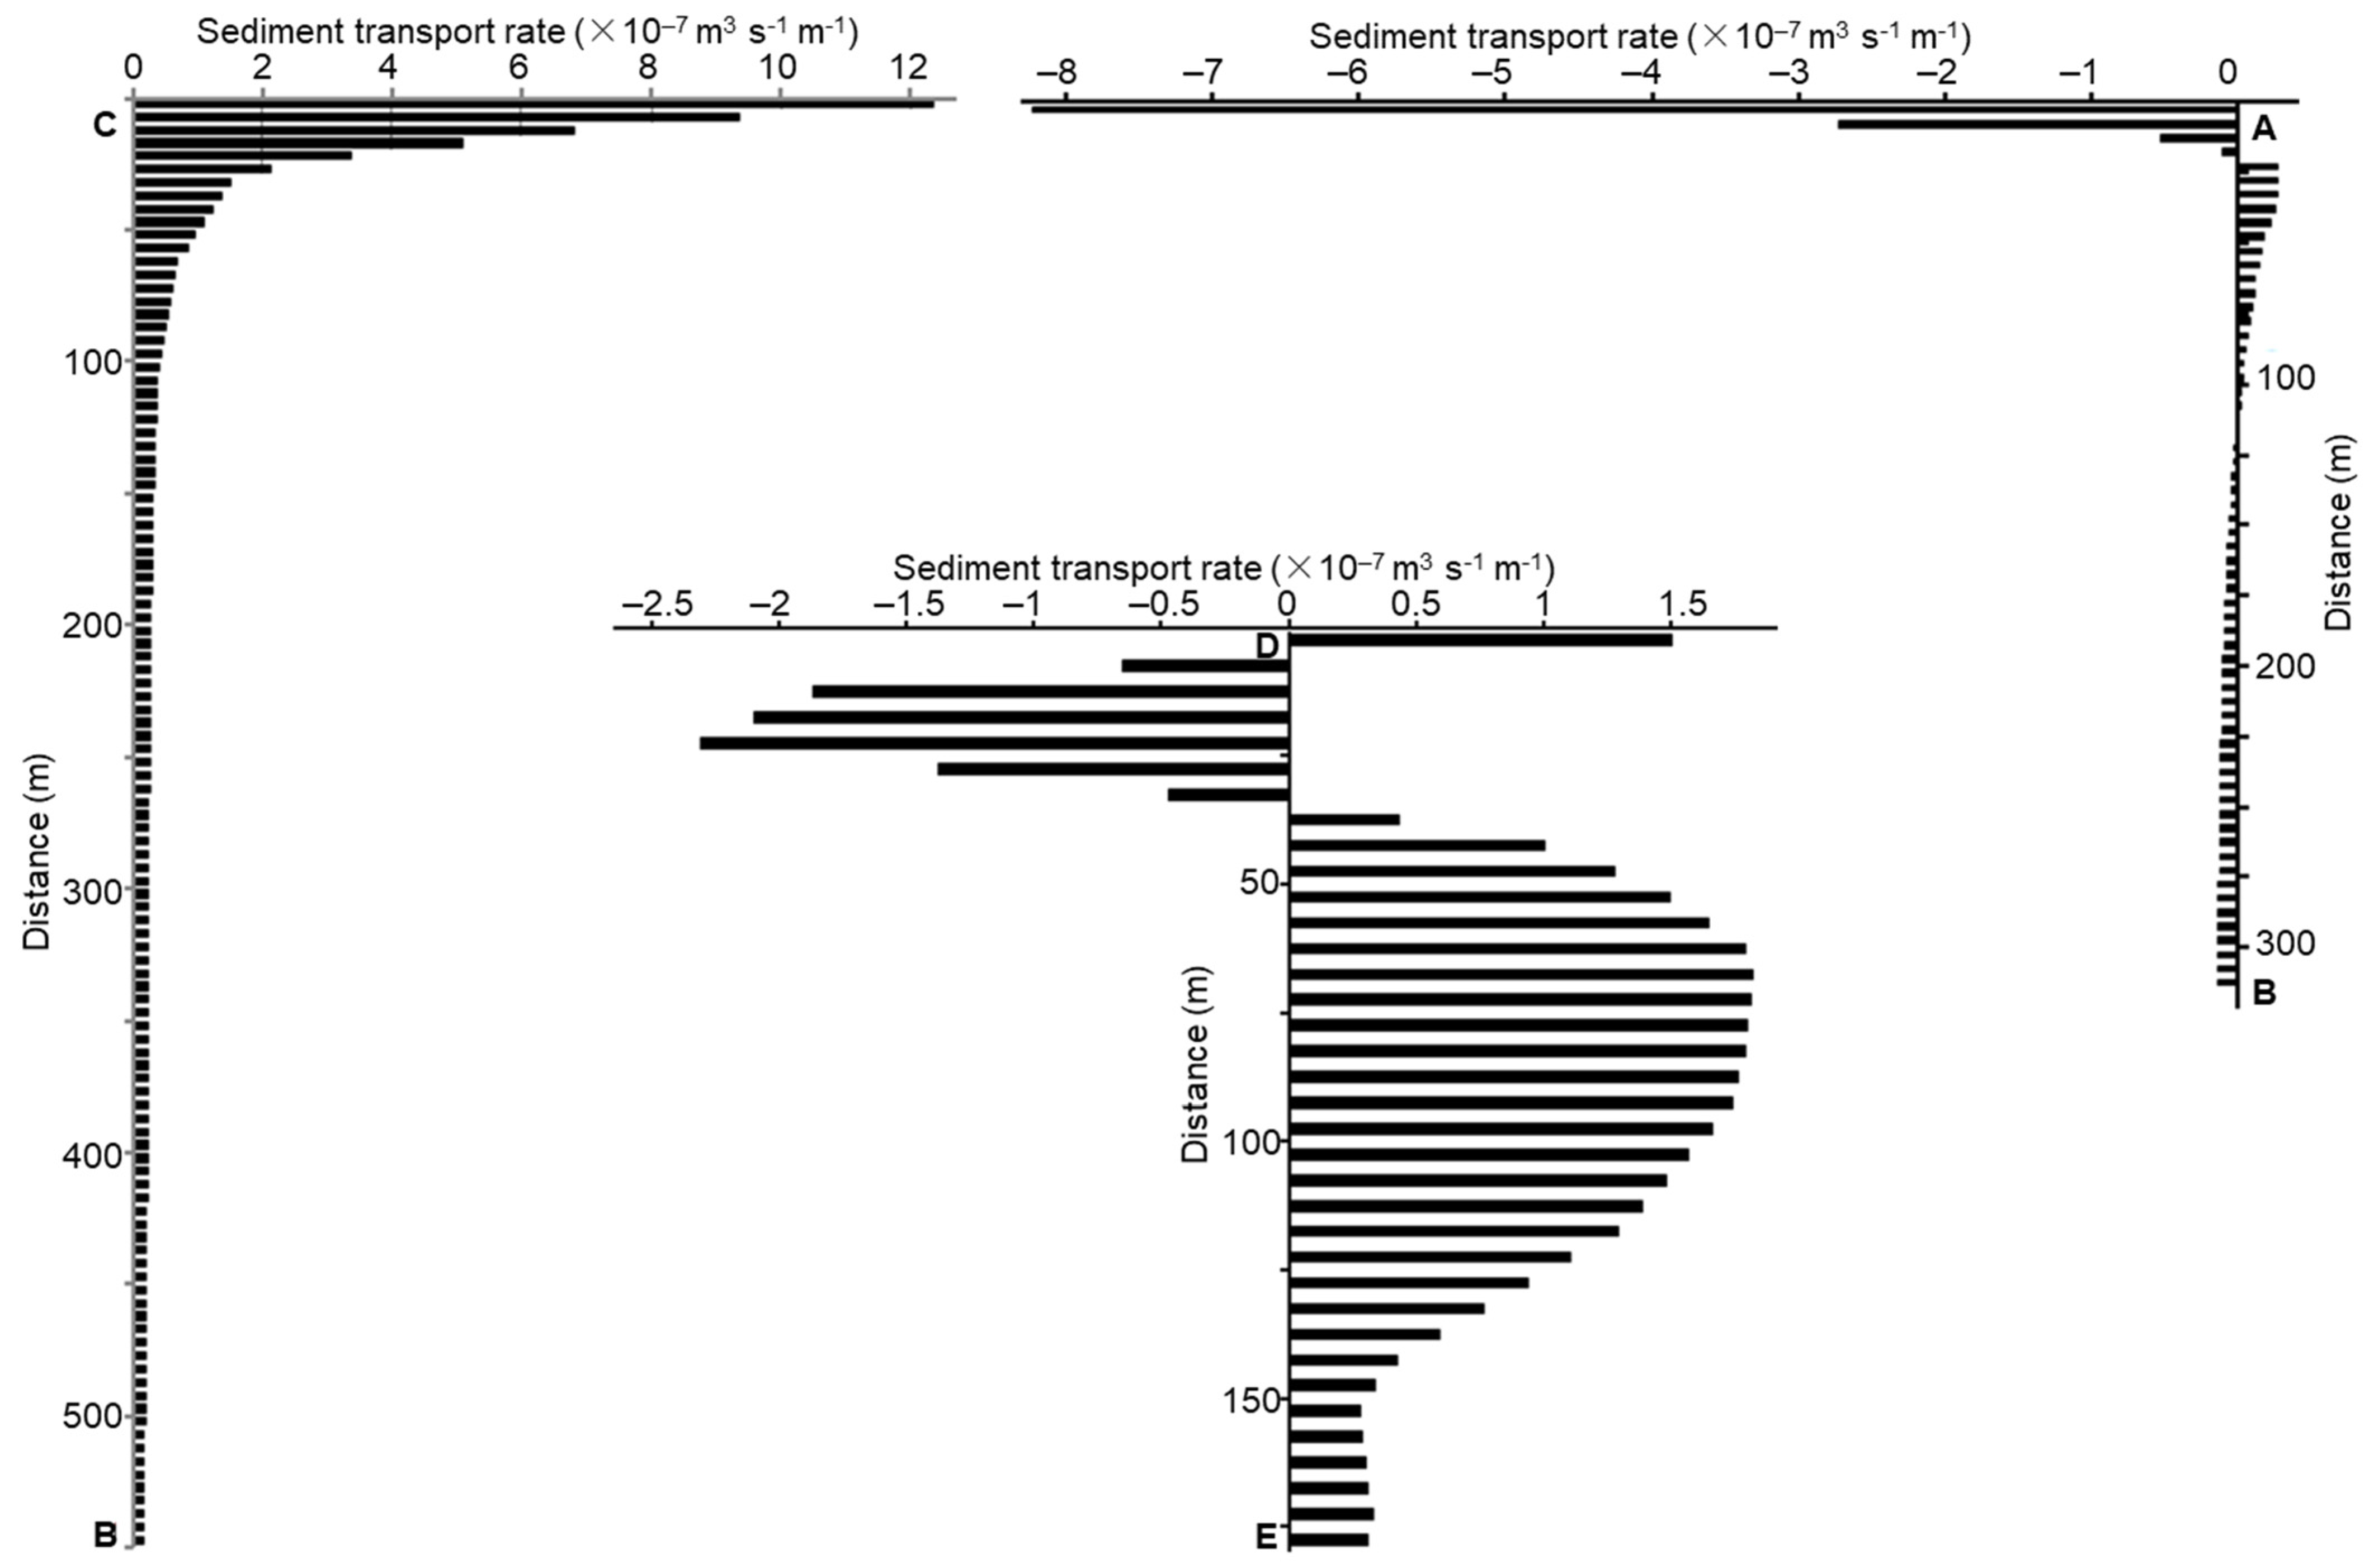
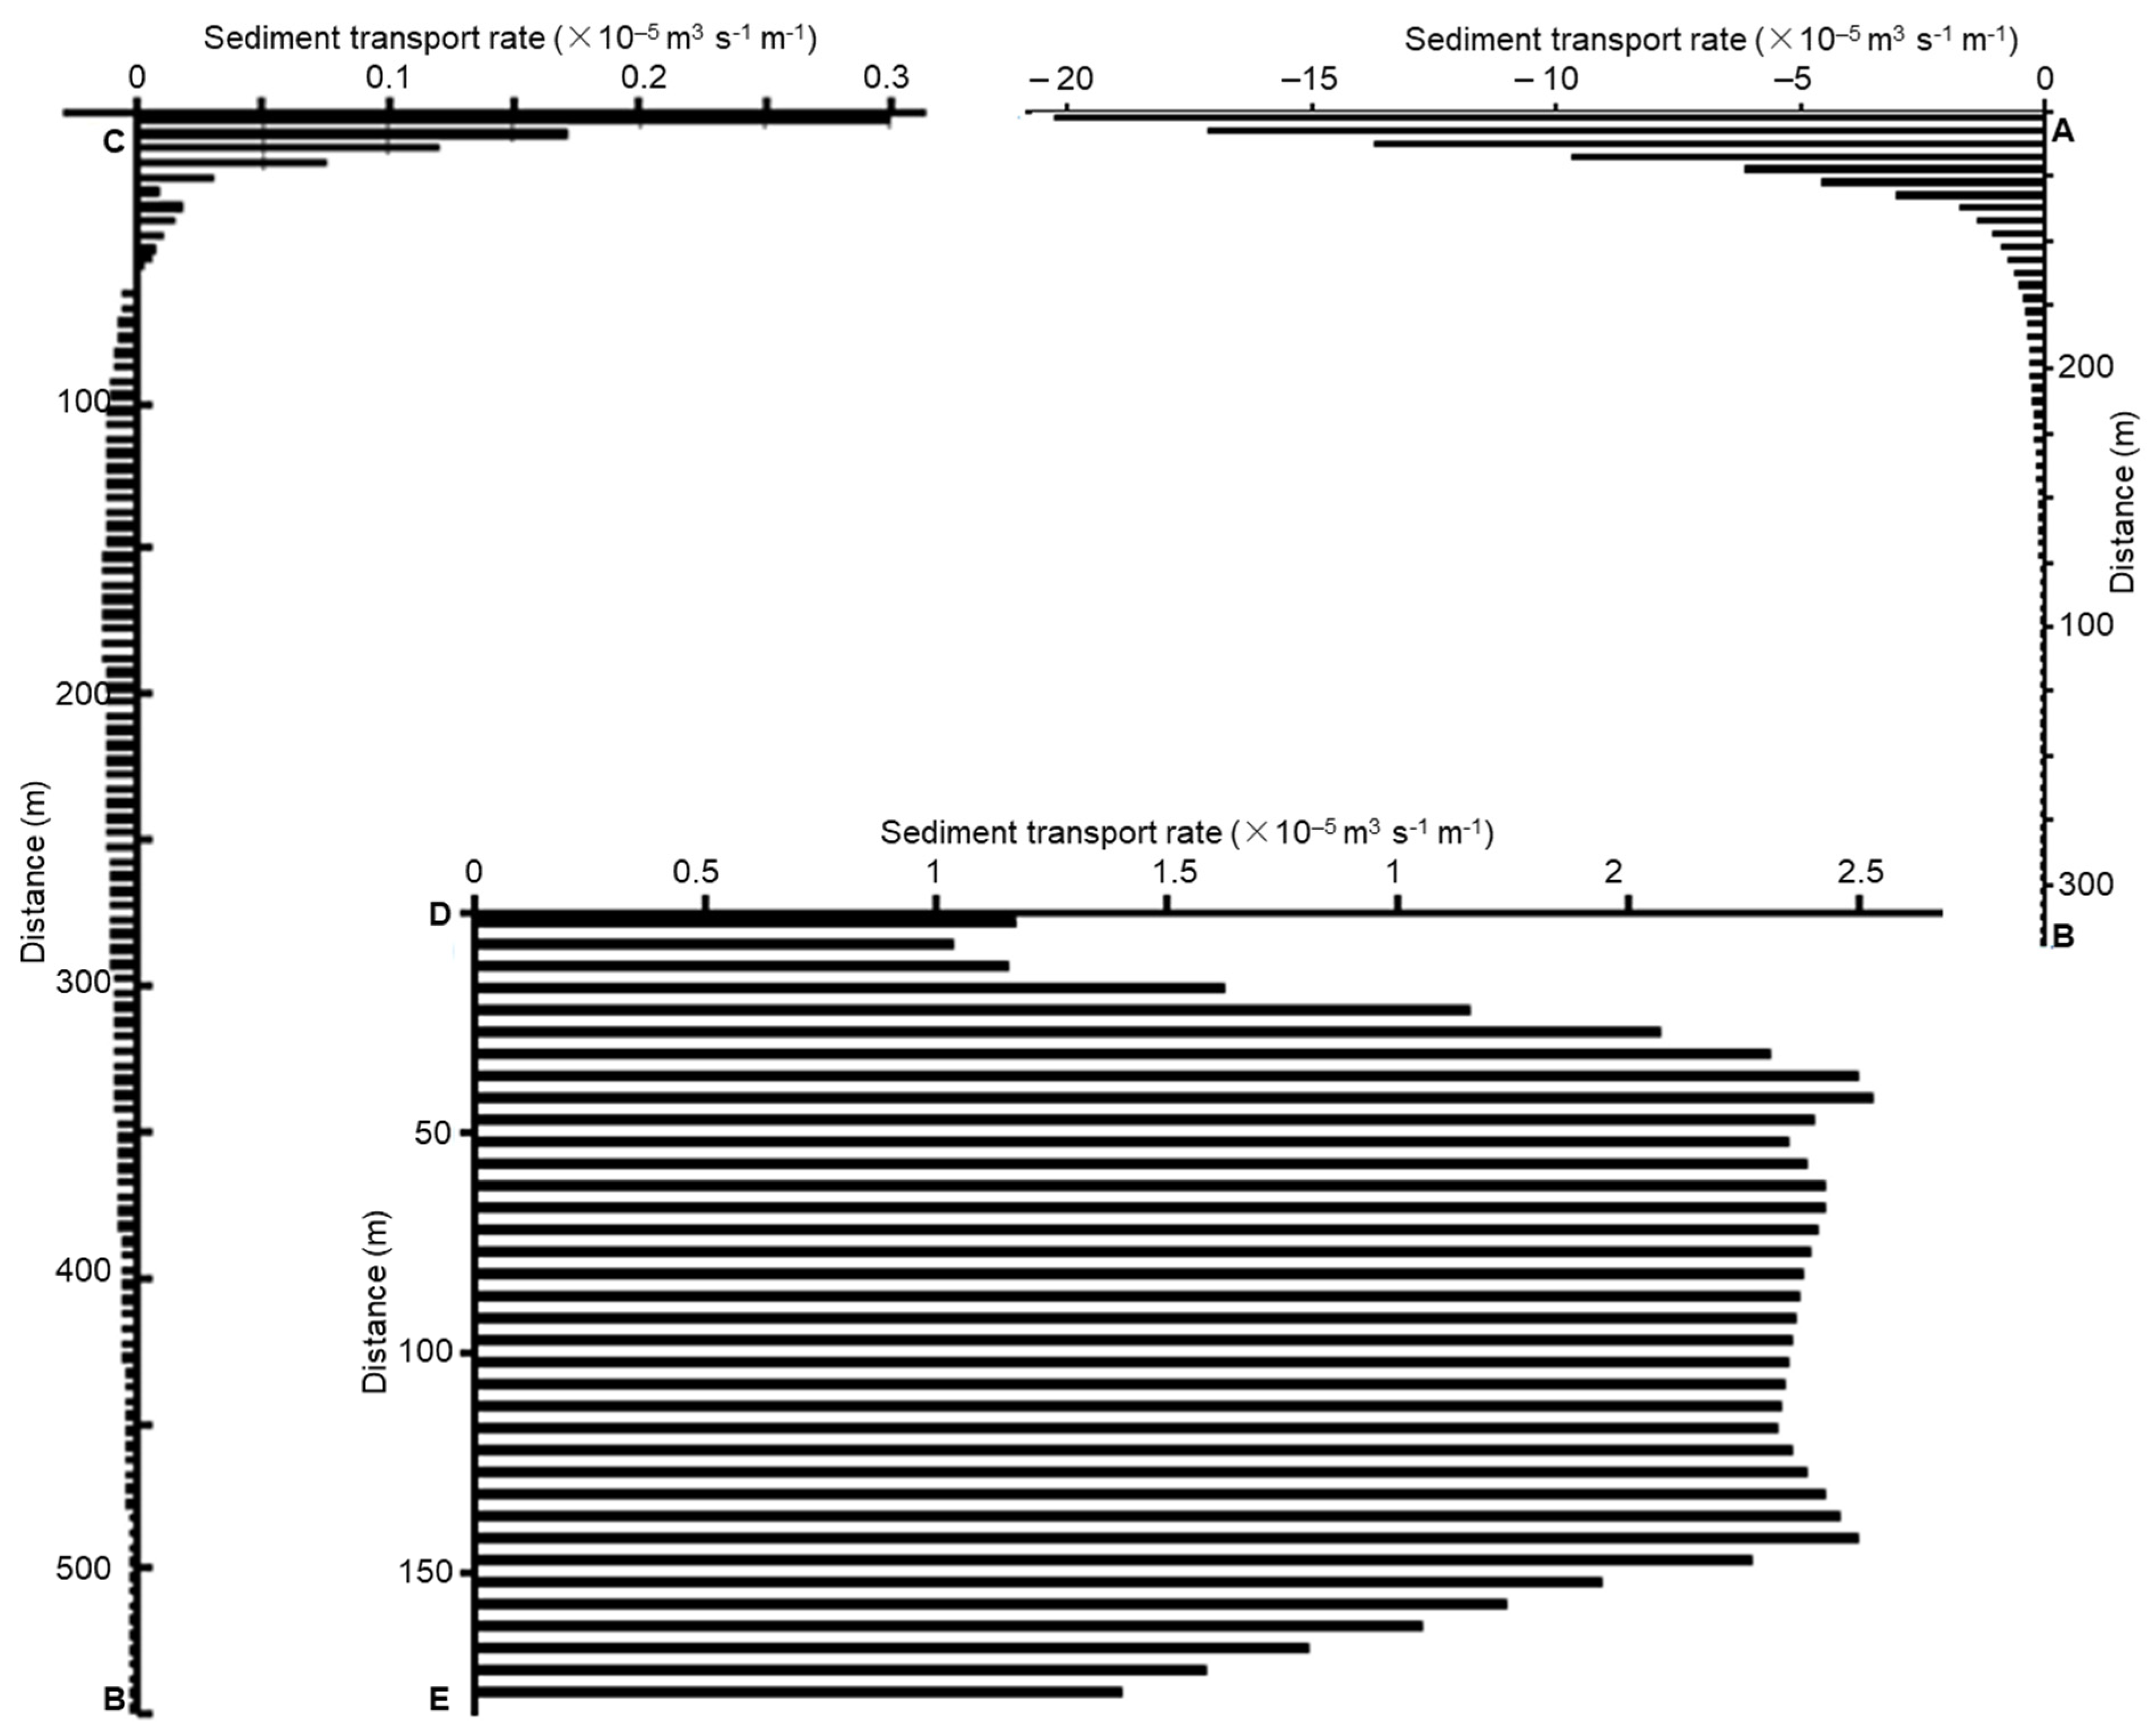
3.3. The Impact of the Jetty on the Movement of the Bottom Sediments
4. Discussions
4.1. Sinks and Sources of Sediment
4.2. Cause of Erosion-Deposition in Small Estuaries and Their Impacts on Socio-Economic Development
5. Conclusions
Author Contributions
Funding
Institutional Review Board Statement
Informed Consent Statement
Acknowledgments
Conflicts of Interest
References
- Potter, I.C.; Chuwen, B.M.; Hoeksema, S.D.; Elliott, M. The concept of an estuary: A definition that incorporates systems which can become closed to the ocean and hypersaline. Estuar. Coast. Shelf Sci. 2010, 87, 497–500. [Google Scholar] [CrossRef]
- Wolanski, E.; Elliott, M. Estuarine Ecohydrology: An Introduction, 2nd ed.; Elsevier Science: Amsterdam, The Netherlands, 2015; p. 322. [Google Scholar]
- Ramesh, R.; Chen, Z.; Cummins, V.; Day, J.; D’Elia, C.; Dennison, B.; Forbes, D.L.; Glaeser, B.; Glaser, M.; Glavovic, B.; et al. Land–Ocean Interactions in the Coastal Zone: Past, present & future. Anthropocene 2015, 12, 85–98. [Google Scholar] [CrossRef] [Green Version]
- Day, J.W.; Agboola, J.; Chen, Z.; D’Elia, C.; Forbes, D.L.; Giosan, L.; Kemp, P.; Kuenzer, C.; Lane, R.R.; Ramachandran, R.; et al. Approaches to defining deltaic sustainability in the 21st century. Estuar. Coast. Shelf Sci. 2016, 183, 275–291. [Google Scholar] [CrossRef]
- Howarth, R.; Chan, F.; Conley, D.J.; Garnier, J.; Doney, S.C.; Marino, R.; Billen, G. Coupled biogeochemical cycles: Eutrophication and hypoxia in temperate estuaries and coastal marine ecosystems. Front. Ecol. Environ. 2011, 9, 18–26. [Google Scholar] [CrossRef] [Green Version]
- Crossland, C.J.; Kremer, H.H.; Lindeboom, H.J.; Crossland, J.I.M.; Tissier, M.D.A.L. Coastal Fluxes in the Anthropocene. The Land-Ocean Interactions in the Coastal Zone Project of the International Geosphere–Biosphere Programme; Springer: Berlin/Heidelberg, Germany, 2005. [Google Scholar]
- Walling, D.E. Human impact on land–ocean sediment transfer by the world’s rivers. Geomorphology 2006, 79, 192–216. [Google Scholar] [CrossRef]
- Anthony, E.J.; Brunier, G.; Besset, M.; Goichot, M.; Dussouillez, P.; Nguyen, V.L. Linking rapid erosion of the Mekong River delta to human activities. Sci. Rep. 2015, 5, 14745. [Google Scholar] [CrossRef] [PubMed] [Green Version]
- Postma, H. Sediment transport and sedimentation in the estuarine environment. In Estuaries; Lauff, G.H., Ed.; American Association Advanced Scientific Publication: Washington, DC, USA, 1967; pp. 158–179. [Google Scholar]
- Greening, H.; Doering, P.; Catherine, C. Hurricane Impacts on Coastal Ecosystems. Estuaries Coasts 2006, 29, 877–879. [Google Scholar] [CrossRef]
- Farfán, L.M.; D’Sa, E.J.; Liu, K.-B.; Rivera-Monroy, V.H. Tropical Cyclone Impacts on Coastal Regions: The Case of the Yucatán and the Baja California Peninsulas, Mexico. Estuaries Coasts 2014, 37, 1388–1402. [Google Scholar] [CrossRef]
- Binh, D.V.; Kantoush, S.; Sumi, T. Changes to long-term discharge and sediment loads in the Vietnamese Mekong Delta caused by upstream dams. Geomorphology 2020, 353, 107011. [Google Scholar] [CrossRef]
- Tamura, T.; Nguyen, V.L.; Ta, T.K.O.; Bateman, M.D.; Gugliotta, M.; Anthony, E.J.; Nakashima, R.; Saito, Y. Long-term sediment decline causes ongoing shrinkage of the Mekong megadelta, Vietnam. Sci. Rep. 2020, 10, 8085. [Google Scholar] [CrossRef] [PubMed]
- Nielsen, A.F.; Gordon, A.D. Long Term Impacts of Jetties and Training Walls on Estuarine Hydraulics and Ecologies. In Coastal Wetlands: Alteration and Remediation; Finkl, C.W., Makowski, C., Eds.; Springer Nature: Cham, Switzerland, 2017; pp. 317–355. [Google Scholar]
- Hsieh, T.-C.; Ding, Y.; Yeh, K.-C.; Jhong, R.-K. Investigation of Morphological Changes in the Tamsui River Estuary Using an Integrated Coastal and Estuarine Processes Model. Water 2020, 12, 1084. [Google Scholar] [CrossRef]
- Long, B.H.; Thu, P.M.; An, N.T.; Luc, N.V.; Mau, L.D. A Handbook on Natural Conditions, Ecology-Environment, Economy, Society and Integrated Coastal Zone Management in the South Centre Regions. II. Scientific Basis for Sustainable Development and Integrated Coastal Zone Management in the South Centre Regions; Natural Science and Technology Publishing House: Ha Noi, Vietnam, 2011; p. 135. [Google Scholar]
- Ahmed, Z.; Tran, T.N.D.; Nguyen, Q.B. Applying semi distribution hydrological model SWAT to assess hydrological regime in Lai Giang catchment, Binh Dinh Province, Vietnam. In Proceedings of the 2nd Conference on Sustainability in Civil Engineering (CSCE’20), Capital University of Science and Technology, Islamabad, Pakistan, 12 August 2020; p. 8. [Google Scholar]
- Long, B.H.; Hoan, P.S.; Binh, T.V.; Thu, P.M. Ability of beach nourishment for northwest coast of Nha Trang bay. Vietnam. J. Mar. Sci. Technol. 2021, in press. [Google Scholar]
- Trung, P.B.; Mau, L.D.; Trinh, L.P. The problem of deposition at sa huynh (Quang Ngai province), Tam Quan and De Gi (Binh Dinh province) by impact assessment of tidal inlet protection structures. Vietnam. J. Mar. Sci. Technol. 2010, 10, 1–13. [Google Scholar] [CrossRef]
- Sao, N.T.; Kha, D.D.; Anh, T.N. Analysis of Channel Filling in Tam Quan–Binh Dinh. VNU J. Sci. Nat. Sci. Technol. 2014, 30, 65–70, (In Vietnamese with English abstract). [Google Scholar]
- Dũng, T.Đ. Approving the Construction Master Plan of Binh Dinh Province to 2035; Desicion No. 1672/QĐ-TTg; Prime Minister Vietnam: Ha Noi, Vietnam, 2018. [Google Scholar]
- VITIC. Construction Plan of Binh Dinh Province Region to 2035. Available online: http://asemconnectvietnam.gov.vn/default.aspx?ZID1=14&ID8=85693&ID1=2 (accessed on 1 June 2021).
- Hien, T. Developing Hoai Nhon on the Basis of Potential Strengths, Especially the Marine Economy. Available online: http://www.baobinhdinh.com.vn/viewer.aspx?macm=5&macmp=5&mabb=71187 (accessed on 1 June 2021).
- Long, B.H.; Tuan, V.S.; An, N.T.; Thu, P.M. Characteristics of Nature, Environment, Resources and Orientation to Exploit for Sustainable Development of Coastal Waters of the South-Central Region; Publishing House for Science and Technology: Ha Noi, Vietnam, 2016; p. 293. [Google Scholar]
- DHI. MIKE 21 & MIKE 3 Flow Model FM. Hydrodynamic and Mud Transport Module; DHI: Horsholm, Denmark, 2017. [Google Scholar]
- Davidson-Arnott, R.; Bauer, B.; Houser, C. Introduction to Coastal Processes and Geomorphology, 2nd ed.; Cambridge University Press: Cambridge, UK, 2019; p. 441. [Google Scholar]
- Greenwood, B. Sediment transport by waves. In Sedimentology; Springer: Berlin/Heidelberg, Germany, 1978; pp. 1016–1028. [Google Scholar] [CrossRef]
- Miles, J. Wave shape effects on sediment transport. J. Coast. Res. 2013, 65, 1803–1808. [Google Scholar] [CrossRef]
- Soulsby, R. Dynamics of Marine Sands: A Manual for Practical Applications; Thomas Telford: New York, NY, USA; Tokyo, Japan, 1997; p. 249. [Google Scholar]
- Wiberg, P.L. Wave-Current Interaction. In Encyclopedia of Coastal Science; Schwartz, M.L., Ed.; Springer: Dordrecht, The Netherlands, 2005; pp. 1052–1053. [Google Scholar] [CrossRef]
- Van Rijn, L.C. Principles of Sediment Transport in Rivers, Estuaries and Coastal Seas, 2nd ed.; Aqua Publications: Amsterdam, The Netherlands, 2006. [Google Scholar]
- Liu, J.; Zhou, Z.; Yan, Z.; Gong, J.; Jia, Y.; Xu, C.-Y.; Wang, H. A new approach to separating the impacts of climate change and multiple human activities on water cycle processes based on a distributed hydrological model. J. Hydrol. 2019, 578, 124096. [Google Scholar] [CrossRef]
- Syvitski, J.P.M.; Vörösmarty, C.J.; Kettner, A.J.; Green, P. Impact of Humans on the Flux of Terrestrial Sediment to the Global Coastal Ocean. Science 2005, 308, 376–380. [Google Scholar] [CrossRef] [PubMed]
- Walling, D.E.; Fang, D. Recent trends in the suspended sediment loads of the world’s rivers. Glob. Planet. Chang. 2003, 39, 111–126. [Google Scholar] [CrossRef]
- Issaka, S.; Ashraf, M.A. Impact of soil erosion and degradation on water quality: A review. Geol. Ecol. Landsc. 2017, 1, 1–11. [Google Scholar] [CrossRef] [Green Version]
- Wilson, G.V.; Cullum, R.F.; Römkens, M.J.M. Ephemeral gully erosion by preferential flow through a discontinuous soil-pipe. CATENA 2008, 73, 98–106. [Google Scholar] [CrossRef]


| Figure | Factor | Southwest Monsoon | Northeast Monsoon |
|---|---|---|---|
| Wind condition | Direction | S–SE | N-NE |
| Velocity (m s−1) [range(mean)] | 2–8 (4.5) | 6–14 (10.6). | |
| Waves | |||
| Offshore | Direction | NW | SW |
| Maximum height (m) | 0.6–0.7 | 0.7–2.2 | |
| Southern coast | Direction | SW, change in channel | W change to SW |
| Maximum height (m) | 0.4–0.5 | 0.4–1.1 | |
| Areas | Factor | Southwest Monsoon | Northeast Monsoon | ||
|---|---|---|---|---|---|
| Without Jetty | With Jetty | Without Jetty | With Jetty | ||
| Strong flood tide | |||||
| North coast | Direction | S | S | S | S |
| Current velocity (m s−1) | 0.05–0.53 | 0.05–0.62 | 0.25–1.48 | 0.25–1.48 | |
| South coast | Direction | Complex | Complex | S | W to S |
| Current velocity (m s−1) | Mean: 0.10 Max: 0.29 | Mean: 0.10 Max: 0.24 | Mean: 0.23 Max: 0.42 | Mean: 0.19 Max: 0.44 | |
| River mouth/channel | Direction | NW | W and NW | E, Clockwise | S |
| Current velocity (m s−1) | 0.10–0.38 | 0.12–0.32 | Mean: 0.16 Max: 0.31 | Mean: 0.16 Max: 0.30 | |
| Strong ebb tide | |||||
| North coast | Direction | N | N | N, Nearby coast: S | N |
| Current velocity (m s−1) | ≥0.05 | ≥0.05 | 0.15–2.31 | 0.15–1.87 | |
| South coast | Direction | Complex Mainly: N | Complex Anticlockwise | NE | Complex |
| Current velocity (m s−1) | 0.05–0.14 | 0.05–0.14 | 0.15–0.52 | 0.15–0.45 | |
| River mouth/channel | Direction | E to SE Clockwise eddy | SE to E | E to SE | E |
| Current velocity (m s−1) | Mean: 0.17 Max: 0.27 | Mean: 0.18 Max: 0.41 | Mean: 0.22 Max: 0.45 | Mean: 0.23 Max: 0.89 | |
Publisher’s Note: MDPI stays neutral with regard to jurisdictional claims in published maps and institutional affiliations. |
© 2021 by the authors. Licensee MDPI, Basel, Switzerland. This article is an open access article distributed under the terms and conditions of the Creative Commons Attribution (CC BY) license (https://creativecommons.org/licenses/by/4.0/).
Share and Cite
Anh, V.T.; Trung, P.B.; Nguyen, K.-A.; Liou, Y.-A.; Phan, M.-T. Human Impacts on Estuarine Erosion-Deposition in Southern Central Vietnam: Observation and Hydrodynamic Simulation. Sustainability 2021, 13, 8303. https://doi.org/10.3390/su13158303
Anh VT, Trung PB, Nguyen K-A, Liou Y-A, Phan M-T. Human Impacts on Estuarine Erosion-Deposition in Southern Central Vietnam: Observation and Hydrodynamic Simulation. Sustainability. 2021; 13(15):8303. https://doi.org/10.3390/su13158303
Chicago/Turabian StyleAnh, Vu Tuan, Pham Ba Trung, Kim-Anh Nguyen, Yuei-An Liou, and Minh-Thu Phan. 2021. "Human Impacts on Estuarine Erosion-Deposition in Southern Central Vietnam: Observation and Hydrodynamic Simulation" Sustainability 13, no. 15: 8303. https://doi.org/10.3390/su13158303
APA StyleAnh, V. T., Trung, P. B., Nguyen, K.-A., Liou, Y.-A., & Phan, M.-T. (2021). Human Impacts on Estuarine Erosion-Deposition in Southern Central Vietnam: Observation and Hydrodynamic Simulation. Sustainability, 13(15), 8303. https://doi.org/10.3390/su13158303