Abstract
The security of cultivated land resources is closely related to a country’s food security, economic security and social security, and as such is always the top priority of those responsible for the governance and administration of state affairs. The study area is 13 prefecture-level cities in Hubei Province. An entropy weight method, comprehensive index method, spatial analysis and obstacle degree model are employed to explore the spatio-temporal characteristics and obstacle factors of cultivated land resources in quantity, quality and ecological security. The study shows that (1) the security level of cultivated land resources in Hubei Province showed an upward trend between 2010 and 2019. The land resources’ quality and ecological security showed an upward trend, while quantity security showed a downward trend. (2) The security of cultivated land resources presents obvious spatial differences, generally showing a decreasing trend from west to east. Among them, quantity security presents a spatial pattern of being high in the central, low in the east and lower in the west of Hubei Province. Quality security presents a spatial pattern of being high in the central region and low in the east and west. Ecological security presents a spatial pattern of being high in the west and low in the east. (3) The main obstacles to its security in quantity, in quality and in ecology are obviously different. Finally, some countermeasures are put forward to ensure the security of cultivated land resources from the perspectives of quantity, quality and ecological security, and to assist with the implementation of different protection policies in the western, central and eastern areas of Hubei. This study expands the content and perspective of cultivated land resources security and has a certain novelty in the selection of the index of water resources per unit of land area, and the application of the obstacle degree model expands the research on the influencing factors of cultivated land resource security.
1. Introduction
Food security is the basis of national security, and the most basic condition for achieving food security is guaranteeing basic self-sufficiency in food. Cultivated land resources are the foundation of self-sufficiency in food [1,2]. Xi Jinping, the General Secretary of the Communist Party of China’s Central Committee, stressed that China’s rice bowls should mainly contain Chinese grain, and cultivated land is the lifeblood of food production. As such, cultivated land should be protected in the same way that pandas are protected, and the country should strictly guard and defend the red line of the 1.8 billion mu of cultivated land. That land provides the basic requirements of cultivated land resources. The state has already issued a series of policies to protect the cultivated land, in view of the cultivated land loss problem in the urbanization process. However, the implementation effect of these policies has not had the expected effects. In particular, the rapid development of China’s economy, the acceleration of urbanization, the decrease in the amount and quality of cultivated land, the ecological deterioration [3,4,5] and the problem of food security have aroused extensive attention, both at home and abroad [6,7,8]. L Brown even posed the question “Who will feed China?” It was in this context that the idea of the security of cultivated land resources was put forward [9], a topic that gradually became the focus of the government and academia [10]. Very few studies directly examine the security of cultivated land resources (SCLR) in foreign countries. Similar studies have mainly focused on food security [11,12,13], sustainable agricultural development in developing countries and regions [14], as well as the changing amount of cultivated land under the background of land-use and land-cover change [15,16,17]. Other studies have analyzed the driving forces of land use change and cultivated land change [18,19,20], sustainable soil management [21], as well as the protection of agricultural land [22,23,24]. These studies have shown that land occupation is an important threat to food security in the EU. In India, the mismatch between water supply and agricultural water demand is the real cause of food insecurity. The security of cultivated land quantity all over the world has been affected by war, the economy and policies. Biophysical and socio-economic proximity have been the main influencing factors of cultivated land change, and population density has been negatively correlated with cultivated land expansion. Zoning and differential taxes are commonly used to regulate the loss of farmland in urban development. However, zoning by itself does not seem to be sufficient to protect cultivated land; zoning needs to be implemented in conjunction with other policies, such as improving land prices. At the same time, there is a necessity to study land quality, the ecological sustainable development of land use and the growing problem of environmental degradation in agricultural areas [25]. The European Commission has taken a number of measures and actions to protect soil including a 50% reduction in the use of chemical pesticides, a 20% reduction in fertilizer use plus a decrease of nutrient losses by at least 50%, a minimum of 30% of the EU’s land area as protected areas, a limit on urban sprawl, a reduction in the pesticides risk, 25% of the EU’s agricultural land put forward as organically farmed and a reduction in land degradation and planting [21]. These ambitious measures and targets can provide a reference for the selection of quality and quantity security indicators of cultivated land resources. Such studies would help to formulate more effective sustainable development policies.
With the declining amount of cultivated land in the urbanization process and the emergence of food security issues, domestic scholars’ research has focused on the evaluation of the SCLR and the influencing factors. The main contents of such studies are as follows: (1) The concept of SCLR. At present, no unified standard of the concept of SCLR has been formed. Most of SCLR is explained from the perspectives of natural attributes, such as the quantity, quality and ecology of cultivated land, as well as the social attributes, such as the guarantee of social and economic development. For example, Zhu Hongbo maintained that SCLR is the expansion and extension of the concept of cultivated land protection; SCLR is also a state in which the cultivated land resources owned by a region can guarantee the security of the regional cultivated land itself, as well as the region’s social and economic security, food security and ecological security [3]. Song Wei et al. believed that SCLR refers to the state and ability of cultivated land resources to guarantee the survival and development of human society and to promote the harmony and balance of an ecological system. This can only happen when a country’s or region’s cultivated land resources are effectively protected. That protection can be divided into the three aspects of quantity safety, quality safety and ecological safety [10]. (2) Regarding the evaluation of SCLR, previous research has focused on the two aspects of index system building and evaluation methods. The former mainly constructs theoretical frameworks from the connotation of SCLR, or establishes an evaluation index system reference to some model framework. The latter mainly includes an index system of quantity–quality–ecological security, resources–environment–economy–society, nature–economy–society–ecology, an evaluation system of pressure–status–response (PSR), etc. For example, Wang Fang et al. [26], Liu Shenghuan et al. [27] and Wu Yanfei et al. [28], respectively, established index systems to evaluate SCLR in suburban Guangzhou, Hubei and Anhui provinces from the perspectives of the quantity, quality and ecology of cultivated land. Kuang Lihua et al. constructed a cultivated land system security index system from the systematic perspective of the “trinity” of cultivated land quantity, quality and ecology [29]. Li Nan et al. evaluated the SCLR in Liaoning Province from a spatio-temporal scale perspective. The study selected the four major indexes of resource, environment, economy and society [30]. Song Ge et al. extended resources and environment into nature and ecology and constructed an SCLR evaluation index system from the four aspects of nature, economy, society and ecology [31]. Liu Xue et al. used a PSR framework to construct an evaluation index system of land resources security in Chongqing [32]. Ren Jiaqiang et al. used a PSR model to construct an evaluation index system for the SCLR in Liaoyang County, Liaoning Province [33]. Cai Yinying et al. used hidden danger, state and immunity models to construct an evaluation index system of cultivated land ecological security to analyze the ecological security of cultivated land resources in Jianghan Plain [34]. The evaluation methods of SCLR mainly include an analytic hierarchy process [4], an improved TOPSIS model [29], a comprehensive index method [10], an abrupt progression method [30], and a weighted comprehensive evaluation method [35]. Among the above, the comprehensive index method is the most widely used and the most mature. (3) Regarding the driving force of cultivated land resource security, the main driving factors behind quantity security are policy, economic development, non-agricultural construction and population growth [36,37,38,39]. The main factors that influence quantity security are the unused land area per capita, the area of supplementary cultivated land per capita, the area of cultivated land per capita, the protection awareness of cultivated land, etc. The factors that influence ecological security are obviously different, due to different levels of economic development [40,41].
In conclusion, scholars have conducted numerous studies on SCLR from different perspectives, and they have achieved fruitful results. This provides a foundation for further research on SCLR. However, the academic circle has not yet reached a consensus on the definition of SCLR, and the current SCLR evaluation index system does not have any broad and unified recognition standard. Most existing studies have evaluated SCLR based on the PSR model; many studies analyze single factors, such as quantity security [36,42], quality security [43,44] or ecology security [34,41]. Secondly, SCLR evaluation methods show a trend of diversification. The entropy weight method and analytic hierarchy process are more extensive in the weight calculation, but the entropy weight method is more objective. In terms of numerical calculation, the most widely used and mature method employed is the composite index method. In addition, China’s cultivated land resources have obvious differences in time and space. Therefore, it is necessary to explore the dynamic changes of SCLR from the perspectives of time and space, so as to provide a basis for the further improvement of cultivated land protection policies. China’s total grain output in 2019 was 6.64 × 10⁸ t, the highest output level in the country’s history. The proportion of grain output in the main food producing areas rose to 78.89%, and the contribution rate of grain increased to 93.91% [45]. Based on historical changes and growth trends, increasing China’s grain yield in the future will mainly depend on the main food producing areas [46]. As one of the main food-producing areas in China, Hubei Province has a reputation of “when two Hu (Hunan and Hubei) are ripe, China is sufficient”. SCLR is particularly important in Hubei. Therefore, the entropy weight method, the composite index method, the obstacle degree model and the spatial analysis method are employed to probe the spatio-temporal characteristics and obstacle factors of SCLR. The objective is to provide a certain reference in the choice of evaluation method. Meanwhile, with regard to the SCLR evaluation index system, this article added a “water resources per unit land area” indicator, according to the actual situation in Hubei Province, to construct a comprehensive evaluation index system that can provide a reference for further study of SCLR. This will also provide theoretical reference for differentiated policies that ensure SCLR in Hubei Province.
2. Study Area
Hubei Province, referred to as “E”, is run through by the Yangtze River and the Han River. Hubei is known as the “province of a thousand lakes” and “the land of fish and rice”. The provincial capital is Wuhan. Hubei is located in central China, adjacent to Anhui in the east, Chongqing in the west, Shaanxi in the northwest, Jiangxi and Hunan in the south and Henan in the north. Hubei is about 740 km long from east to west, and 470 km wide from north to south, with a total area of 185,900 square kilometers, or 1.94 percent of China’s total area. Within the province, mountains account for 56% of the total area, hills account for 24% and plains and lakes account for 20%. At present, the province has jurisdiction over 13 prefecture-level administrative regions, including 12 prefecture-level cities and one autonomous prefecture: Shiyan City, Yichang City, Enshi Tujia and Miao Minority Autonomous Prefecture (Enshi City), Xiangyang City, Jingmen City, Jingzhou City, Suizhou City, Wuhan City, Huangshi City, Ezhou City, Xiaogan City, Huanggang City and Xianning City (Figure 1). In addition, four county-level administrative units are directly under the province’s jurisdiction.
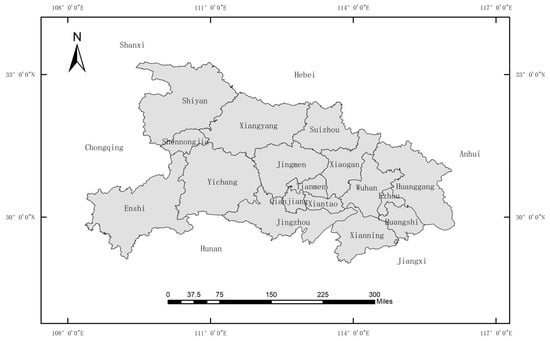
Figure 1.
The map of the study area.
By the end of 2018, the total cultivated land area was 5235 square kilometers, accounting for 3.66 percent of the total cultivated land in China. The province has designated 58.88 million mu of permanent basic farmland and 31.64 million mu of high-quality cultivated land; the latter accounts for 40 percent of the total cultivated land. Cultivated land per capita is 1.3 mu, which is lower than the national average level of 1.52 mu. Hubei is rich in water resources; lakes are mainly distributed in the Jianghan Plain. Currently, there are more than 700 lakes, with a total surface area of 2706.851 square kilometers. Lakes with a total surface area of more than 100 square kilometers include Honghu Lake, Changhu Lake, Liangzi Lake and Futou Lake. In 2019, the total population of Hubei Province was 59.27 million, of which 36.1547 million were urban residents, and 23.1553 million were rural. Hubei’s GDP was 4.582831 trillion yuan, up by 7.5% from the previous year. Urban residents’ and rural residents’ per capita disposable income were 37,601.3 yuan and 16,390.9 yuan, respectively. Hubei Province is one of the 13 main food-producing areas in China. The province’s grain output was 27.25 million tons in 2019, or 4.1% of the national grain output. Clearly, Hubei plays an important role in ensuring China’s national food security.
3. Data Sources and Methods
3.1. Data Source and the Data’s Standardized Processing
The data used in this paper are mainly from the Hubei Provincial Statistics Yearbook and the Regional Economic Statistics Yearbook in Hubei Province, 2011–2020, and from the China Urban Statistics Yearbook, 2011–2020. Partial data were obtained by sorting out the above data, while some missing data were filled by the mean method commonly used in the interpolation method. At the same time, considering that different indexes have different units of measurement, maximum difference normalization is used to conduct dimensionless processing of the data, since direct use of the maximum difference normalization method will produce zero data. The following adjustment coefficient is adopted to map the data into [0,1] in order to avoid zero data [47]:
where is the standardized data and is the original data; max is the maximum value of the data set and min is the minimum value in the data set. If the index value of the original data is larger, the better this is, and then Formula (1) is selected. If the index value of the original data is smaller, the better this is, and Formula (2) is selected.
3.2. Methods
3.2.1. Evaluation Index System
Referring to relevant research [5,26,27,28,29] and combining experts’ suggestions, this paper follows the principles of comprehensiveness, dominance, scientific nature, accessibility and operability in the selection of evaluation indexes. In addition, the SCLR evaluation system in Hubei Province was constructed according to the connotation of SCLR, from three dimensions of quantity security, quality security and ecological security of cultivated land (Table 1). In the system, the index weight was determined by the entropy weight method.

Table 1.
Evaluation system of SCLR.
Quantity security refers to the effective implementation of cultivated land and the basic farmland ownership goals set to meet human society’s basic survival and development needs, as well as the number of effective control policies related to cultivated land and basic farmland loss. In this study, the area of cultivated land per capita, urbanization level, natural growth rate of the population, food production per capita, population density and the reduction ratio of cultivated land are chosen to express quantity security. The larger the area of cultivated land is, the safer are the cultivated resources. The higher the urbanization is, the greater the area of cultivated land that will be occupied and the less safe the cultivated land resources will be. The higher the natural growth rate of the population is, the less safe the cultivated land resources will be. The higher the amount of per capita grain there is, the safer the cultivated land resources will be. The smaller the population density is, the more the SCLR rate will increase. The smaller the area of cultivated land is, the safer the cultivated resources will be.
Quality safety refers to the state in which the productive capacity of cultivated land is effectively protected and the quality of cultivated land is improved. Rural residents’ per capita net income, food production per unit area of cultivated land, the ratio of effective irrigated area, the total power of agricultural machinery, highway density, GDP per capita, the multiple cropping index of cultivated land and average land water resources are chosen in this study to express quality security. The higher the rural residents’ per capita net income is, the better the quality of cultivated land resources will be. The higher the food production per unit area of cultivated land is, the safer the cultivated land resources will be. The higher the ratio of the effective irrigated area is, the safer the cultivated land resources will be. The total power of agricultural machinery reflects the improvements in mechanization as related to the security of cultivated land resources. The greater the highway density is, the greater the pressure on cultivated land resources will be. Next, GDP per capita reflects the economic strength of a region, so the higher the economic strength is, the greater the input to improve SCLR will be. The higher the multiple cropping index of cultivated land is, the higher the efficiency of cultivated land use will be and the higher the SCLR. Water resources per unit of land reflect the quality of the cultivated land environment in a region. The higher the total water resources per land are, the better the quality of the cultivated land and the safer the cultivated land resources will be.
Ecological security refers to a state of sustainable utilization with a small negative impact on the ecological environment in the development and utilization of cultivated land [10]. Fertilizer load per unit area of cultivated land, pesticide load per unit area of cultivated land, forest coverage, the centralized treatment rate of sewage, the discharge of industrial wastewater, the output of industrial solid waste, and industrial SO2 emissions are selected in this study to represent ecological security. Both fertilizer load and pesticide load per unit area of cultivated land reflect the degree of influence of chemical fertilizer and pesticide pollution on cultivated land resources. The higher the value is, the lower the security is. The forest coverage reflects the degree of ecological environment, so the higher the rate of forest coverage is, the safer the cultivated land resources will be. The higher the centralized treatment rate of sewage is, the less sewage will be discharged and the higher the security will be. The discharge of industrial wastewater, the output of industrial solid waste and the discharge of industrial SO2 all reflect the impact of industrial pollution on cultivated land. This indicates that the lower the discharge level is, the safer the cultivated land resources will be.
3.2.2. Entropy Weight Method
The entropy weight method is an objective weighting method, which carries out the statistical calculation on sample data and determines weights based on the information contained within the data [48]. Entropy is a measure of the disorder degree of a system, which can in turn judge the amount of information. As can be seen from the definition of entropy, the dispersion degree of an index can be judged by the entropy value, which is negatively correlated with the degree of dispersion. The smaller the entropy value is, the greater the dispersion degree of the index is, the greater the amount of information in the index is and the greater the weight of the index will be. Conversely, the larger the entropy value is, the smaller the degree of dispersion is, the smaller the amount of information contained in the index is and the smaller the weight of the index will be. According to the variation degree of each index, the index entropy weight is calculated by using information entropy, and the objective index weight is obtained. The formula is as follows:
where Hi is information entropy of the ith index, Wi is the entropy weight of the ith index, Xij is the value of range normalization, m is the number of indicators and n is the number of research units.
3.2.3. Comprehensive Index Method
The comprehensive index method is the most mature method used in security evaluation research [49]. The index is converted into standardized values of the same scale, and then multiplied by corresponding weights. Finally, the indexes are integrated. This method evaluates SCLR according to the value size of the evaluation index and the corresponding weight. The formula is as follows:
where Si is the level of SCLR in the i city, Wj is the entropy weight of the jth index, and Xij is the standardized value of the jth item in the ith city.
3.2.4. Classification of Evaluation Criteria
According to evaluation results in the middle of time series and natural breakpoint method, this paper divides evaluation results into five categories: Safety, relative safety, critical safety, lesser safety and unsafe (Table 2), based on previous studies [49,50]. Analysis results of quantity security, quality security and ecological security are also divided from high to low, into five levels: I, II, III, IV and V (Table 3).
Table 2.
Evaluation standard of comprehensive safety degree.
Table 3.
Evaluation standard of safety level.
3.2.5. Obstacle Degree Model
An obstacle degree model can diagnose obstacle factors that influence SCLR and the magnitude of the degree of influence [29]. By introducing Yn (contribution degree of factor), In (deviation degree of the index) and On (obstacle degree), this study constructs a diagnosis model of obstacle factors to clarify the obstacles of the research object, and to determine the primary and secondary relationship of obstacle factors and their degrees of influence by ranking them [51]. The formula is as follows:
where On is the obstacle degree, which represents the impact of index n on SCLR; Yn is the contribution degree of factor, which represents the contribution degree of the factor to target (that is, the weight of factor Wn). Furthermore, In is the degree of deviation of the index, which represents the difference between the index’s actual value and the optimal value, which in turn can be represented by the difference between I and the standardized value of the index (X′n).
4. Results and Discussion
4.1. Spatial-Tmporal Characteristics of SCLR
4.1.1. Temporal Characteristics of SCLR
In general, the degree of security of cultivated land resources in Hubei Province showed an upward trend between 2010 and 2018 (Figure 2). The comprehensive safety value increased from 0.460 in 2010, to 0.538 in 2018, with an average annual growth rate of 1.9%. Among the various values, the value of quality safety increased from 0.203 to 0.263, and the value of ecological safety increased from 0.151 to 0.173, both showing an upward trend. Meanwhile, quantity safety showed a slight downward trend, with its value decreasing from 0.106 to 0.102; quality safety value showed a slightly decreasing trend from 2017 to 2018.
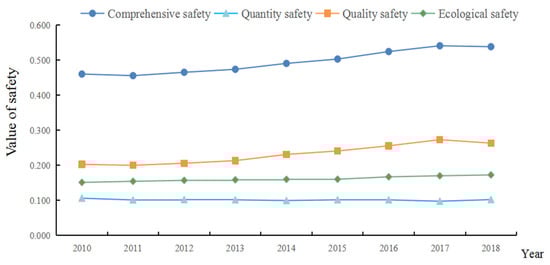
Figure 2.
The changing trend of SCLR in Hubei Province between 2010 and 2018.
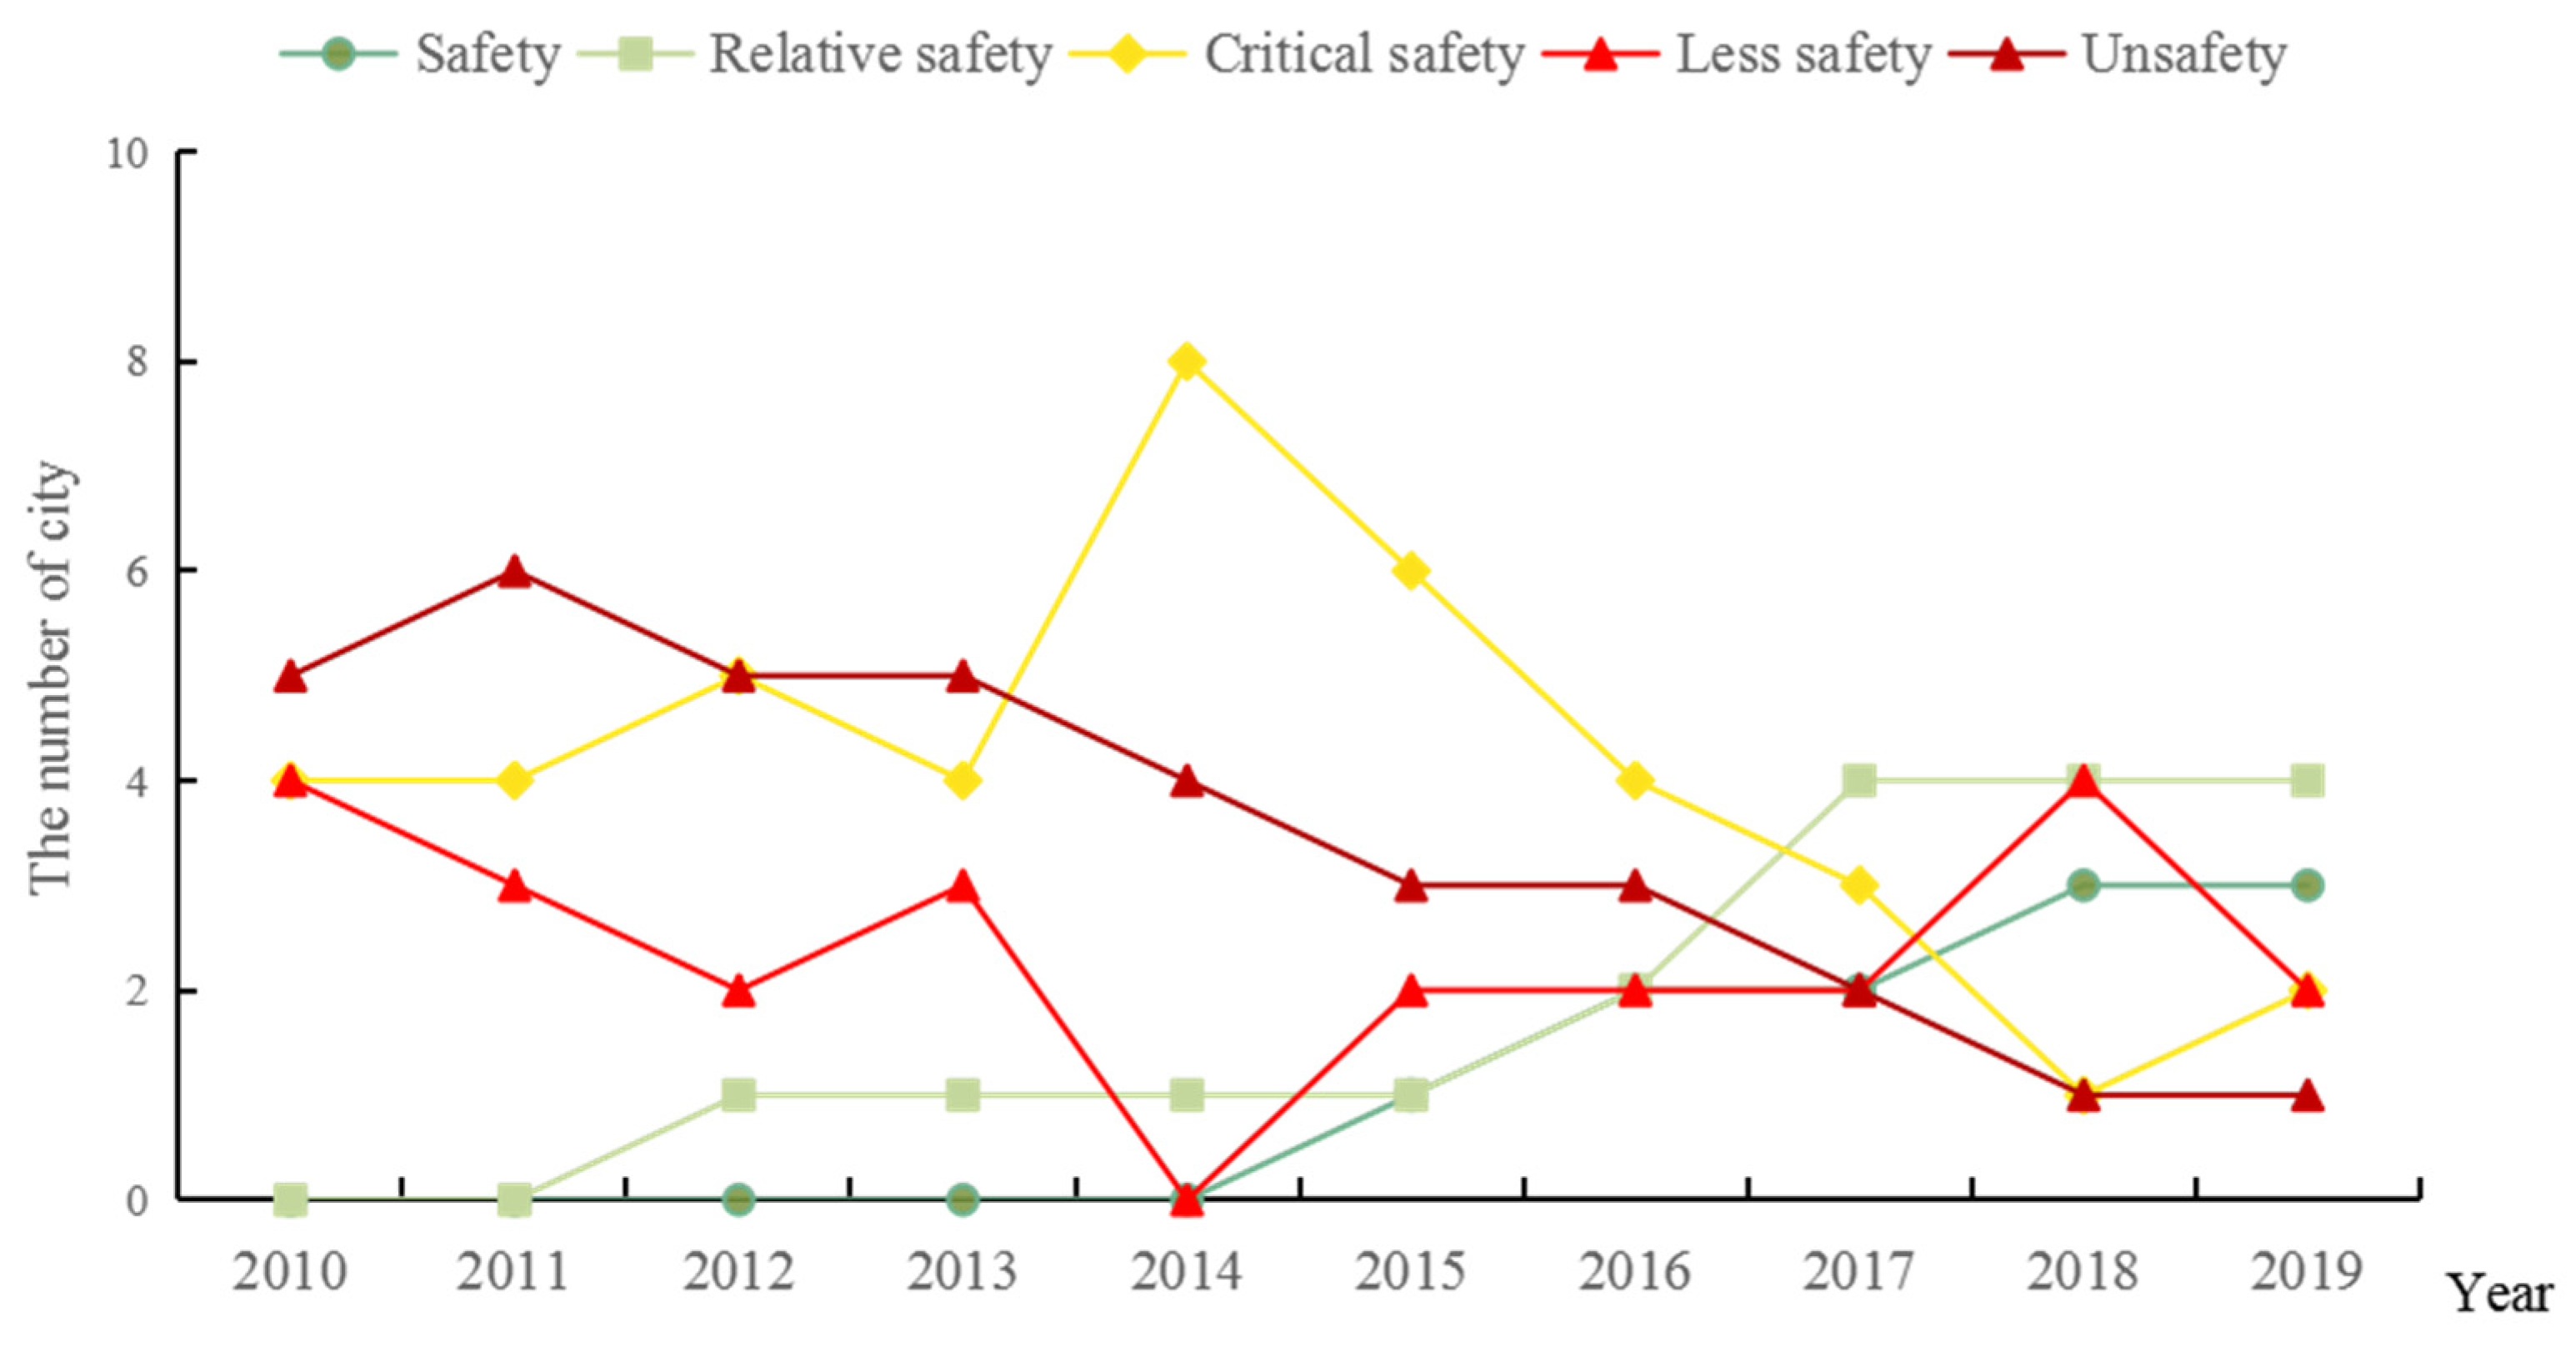
The number of cities in the ‘safety’ and ‘relative safety’ levels of cultivated land resource showed an increasing trend between 2010 and 2019; the number of cities in the ‘unsafe’, ‘lesser safety’ and ‘critical safety’ levels of SCLR showed a decreasing trend (Figure 3). In 2010, the number of ‘safety’ and ‘relative safety’ cities was 0; the number of ‘critical safety’ and ‘lesser safety’ cities was four, and the number of “unsafe cities” was five. In 2019 (excluding Ezhou), the number of ‘safety’ and ‘relatively safety’ cities had reached three and four, respectively, while the number of ‘critical safety’ and ‘lesser safety’ cities were both two. The number of ‘unsafe cities’ also decreased to one. Between 2013 and 2018, the number of ‘lesser safety’ cities increased slightly, but the overall trend was good. The comprehensive safety level in all cities showed an overall upward trend.

Figure 3.
The changing trend by number of cities for SCLR between 2010 and 2019.
4.1.2. Spatial Characteristics of Cultivated Land Resources Security
In order to reflect the spatial characteristics of SCLR in the Hubei Province more intuitively, ArcGIS software was used to analyze the spatial distribution of comprehensive security, quantity security, quality security and ecological security (Figure 4).
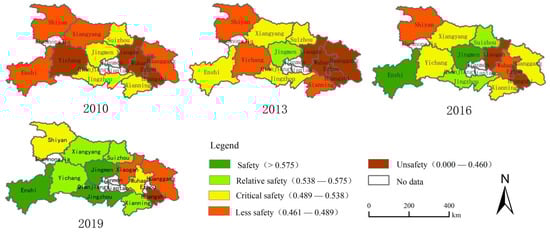
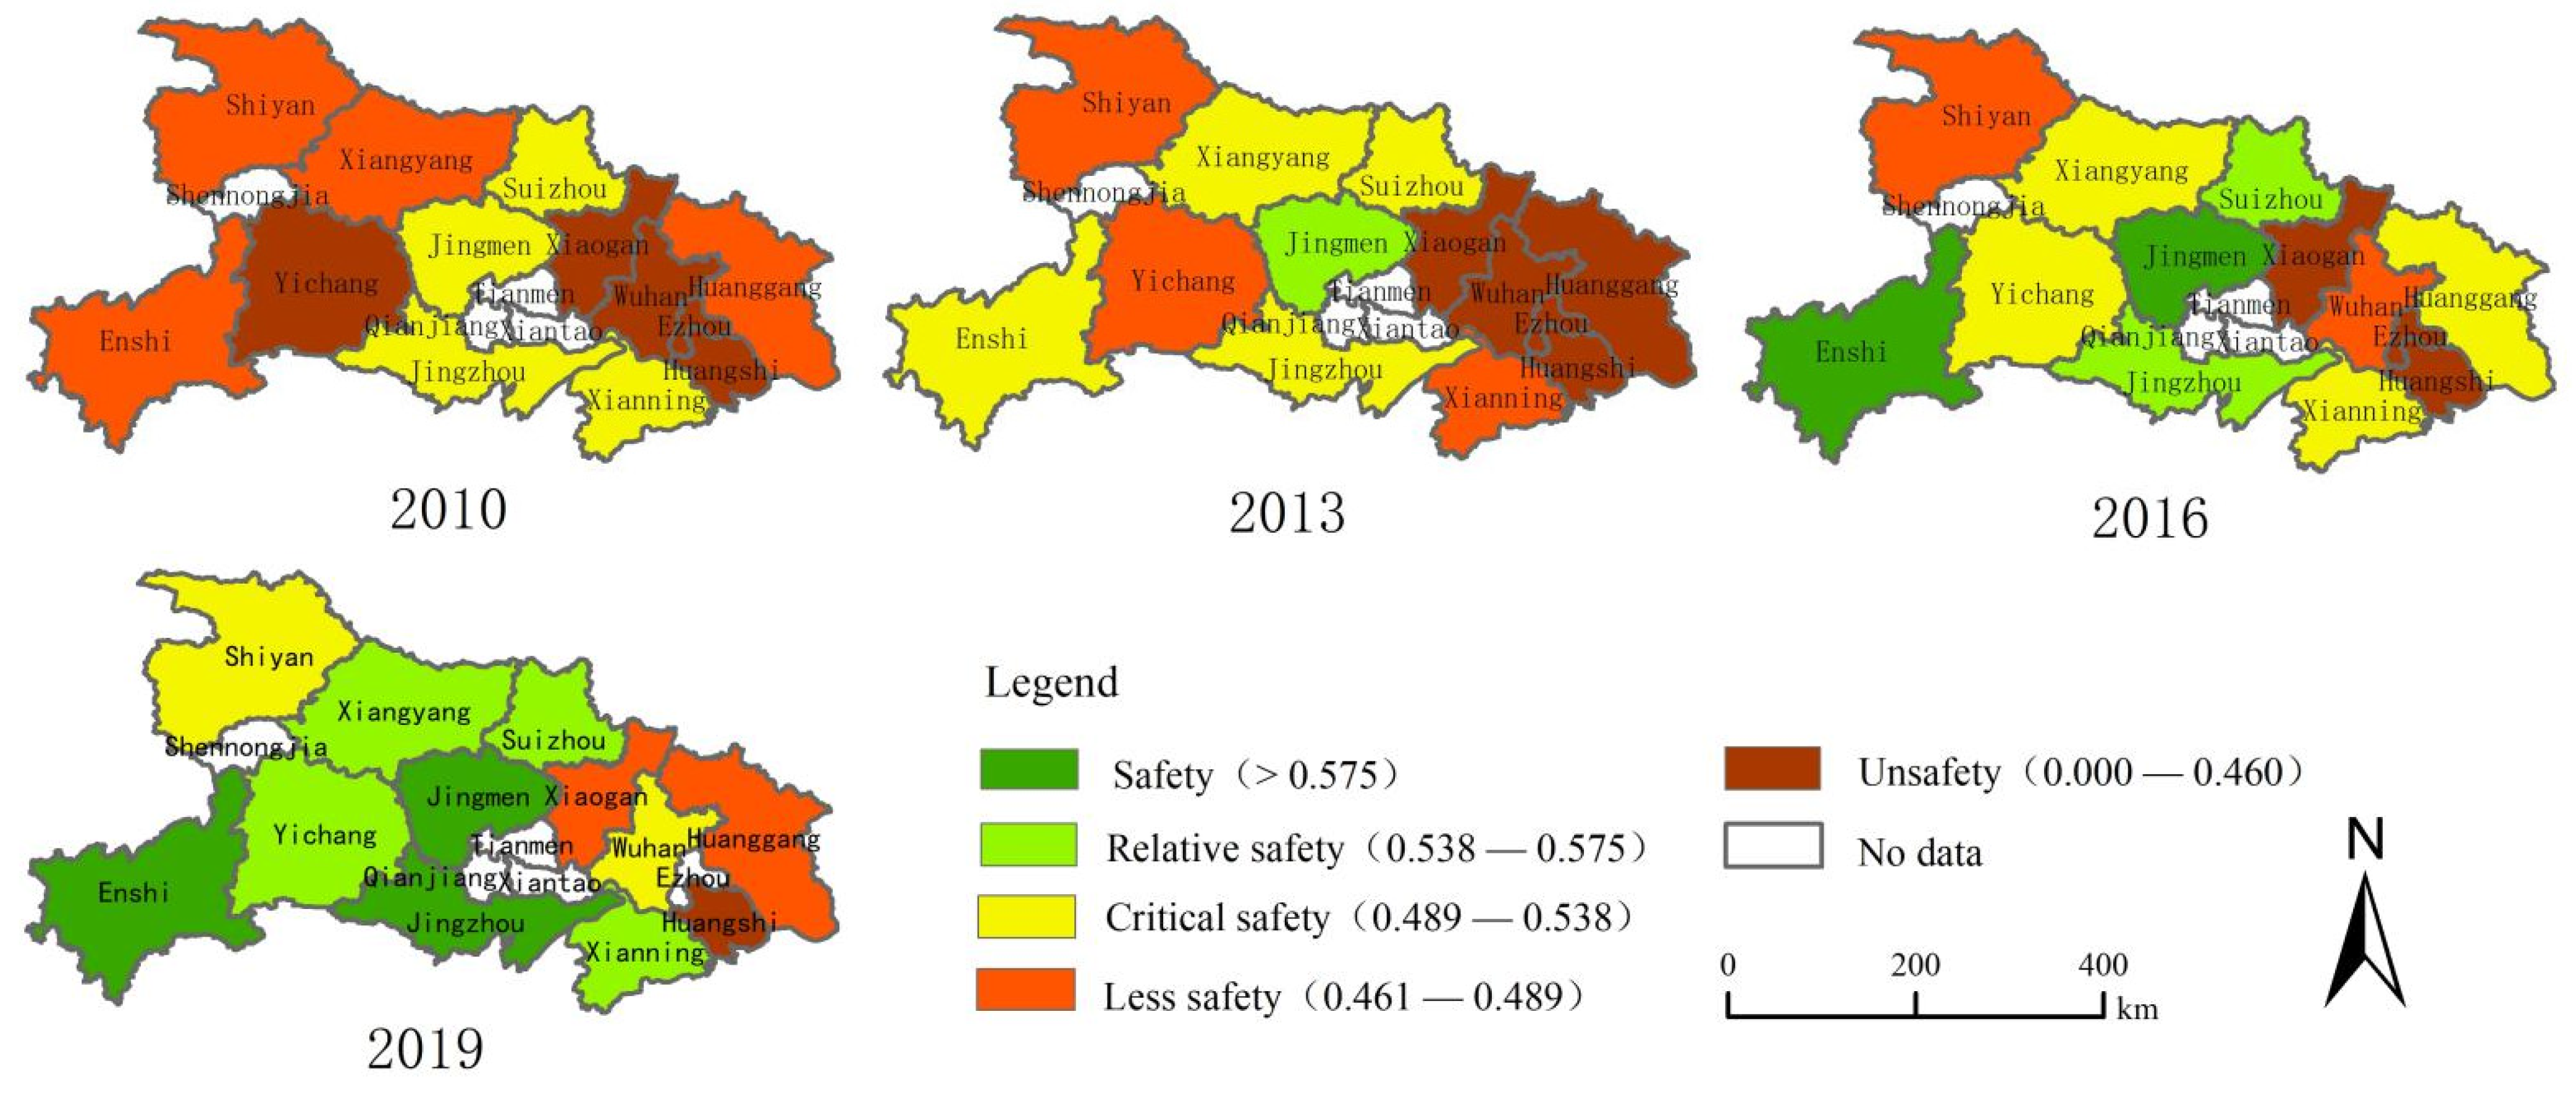
Figure 4.
Spatio-temporal pattern of SCLR in the Hubei Province between 2010 and 2019.
The comprehensive security level of cultivated land resources increased significantly from 2010 to 2019, but the spatial distribution characteristics showed little change, remaining high in the west and low in the east of Hubei Province. In particular, the security levels of Wuhan, Ezhou, Huangshi and Xiaogan were low in the east, showing a generally decreasing trend from west to east. In 2010, the ‘critical safety’ areas were Jingmen, Suizhou, and Jingzhou in central Hubei, and Xianning in eastern Hubei; the ‘lesser safety’ areas were Xiangyang, Shiyan, Enshi and Huanggang in eastern Hubei; Xiaogan, Wuhan, Ezhou and Huangshi in eastern Hubei and Yichang in western Hubei were the “unsafe” cities. This shows spatial distribution characteristics of a decreasing trend from west to east. The ‘safety’ areas were mainly concentrated in Jingmen and Jingzhou in central Hubei, and Enshi in western Hubei; the ‘relative safety’ areas were Suizhou, Xiangyang, Yichang and Xianning. The ‘lesser safety’ areas were Xiaogan and Huanggang, the ‘critical safety’ areas were Shiyan and Wuhan, and the least safe area was Huangshi. The ‘lesser safety’ areas were distributed in a circular pattern in 2019, centered around Wuhan.
(1) Spatial characteristics of cultivated land quantity security
The safety level of cultivated land resources in Hubei Province decreased gradually from 2010 to 2019 (Figure 5).

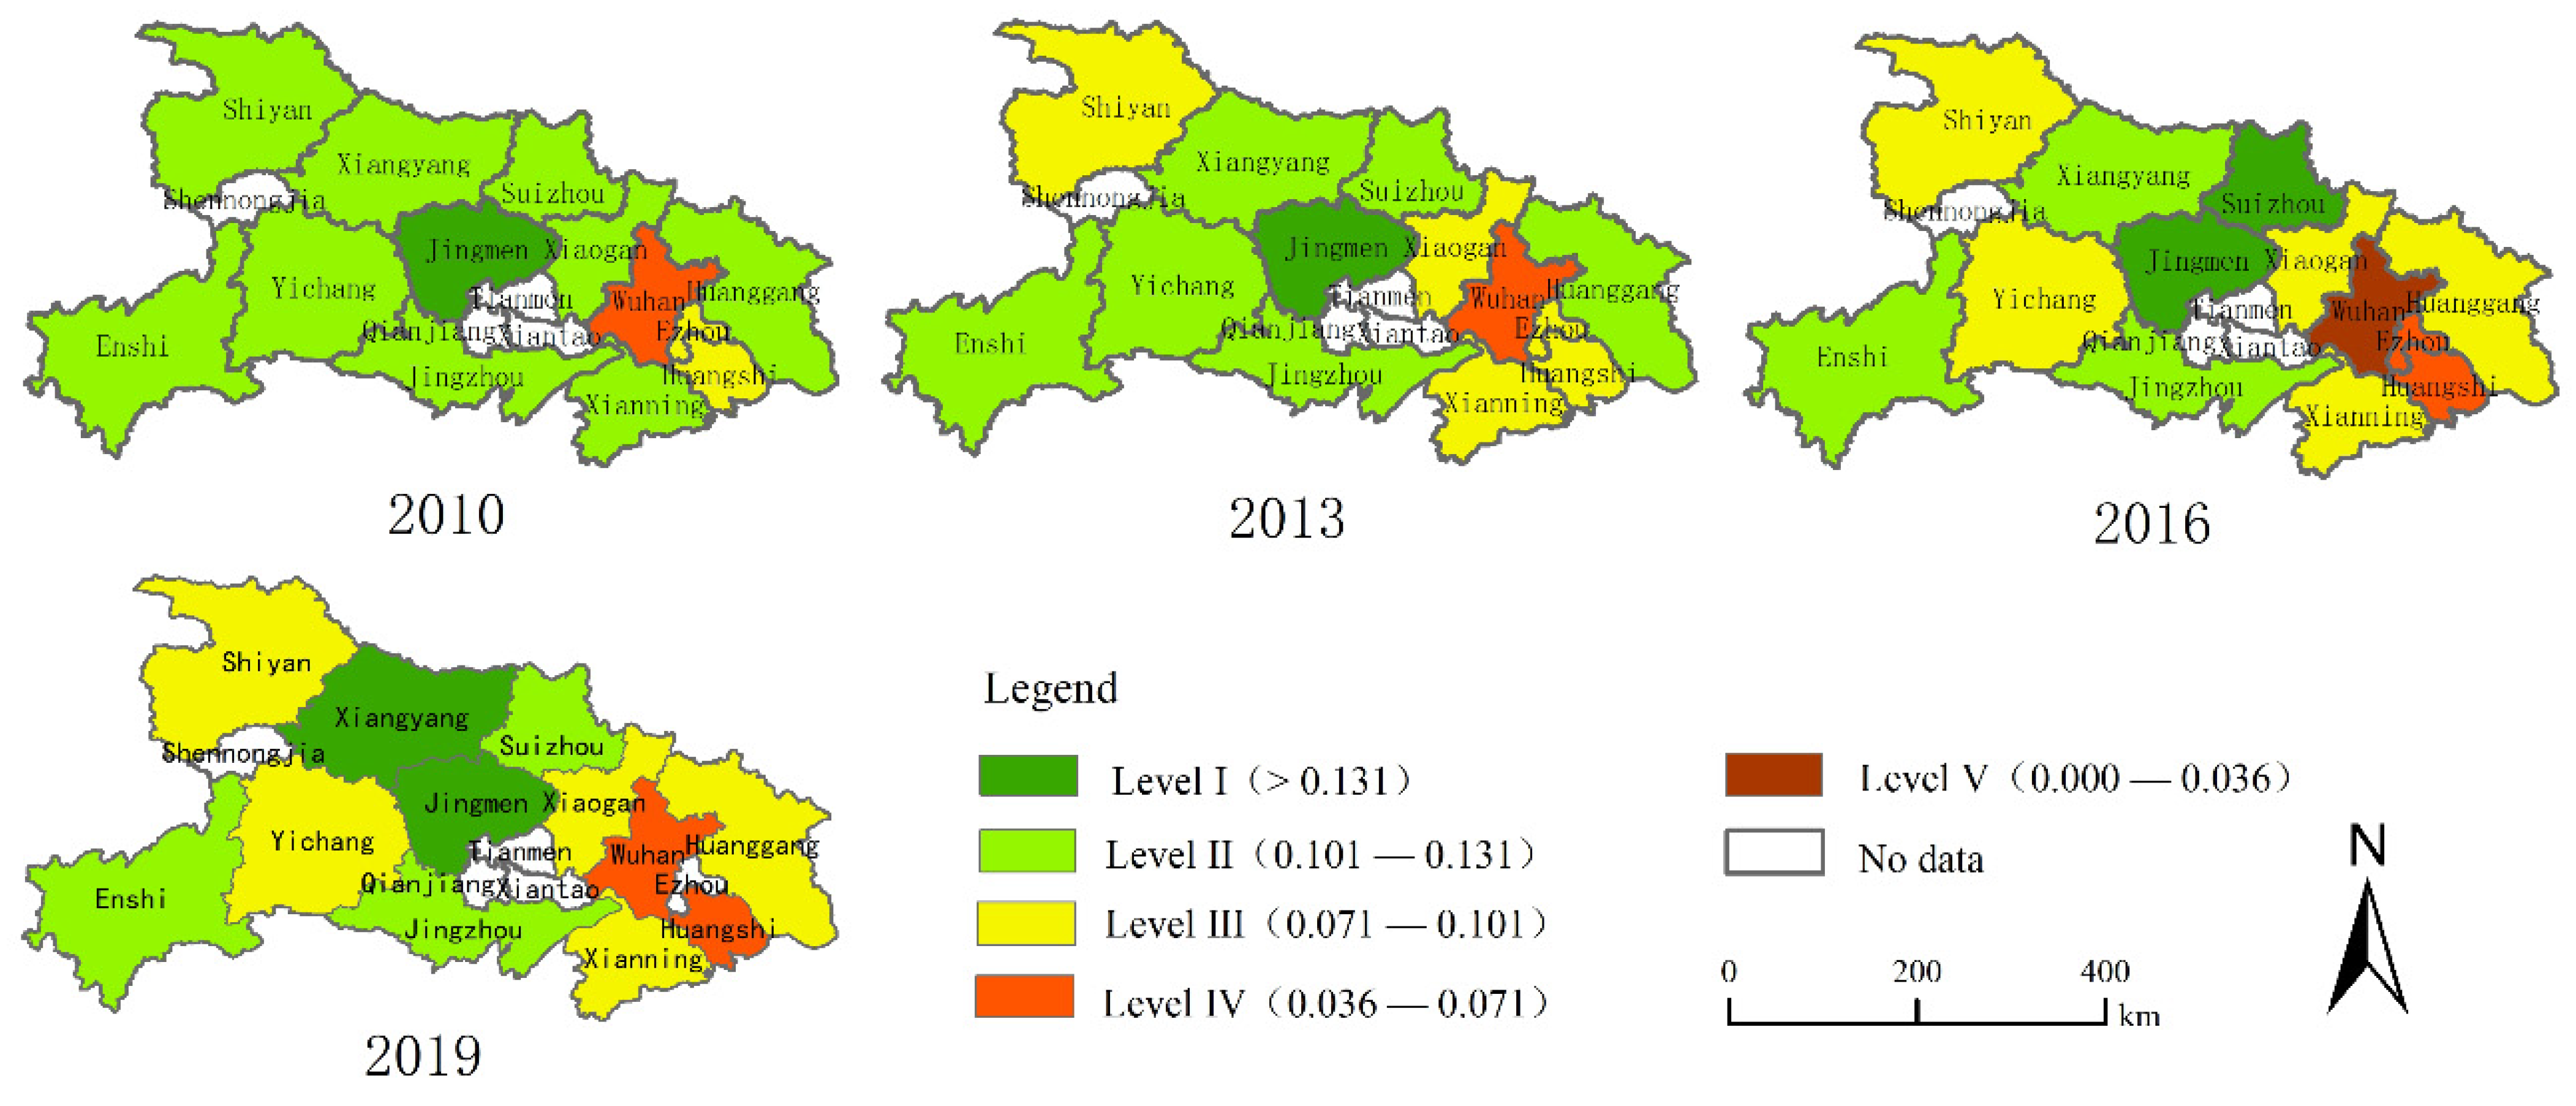
Figure 5.
Spatial pattern of cultivated land quantity security in Hubei Province between 2010 and 2019.
The only city with a quantity safety level that continued to maintain a high level was Jingmen. The safety level of Wuhan has been relatively low. Xiangyang and Jingmen had the highest safety level in terms of quantity safety; Enshi, Suizhou and Jingzhou had a higher level of quantity safety; Shiyan, Yichang, Xiaogan, Huanggang and Xianning had a medium level of quantity safety, and Huangshi and Wuhan had a low level of quantity safety level. In 2010, Ezhou and Huangshi in eastern Hubei, along with the other nine areas, were safe or relatively safe, with the exception of Wuhan. The security level in Xianning, Xiaogan and Shiyan reduced from level II in 2010, to level III in 2013. The security level in Yichang and Huanggang also reduced, from level II in 2010, to level III in 2016. On the whole, the degree of quantity security showed a spatial pattern of being high in the central, low in the east and low in the west in 2019.
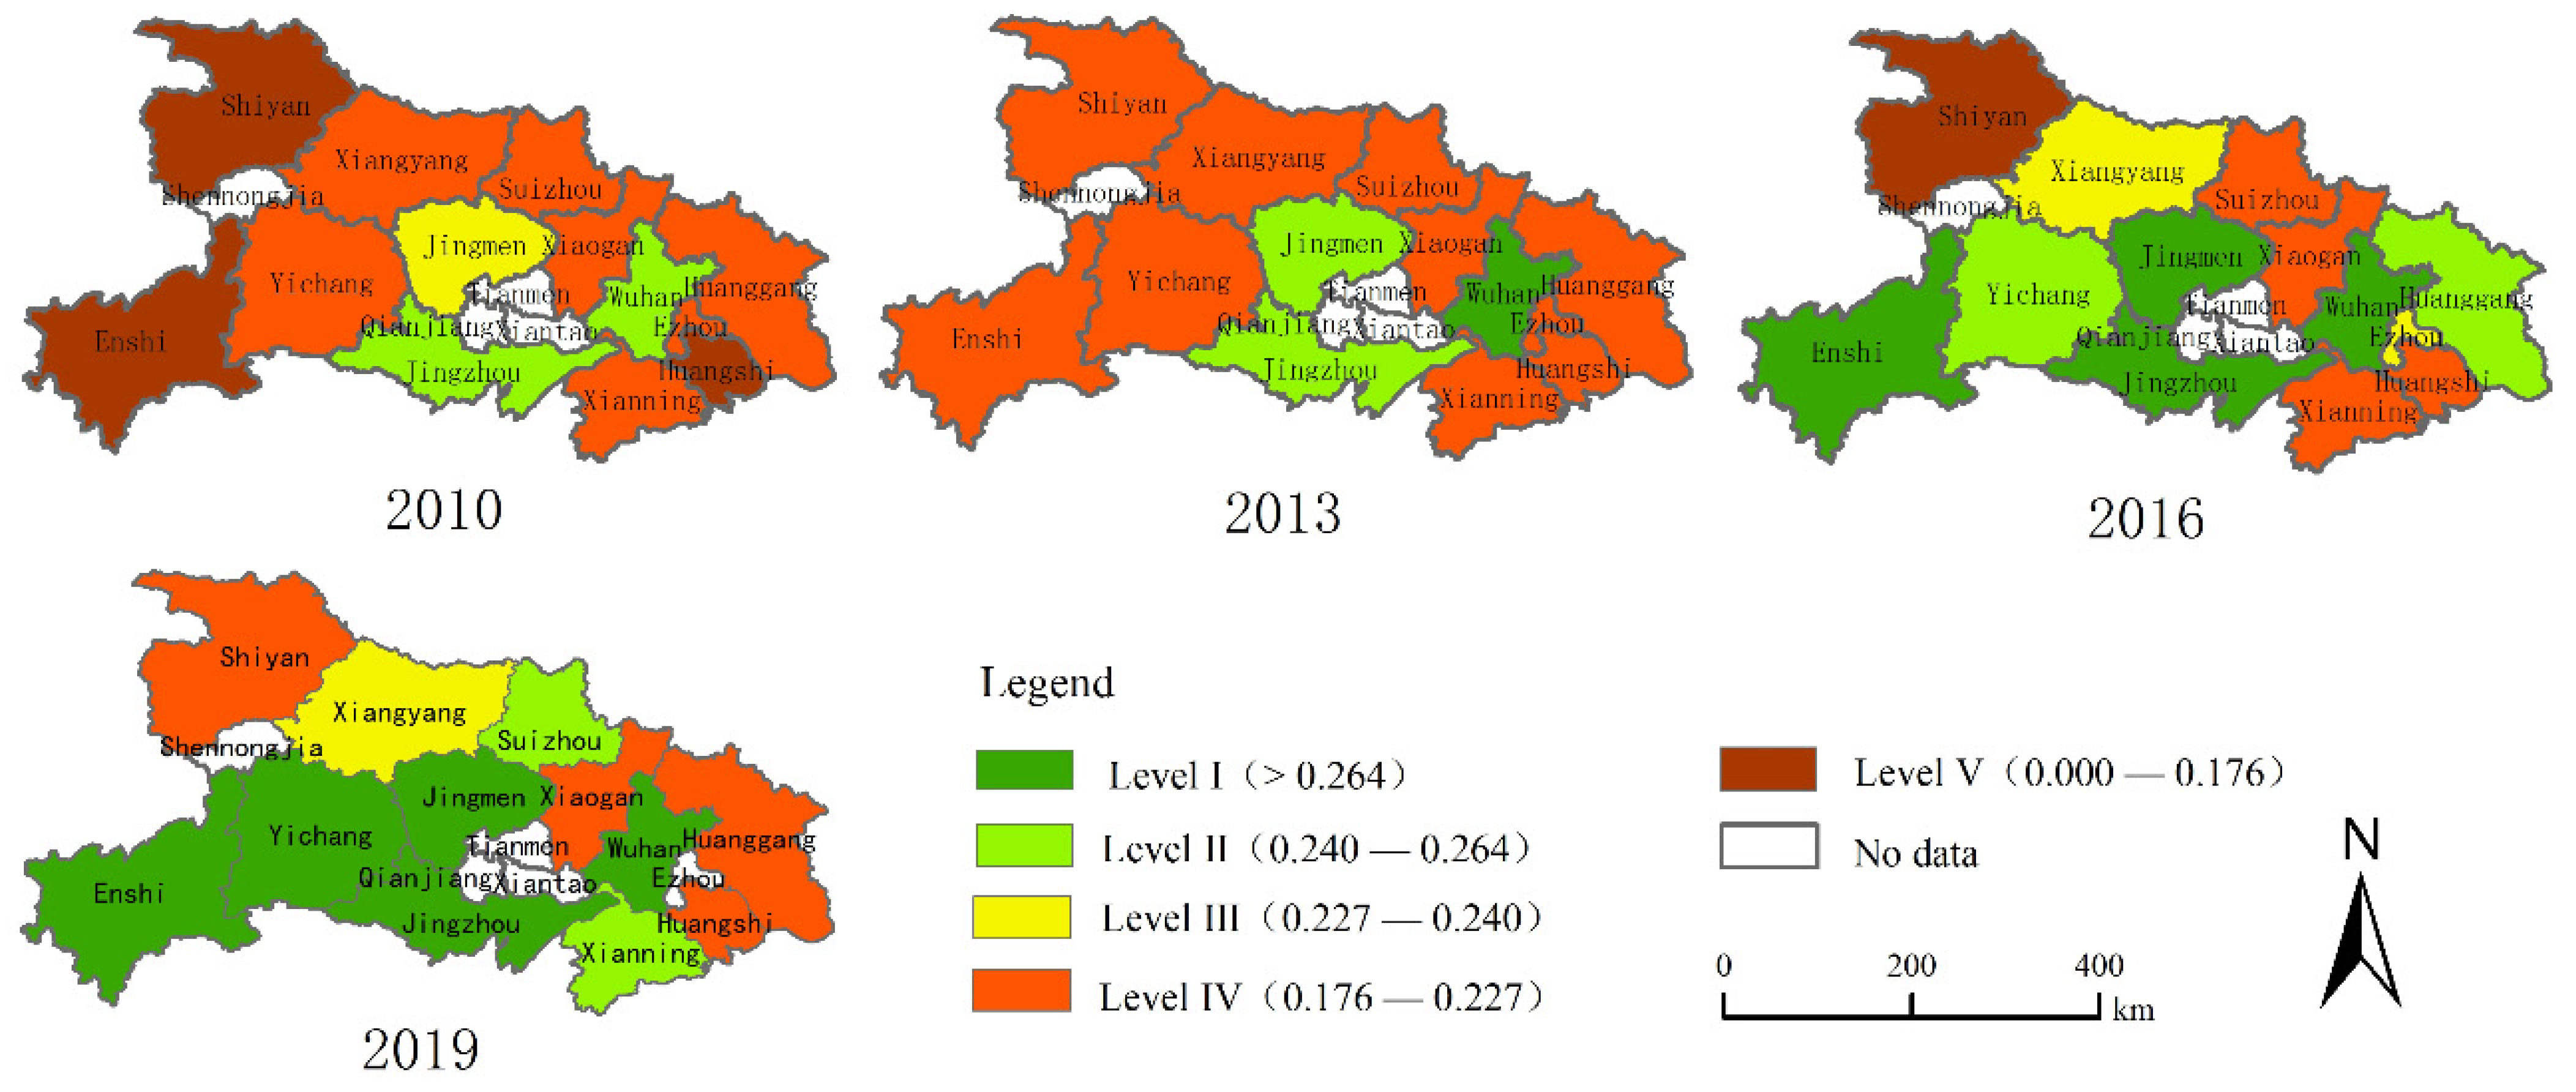
(2) Spatial characteristics of cultivated land quality security
The quality safety level of cultivated land resources in the Hubei Province showed an upward trend between 2010 and 2019 (Figure 6). Most of the cities in central Hubei were at a low grade in 2010, but there would be a significant increase in the number of cities with a high quality safety level. Although the security level of eastern and western Hubei has improved, these areas are still at a lower level. The safety level in Wuhan and Jingzhou was higher, while Jingmen was in the middle level, and the rest were at a lower safety level in 2010. The safety degree of quality showed a spatial pattern of high in central Hubei and low in eastern and western Hubei. Except for Wuhan and Enshi, the areas with higher security levels were in central Hubei and Jingmen, along with Jingzhou, Yichang and Suizhou near central Hubei. Safety levels were at the medium level for Huanggang, with lower-level areas being Xiaogan, Huanggang and Huangshi in the east, and Shiyan in the west of Hubei. The city with a medium safety level was Huanggang, while the cities with low safety levels were Xiaogan, Huanggang and Huangshi in eastern Hubei, and Shiyan in western Hubei.
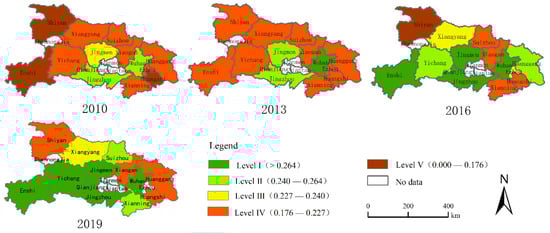
Figure 6.
Spatial pattern of cultivated land quality security in Hubei Province between 2010 and 2019.
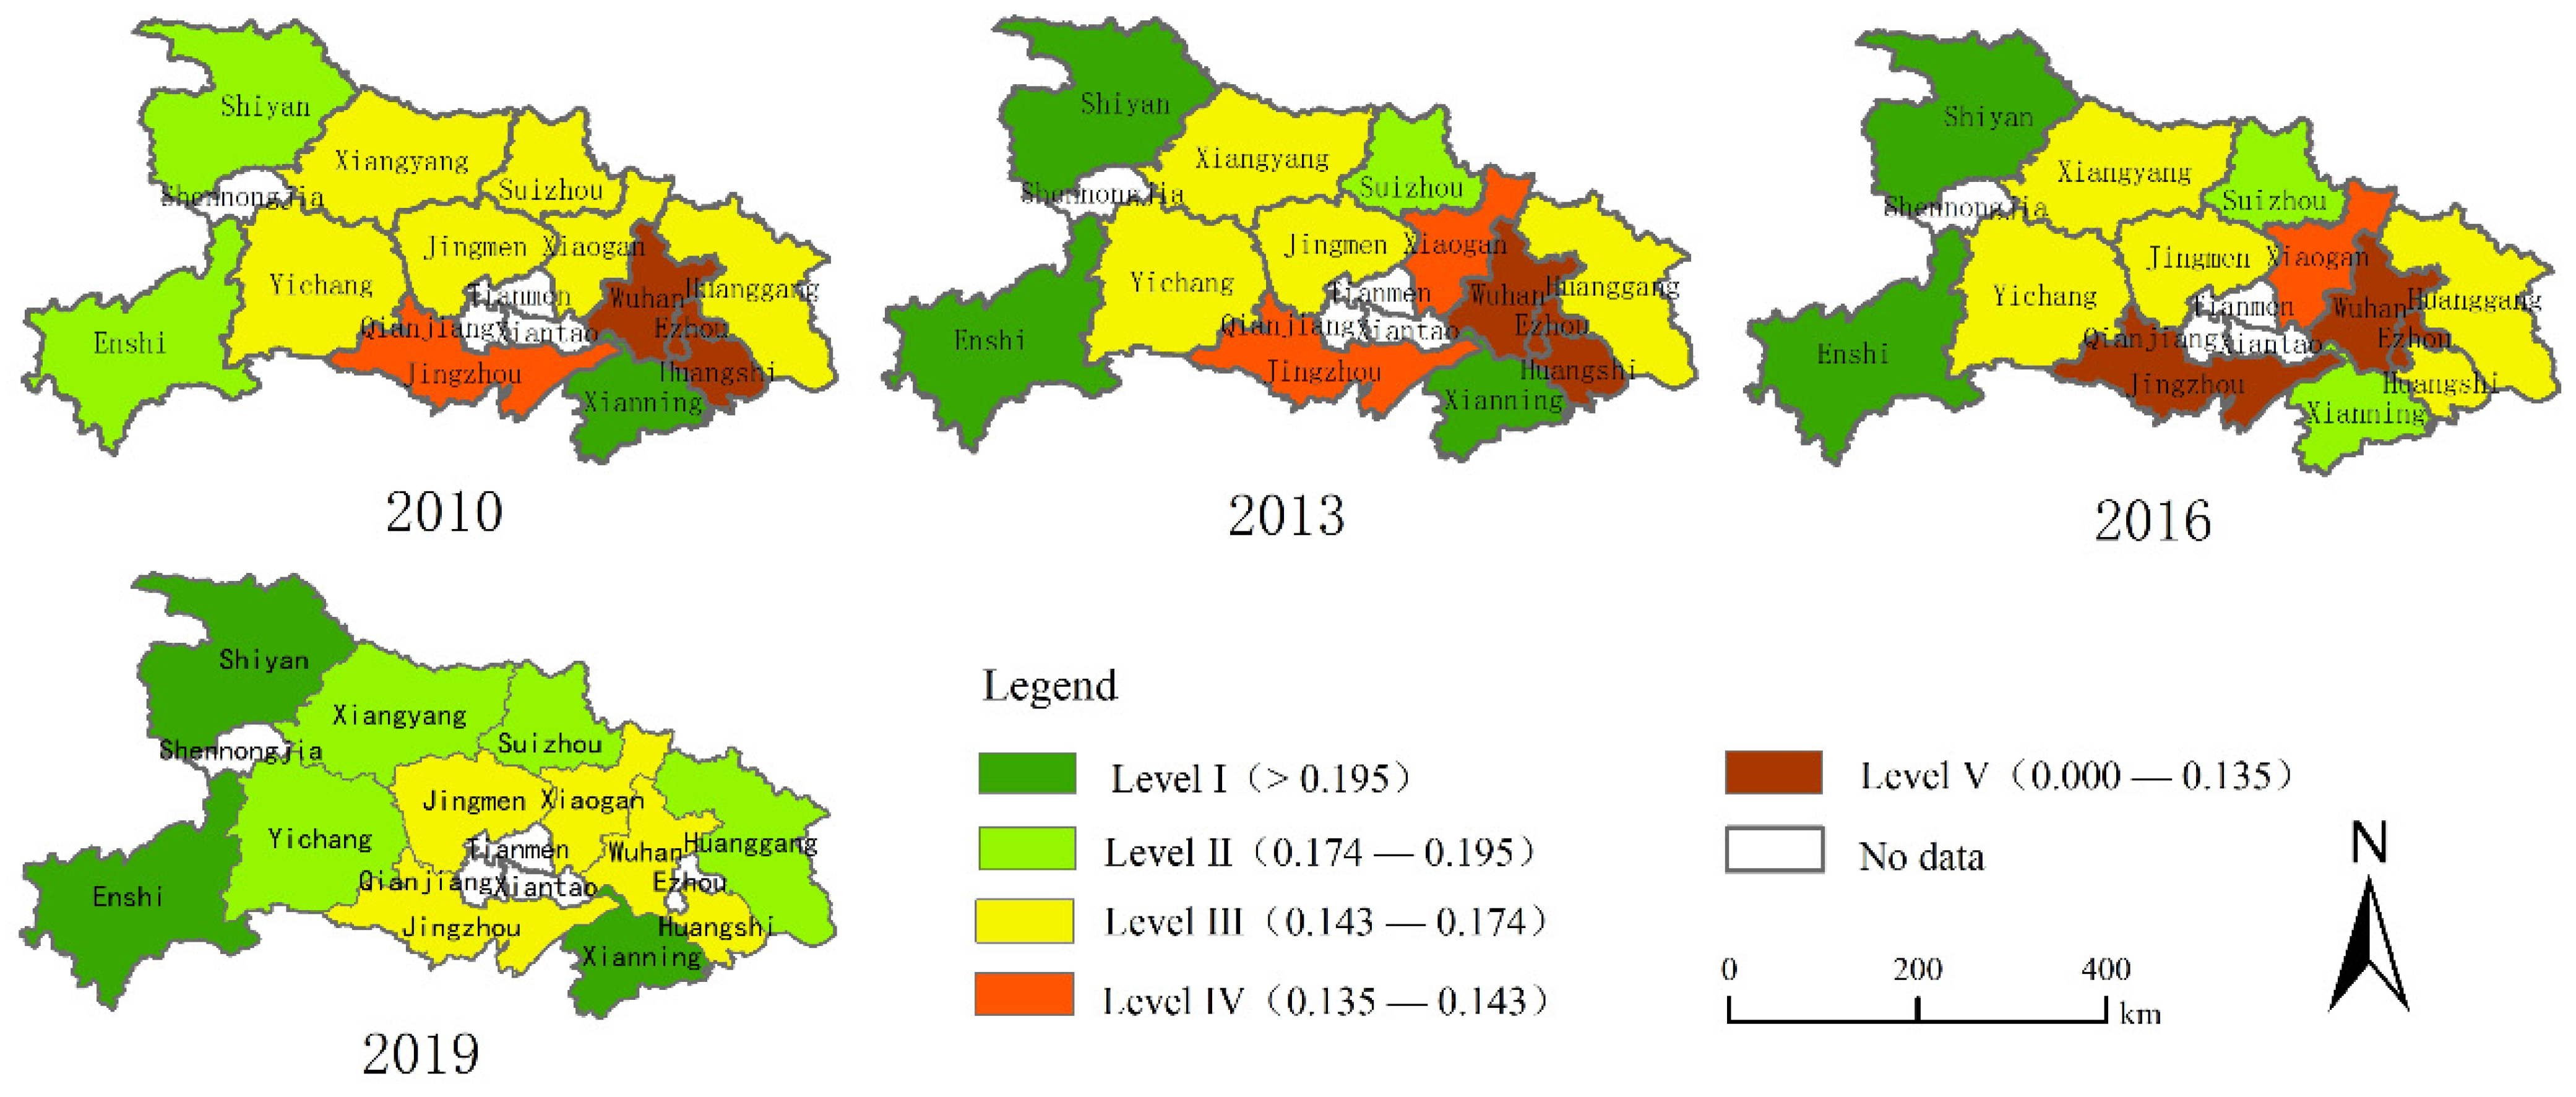
(3) Spatial characteristics of cultivated land ecological security
From 2010 to 2019, the ecological security level of cultivated land resources increased slightly, while the number of cities with lower ecological security levels in eastern and central Hubei decreased gradually during that period (Figure 7). Wuhan, Ezhou, Xiaogan and Huangshi had the lowest safety levels; Jingzhou had a low safety grade, while Shiyan, Enshi and Xianning had the highest safety grade. The ecological security degree of cultivated land resources in 2019 showed a spatial pattern of high in the west and low in the east. Enshi, Shiyan and Xianning had the highest level of cultivated land ecological security; Suizhou, Yichang, Xiangyang and Huanggang had the highest level of cultivated land ecological security, and the rest of the cities were at the middle level. In general, the ecological security level of Shiyan, Enshi and Xianning has always been high, while Wuhan has always been at a low level.
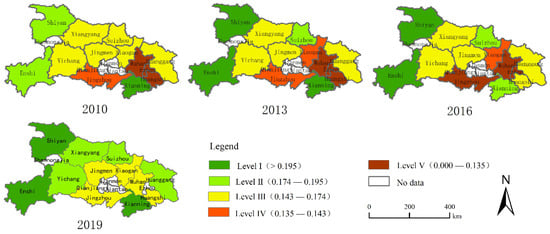
Figure 7.
Spatial pattern of cultivated land ecological security in Hubei Province between 2010 and 2019.
4.2. Obstacle Factors of SCLR
The top three indicators with the highest obstacle degree were screened from the system level (quantity, quality and ecology, respectively). Then, the frequency of their occurrences in the two periods of 2010–2014 and 2015–2019, respectively, were counted [52]. These were the main obstacles to the quantity, quality and ecological security of these areas (Table 4, Table 5 and Table 6).
Table 4.
Frequency of obstacles degree to index of cultivated land quantity security in each region from 2010 to 2019.
Table 5.
Frequency of obstacles degree to index of cultivated land quality security in each region from 2010 to 2019.
Table 6.
Frequency of obstacles degree to index of cultivated land ecological security in each region from 2010 to 2019.
4.2.1. Obstacle Factors of Cultivated Land Quantity Security
As can be seen from Table 4, the top obstacles to quantity security index in all regions were basically unchanged, but their frequency has a variation trend of increase and decrease between 2010 and 2019. The main obstacle factors in Xiangyang and Jingmen were cultivated land area per capita, urbanization level and decreasing rate of cultivated land area. The main obstacle factors in the other 11 cities were the decreasing rate of cultivated land area, food production per capita and cultivated land area per capita. Among the above, the most influential obstacle factor was cultivated land area per capita, which occurred five times in each region during study periods of 2010–2014 and 2015–2019, with a frequency of 100%.
4.2.2. Obstacle Factors of Cultivated Land Quality Security
There were differences in the main obstacles to the quality security of eastern Hubei, central Hubei and western Hubei (Table 5).
The main barriers to quality safety were the total power of agricultural machinery, GDP per capita and water resource per capita land in eastern Hubei. Among the above, the main obstacles in Wuhan were the total power of agricultural machinery and the ratio of effective irrigation area and water resource per capita of land during 2015–2019. From 2010 to 2014, the main obstacle factors in western Hubei were rural residents’ per capita net income, the total power of agricultural machinery and GDP per capita. The obstacle factors changed from rural residents’ per capita net income and GDP per capita to the ratio of effective irrigated area and water resource per unit of land in Shiyan. Meanwhile, in Xiangyang, the obstacle factors changed from rural residents’ per capita net income and the total power of agricultural machinery to the ratio of effective irrigated area and water resource per unit of land from 2015 to 2019. The main obstacle factors in central Hubei were rural residents’ per capita net income, GDP per capita and water resources per unit of land. Among the above, from 2015 to 2019, the main obstacle factors in Yichang changed from rural residents’ per capita net income and GDP per capita to the ratio of effective irrigation area and the total power of agricultural machinery. As can be seen, the main obstacle factors changed in frequency from 2015 to 2019, among which the frequency of the total power of agricultural machinery changed the most.
4.2.3. Obstacle Factors of Cultivated Land Ecological Security
The obstacles to ecological security in eastern Hubei and central Hubei shared certain similarities (Table 6). The main obstacle factors in 2015–2019 were pesticide load per unit area of cultivated land, forest coverage and the discharge of industrial solid waste in Xiaogan, Huangshi, Huanggang and Xianning in east Hubei and Xiangyang, Jingmen and Suizhou in central Hubei. Among the above factors, industrial SO2 emissions were one of the main obstacle factors from 2010 to 2014 in Huangshi, Xiangyang, Jingmen and Xianning. The main obstacle factors in Enshi and Shiyan, in western Hubei, were fertilizer load per unit area of cultivated land, pesticide load per unit area of cultivated land and the centralized treatment rate of sewage. The major obstacles in Wuhan were forest coverage, the discharge of industrial wastewater and the output of industrial solid waste. From the perspective of the obstacle factors in each city, forest coverage and pesticide load per unit area of cultivated land appeared the most frequently.
4.3. Discussion
Taking 13 prefecture-level cities in Hubei Province as a research unit, this article constructs an evaluation system of SCLR from the perspective of ecology, quality and quantity security. On this basis, the comprehensive index method and the entropy method are employed to evaluate the evolution characteristics of SCLR. Then, the obstacle degree model is used to explore the obstacle factors of the cultivated land resource in ecology, quantity and quality security. This study came up with some significative results, which can provide a theoretical basis for the formulation of policies related to the sustainable use of regional cultivated land resources.
(1) The security level of cultivated land resources in Hubei Province showed an upward trend between 2010 and 2019. The land resources’ quality and ecological security showed an upward trend, while quantity security showed a downward trend. The results are consistent with those of neighboring Anhui Province [28], which shows that the index system and evaluation method is reasonable. However, there are some differences from previous studies on the Hubei Province from 2005 to 2014 [27], because the occupation and protection of cultivated land was in an unstable period between 2005 and 2009. However, since 2010, the Hubei province has attached great importance to agricultural resources and strengthened governance, which has improved the quality and security of cultivated land resources. At the same time, it also shows that since economic development became the new normal in 2010, China’s cultivated land protection policy has achieved certain results.
(2) The main obstacles to its security in quantity, quality and ecology are obviously different. The obstacles to quantity security are the reduction rate of cultivated land area, food production per capita and cultivated land per capita. Among them, the most widely affected obstacle factor is the cultivated land per capita, indicating that the human factor has an increasingly obvious influence on the area of cultivated land resources. The obstacles to quality security are the total power of agricultural machinery, GDP per capita and water resource per unit of land between 2010–2014. It changes in frequency in 2015–2019, among which the frequency of the total power of agricultural machinery changed the most, which shows that agricultural mechanization is the main indicator of quality security, and economic development and water resources are an important influencing factor. Among obstacle factors of ecological security, pesticide load per unit area of cultivated land and forest coverage appears most frequently. The extensive use of pesticides has caused the hardening of cultivated land and the destruction of cultivated land ecology. Therefore, it is necessary to further strengthen forest protection and strictly prevent man-made destruction.
5. Conclusions and Policy Implications
5.1. Conclusions
(1) The SCLR in the Hubei Province presents obvious spatial-temporal differences. The security degree of cultivated land resources showed an upward trend from 2010 to 2019; the security degree gradually improved throughout this period. Quality security and ecological security both showed an upward trend, while quantity security showed a downward trend. The security of cultivated land resources decreased from west to east. The spatial pattern of quantity security was high in central Hubei, low in eastern Hubei and lower in western Hubei. The spatial pattern of quality safety was high in central Hubei, low in eastern and western Hubei. On the whole, the spatial pattern of ecological security was higher in the west and lower in the east; overall, the level of ecological security increased slightly; the areas with higher security levels continued to maintain higher levels, while the areas with lower security levels gradually declined.
(2) The main obstacles to quantity security are the reduction rate of cultivated land area, food production per capita, cultivated land area per capita and urbanization level. The main barriers to quality security are water resources per unit area of land, GDP per capita, the total power of agricultural machinery and the per capita net income of rural residents. In addition, obstacle factors had certain differences in different regions. The main obstacle to quality security in Shiyan, Enshi and Yichang in western Hubei is the total power of agricultural machinery. The centralized treatment rate of sewage is also one of the main obstacles to ecological security. The main obstacles to quality security in central Hubei are the per capita net income of rural residents and the ratio of effective irrigated area. Pesticide load per unit area was the main obstacle to ecological security. The main obstacle to quality security was water resource per unit area of land; forest coverage was the main obstacle to ecological security in the east of Hubei. The main obstacles to quantity security showed little difference in western, central and eastern Hubei. This study’s conclusion is that the main factors that affect SCLR are natural factors, such as cultivated land area and water resources, as well as urban development, the perfection of agricultural infrastructure, the application of pesticides and chemical fertilizers and other human factors.
5.2. Policy Implications
(1) Policies and measures should be formulated to ensure SCLR on the bases of quantity, quality and ecological security. In terms of quantity, cultivated land protection policies should be further strengthened to ensure the area of cultivated land per capita, Also, cultivated land conversion should also be strictly controlled; the rate of decrease in the cultivated land area must be reduced and the protection of high-quality cultivated land around cities and towns must be strengthened. In terms of quality, appropriately scaled farming should be encouraged, to increase the overall productivity of cultivated land, as well as improving the soil condition and the fertility of cultivated land, strengthening the investigation and monitoring of cultivated land quality, as well as increasing farmers’ per capita income and GDP per capita. Ecologically, green agriculture should be developed. The Hubei Province should rationally adjust the production structure of agriculture, reduce the load of pesticides per unit area, reduce industrial SO2 and solid waste output, and reasonably delimit cultivated land ecological protection areas, according to the ecological suitability of cultivated land. Finally, the investment in ecological and environmental governance should be increased appropriately.
(2) Differentiated policies should be formulated for the protection of cultivated land in different regions. Western Hubei should strengthen its protection of quantity security and strictly control cultivated land conversion. Central Hubei should focus on strengthening ecological security protection. For example, crop rotation and fallow could be implemented in Xiangyang, Jingzhou and other regions with large areas of cultivated land, as a means to protect the cultivated land ecosystem. Eastern Hubei should strengthen its protection quality and ecological security of cultivated land. Measures should be formulated to protect the quality of cultivated land, and to improve and restore degraded cultivated land. In the meantime, these measures should encompass protecting and rationally utilizing water resources and improving farmland irrigation areas. In regions where the quality security of cultivated land is not high and where the economy is relatively developed, such as Wuhan and Ezhou, farmers should be encouraged to engage in socialized agricultural production services. Finally, large-scale, mechanized and digital operations should be promoted, and priority should be given to the protection of land fertility and appropriately scaled operations.
5.3. Study Limitations
According to the reality of abundant water resources in the Hubei Province, in this study, the index of water resources per unit area of land is selected in the construction of an evaluation index system. This approach, using the comprehensive index method and the obstacle degree model, has a certain novelty compared with other related studies. As can also be seen from the results, water resources per unit of land have an important impact on SCLR. The proposed policy suggestions have certain reference significance for the sustainable utilization of cultivated land resources. However, this study only took 13 prefecture-level cities in the Hubei Province as research objects and only conducted research from the provincial and municipal perspectives. The study fails to study SCLR at the county scale, and policy suggestions have not yet been refined, due to restrictions on the availability of data. In addition, this study only collected statistical data from 2010 to 2019; the authors will continue to collect data with longer time series in the future, in order to better reveal the dynamic changes of SCLR using longer time series. Finally, due to data and technology limitations, only ArcGIS is used for spatial analysis and the visualization of results. Remote sensing data will be used for further research in the future.
In summary, this article aimed to probe the spatio-temporal characteristics and obstacle factors of SCLR in the Hubei Province, including from the perspective of quantity, quality and ecology. However, SCLR is also affected by factors such as cultivated land culture, and in the future, we will conduct further studies on the selection of indicators to improve the index system, and improve the security degree of the cultivated land resource.
Author Contributions
Conceptualization, L.H. and Y.F.; methodology, L.H. and B.Z.; software, Y.F.; validation, B.Z.; formal analysis, B.Z. and L.H.; resources, L.H. and W.H.; data curation, Y.F.; writing—original draft preparation, L.H. and Y.F.; writing—review and editing, L.H. and W.H.; visualization, Y.F. and B.Z.; supervision, L.H.; project administration, L.H. and W.H.; funding acquisition, L.H. All authors have read and agreed to the published version of the manuscript.
Funding
This research was funded by The National Natural Science Foundation of China (grant number 71673105), and Humanities and Social Science Research Funds for Education Department of Hubei Province (grant number, 20D004).
Data Availability Statement
Not applicable.
Conflicts of Interest
The authors declare no conflict of interest.
References
- Fu, Z.Q.; Cai, Y.L.; Yang, Y.X.; Dai, E.F. Research on the relationship of cultivated land change and food security in China. J. Nat. Resour. 2001, 16, 313–319. [Google Scholar]
- Wu, S.C.; Zhou, Z.; Cao, B.M. Production location change, farmland resource dependence and regional food security: A case study of Jiangsu Province. Res. Agric. Mod. 2016, 37, 1061–1067. [Google Scholar]
- Zhu, H.B. The connotation and theoretical basis of cultivated land resource security. Sci. Technol. Manag. Land Resour. 2008, 25, 26–29. [Google Scholar]
- Gao, N.; Song, G. Comprehensive evaluation on security of cultivated land resources of Heilongjiang. J. Soil Water Conserv. 2009, 16, 250–254. [Google Scholar]
- Feng, Q.; Niu, Z.J.; Yuan, D.P.; Shi, Y.; Wang, S.T. Safety evaluation and prediction of cultivated land resource in Hebei Province. Chin. J. Soil Sci. 2017, 48, 1061–1068. [Google Scholar]
- Christiansen, F. Food security, urbanization and social stability in China. J. Agrar. Chang. 2009, 9, 548–575. [Google Scholar] [CrossRef]
- Zhang, J.K.; Zhang, F.R.; Zhang, D.; Wu, C.G.; An, P.L. The capacity of grain production on arable land in 2004 in China. Resour. Sci. 2006, 28, 44–51. [Google Scholar]
- Liu, Y.; Liu, Y.S.; Guo, L.Y. Comprehensive evaluation and optimization strategy of the territorial function for grain production: A case of the area along Bohai Rim in China. Prog. Geogr. 2010, 29, 920–926. [Google Scholar]
- Zhao, Q.G.; Zhou, B.Z.; Yang, H.; Liu, S.L. Some considerations on safety of arable land resources in China: Problems and counter-measures. Soils 2002, 34, 293–302. [Google Scholar]
- Song, W.; Chen, B.M.; Shi, W.J.; Wu, J.Z. Evaluation for cultivated land resource security of China in 2007. Prog. Geogr. 2011, 30, 1449–1455. [Google Scholar]
- Gardi, C.; Panagos, P.; Liedekerke, M.V.; Bosco, C.; Brogniez, D.D. Land take and food security: Assessment of land take on the agricultural production in Europe. J. Environ. Plan. Manag. 2014, 58, 898–912. [Google Scholar] [CrossRef]
- Mora, O.; Moul, C.L.; Lattre-Gasquet, M.D.; Donnars, C.; Martyet, P. Exploring the future of land use and food security: A new set of global scenarios. PLoS ONE 2020, 15, e0235597. [Google Scholar] [CrossRef]
- Kumar, M.D.; Sivamohan, M.V.K.; Narayanamoorthy, A. The food security challenge of the food-land-water nexus in India. Food Secur. 2012, 4, 539–556. [Google Scholar] [CrossRef]
- Ashok, K.; Natarajan, R.; Kumar, P.; Sharma, K.; Mathur, M. Sustainable Alternative Futures for Agriculture in India—The energy, emissions, and resource implications. Environ. Res. Lett. 2021, 16, 064001. [Google Scholar] [CrossRef]
- Greene, R.P.; Stager, J. Rangeland to cropland conversions as replacement land for prime farmland lost to urban development. Soc. Sci. J. 2001, 38, 543–555. [Google Scholar] [CrossRef]
- Gibson, G.R.; Campbell, J.B.; Zipper, C.E. Sociopolitical influences on cropland area change in Iraq, 2001–2012. Appl. Geogr. 2015, 62, 339–346. [Google Scholar] [CrossRef]
- Pool, D.B.; Panjabi, A.O.; Macias-Duarte, A.; Solhjem, D.M. Rapid expansion of croplands in Chihuahua, Mexico threatens declining North American grassland bird species. Biol. Conserv. 2014, 170, 274–281. [Google Scholar] [CrossRef]
- Arowolo, A.O.; Deng, X. Land use/land cover change and statistical modelling of cultivated land change drivers in Nigeria. Reg. Environ. Chang. 2018, 18, 247–259. [Google Scholar] [CrossRef]
- Biazin, B.; Sterk, G. Drought vulnerability drives land-use and land cover changes in the Rift Valley dry lands of Ethiopia. Agric. Ecosyst. Environ. 2013, 164, 100–113. [Google Scholar] [CrossRef]
- Akinyemi, F.O. Land change in the central Albertine rift: Insights from analysis and mapping of land use-land cover change in north-western Rwanda. Appl. Geogr. 2017, 87, 127–138. [Google Scholar] [CrossRef]
- Montanarella, L.; Panagos, P. The relevance of sustainable soil management within the European Green Deal. Land Use Policy 2021, 100, 104950. [Google Scholar] [CrossRef]
- Zambon, I.; Colantoni, A.; Carlucci, M.; Morrow, N.; Sateriano, A.; Salvati, L. Land quality, sustainable development and environmental degradation in agricultural districts: A computational approach based on entropy indexes. Environ. Impact Assess. Rev. 2017, 64, 37–46. [Google Scholar] [CrossRef]
- Eagle, A.J.; Eagle, D.E.; Stobbe, T.E.; Kooten, G.C.V. Farmland protection and agricultural land values at the urban-rural fringe: British Columbia’s agricultural land reserve. Am. J. Agric. Econ. 2015, 97, 282–298. [Google Scholar] [CrossRef] [Green Version]
- Menichetti, L.; Touzot, L.; Elofsson, K.; Hyvönen, R.; Kätterer, T.; Kjellander, P. Interactions between a population of fallow deer (Dama dama), humans and crops in a managed composite temperate landscape in southern Sweden: Conflict or opportunity? PLoS ONE 2019, 14, e0215594. [Google Scholar] [CrossRef] [PubMed] [Green Version]
- Pietro, F.D. Assessing ecologically sustainable agricultural land-use in the Central Pyrénées at the field and landscape level. Agric. Ecosyst. Environ. 2001, 86, 93–103. [Google Scholar] [CrossRef]
- Wang, F.; Feng, Y.F.; Zhuo, L.; Zhou, T. Comprehensive evaluation of arable land security in metropolitan suburbs using projection pursuit model based on improved genetic algorithms. Trop. Geogr. 2013, 33, 373–380. [Google Scholar]
- Liu, S.H.; Peng, C. Research on cultivated land resources security in Hubei Province, 2005—2014. Hubei Soc. Sci. 2016, 11, 53–58. [Google Scholar]
- Wu, Y.F.; Xu, Y.; Xu, G. Spatio-temporal characteristics in cultivated land resources security in Anhui Province. Bull. Soil Water Conserv. 2017, 37, 236–241. [Google Scholar]
- Kuang, L.H.; Ye, Y.C.; Zhao, X.M.; Guo, X. Evaluation and obstacle factor diagnosis of cultivated land system security in Yingtan city based on improved TOPSIS method. J. Nat. Resour. 2018, 33, 1627–1641. [Google Scholar]
- Li, N.; Wang, J.K.; Pei, J.B. Evaluation on arable resource security in Liaoning based on Catastrophe Progression Method. China Popul. Resour. Environ. 2012, 22, 153–157. [Google Scholar]
- Song, G.; Li, X.J.; Xiang, C.Y.; Xue, R.; Zhang, X.L. Driving forces and security of cultivated land resource in black soil zone of Songnen high plains—A case of Bayan County, Heilongjiang Province. Bull. Soil Water Conserv. 2012, 32, 213–218. [Google Scholar]
- Liu, X.; Diao, C.T.; Huang, J.; Huang, Q. Evaluation of the security of regional land resources—A case study of Chongqing City. Bull. Soil Water Conserv. 2006, 26, 57–61. [Google Scholar]
- Ren, J.Q.; Sun, P.; Yu, H. Evaluation of cropland resource security based on PSR and entropy methods: A case study of Liaoyang County, Liaoning Province. Sci. Technol. Manag. Land Resour. 2014, 31, 14–17. [Google Scholar]
- Cai, Y.Y.; Luo, C. Ecological security condition of cultivated land resources and spatial agglomeration pattern of in Jianghan Plain. J. Huazhong Agric. Univ. 2015, 5, 110–120. [Google Scholar]
- Li, D.; Liu, D.D.; Mei, X.D. Security classification and regional differentiation of cultivated land resource in Nangjing county based on Raster. Res. Soil Water Conserv. 2017, 24, 140–144. [Google Scholar]
- Yang, G.S. The process and driving forces of change in arable land area in the Yangtze River Delta during the past 50 years. J. Nat. Resour. 2001, 16, 121–127. [Google Scholar]
- Xu, Y.Q.; Li, X.B. Analysis on dynamic change and driving forces of farmland in Hebei Province. Resour. Sci. 2001, 23, 28–32. [Google Scholar]
- Xu, X.L.; Cai, Y.M.; Zhang, K.L.; Zheng, W.Y. Study on dynamic changes of cultivated land resources and cause of changes. China Popul. Resour. Environ. 2005, 15, 75–79. [Google Scholar]
- Guo, Y.W.; Zhao, M.J. Analysis on societal and economic driving forceful changes in area of cultivated land of Shaanxi Province based on STIRPAT model. Res. Soil Water Conserv. 2012, 19, 197–201. [Google Scholar]
- Zhu, H.B.; Zhang, A.L. Analysis on the differences of cultivated land resource quantity security in time and space in China. Chin. Popul. Resour. Environ. 2006, 16, 113–117. [Google Scholar]
- Zhu, H.B.; Zhang, A.L. Analysis on spatial-temporal difference in ecological security of cultivated land resources in China. Resour. Environ. Yangtze River Basin 2007, 16, 754–758. [Google Scholar]
- Xiong, Y.; Wang, K.L.; Guo, X. A study on correlation of dynamic change of cultivated land and economic development in Hunan province. Geogr. Geo Inf. Sci. 2003, 19, 69–72. [Google Scholar]
- Zou, J.; Long, H.L. The variation of farmland use and the security pattern of grain production in China since 1978. J. Nat. Resour. 2009, 24, 1366–1377. [Google Scholar]
- Chen, C.; Lv, C.H. An analysis on the variation of farmland quality using an integrated index approach in Hubei Province. J. Nat. Resour. 2010, 25, 2018–2029. [Google Scholar]
- Chen, L.; Hu, Y.; Han, X.P.; Guo, X.Y. The quantitative comparative analysis of food production and contributions of major grain production areas in national food security. China Land Sci. 2017, 31, 34–42. [Google Scholar]
- Tan, S.K.; Han, S.Y.; Zhang, L. Study on fallow scale and dynamical simulation of major grain producing areas in China from the food security perspective. China Land Sci. 2020, 34, 9–17. [Google Scholar]
- Jiang, W.Y.; Zhao, S.Z.; Liu, D.; Wang, L.F. A dimensionless method for quantitative indicators of large sample evaluation. Stat. Decis. 2012, 17, 4–9. [Google Scholar]
- Liu, Q.Q.; Chen, Y. Assessing the vulnerability of basin water resources based on entropy weight method: A case study of Huaihe River Basin. J. Yangtze River Sci. Res. Inst. 2016, 33, 10–17. [Google Scholar]
- Huang, L.J.; Yang, P. Spatio-temporal evolution characteristics and influencing factors of land ecological security in the Yangtze river economic belt. Resour. Environ. Yangtze Basin 2019, 28, 1780–1790. [Google Scholar]
- Wu, Z.H.; Li, T. The comprehensive performance evaluation of the high-tech development zone: Analysis based on the natural breakpoint method. Stat. Inf. Forum 2013, 28, 82–88. [Google Scholar]
- Li, X.G.; Wu, L.; Wu, Q.; Zhou, Y. Evaluation on tourism ecological security and diagnosis of its obstacle indictators in China. Ecol. Econ. 2017, 33, 90–95. [Google Scholar]
- Zhao, M.D.; Ma, Y.H.; Shi, L.J.; Wang, J. Research on resources and environmental carrying capacity of Guanzhong urban agglomeration under the background of spatial planning. J. Saf. Environment. 2021, 21, 1–11. [Google Scholar]


Publisher’s Note: MDPI stays neutral with regard to jurisdictional claims in published maps and institutional affiliations. |
© 2021 by the authors. Licensee MDPI, Basel, Switzerland. This article is an open access article distributed under the terms and conditions of the Creative Commons Attribution (CC BY) license (https://creativecommons.org/licenses/by/4.0/).