Article

Decarbonizing the Cold Chain: Long-Haul Refrigerated Deliveries with On-Board Photovoltaic Energy Integration

DPIA-Polytechnic Department of Engineering and Architecture, University of Udine, Via delle Scienze 206, 33100 Udine, Italy
*
Author to whom correspondence should be addressed.
Sustainability 2021, 13(15), 8506; https://doi.org/10.3390/su13158506
Submission received: 17 June 2021 / Revised: 26 July 2021 / Accepted: 27 July 2021 / Published: 29 July 2021
(This article belongs to the Special Issue Sustainability in Logistics and Supply Chains)

Abstract

:
Decarbonizing the cold chain is a priority for sustainability due to the increasing demand for chilled/frozen food and pharmaceutics. Refrigerated transport requires additional fuel for refrigeration other than for traction. Photovoltaic panels on the vehicle rooftop, a battery bank, and a power conversion system can replace the diesel engine driving the transport refrigerated unit. In long-haul deliveries, vehicles cross zones with different climate conditions, which affect both refrigeration requirements and photovoltaic energy conversion. Mandatory driver’s breaks and rest also affect delivery timing and energy consumption. A multiperiod, multizone optimization model is developed to size the onboard photovoltaic system, based on features of the delivery tour. The model is applied to a palletized chilled food delivery from North-Eastern Italy, showing a payback time of around four years, which can drop under two years for expected reduction of component costs. Economic and environmental performances can be increased by also allowing refrigerated products on-board during the return journey, leading to more fuel savings. Photovoltaic-integrated long-haul delivery for frozen products is not convenient at current market costs. Different climate conditions are tested, showing the model ability to act as a decision support tool to foster renewable energy penetration into the cold chain.

1. Introduction

Consumption of chilled and frozen food has been continuously increasing due to accelerating pace of modern life, which leads consumers to save time for preparing meals, thus favoring ready-to-use goods, and for fresh product shopping. The latter pattern has increased even more currently due to the COVID-19 pandemic. The prolonged shelf life of refrigerated packaged food has allowed consumers to rely on home stocking, thus recording a two-digit sale growth in Europe during 2020 when pandemic spread out [1]. Given the current pandemic situation, the cold transport market is also supposed to face a massive demand from the pharmaceutical industry, due to the need for extensive COVID vaccination of the population worldwide [2]. Since the transport sector is one of the major contributors to global energy consumption and total GHG emissions (31% and 27% in EU, respectively [3], with heavy-duty road transport accounting for 19% of such emissions [4]), the related impact on sustainable development should be managed.
Fuel consumption in refrigerated transport covers not only traction requirements, but also the refrigeration ones, with significant potential of energy saving and GHG emissions reduction among all processes in cold chains [5]. The required internal vehicle temperature set by the cold chain manager to preserve product quality and safety is commonly obtained by transport refrigerated units (TRU) installed on insulated cargo vans. In heavy transport, TRUs are mainly based on a vapor compression system driven by an auxiliary diesel engine with coefficients of performance (COP) lower than stationary systems [6]. Removing the diesel engine in favor of a battery-based system has been suggested to foster sustainability into the cold chains of the future [7]. We argue that fossil fuel for operating the TRU can be replaced not only by electric energy supply from the grid to charge the battery, but also by renewable energy converted on-board, in order to drastically reduce GHG emissions of refrigerated transport.
Photovoltaic (PV) energy penetration into the cold chain has already been investigated in [8], where PV installation on the rooftop of automated warehouses was modeled. Since PV energy can replace a significant amount of refrigeration energy to be purchased from the grid, both economical and environmental benefits are gained by the storage facility. These can also be exploited by the cold chain manager to achieve more flexibility on selecting the storage and incoming product temperatures at the various stages of the supply chain, thus affecting the overall sustainability performance.
Concerning PV application to the transport sector, most attention has been paid to battery recharge of electric vehicles in stationary plants at different spatial scales, such as individual houses, commercial buildings and workplaces (e.g., [9,10]), charging stations/parking lots ([11,12]), and territories (see [13,14,15,16]). Smart control strategies to adapt to variable PV generation have been developed [17] and the role of subsidies in promoting the PV market investigated [18]. The rapid development of PV applications has also driven research attention to the issue of increasing the PV energy extracted from PV panels at different environmental conditions, as in MPPT (maximum power point tracking) algorithms (see [19] for a recent literature review) and suitable low-cost embedded boards for their implementation (see [20,21,22,23]). Some applications of PV panels installed directly on-board of the vehicles have been investigated as auxiliary power source for propulsion (e.g., [24,25,26]) or for air conditioning, guidance services, and TV power for urban buses (see [27,28]). Considering refrigeration, the first prototype of a solar system driven TRU, namely Solar Trailer [29], was proposed for chilled food delivery in London [30], but showed a payback period greater than 15 years [31]. More recent studies involve PV prototypes of small vehicles in developing countries for food [32] or vaccine [33] distribution, in order to exploit a free and abundant energy source.
In [34], a renewable-integrated delivery by refrigerated semitrailers with PV panels on the rooftop has been recently investigated. The diesel engine and dedicated fuel tank to operate the TRU is replaced by the PV system, also involving a Li-ion battery bank as support and a power conversion system. The system is sized by a multiperiod optimization model, which takes into account the refrigeration requirements and PV energy conversion along the delivery process. Both can vary along the day and year based on climate conditions of the region and the features of the delivery tour.
However, when moving from a regional delivery process as addressed in [34] to one that is long-haul, two additional issues should be considered to properly assess the feasibility of removing the diesel engine in favor of a PV system to operate the TRU. First, when the delivery tour embraces long travel distances, the vehicle can cross different climate zones, facing different outdoor temperatures and solar irradiance. Therefore, an optimization model for system sizing should not only be multiperiod, in order to take into account daily and seasonality variation of climate conditions, but also multizone. Second, stops are no longer devoted only to visit clients, but also to comply with mandatory rest periods for the driver, so that the delivery graph is modified. It should also be considered that the configuration of the return journey to the depot can affect the feasibility of the PV system. If the vehicle is empty and travels with refrigeration off, then the PV energy generated during the whole return journey can be used to charge the battery. Otherwise, when a complementary business is introduced in order to exploit a full truck load, the PV system should counterbalance refrigeration requirements even when coming back to the depot, but in this case avoided fuel costs and GHG emissions for the diesel-driven TRU can be maximized.
Therefore, in this study a novel multiperiod, multizone optimization model is proposed to size the PV system operating the TRU, in order to address the specific issues of long-haul deliveries described above. Thus, the feasibility of PV integration in refrigerated transport can be derived, linking the long-haul delivery process characteristics (such as travel distance, climate zones, client stops, driver’s rest periods, return configuration) to potential system performance in terms of energy requirements and renewable generation. Sensitivity analysis is performed on delivery features such as the internal temperature to be maintained in the refrigerated space to preserve food safety and quality, and different climate zones that can be encountered when departing from the same depot location. To further test the ability of the model to act as a decision support tool for the company and the cold chain manager, the effect of coupling the forward journey with another delivery when returning is also investigated.
The paper is structured as follows. In Section 2, the long-haul refrigerated delivery with PV integration is modeled in order to optimally size the TRU operating system. In Section 3, results for application to a reference case are reported, together with sensitivity analysis on different parameters. Finally, discussion and conclusions are provided in Section 4 and Section 5, respectively.

2. Modeling the Long-Haul Refrigerated Delivery with PV Integration

In this section, the long-haul refrigerated transport with PV integration is modeled in order to derive the optimal size of the PV system, which should replace the diesel engine of the TRU. In Section 2.1 that follows, the long-haul delivery graph is defined, while in Section 2.2 the constraint programming model to optimally size the PV system is proposed.

2.1. The Long-Haul PV Refrigerated Delivery Graph

In a long-haul delivery, a vehicle departs from the depot and visit all the clients located in different geographical areas, before coming back to the depot. Unlike [34], where customers were close and therefore exposed to the same climate, in this case the vehicle will face different temperature and solar irradiance conditions during its delivery tour. These affect both the energy required by the TRU and the energy that the PV panels on the vehicle rooftop are able to generate. Therefore, not only input data for different time slots are needed to account for different external climatic conditions throughout the day and the year, but also location-related patterns.
Another important consequence of long-haul delivery with respect to a regional delivery is that transport sector regulations requiring the driver to stop and rest cannot be neglected. These stops affect the duration of the tour, thus on the energy generated during rest periods and on the additional demand for refrigeration. Referring to European Regulation (Regulation (EC) No 561/2006), the daily driving time should not exceed nine hours, breaks of at least 45 min (separable into 15 min followed by 30 min) should be taken after 4.5 h at the latest, and a daily rest period of at least 11 h should be granted to the driver before another working shift.
The long-haul delivery tour can be represented by the typical routing graph notation of the RRP (refrigerated routing problem) [35,36], in which, however, a node i no longer identifies only the depot (gray colored in Figure 1) or a client location (green colored in Figure 1). In order to account for the different climatic conditions the vehicle is expected to face along the journey, dummy nodes (blue colored in Figure 1) are introduced. They further divide the route into travel slots corresponding to the expected distance per hour covered by a semitrailer, when driving along highways at the speed limit. Climatic conditions of the region reached by the vehicle are assigned to every travel slot and are kept constant up to the next node. Moreover, considering the driving stops required by legislation, stop nodes are created to identify the driving breaks, the lunch break, and the daily rest along the route (red colored in Figure 1).
Nodes and edges are associated with attributes, such as energy generation from the PV panels on the vehicle rooftop and refrigeration requirements, both depending on climate characteristics to which the vehicle is exposed along the route. Refrigeration requirements can be mainly ascribed to transmission and infiltration loads to be counterbalanced along the journey. The former is the heat entering the refrigerated space through the walls of the vehicle, due to the difference between outdoor temperature and the one inside the vehicle. Thus, energy requirements for transmission are recorded both at client/break stops and when traveling (namely E_transmission in Figure 1). Infiltration load, instead, is mainly related to air exchange at door openings during unloading operations. Therefore, energy requirements for infiltration (namely E_infiltration in Figure 1) are ascribed only to client nodes. An exclusive attribute of the client nodes is also the time for the unloading activity at open doors (t_opening in Figure 1), mainly ascribed to the quantity to be delivered. The edges are also described by the travel distance (d), which can be covered with a speed variable along the day and the year due to traffic congestion, thus affecting the travel time and in turn energy demand (E_transmission) and conversion (E_PV). Potential traction fuel savings for reduced vehicle curb weight due to the replacement of the diesel-driven system with the new photovoltaic one (namely fuel_save in Figure 1) become edge attributes too, mostly depending on travel distance.

2.2. Optimal PV System Size: The Constraint Programming Model

A constraint programming (CP) model was developed in order to effectively size the PV system in terms of number of PV panels on the rooftop (n_pv), number of modules for the battery energy storage system (n_bess), and for the power conversion system (n_pcs) needed to satisfy refrigeration requirements of the delivery tour. Adopting standardized modules with given specifications allows the model to resemble the typical approach for custom-sized products, as the proposed PV system powering the TRU can be considered. Moreover, it exploits reasoning capabilities of constraint programming on discrete variables, as embedded in the solvers developed by the CP research community [37].
Since the feasibility of renewable energy integration in refrigerated transport should be evaluated, a minimum yearly cost objective function was selected and reported in Equation (1).
min (c_pv ⋅ n_PV + c_bess ⋅ n_bess + c_pcs ⋅ n_pcs + operation_costs)
operation_costs = charge_cost + maintenance_cost − fuel_savings
The investment costs per module of each PV system component (c_pv, c_bess, and c_pcs in Equation (1)) are annualized. The operation costs (see Equation (1), the second row) can be split into three main components: (1) the cost for battery charging from the grid; (2) the maintenance cost valued per power unit for PV panels and PCS, as common in practice; and (3) fuel savings, to be accounted whenever the PV system has a lighter weight in comparison to the replaced diesel engine and dedicated fuel tank.
The main constraints of the model essentially match energy refrigeration requirements with energy supply from the PV system to the TRU, sizing the system consequently. In a long-haul delivery tour, energy flows at each node i and departing edge strictly depend on climate conditions of the location l[i], which also vary along with the day and the year. As a consequence, a multizone, multiperiod model is needed and index k is used in the following equations to identify the period of the day and the year, which are associated with outdoor temperature and solar irradiance. Index k can also be used for traffic congestion variable during a day and the year. All energy flows not depending on PV system size (e.g., refrigeration requirements) can be preprocessed for a given route and start-time of the tour. We refer the interested reader to [35] for equations to specifically derive transmission and infiltration requirements along a refrigerated delivery tour, and to [34] for equations estimating the efficiency of photovoltaic generation by rooftop panels, which is related to outdoor temperature and in-plane solar irradiance at each location and time slot. All preprocessed parameters are set in plain text in model equations together with all the other input data, while auxiliary variables are reported in italic font.
Equation (2) sets the photovoltaic energy (E_PV) generated by PV panels on the vehicle rooftop at node i and along its departing edge on the basis of energy efficiency (effPV), the nominal power at standard test condition per panel (PSTC), and total delivery time (tdelivery). The last is calculated as the sum of stop time at the node plus travel time toward its successor for client and driving break nodes, while a null stop time is accounted for dummy nodes (see Figure 1). Energy efficiency of PV panels depends on in-plane global irradiance, outdoor temperature, local wind speed for stop and rest periods, and vehicle velocity when traveling, thus is both zone and period dependent. It can be calculated by relations proposed in [38,39].
E _ P V [ l [ i ] , k ] = ( eff PV [ l [ i ] , k ] · P STC · n _ p v ) · t delivery [ i , k ]
The PV energy is then used to operate the TRU (E_PVtru) and/or to charge the battery whenever in excess (E_PVbess), as set by Equation (3).
E _ P V [ l [ i ] , k ] = E _ P V t r u [ l [ i ] , k ] + E _ P V b e s s [ l [ i ] , k ]
Equation (4) gives the refrigeration requirements (E_refr in the following figures), split into transmission and infiltration, that should be covered by the PV system with photovoltaic energy directly operating the TRU and with additional energy supplied by the battery (E_bess). It should be noted that infiltration requirements are accounted only for client nodes, where vehicle doors are opened for unloading operations, while are null for stop and dummy nodes (see Figure 1).
E _ P V t r u [ l [ i ] , k ] + E _ b e s s [ l [ i ] , k ] = E _ transmission [ l [ i ] , k ] + E _ infiltration [ l [ i ] , k ]
The power conversion system is sized in order to manage all the energy flows from PV panels or the battery bank for each node and related edge of the delivery tour with a given efficiency (effPCS), as set in Equation (5).
E _ P V [ l [ i ] , k ] + E _ b e s s [ l [ i ] , k ] ( eff PCS · P PCS · n _ p c s ) · t delivery [ i , k ]
The battery bank is sized so that its total storage capacity, considering a given efficiency effBESS, a maximum discharge depth dodBESS, and a modular capacity CBESS, can provide energy integration during the whole delivery tour (Equation (6)).
i E _ b e s s [ l [ i ] , k ] eff BESS · dod BESS · C BESS · n _ b e s s
The energy to be supplied from the grid to charge the battery (E_charge), which varies for each period of the year and contributes to yearly operation costs in the objective function, is calculated by reducing energy demand with the PV energy stored during both the delivery tour (E_PVbess) and the rest period of the vehicle at the depot (E_PVrest), as shown in Equation (7).
E _ c h a r g e [ k ] = ( i ( E _ b e s s [ l [ i ] , k ] E _ P V b e s s [ l [ i ] , k ] ) - E _ P V r e s t [ k ] ) / eff BESS
Finally, potential fuel savings for traction due to expected lower curb weight of the vehicle when removing the diesel engine and its dedicated fuel tank, which are taken into account in the objective function at current market value (see Equation (1), the second row), can be calculated as reported in Equation (8):
f u e l _ s a v e = A · ( w diesel w PV · n p v w BESS · n b e s s w PCS · n _ p c s ) · i d [ i ]
where wdiesel is the weight of the removed diesel engine and fuel tank; wPV, wBESS, and wPCS is the weight per module of each PV system component; and A [L/(kg km)] is the coefficient of the weight component of the CMEM model [40], adopted in routing problems to assess fuel consumption [41]. The last term accounts for the total travel distance of the delivery tour.

3. Results

In order to investigate how the proposed optimization model is able to support the feasibility analysis of long-haul deliveries with PV integration, a case study is introduced with related results in Section 3.1. A sensitivity analysis on component costs is also provided in Section 3.1.1. and a worst case analysis given in Section 3.1.2. In Section 3.2, a sensitivity analysis on features of the delivery tour is performed. In particular, the impact on PV system size and profitability of a much lower internal temperature, as required by frozen food, is considered in Section 3.2.1. Different long-haul destinations, with different climate zones to be crossed by the refrigerated vehicle, are investigated in Section 3.2.2. Finally, a fully loaded vehicle even in the return journey is considered in Section 3.2.3, coupling the original tour of the basic scenario with a complementary refrigerated business from the last client to the depot.

3.1. Basic Scenario

As a case study to test the model effectiveness for long-haul deliveries, the sizing of a photovoltaic system was analyzed for a typical semitrailer dedicated to delivering refrigerated palletized food to a network of three customers located in Bologna, Arezzo, and Rome, starting from a warehouse located in Gorizia (North-Eastern Italy).
The vehicle leaves the depot (node 1) at 6:00 a.m. with loads already on-board and closed doors, then proceeds on its journey according to a previously identified tour. Finally, it returns to the depot empty and with refrigeration off, as common in practice.
The circuit involves not only the depot and customer nodes, but also dummy and stop nodes (see Section 2.1). In particular, 15 dummy nodes were included to account for changing outdoor conditions, approximately every 80 km (i.e., one travel hour at an average speed of 80 km/h, as typical for heavy vehicles on highways). The same route is considered for both the forward and the backward journey. Furthermore, three stop nodes were added to include mandatory break and rest periods for the driver, giving a total of 22 nodes (see Figure 2).
The total elapsed time required by the vehicle to reach the last client node is approximately 11 h. Considering both the unloading time and the driver’s daily rest, the return journey is conveniently supposed to restart the following day, at 6:00 a.m. Therefore, the duration of the entire delivery tour is 32 h, spread over two days. During the first day, deliveries are performed and refrigeration is needed, while in the second day the vehicle is empty and all the PV energy is used to recharge the battery. Moreover, the vehicle is supposed to rest outdoors during stops and daily rest; whenever solar irradiance is available, PV energy conversion is fully exploited for battery recharge.
Each customer has a demand equal to 11 palletized unit loads, for a total of 33 unit loads to be delivered per tour, which must be kept at a temperature of 0 °C to avoid deterioration. Concerning the outdoor climate conditions, average hourly data for a typical day per each month of the year were considered for every location. For each time slot, the corresponding temperatures and global solar irradiance values for the nine locations were retrieved from the CMSAF database of the Photovoltaic Geographical. Information System (PVGIS) developed by the Joint Research Center of the European Commission [42]. A total of 288 potential time slots were created, activated on the basis of the delivery tour start time, stop time at client for unloading operations, mandatory stop times, and travel times, and related to the specific location of each node. For technical data relating to the semitrailer and the photovoltaic system modules, together with the specific costs for objective function valorization, we refer to [34]. Investments were annualized considering 10 years as lifetime and 4% interest rate for all PV system components.
The model was coded in MiniZinc [43] and solved by Gecode. For the basic configuration, the run time on a Windows 10, 64-bit Intel Core i7 8 GB RAM laptop was 1 s.
The optimal system selected by the model involves 7 PV panels, covering 52% of the available vehicle rooftop surface, 12 battery modules for a total of 12 kWh storage capacity, and 10 PCS modules for 5 kW nominal power. In Figure 3, energy requirements and supply are reported for the whole delivery tour in each month of the year, so that dependence on seasonal climate conditions can be appreciated. Both refrigeration demand and PV energy conversion increase moving from winter to summer periods, peaking in July. Globally, the PV panels can cover around 63% of the refrigeration requirements for palletized fresh food, while the remaining part is provided by the battery, as reported in Table 1, where average results per trip during the whole year are summarized. The energy required by the battery also increases during the summer, peaking in August. However, no energy supply from the grid is needed, since the PV system is able to completely recharge the battery with energy generated during rest and especially the return journey, when it is no longer necessary to operate the refrigeration unit. Moreover, for winter and spring months, the battery is fully recharged at every delivery tour, but not all of its capacity is required to fulfill refrigeration requirements of the next journey. Therefore, new strategies can be adopted to exploit PV energy generated on-board, such as also covering HVAC requirements of the vehicle cabin. Vehicle-to-home options can be also exploited when coming back to the depot, e.g., for maintaining the refrigeration space temperature during loading activities before vehicle departure for the delivery tour.
The energy and refrigeration requirements also vary from node to node, as different geographical areas and climate conditions are encountered (see Figure 4), together with varying travel and stop times (see Table 2). In particular, the first nodes are located in Northern Italy and covered in the early hours of the day, therefore exposed to low temperatures, implying low values of both refrigeration requirements and PV energy conversion. As the tour proceeds southward, more favorable conditions are met for PV energy generation, but at the same time the demand for refrigeration increases.
In summer months, the energy generated by PV is used totally for refrigeration. Only during the return journey (nodes from 14 to 22), when the refrigeration is off, the energy is devolved to battery charging (see July results in Table 2). Otherwise (see March columns in Table 2), a nonzero amount of energy can be allocated to charge the battery, but always first supplying the refrigeration. The battery comes into action at client locations (see nodes 5 and 9, highlighted in gray in Table 2), where it is necessary to counterbalance infiltration load during drop-off operations, and at the initial nodes in the route, when the early hours of the morning together with northern locations lead to low solar irradiance (see Figure 4).
Since no energy supply comes from the grid, GHG emissions from fossil fuel combustion are entirely eliminated when the diesel fuel engine is replaced by the PV panels and battery for powering the refrigeration unit (see Table 1). About 2055 kgCO2eq per vehicle can be saved yearly, when taking a well-to-wheel emission factor for diesel of 3.2 kgCO2eq/L [44].
The PV panels represents 49% of total investment cost, while the battery and PCS are 32% and 19%, respectively (see Table 3). Switching the TRU power system from fossil to the renewable-driven energy also leads to fuel savings for traction due to a lighter configuration of the vehicle, which allows lower weight-related consumption. Furthermore, a decrease in total TRU maintenance cost can be estimated for the PV-driven TRU, with a reported value of EUR 0.30 per operating hour [42]. At current costs, the payback period is approximately 4.6 years, without taking into account additional savings for alternative battery exploitation in winter and spring.

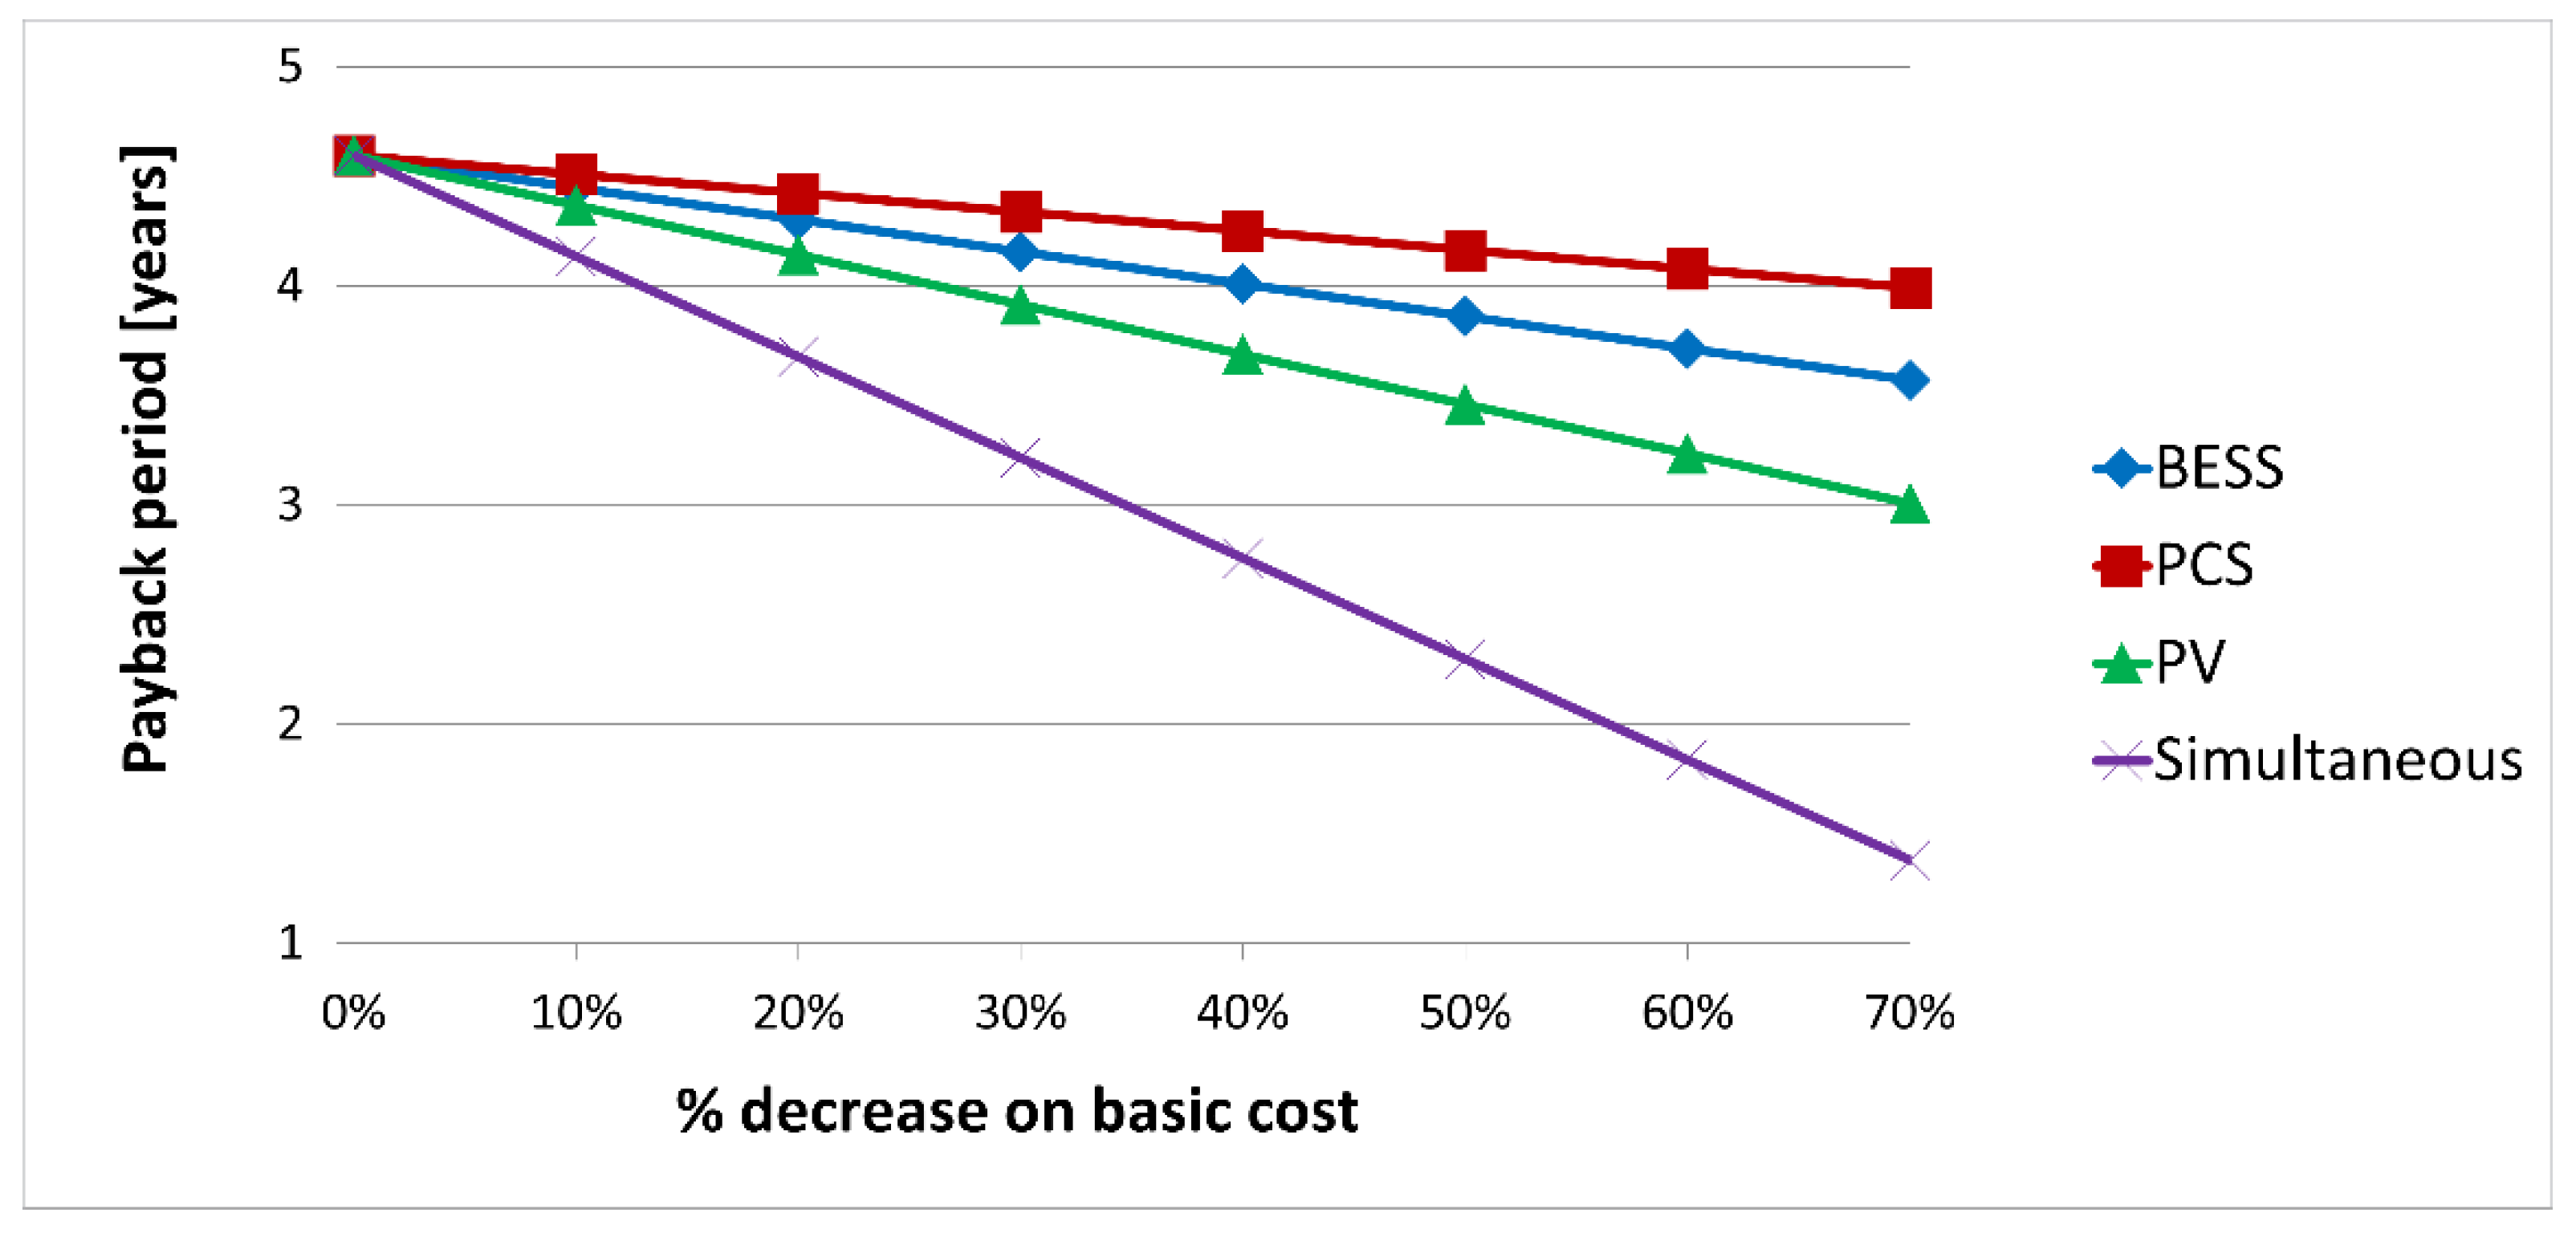
3.1.1. Sensitivity Analysis on Component Costs

Given that the renewable energy market is rapidly evolving, Figure 5 shows a sensitivity analysis on each PV system component cost reported for potential percentage decrease during the next ten years, based on forecasts by [45,46,47]. For a simultaneous decrease of all three components, the payback of the PV system can be drastically reduced to 1.38 years in the best-case scenario (purple line, Figure 5). The decrease of component costs also affects the optimal configuration of the system. Considering a simultaneous decrease of all the components, for a cost reduction of 25% the optimal configuration changes to 8 PV panels, 11 battery modules, and 10 PCS modules. Thus, renewable energy is further exploited and more sustainable solutions are suggested.

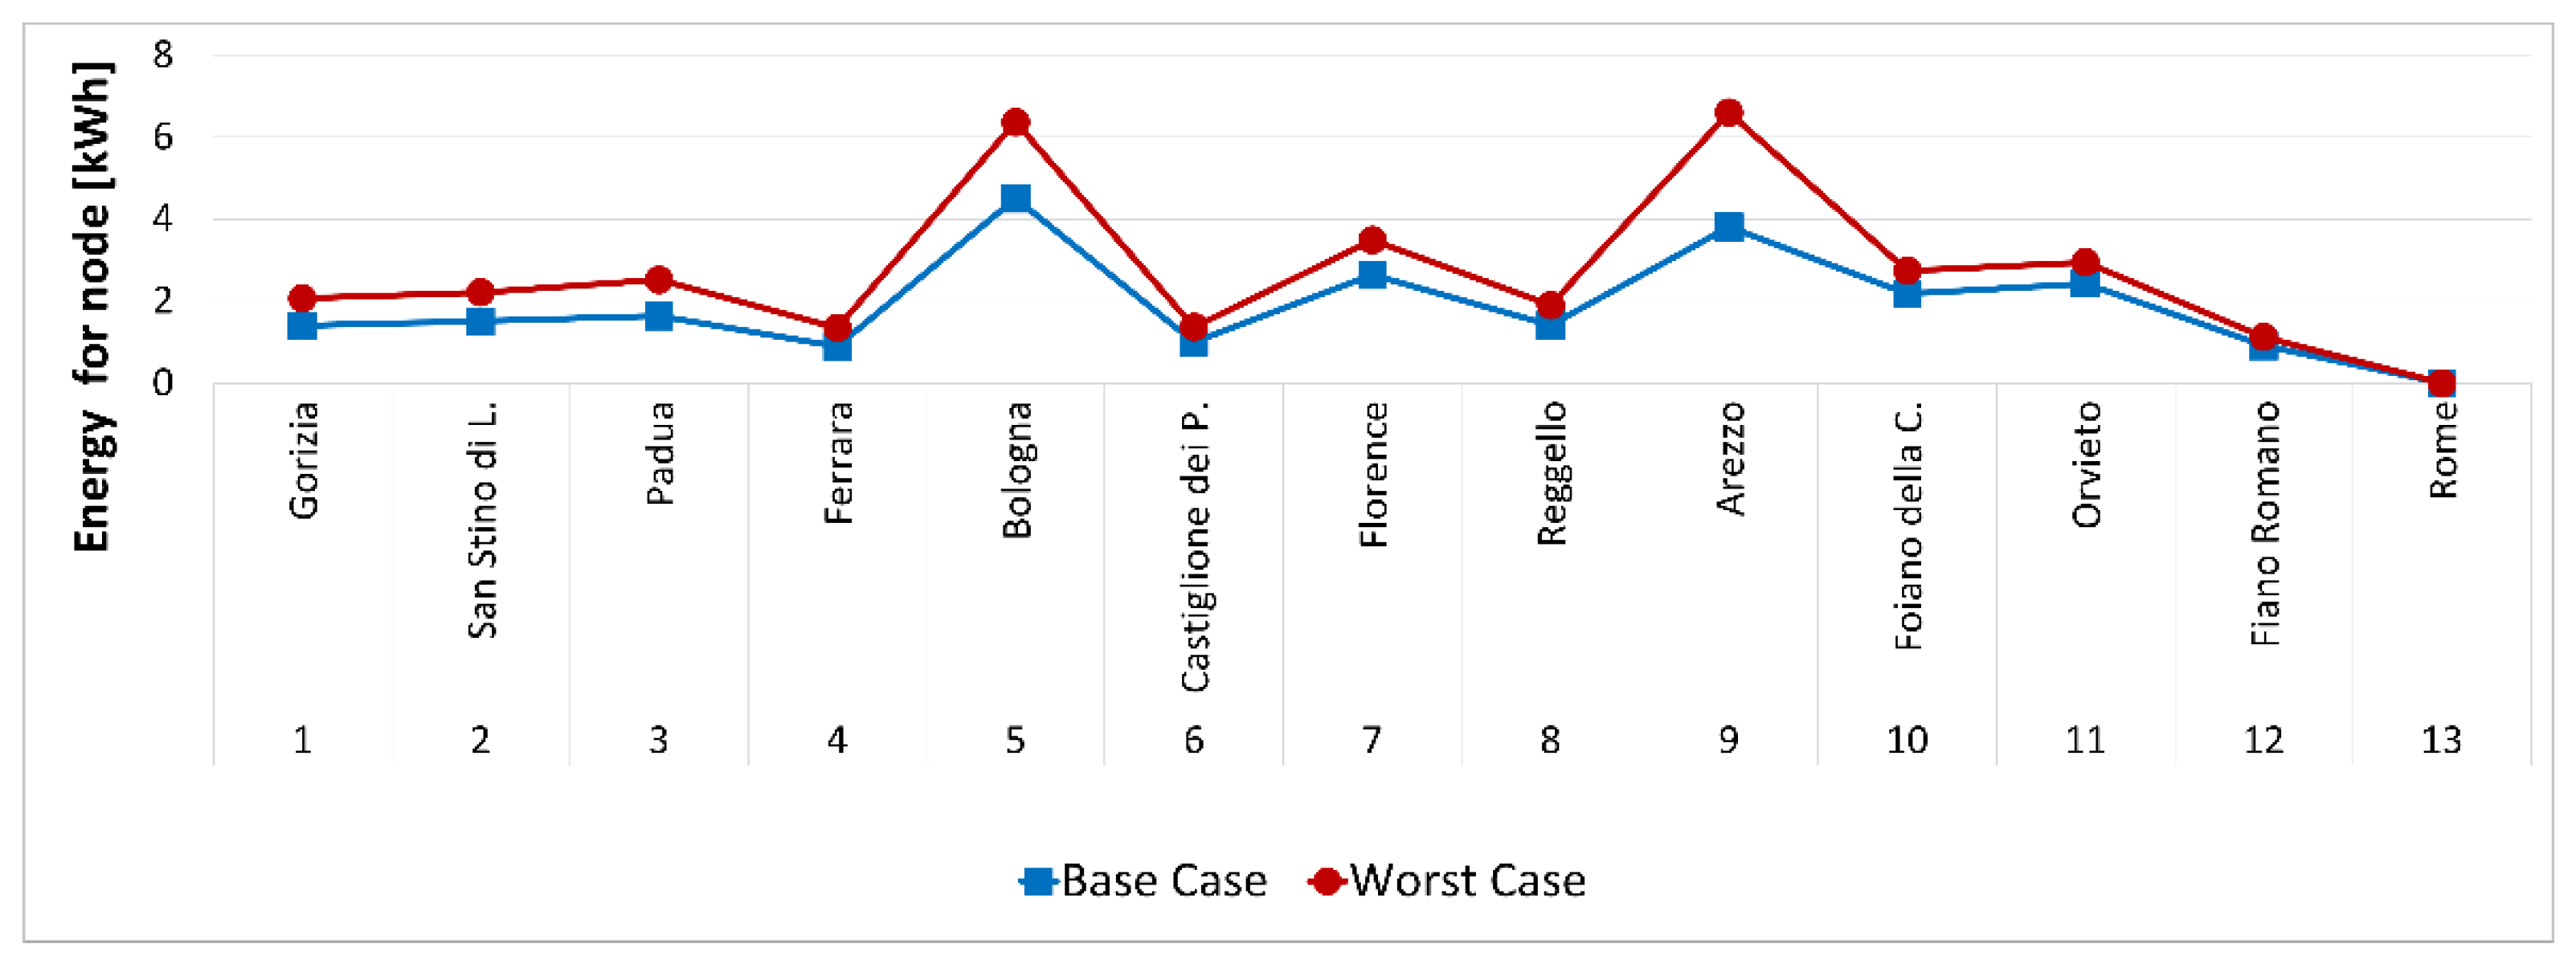
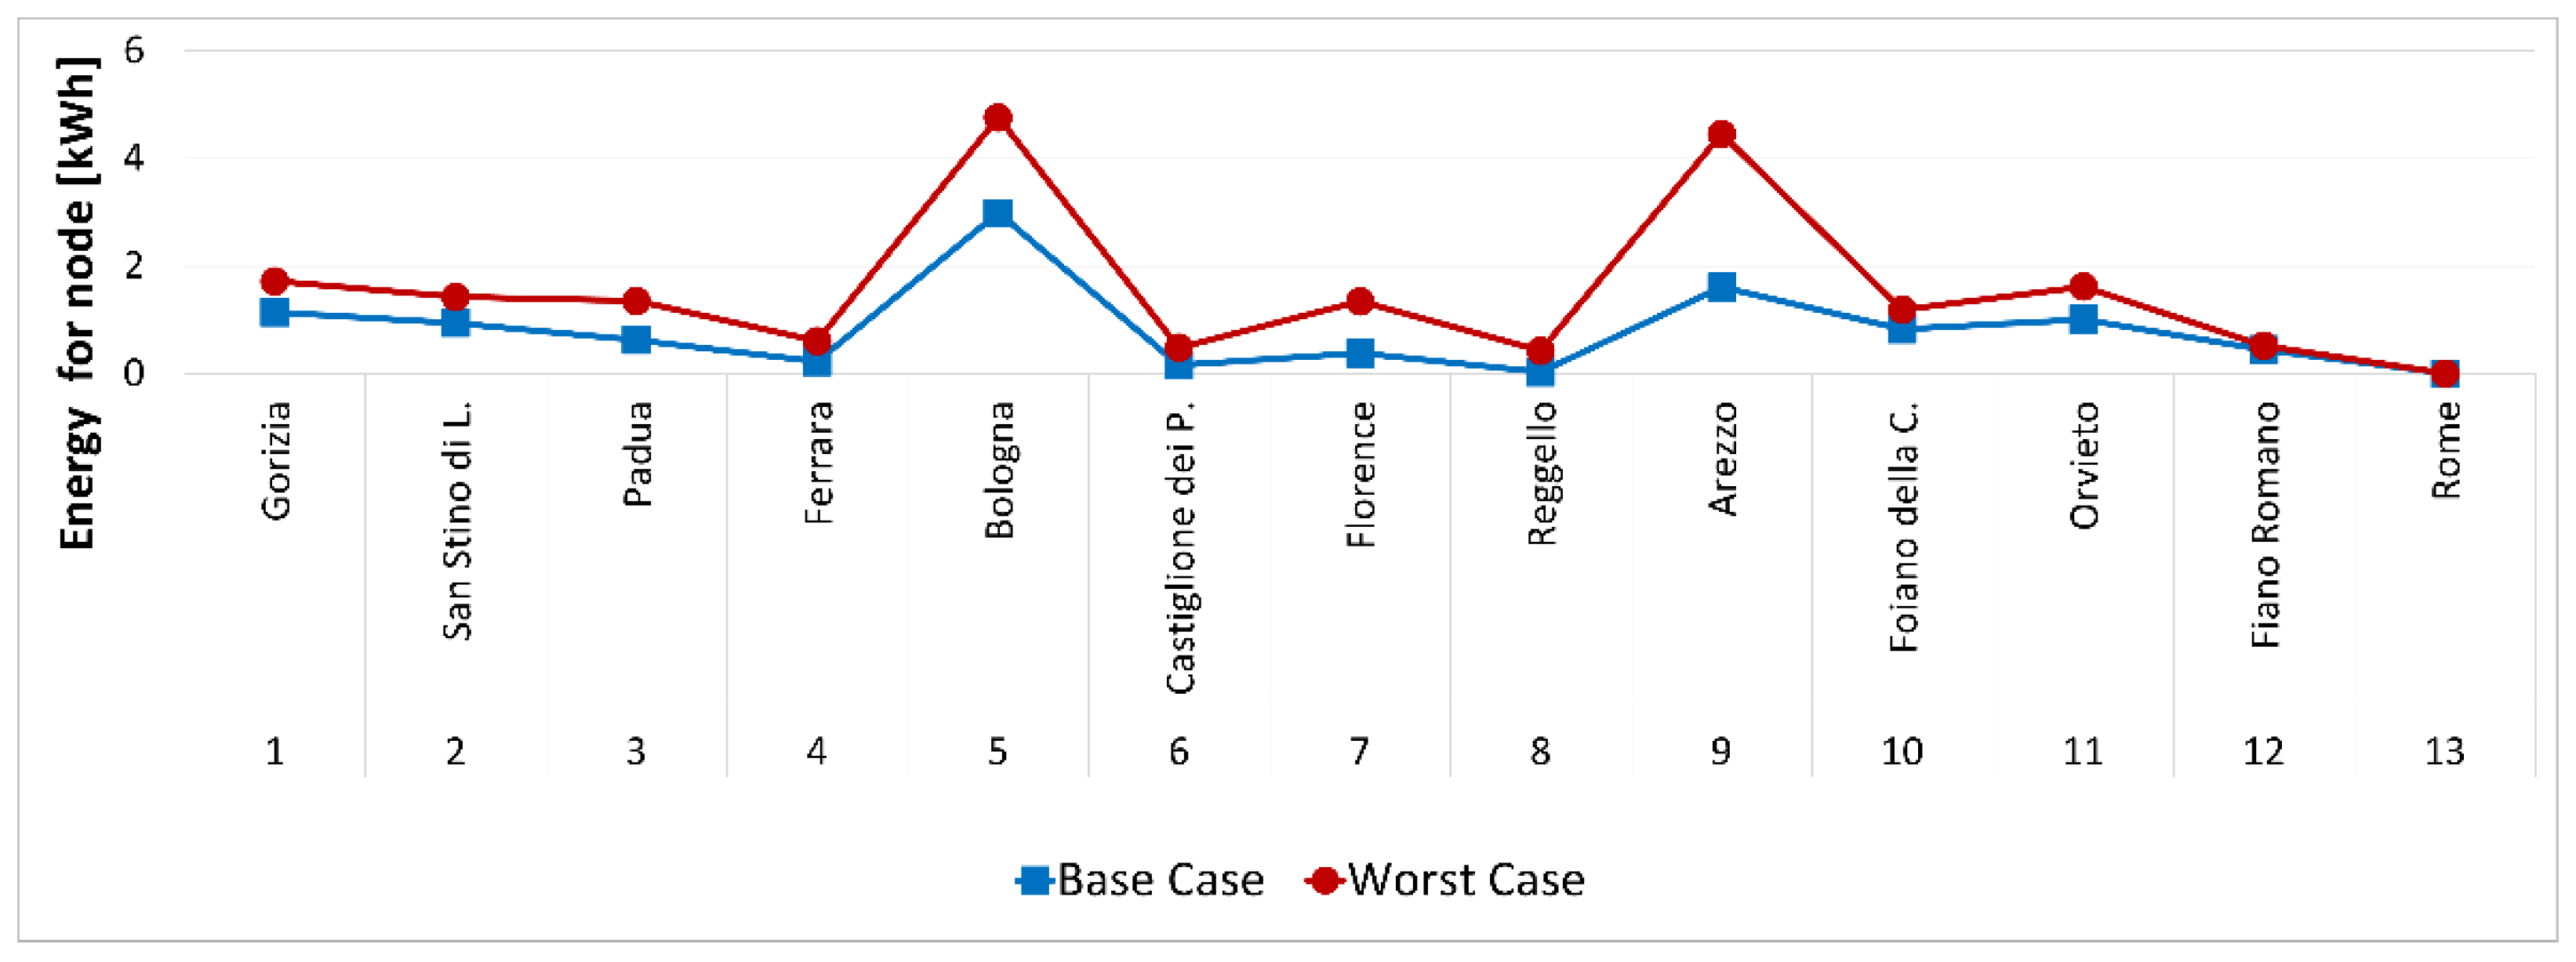
3.1.2. Worst Case Analysis

A matter of concern is to what extent the PV system, which was sized on average hourly temperature and irradiance data for each month of the year, can face adverse climate conditions and still assure the required internal temperature. Given that the PV system was mainly designed to cover refrigeration requirements in summer months (see Figure 3), the year with the hottest day of July in the last 30 years was considered. Thus, exceptional temperature and irradiance data recorded on 22 July and 7 August 2015 were used instead of the average data of the basic scenario for the related months. In Figure 6, the refrigeration requirements during the delivery tour for this exceptional July are compared to the reference scenario.
For this worst case scenario, the optimization model selects 7 PV panels on the vehicle rooftop as in the reference case, but with a battery capacity increased to 23 kWh instead of 12 kWh and a 7 kW PCS. Due to lower investment cost at current market values, the increased refrigeration requirements are conveniently covered by the battery. In Figure 7, the energy flow from the battery along a delivery tour in August 2015 with respect to the reference case is reported.
Given mainly the double-sized capacity selected for the battery, the payback period increases to 7.08 years. It is worthwhile to notice that the greater number of battery and PCS modules leads not only to increase the related investment costs, but also to reduced fuel savings for traction, due to the increased vehicle curb weight in comparison to the basic scenario.
Simulation of the worst case scenario can guide the selection of the final size for the battery, based on the risk level accepted by the management. However, excessive oversizing of the PV system to face adverse but rare climate conditions can be limited by considering other actions at operation level to manage deliveries. To this extent, the proposed optimization model can act as an effective decision support tool. Changes of the delivery tour for expected exceptional climate conditions can be simulated in order to derive the ability of the installed system to cover refrigeration requirements. In Table 4, the energy to be supplied by the battery in the reference case and in the worst case for each node of the delivery tour can be compared. The cumulative amount at each node can be used to select what part of the original delivery tour can be covered even with exceptional climate conditions. For example, by removing the last client from the route, thus limiting the delivery to serve only two clients (Bologna and Arezzo), an intermediate battery size between the basic and worst case scenarios could be sufficient to assure the proper internal temperature even in the worst climate conditions. Otherwise, if the basic scenario size is adopted, then the installed PV system would be able to serve only the first original client. This can be useful information for a company to differently manage the whole fleet whenever extreme outdoor temperatures are expected. In this case, traditional vehicles with diesel-driven TRU could be assigned to long-haul deliveries, while PV-integrated vehicles could be conveniently devolved to cover shorter routes.

3.2. Sensitivity Analysis on Delivery Tour Features

3.2.1. From Chilled to Frozen Products: Impact of the Internal Temperature

The indoor temperature fixed by the supply chain manager to preserve product safety and quality is one of the main factors that influence refrigeration requirements. When moving from chilled food, with an indoor temperature during transportation of 0 °C as in the basic configuration (see Section 3.1), to frozen food with an indoor temperature set at −20 °C, energy requirements and PV conversion are modified as reported in Figure 8.
In this case, the model suggests it is not convenient to install the PV system to drive the TRU, since the investment and operating costs are not counterbalanced by fuel savings for replacement of the diesel engine. Forcing the model to adopt the photovoltaic system, 13 PV panels covering all the available rooftop surface for 5.2 kW nominal power, 46 battery modules (46 kWh storage capacity), and 20 PCS modules (10 kW) are installed in order to cover the higher refrigeration load for frozen food. The battery should be utilized more intensively, covering approximately 62% of energy requirements. The higher number of modules leads to an increase in the total investment and maintenance costs, but also to an increase in the weight of the PV system on-board, which also results in a final increase in fuel costs for traction. Moreover, the battery cannot be charged only by PV energy, so that energy supply from the grid should be included.

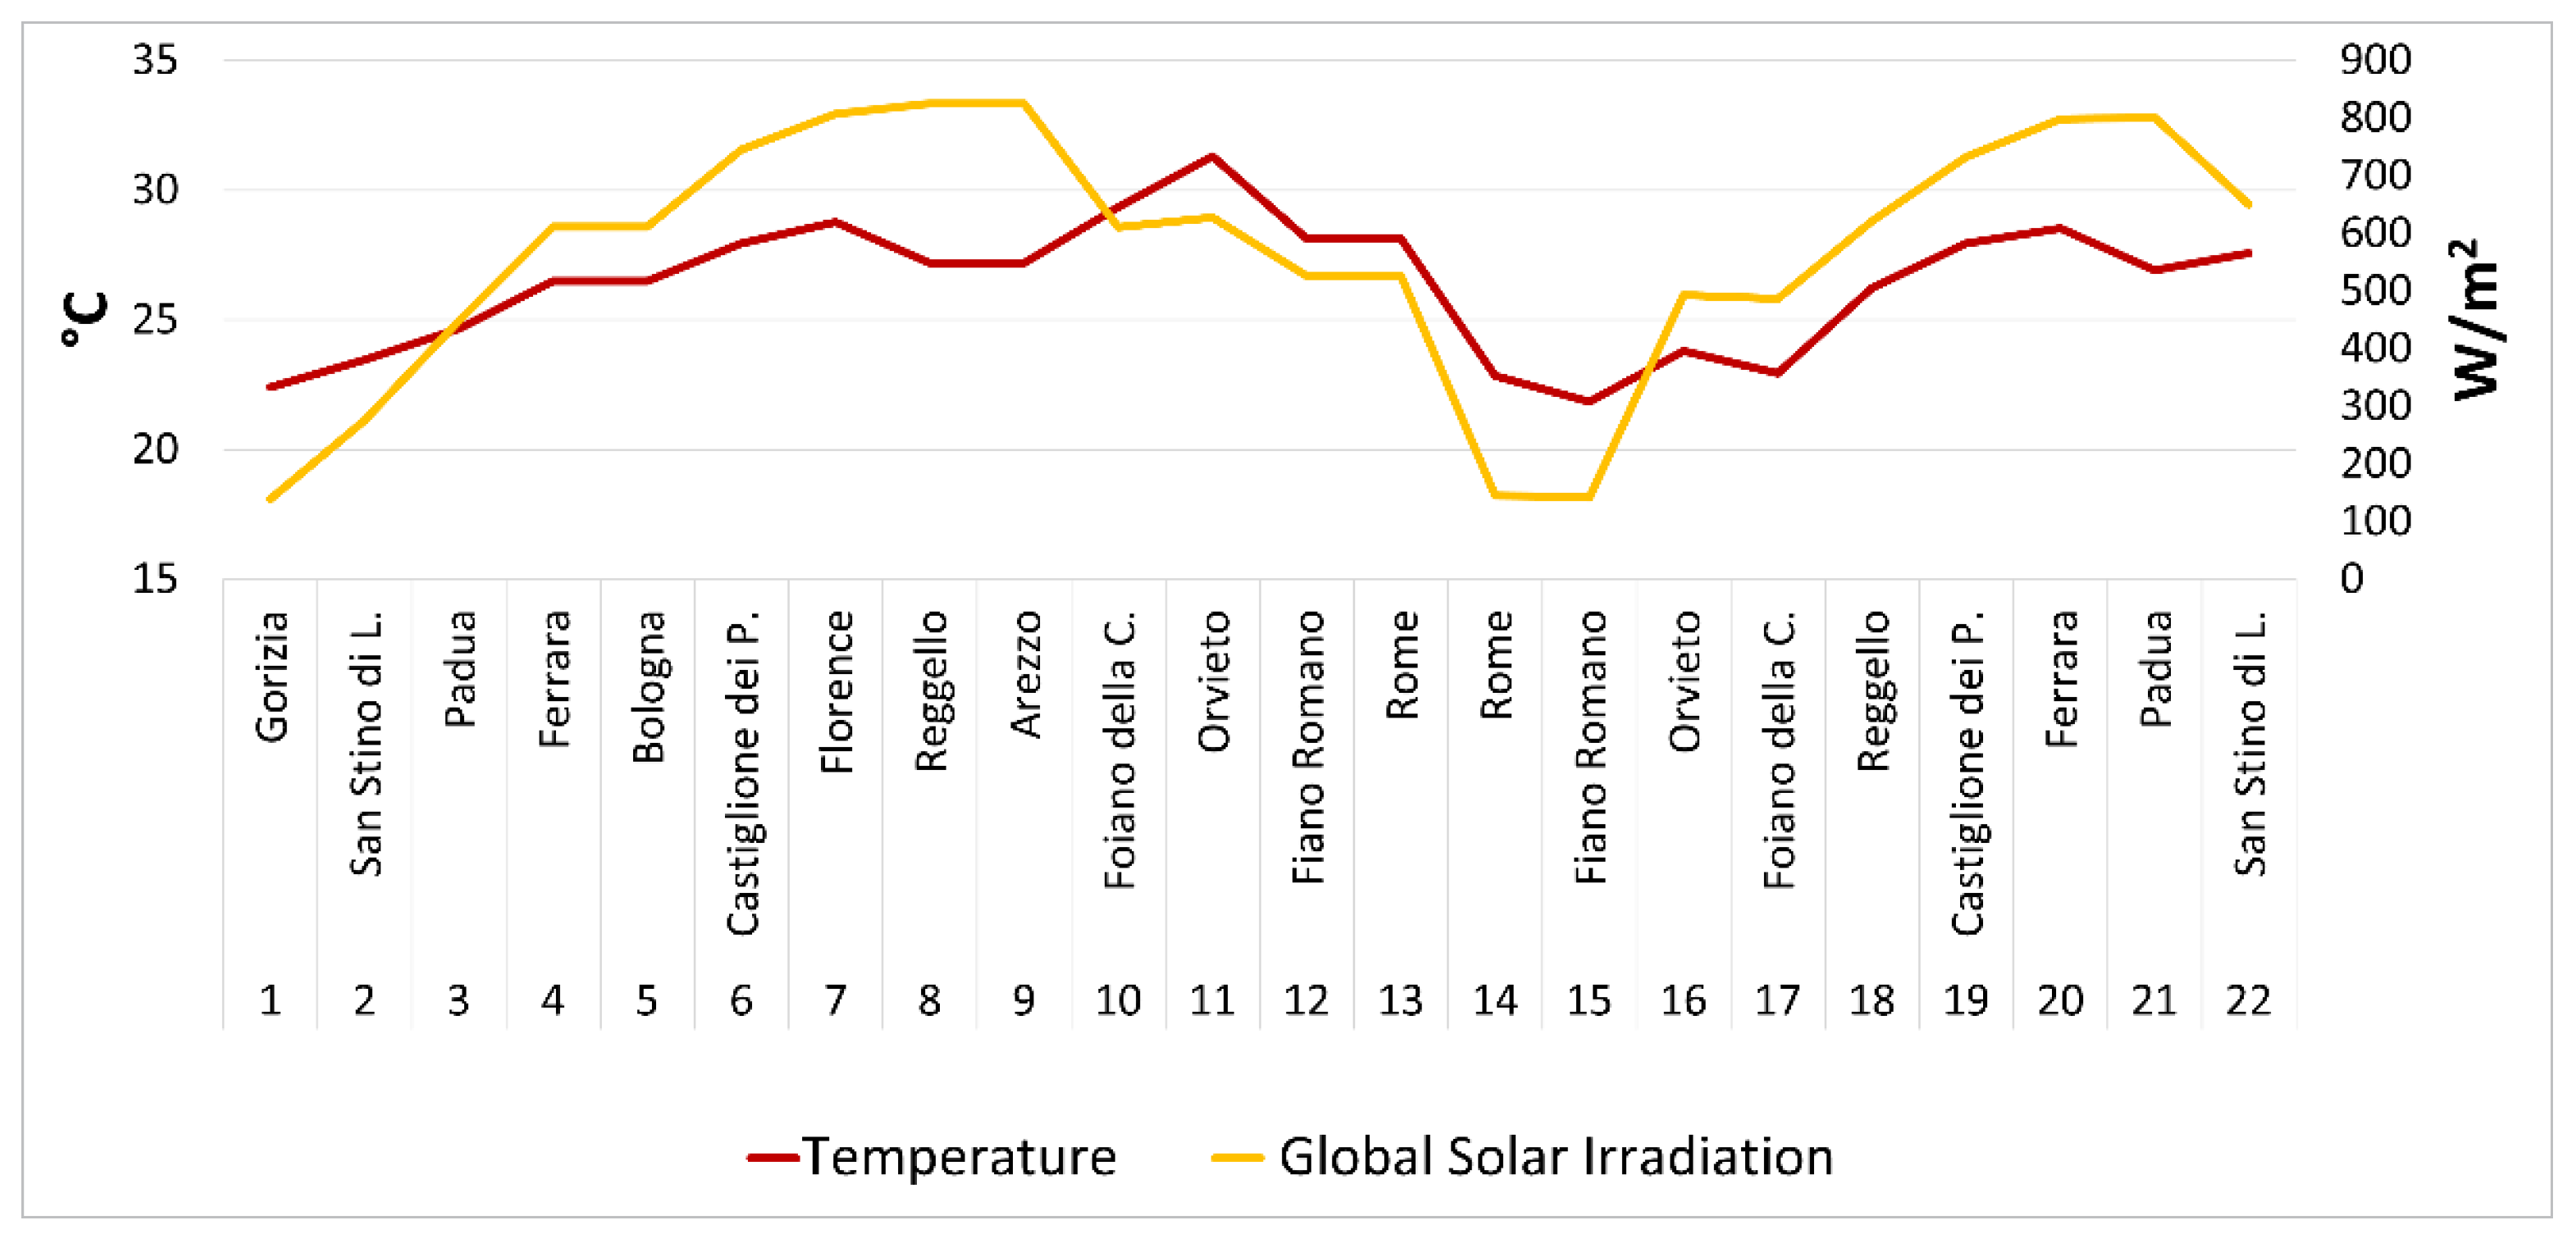
3.2.2. Moving toward Different Climate Zones

Taking into account the dependence of refrigeration requirements and PV conversion on external temperature and solar irradiance of the geographical zones encountered by the vehicle, simulations were performed for delivery tours representative of different climatic conditions.
Starting from the same depot in Gorizia (North-Eastern Italy), three different routes with similar duration were analyzed and compared to the reference case study (southward journey). The first route involves a westward tour across North Italy, serving customers located in Vicenza, Bergamo, and Cuneo, thus affected by climate conditions quite similar to the depot zone for the whole tour. The second is an eastward tour to colder climates to serve customers located in Ljubljana (SVN), Pécs (HUN), and Szeged (HUN). The third tour involves a northward journey toward even colder climates to reach customers located in Klagenfurt (AUT), Wien (AUT), and Brno (CZE). All related climate data were retrieved from PVGIS [42].
In comparison to the reference southward scenario, moving toward colder locations leads to a decrease of refrigeration requirements but also of PV energy generation (Figure 9). The number of PV panels decreases from seven selected in the reference case to five in the other routes. The average PV energy is slightly higher than the refrigeration demand, since refrigeration is active only on the forward journey of the tour, while the photovoltaic system can also convert energy during the backward journey. However, these tours produce a very low amount of PV energy due to unfavorable climate conditions. In particular, with respect to the reference case, a decrease in PV energy generation of 36% can be accounted for during the eastward tour, 31% for the westward tour, and 38% for the northward tour.
Low emission values per trip, equal to 0.15 kgCO2eq for the westward tour and 0.1 kgCO2eq for the eastward one are recorded. GHG emissions are negligible for the northward tour, similar to the southward reference tour, due to the possibility of exploiting the empty return journey to completely recharge the battery, avoiding energy supply from the grid, which is the only indirect emission source for the PV system.
For all configurations, the payback period is 4 years, slightly lower than the southward tour due to the reduced system size.

3.2.3. Introducing a Complementary Business for the Return Journey

A complementary business is introduced in order to exploit the return journey. Refrigerated products are directly delivered to the initial depot, starting from the last client node (or another with negligible distance from it). In this case, the battery needs to be possibly charged before the vehicle departure, dividing the delivery tour into the forward journey (from depot to the last client) and the backward one (from last client to the depot). The same route is considered for both delivery directions.
The optimal PV system proposed by the model is the same as the reference case. The most demanding journey is, in fact, still the forward one, given that in the backward journey no intermediate stops at clients are involved and the vehicle travels northward, thus toward more favorable climate conditions in terms of refrigeration loads. Energy requirements and supply for the forward journey are reported in Figure 10, while those for the backward one are in Figure 11.
However, the introduction of the complementary business leads to fuel cost savings 67% higher than in the reference case. Since even the backward journey is performed with refrigeration on, the PV system replaces the fossil fuel supply with renewable energy to operate the TRU during the whole journey. Therefore, the payback decreases to 3.31 years at current market values (see Table 5), further reducible to 0.99 years for the best forecasted scenario in the next decade (70% cost decrease of all PV system components). Avoided emissions per trip, considering Italian carbon intensity for electricity generation of 0.259 kgCO2eq/kWh [48], account for 20.60 kgCO2eq per delivery tour, with a relative increase of 58.4% with respect to the reference case. It comes that the adoption of a complementary business leads to both economic and environmental benefits, thus becoming a viable solution toward more sustainable cold chains.

4. Discussion

In contrast to regional deliveries, long journeys toward far destinations imply that the vehicle can cross different climate zones, whose outdoor temperature and solar irradiance affect both refrigeration requirements and photovoltaic energy conversion. Moreover, driver’s breaks and rest periods are mandatory, thus prolonging times the vehicle should maintain the refrigerated space at proper temperature, but also generate PV energy. Therefore, a multiperiod, multizone optimization model was developed in order to optimally size the PV system at minimum cost, based on the features of the delivery tour.
Results on a reference case study for palletized chilled food from North-Eastern Italy southward to Rome showed a payback period for the PV system of 4.6 years at current market values, which can be expected to drastically drop below 2 years for component cost decrease as forecasted in the next decade. GHG avoided emissions for 13 kgCO2eq per delivery tour can be accounted due to the TRU diesel engine replacement. No energy supply from the grid is needed, since the PV system is able to completely recharge the battery with energy generated during rest and especially the return journey, when it is no longer necessary to operate the refrigeration unit. Moreover, new strategies can be adopted to exploit PV energy generated on-board in those months when refrigeration requirements are low and the battery capacity is not fully utilized, such as also covering HVAC requirements of the vehicle cabin. Vehicle-to-home options can also be exploited when coming back to the depot, e.g., for maintaining the refrigeration space temperature during loading activities before vehicle departure for the next delivery tour. Reduction of component costs can also allow a more significant integration of renewable energy, since more PV panels are installed on the vehicle rooftop by the optimization model. This can be a valuable suggestion for public institutions aiming to enhance transport sustainability in their territories.
Such performances can be further improved, when a complementary business, to deliver refrigerated products from the final client zone back to the depot, is added to the original forward journey. In this case, the payback period decreases to 3.3 years, while GHG avoided emissions grows to 20.6 kgCO2eq per delivery tour, since refrigeration is on during the whole journey and a larger fuel savings can be achieved.
Moving in different directions for a long-haul delivery, rather than southward as in the basic scenario, refrigeration requirements are lower and PV generation is reduced, so that the optimization model selects a reduced size for the system, leading to a reduced payback of 4 years. The most demanding direction can be adopted, so as to guide the decision for the final size of the PV system, and exceptionally challenging climate conditions can be simulated as in the worst case analysis. To this extent, the proposed optimization model proved its ability to act as an effective decision support tool.
Different from previous findings concerning PV-integrated refrigerated transport for regional deliveries, when moving from chilled to frozen products in long-haul transport, PV integration is not profitable at current market costs. In fact, a large number of modules should be installed to cover refrigeration requirements, which consequently leads to increased vehicle curb weight and fuel consumption for traction. Moreover, battery recharge from the grid is also needed.

5. Conclusions

Given the increasing pattern of chilled and frozen food sales, and other refrigerated products such as vaccines, decarbonization of the cold chain is becoming a high priority goal toward sustainable development. Renewable energy penetration into refrigerated transport can play an important role to achieve sustainable logistics and supply chains.
In this study, in particular, the feasibility of replacing the diesel engine and dedicated fuel tank to operate the TRU of semitrailers by a photovoltaic system, involving PV panels on the vehicle rooftop, a battery bank, and a proper PCS, was investigated for a long-haul delivery of refrigerated products. A multiperiod, multizone constraint programming optimization model was developed and different specifications of the delivery process analyzed in order to derive the best conditions for PV exploitation.
Fostering renewable penetration into refrigerated transport can be a viable solution to increase sustainability of cold chains. Relying on decision support tools for refrigerated deliveries such as the one proposed in this research, can allow for improvement in the whole supply chain performance, so that increasing refrigerated product demand can be satisfied, while preserving the planet. Limits of our approach can be mainly ascribed to some simplifications adopted to model energy demand and conversion. In particular, infiltration loads for open doors during drop-off activities of vehicles has received less attention in literature than fast opening doors in refrigerated warehouses, but compact closed-form expressions to be included into optimization models are needed.
Future research can be devoted to analyzing the feasibility of on-board PV systems also for home delivery of chilled and frozen food, given the terrific growth recorded by the e-grocery sector. In this case, stops are more frequent and with different time for unloading activities with respect to palletized units, so that infiltration load can play a more significant role. Different climate conditions requiring a multizone approach are rarely encountered in last-mile deliveries, but traffic congestion can play a more significant role on refrigeration requirements. Moreover, smaller vehicles used for home delivery typically adopt a combination of eutectic and vapor compression systems for refrigeration. Therefore, the feasibility of integrating photovoltaic energy for home delivery should be further investigated and a specific optimization model should be developed.

Author Contributions

Conceptualization, A.M., C.P. and P.S.; methodology, A.M.; software, C.P.; validation, P.S.; investigation, A.M., C.P. and P.S.; writing, A.M., C.P. and P.S.; visualization, C.P. All authors have read and agreed to the published version of the manuscript.

Funding

This research received no external funding.

Institutional Review Board Statement

Not applicable.

Informed Consent Statement

Not applicable.

Data Availability Statement

Not applicable.

Conflicts of Interest

The authors declare no conflict of interest.

References

  1. IIR-International Institute of Refrigeration. Europe Dominated the Global Frozen Food Market in 2020. Available online: https://iifiir.org/en/news/europe-dominated-the-global-frozen-food-market-in-2020 (accessed on 1 March 2021).
  2. UWT. COVID-19 Effects on Refrigerated Transport Demand. 2020. Available online: https://unitedworldtransportation.com/covid-19-effects-on-refrigerated-transport-demand/ (accessed on 1 March 2021).
  3. EEA. Final Energy Consumption by Sector and Fuel in Europe. 2020. Available online: https://www.eea.europa.eu/data-and-maps/indicators/final-energy-consumption-by-sector-10/assessment (accessed on 1 March 2021).
  4. EEA. Greenhouse Gas Emissions from Transport in Europe. 2019. Available online: https://www.eea.europa.eu/data-and-maps/indicators/transport-emissions-of-greenhouse-gases/transport-emissions-of-greenhouse-gases-12 (accessed on 1 March 2021).
  5. James, S.J.; Swain, M.J.; Brown, T.; Evans, J.A.; Tassou, S.A.; Ge, Y.T. Improving the Energy Efficiency of Food Refrigeration Operations; Institute of Refrigeration: London, UK, 2009. [Google Scholar]
  6. Tassou, S.; De-Lille, G.; Ge, Y. Food Transport Refrigeration—Approaches to Reduce Energy Consumption and Environmental Impacts of Road Transport. Appl. Therm. Eng. 2009, 29, 1467–1477. [Google Scholar] [CrossRef] [Green Version]
  7. Bagheri, F.; Fayazbakhsh, M.A.; Bahrami, M. Real-time performance evaluation and potential GHG reduction in refrigerated trailers. Int. J. Refrig. 2017, 73, 24–38. [Google Scholar] [CrossRef]
  8. Meneghetti, A.; Dal Magro, F.; Simeoni, P. Fostering Renewables into the Cold Chain: How Photovoltaics Affect Design and Performance of Refrigerated Automated Warehouses. Energies 2018, 11, 1029. [Google Scholar] [CrossRef] [Green Version]
  9. Laurischkat, K.; Jandt, D. Techno-economic analysis of sustainable mobility and energy solutions consisting of electric vehicles, photovoltaic systems and battery storages. J. Clean. Prod. 2018, 179, 642–661. [Google Scholar] [CrossRef]
  10. Buonomano, A.; Calise, F.; Cappiello, F.; Palombo, A.; Vicidomini, M. Dynamic analysis of the integration of electric vehicles in efficient buildings fed by renewables. Appl. Energy 2019, 245, 31–50. [Google Scholar] [CrossRef]
  11. Ghazvini, A.M.; Olamaei, J. Optimal sizing of autonomous hybrid PV system with considerations for V2G parking lot as controllable load based on a heuristic optimization algorithm. Sol. Energy 2019, 184, 30–39. [Google Scholar] [CrossRef]
  12. Turan, M.T.; Ates, Y.; Erdinc, O.; Gokalp, E.; Catalão, J.P. Effect of electric vehicle parking lots equipped with roof mounted photovoltaic panels on the distribution network. Int. J. Electr. Power Energy Syst. 2019, 109, 283–289. [Google Scholar] [CrossRef]
  13. Calise, F.; Cappiello, F.L.; Cartenì, A.; D’Accadia, M.D.; Vicidomini, M. A novel paradigm for a sustainable mobility based on electric vehicles, photovoltaic panels and electric energy storage systems: Case studies for Naples and Salerno (Italy). Renew. Sustain. Energy Rev. 2019, 111, 97–114. [Google Scholar] [CrossRef]
  14. Cartenì, A.; Henke, I.; Molitierno, C.; Di Francesco, L. Strong Sustainability in Public Transport Policies: An e-Mobility Bus Fleet Application in Sorrento Peninsula (Italy). Sustainability 2020, 12, 7033. [Google Scholar] [CrossRef]
  15. Good, C.; Shepero, M.; Munkhammar, J.; Boström, T. Scenario-based modelling of the potential for solar energy charging of electric vehicles in two Scandinavian cities. Energy 2019, 168, 111–125. [Google Scholar] [CrossRef]
  16. Kobashi, T.; Yoshida, T.; Yamagata, Y.; Naito, K.; Pfenninger, S.; Say, K.; Takeda, Y.; Ahl, A.; Yarime, M.; Hara, K. On the potential of “Photovoltaics + Electric vehicles” for deep decarbonization of Kyoto’s power systems: Techno-economic-social considerations. Appl. Energy 2020, 275, 115419. [Google Scholar] [CrossRef]
  17. Hoarau, Q.; Perez, Y. Interactions between electric mobility and photovoltaic generation: A review. Renew. Sustain. Energy Rev. 2018, 94, 510–522. [Google Scholar] [CrossRef] [Green Version]
  18. D’Adamo, I.; Falcone, P.M.; Gastaldi, M.; Morone, P. The economic viability of photovoltaic systems in public buildings: Evidence from Italy. Energy 2020, 207, 118316. [Google Scholar] [CrossRef]
  19. Motahhir, S.; El Hammoumi, A.; El Ghzizal, A. The most used MPPT algorithms: Review and the suitable low-cost embedded board for each algorithm. J. Clean. Prod. 2020, 246, 118983. [Google Scholar] [CrossRef]
  20. El Hammoumi, A.; Motahhir, S.; Chalh, A.; El Ghzizal, A.; Derouich, A. Real-time virtual instrumentation of Arduino and LabVIEW based PV panel characteristics. IOP Conf. Ser. Earth Environ. Sci. 2018, 161, 1–11. [Google Scholar] [CrossRef]
  21. El Hammoumi, A.; Motahhir, S.; Chalh, A.; El Ghzizal, A.; Derouich, A. Low-cost virtual instrumentation of PV panel characteristics using Excel and Arduino in comparison with traditional instrumentation. Renew. Wind Water Sol. 2018, 5, 3. [Google Scholar] [CrossRef]
  22. Chalh, A.; El Hammoumi, A.; Motahhir, S.; El Ghzizal, A.; Subramaniam, U.; Derouich, A. Trusted Simulation Using Proteus Model for a PV System: Test Case of an Improved HC MPPT Algorithm. Energies 2020, 13, 1943. [Google Scholar] [CrossRef] [Green Version]
  23. Chtita, S.; Derouich, A.; El Ghzizal, A.; Motahhir, S. An improved control strategy for charging solar batteries in off-grid photovoltaic systems. Sol. Energy 2021, 220, 927–941. [Google Scholar] [CrossRef]
  24. Abdelhamid, M.; Pilla, S.; Singh, R.; Haque, I.; Filipi, Z. A comprehensive optimized model for on-board solar photovoltaic system for plug-in electric vehicles: Energy and economic impacts. Int. J. Energy Res. 2016, 40, 1489–1508. [Google Scholar] [CrossRef]
  25. Fathabadi, H. Novel battery/photovoltaic hybrid power source for plug-in hybrid electric vehicles. Sol. Energy 2018, 159, 243–250. [Google Scholar] [CrossRef]
  26. Bhargav, P.; Kaushik, S. Real-Time Energy Management Scheme for Dual Converter-Based Hybrid Solar/Battery/Ultra-Capacitor Vehicular System. Lect. Notes Electr. Eng. 2019, 556, 369–385. [Google Scholar] [CrossRef]
  27. Ifaei, P.; Khiabani, H.; Piran, J.; Yoo, C. Techno-econo-environmental feasibility of retrofitting urban transportation system with optimal solar panels for climate change mitigation–A case study. J. Clean. Prod. 2020, 251, 119639. [Google Scholar] [CrossRef]
  28. Oh, M.; Kim, S.-M.; Park, H.-D. Estimation of photovoltaic potential of solar bus in an urban area: Case study in Gwanak, Seoul, Korea. Renew. Energy 2020, 160, 1335–1348. [Google Scholar] [CrossRef]
  29. Bahaj, A. World’s first solar powered transport refrigeration system. Renew. Energy 1998, 15, 572–576. [Google Scholar] [CrossRef]
  30. Bahaj, A.S. Photovoltaic power for refrigeration of transported perishable goods. In Proceedings of the Conference Record of the Twenty-Eighth IEEE Photovoltaic Specialists Conference-2000 (Cat. No.00CH37036), Anchorage, AK, USA, 15–22 September 2000; Volume 2000, pp. 1563–1566. [Google Scholar] [CrossRef]
  31. Bahaj, A.S.; James, P.A.B. Economics of solar powered refrigeration transport applications. In Proceedings of the Conference Record of the Twenty-Ninth IEEE Photovoltaic Specialists Conference, New Orleans, LA, USA, 19–24 May 2002; pp. 1561–1564. [Google Scholar]
  32. Kumar, S.; Bharj, R. Energy consumption of solar hybrid 48V operated mini mobile cold storage. IOP Conf. Ser. Mater. Sci. Eng. 2018, 455, 012049. [Google Scholar] [CrossRef]
  33. Buitendach, H.P.C.; Jiya, I.N.; Gouws, R. Solar powered peltier cooling storage for vaccines in rural areas. Indones. J. Electr. Eng. Comput. Sci. 2020, 17, 36–46. [Google Scholar] [CrossRef]
  34. Meneghetti, A.; Dal Magro, F.; Romagnoli, A. Renewable energy penetration in food delivery: Coupling photovoltaics with transport refrigerated units. Energy 2021, 232, 120994. [Google Scholar] [CrossRef]
  35. Meneghetti, A.; Ceschia, S. Energy-efficient frozen food transports: The Refrigerated Routing Problem. Int. J. Prod. Res. 2019, 58, 4164–4181. [Google Scholar] [CrossRef]
  36. Ceschia, S.; Di Gaspero, L.; Meneghetti, A. Extending and Solving the Refrigerated Routing Problem. Energies 2020, 13, 6214. [Google Scholar] [CrossRef]
  37. Rossi, F.; van Beek, P.; Walsh, T. Handbook of Constraint Programming; Elsevier Science Inc.: New York, NY, USA, 2006. [Google Scholar]
  38. Huld, T.; Amillo, A.M.G. Estimating PV Module Performance over Large Geographical Regions: The Role of Irradiance, Air Temperature, Wind Speed and Solar Spectrum. Energies 2015, 8, 5159–5181. [Google Scholar] [CrossRef] [Green Version]
  39. Faiman, D. Assessing the outdoor operating temperature of photovoltaic modules. Prog. Photovolt. Res. Appl. 2008, 16, 307–315. [Google Scholar] [CrossRef]
  40. Barth, M.; Scora, G.; Younglove, T. Modal Emissions Model for Heavy-Duty Diesel Vehicles. Transp. Res. Rec. J. Transp. Res. Board 2004, 1880, 10–20. [Google Scholar] [CrossRef] [Green Version]
  41. Franceschetti, A.; Demir, E.; Honhon, D.; Van Woensel, T.; Laporte, G.; Stobbe, M. A metaheuristic for the time-dependent pollution-routing problem. Eur. J. Oper. Res. 2017, 259, 972–991. [Google Scholar] [CrossRef] [Green Version]
  42. Huld, T.; Müller, R.; Gambardella, A. A new solar radiation database for estimating PV performance in Europe and Africa. Sol. Energy 2012, 86, 1803–1815. [Google Scholar] [CrossRef]
  43. Nethercote, N.; Stuckey, P.J.; Becket, R.; Brand, S.; Duck, G.J.; Tack, G. MiniZinc: Towards a standard CP modelling language. In Lecture Notes in Computer Science; Springer: Berlin, Germany, 2007; Volume 4741, pp. 529–543. [Google Scholar] [CrossRef]
  44. Otten, M.; Hoen, M.; den Boer, E. Electrical Trailer Cooling during Rest Periods; CE Delft: Delft, The Netherlands, 2015; p. 51. [Google Scholar]
  45. Tsiropoulos, I.; Tarvydas, D.; Lebedeva, N. Li-Ion Batteries for Mobility and Stationary Storage Applications; Publications Office of the European Union: Luxembourg, 2018. [Google Scholar] [CrossRef]
  46. IRENA. The Power to Change: Solar and Wind Cost Reduction Potential to 2025. Available online: https://www.irena.org/-/media/Files/IRENA/Agency/Publication/2016/IRENA_Power_to_Change_2016.pdf (accessed on 1 March 2021).
  47. Feldman, D.; Zwerling, M.; Margolis, R. Q2/Q3 2019 Solar Industry Update. Natl. Renew. Energy Lab. 2019, 1–48. [Google Scholar] [CrossRef]
  48. EEA. CO2 Emission Intensity of Electricity Generation. 2017. Available online: https://www.eea.europa.eu/data-and-maps/data/co2-intensity-of-electricity-generation (accessed on 1 March 2021).
Figure 1. The long-haul delivery graph for refrigerated vehicles with PV on-board integration.
Sustainability 13 08506 g001
Figure 2. The refrigerated delivery tour with node specifications: location, travel distance to the successor node (km), node type, stop cause, and arrival time.
Sustainability 13 08506 g002
Figure 3. Energy requirements and generation during the reference case delivery trip for refrigerated food in every month of the year.
Sustainability 13 08506 g003
Figure 4. Outdoor temperature and global solar irradiance for a typical day during July along a delivery trip.
Sustainability 13 08506 g004
Figure 5. Impact on payback period for percentage variation in component investment costs.
Sustainability 13 08506 g005
Figure 6. Refrigeration requirement (E_refr) in the reference case and in the worst case for each node of the delivery tour in July.
Sustainability 13 08506 g006
Figure 7. Energy to be supplied by the battery (E_bess) in the reference case and in the worst case for each node of the delivery tour in August.
Sustainability 13 08506 g007
Figure 8. Energy requirements and forced generation during a delivery trip for frozen food in every month of the year.
Sustainability 13 08506 g008
Figure 9. Average energy performance per trip for different directions of the long-haul delivery tour.
Sustainability 13 08506 g009
Figure 10. Energy requirements and generation during a delivery trip for chilled food in every month of the year during the forward journey.
Sustainability 13 08506 g010
Figure 11. Energy requirements and generation during a delivery trip for chilled food in every month of the year during the backward journey.
Sustainability 13 08506 g011
Table 1. PV system performance for the reference case.
PerformanceValue
PV installed power on vehicle rooftop [kW]2.80
BESS storage capacity [kWh]12.00
PCS nominal power [kW]5.00
Δ weight wrt diesel TRU [kg]−306.2
Delivery tour duration [h]32
Average refrigeration demand per trip along the year [kWh]12.51
Average transmission energy per trip along the year [kWh]10.02
Average infiltration energy per trip along the year [kWh]2.48
Average PV production per trip along the year [kWh]16.99
Average demand covered by PV per trip along the year [kWh]7.91
Average PV energy for battery charge during a trip [kWh]8.23
Average PV energy generated during rest along the year [kWh]2.03
Average energy supplied by the battery per trip along a year [kWh]4.60
Average supply to the battery from the grid per trip [kWh]0.00
Traction fuel savings for PV system weight wrt diesel engine [l/year]642.12
Avoided emissions per trip [kgCO2eq]13.00
Note: wrt stands for “with respect to”.
Table 2. PV system performance for a typical day during July and March along a delivery tour.
NodeArrival TimeTravel + Stop Time
[h]
E_refr
[kWh]
E_PV
[kWh]
E_PVtru
[kWh]
E_PVbess
[kWh]
E_bess
[kWh]
JulMarJulMarJulMarJulMarJulMar
16:001.01.400.240.290.000.290.000.000.001.110.24
27:001.01.510.250.640.100.640.100.000.000.870.15
38:001.01.640.271.080.421.080.270.000.150.560.00
49:000.50.900.190.710.380.710.190.000.190.190.00
59:301.04.501.441.460.791.460.790.000.003.040.65
610:300.51.000.270.880.480.880.270.000.210.120.00
711:001.32.640.752.271.372.270.750.000.620.370.00
812:160.71.420.401.440.881.420.400.020.480.000.00
913:001.33.811.612.251.412.251.410.000.001.560.20
1014:171.02.180.631.440.871.440.630.000.240.740.00
1115:171.02.430.761.470.901.470.760.000.140.960.00
1216:170.50.910.310.560.270.560.270.000.000.350.04
1316:4411.050.000.000.620.300.000.000.620.300.000.00
146:000.50.000.000.140.000.000.000.140.000.000.00
156:271.00.000.000.310.000.000.000.310.000.000.00
167:271.00.000.001.190.460.000.001.190.460.000.00
178:271.00.000.001.180.440.000.001.180.440.000.00
189:271.00.000.001.490.730.000.001.490.730.000.00
1911:121.80.000.002.951.780.000.002.951.780.000.00
2012:121.00.000.001.881.320.000.001.881.320.000.00
2113:421.50.000.002.781.840.000.002.781.840.000.00
2214:421.00.000.001.551.000.000.001.551.000.000.00
Tour 32.024.347.1228.5815.7414.475.8414.119.909.871.28
Table 3. Cost performance for the reference case.
CostValue
PV panel investment cost [EUR]4642
Li-ion battery investment cost [EUR]3000
PCS investment cost [EUR]1761
Charging BESS cost [EUR/year]-
Maintenance [EUR/year]81
Fuel savings for lower curb weight [EUR/year]997
Objective function (annualized cost) [EUR/year]233
Fuel avoided cost for diesel TRU [EUR/year]642
Avoided maintenance for diesel TRU [EUR/year]509
Simple payback [yr]4.59
Table 4. Energy [kWh] to be supplied by the battery (E_bess) in the reference case and in the worst case for each node of the delivery tour in August.
Node12345678910111213Tot.
GoriziaSan Stino di L.PaduaFerraraBolognaCastiglione dei P.FlorenceReggelloArezzoFoiano della C.OrvietoFiano RomanoRome
Base Case1.140.940.620.222.990.160.380.031.600.821.010.440.0010.33
Worst Case1.721.421.350.604.760.481.340.424.451.191.620.520.0019.86
Cumulative
E_bess
1.723.144.485.099.8510.3211.6612.0916.5417.7219.3419.8619.86
Table 5. Cost performance for the complementary business case.
CostValue
PV panel investment cost [EUR]4642
Li-ion battery investment cost [EUR]3000
PCS investment cost [EUR]1761
Charging BESS cost [EUR/year]98
Maintenance [EUR/year]81
Fuel savings for lower curb weight [EUR/year]−997
Objective function (annualized cost) [EUR/year]330
Fuel avoided cost for diesel TRU [EUR/year]1070
Avoided maintenance for diesel TRU [EUR/year]969
Simple payback [yr]3.31
Publisher’s Note: MDPI stays neutral with regard to jurisdictional claims in published maps and institutional affiliations.

