
Urban Data Dynamics: A Systematic Benchmarking Framework to Integrate Crowdsourcing and Smart Cities’ Standardization


Abstract
:1. Introduction
2. Smart to Resilient Cities’ Transformation Principles
3. Cities as Data-Driven Ecosystems: Urban Data Exploitation and Crowdsourcing
4. Standards for Smart and Resilient Cities
4.1. Smart Cities’ Standardization and Profiling
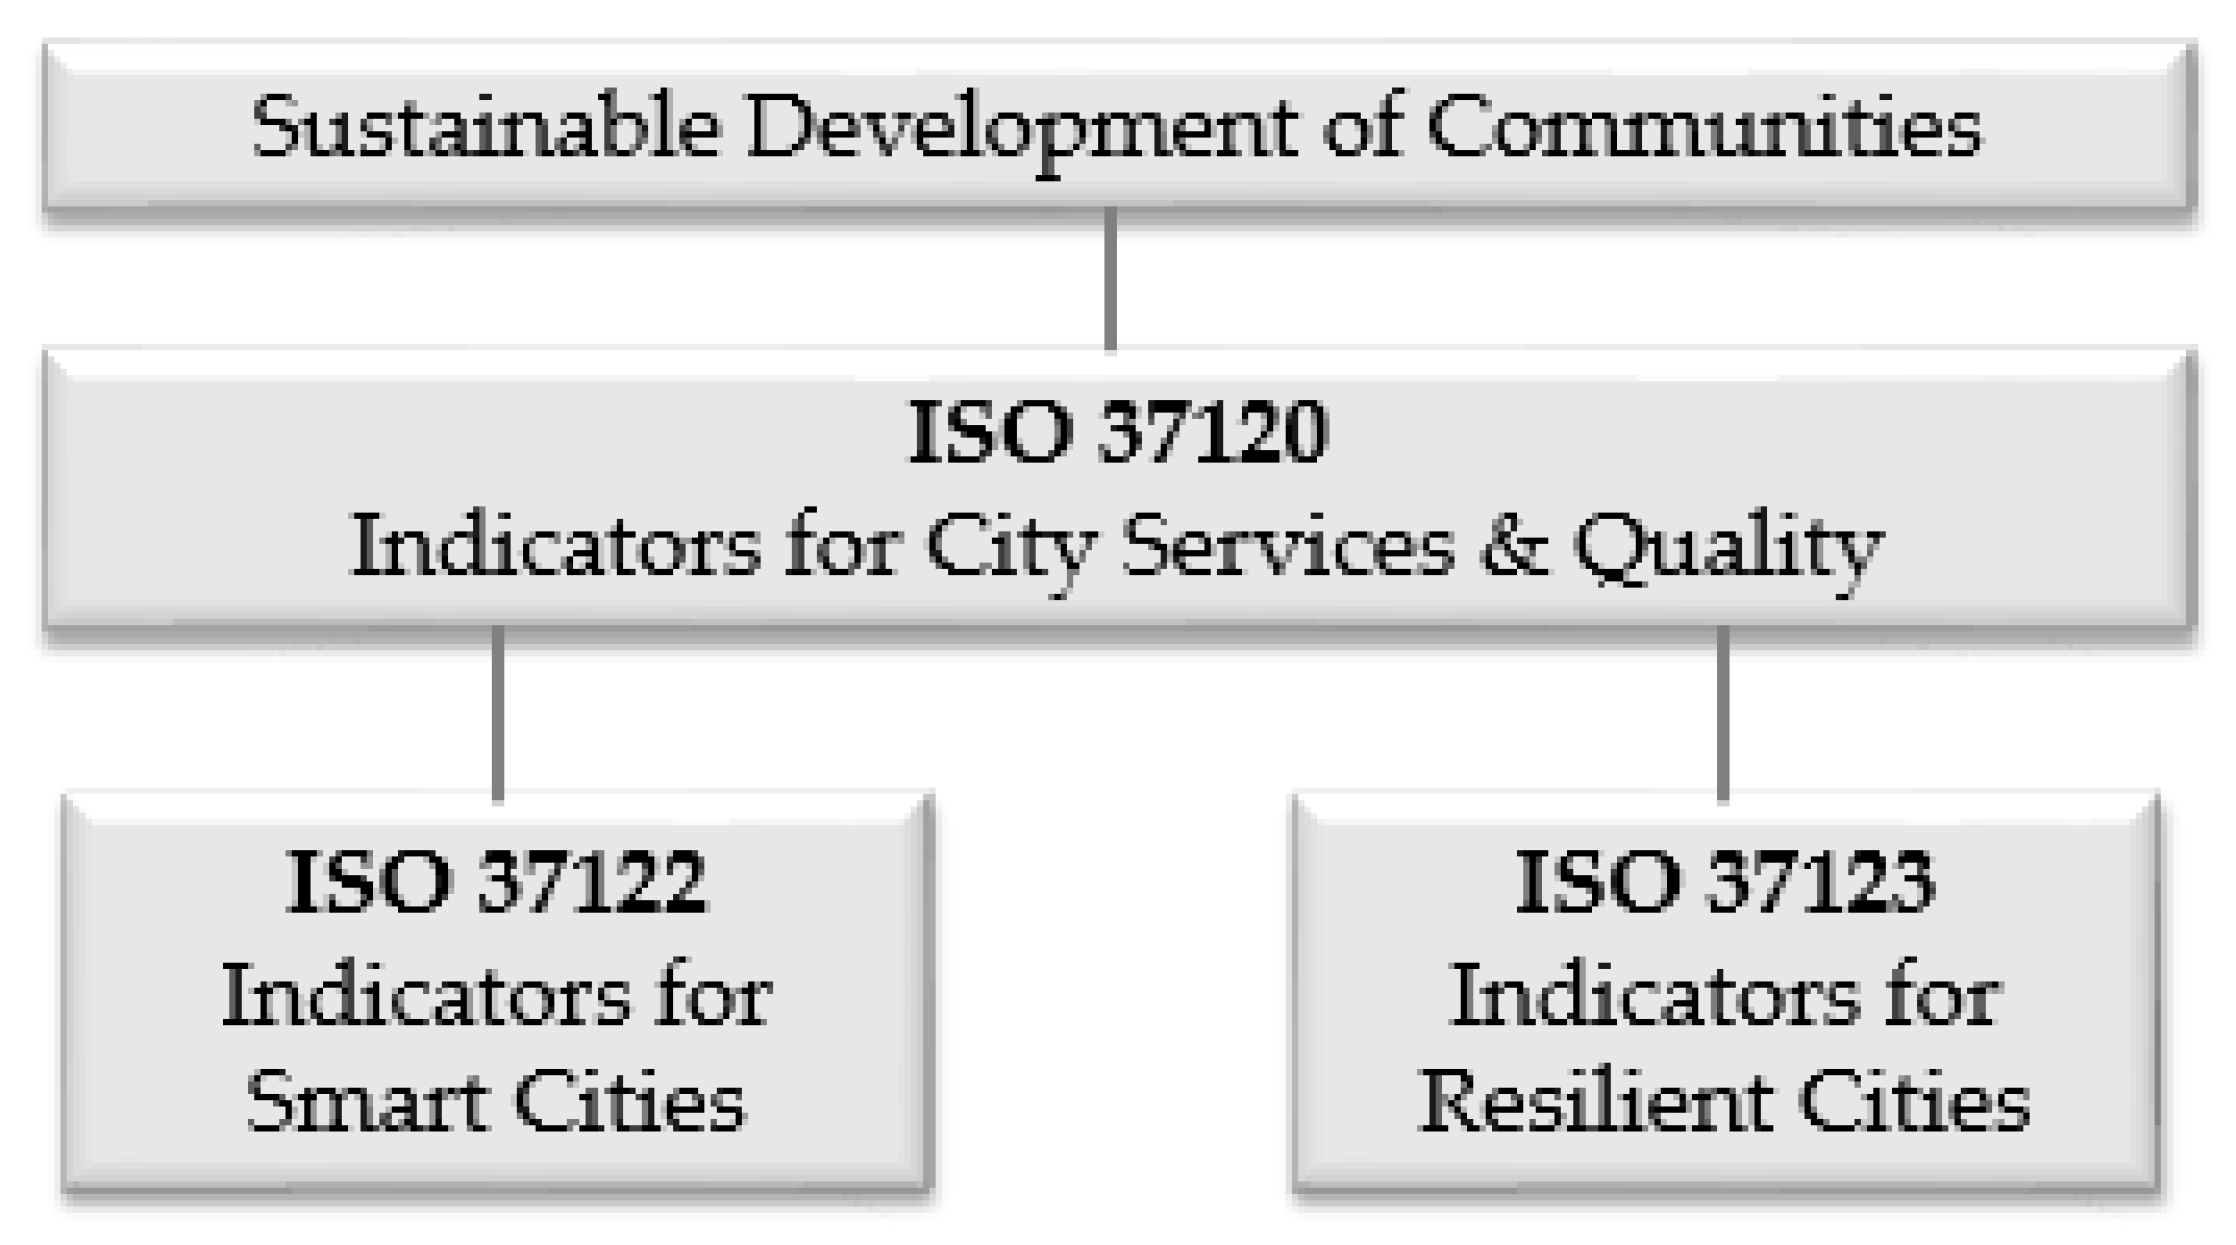
4.2. ISO Standards and Indicators for Smart Cities: A Synopsis
- Core indicators: required to assess the effectiveness of urban services and quality of life.
- Supporting indicators: recommended to assess the effectiveness of urban services and quality of life, and depend on the city’s objectives.
- Profiling indicators: proposed for the acquisition of statistics and the extraction of good practices resulting from the comparison between cities.
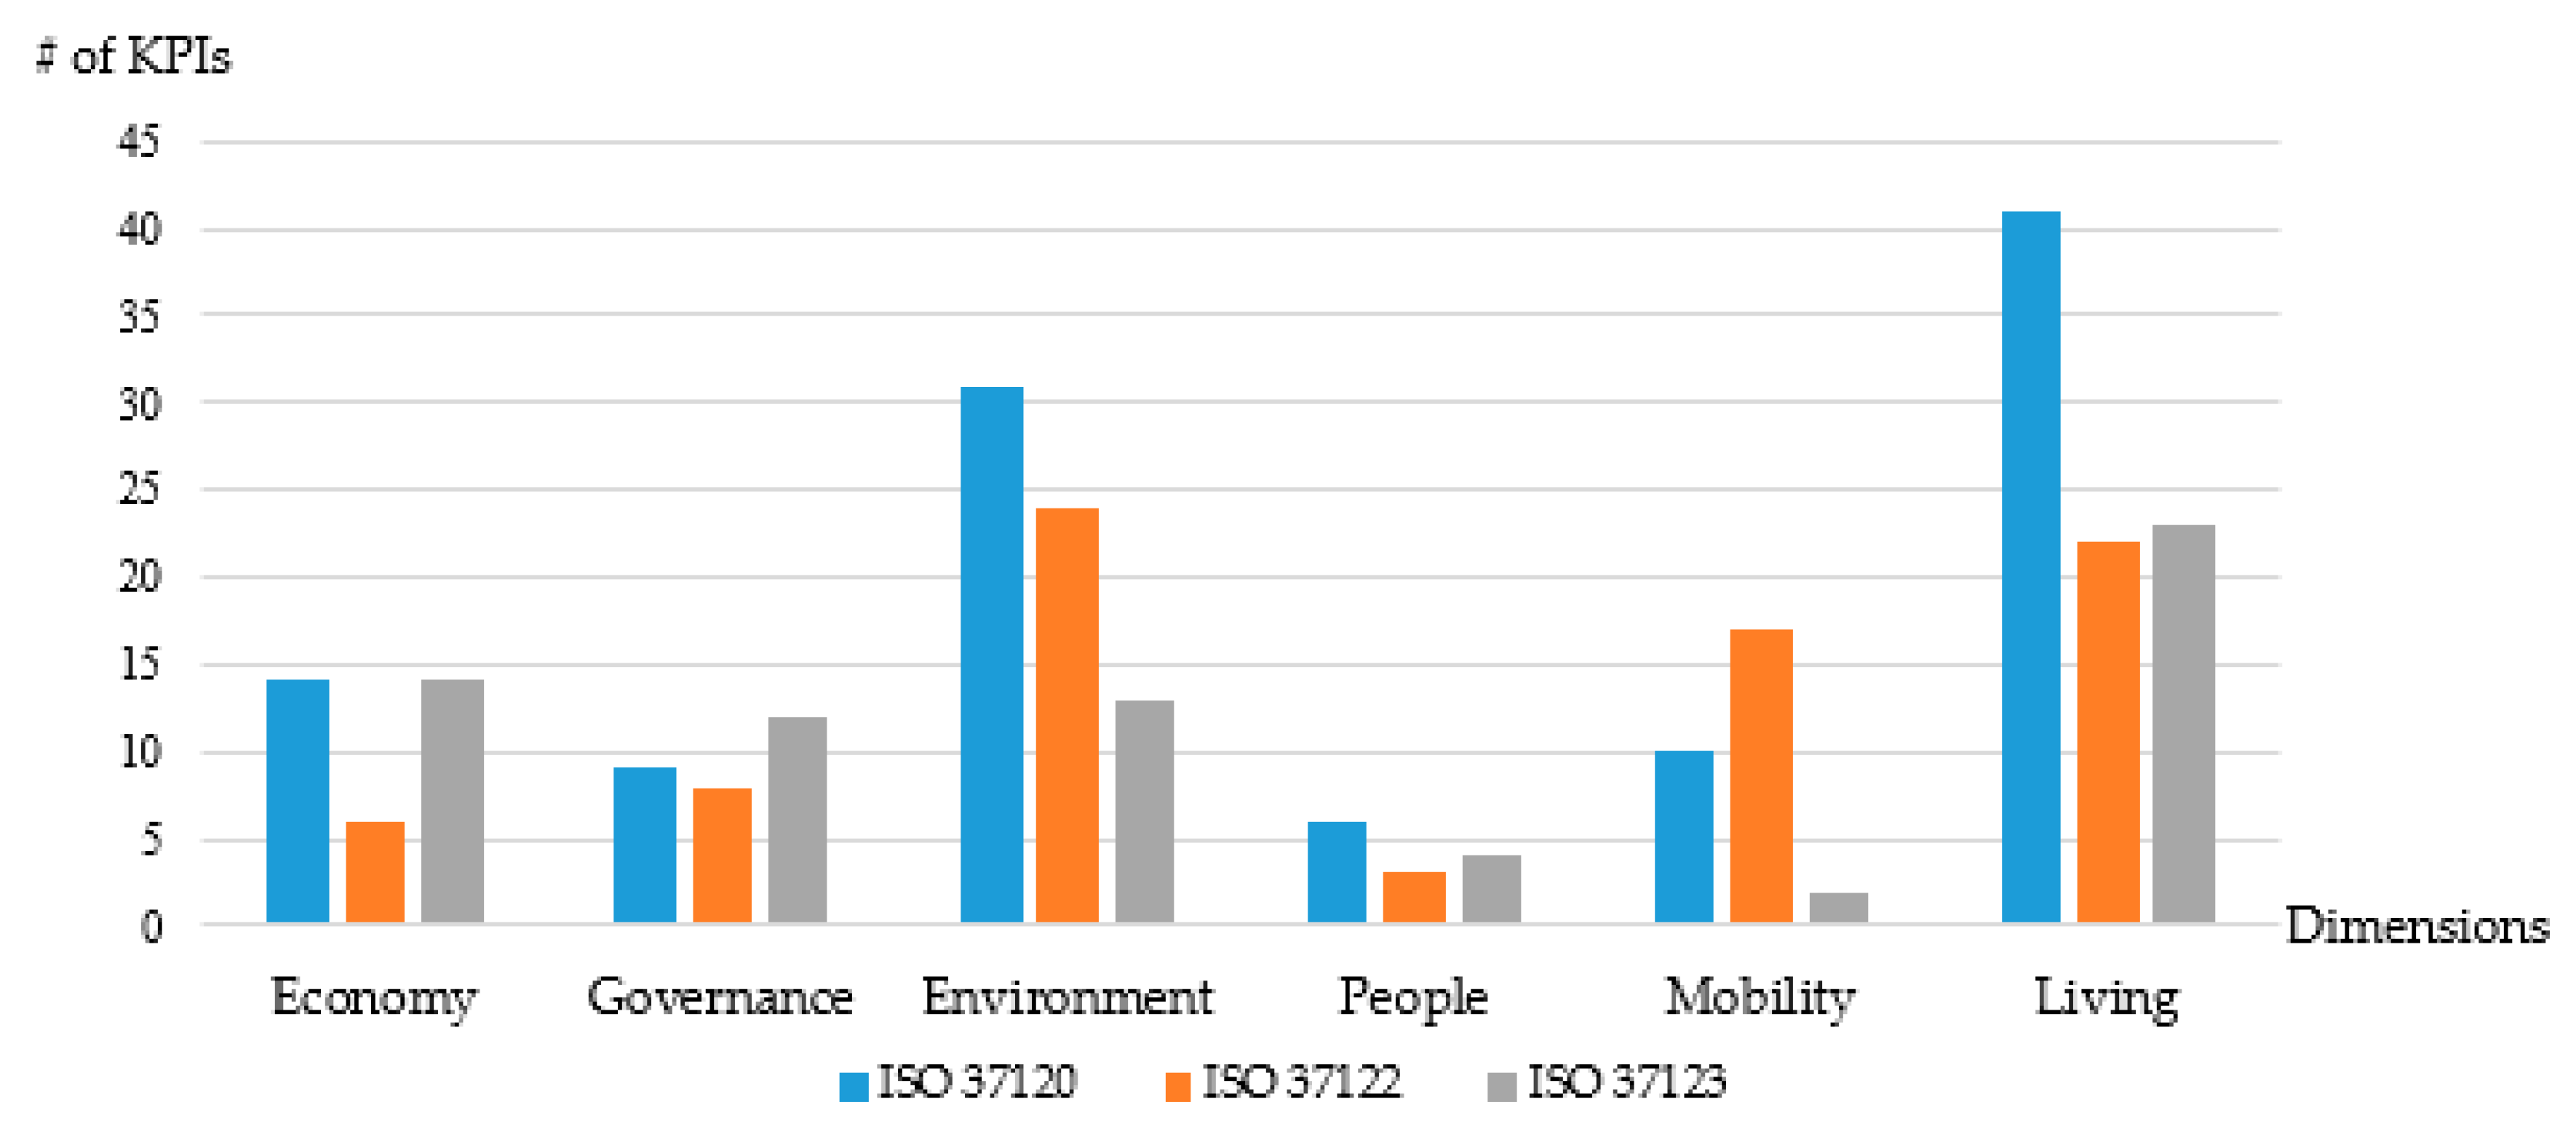
- The economy dimension, as defined in [35], concerns the competitiveness of a city, which includes entrepreneurship, innovation, productivity, the labor market, international integration and the capacity for transformation. The proposed indicators presented in Table 1A aim at measuring the abovementioned aspects of economy by approaching them from 3 different perspectives: ISO 37120 focuses on measuring the prosperity of the city, ISO 37122 focuses on measuring innovation and digitalization of services and ISO 37123 focuses on assessing the financial resilience of the city, and investing in the maintenance of urban assets and emergency response.
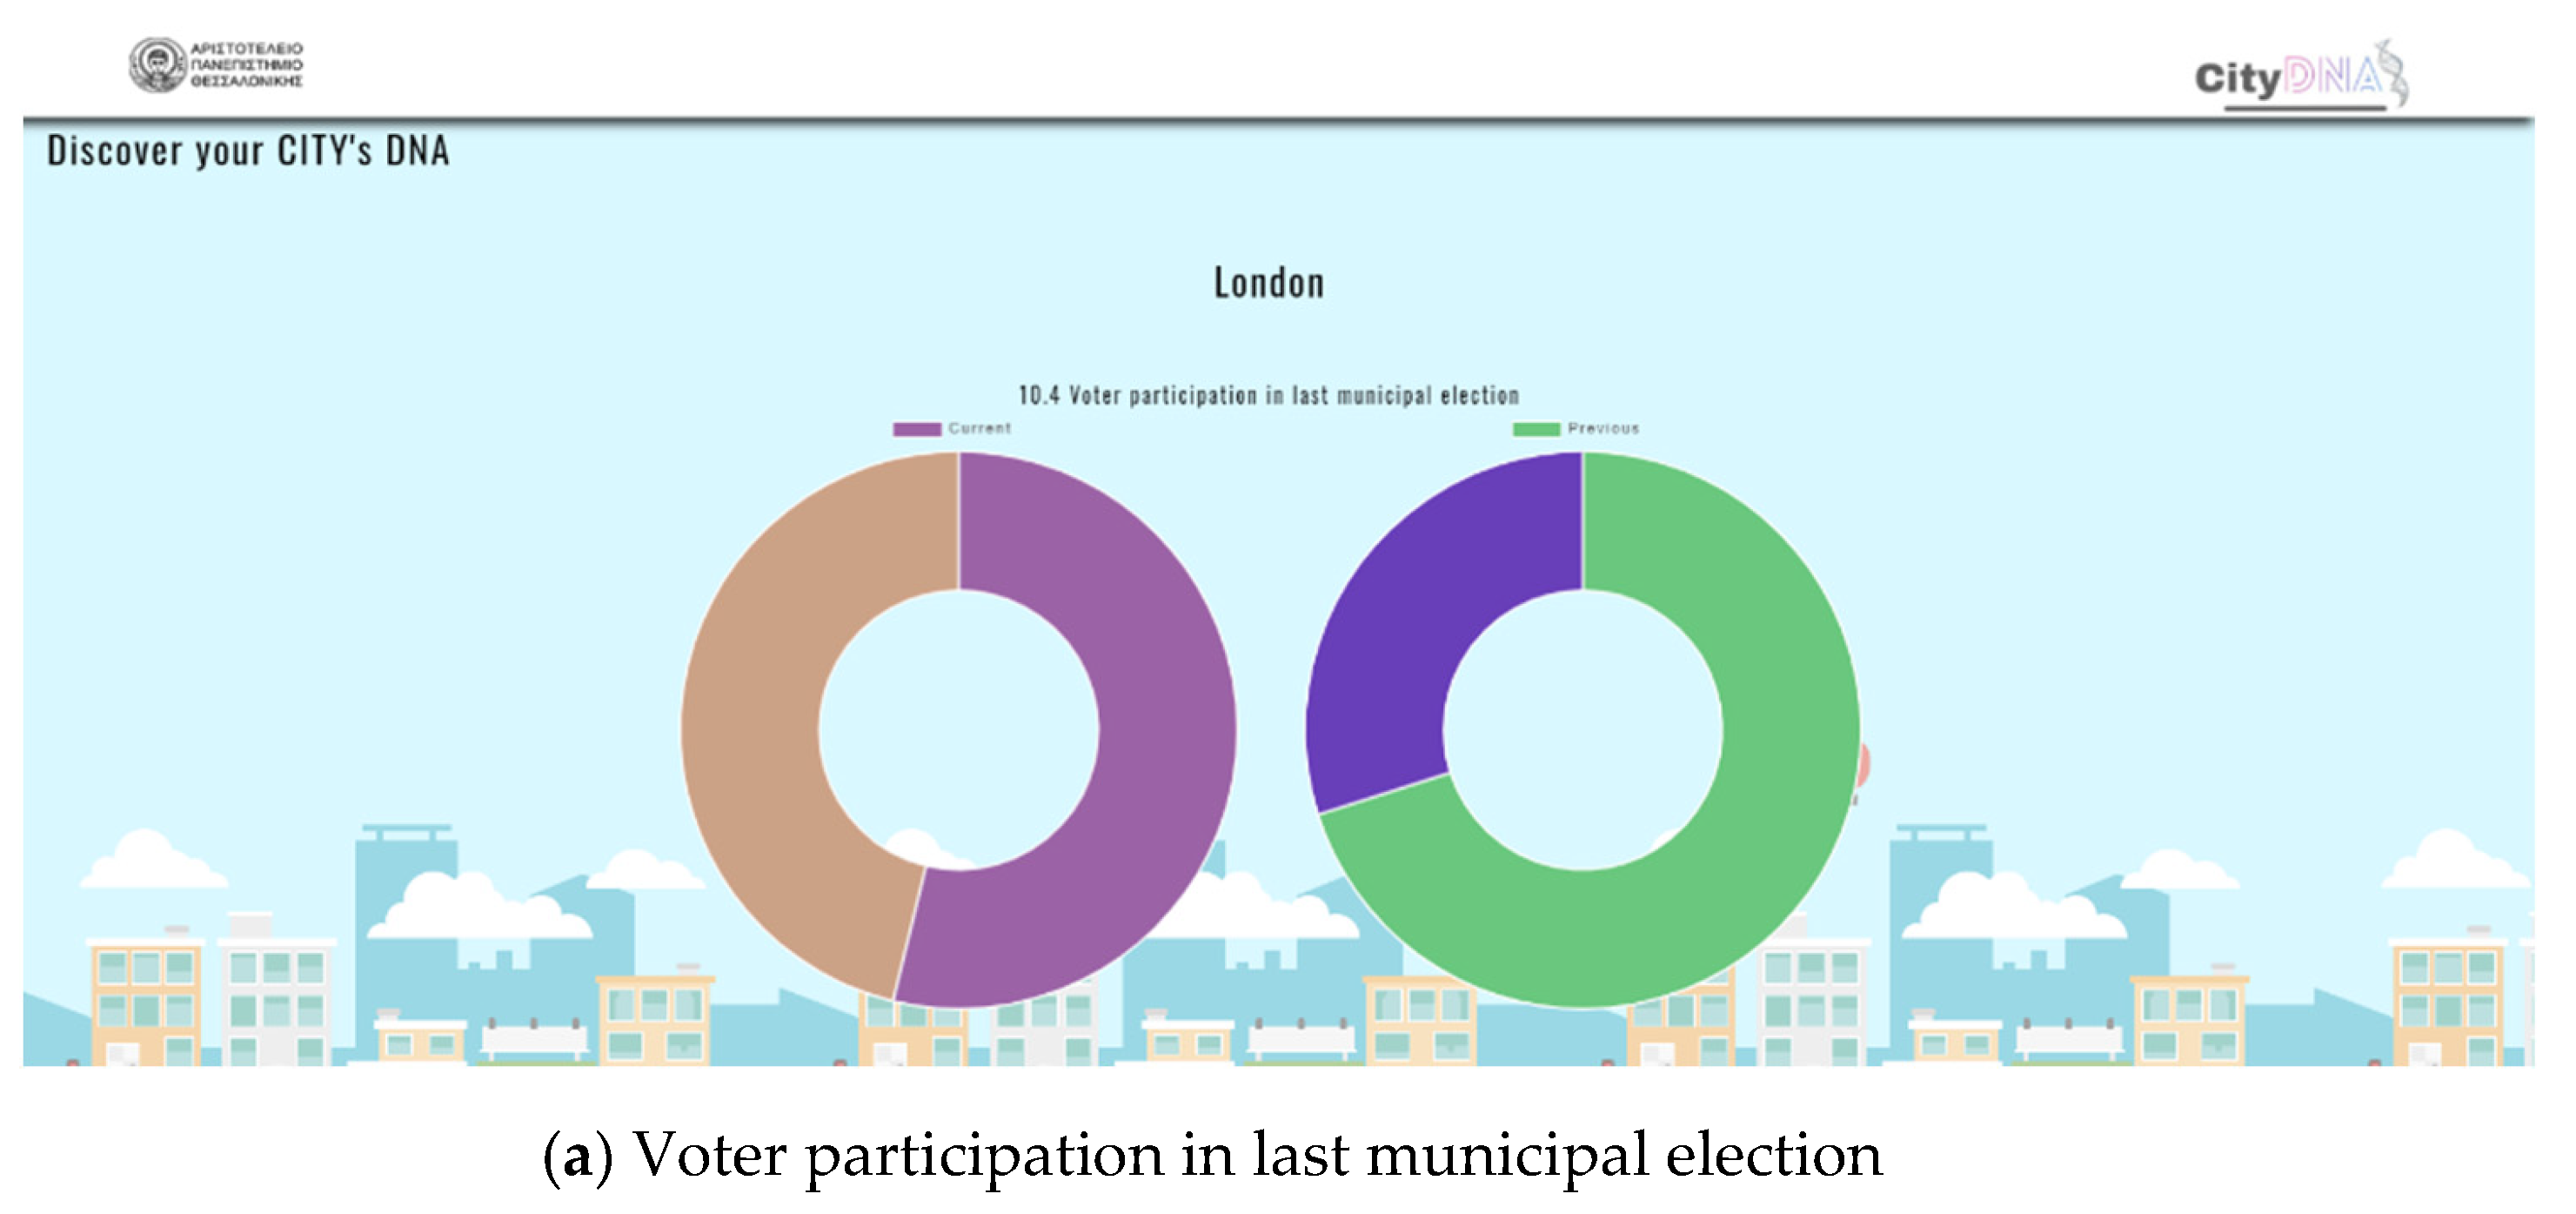
- The governance dimension includes the interaction of city managers with citizens, the provision of public and social services, transparent governance and policy-making [35]. The ISO themes and corresponding indicators proposed for its evaluation are presented in Table 1B. ISO 37120 indicators concern the assessment of voting participation and achievement of gender equality in politics, as well as the quality of social services provided to citizens, ISO 37122 indicators concern the evaluation of e-governance, transparency and the involvement of citizens in municipal e-services and ISO 37123 indicators relate to the evaluation of urban planning for the prevention and dealing with emergencies and the achievement of urban resilience. The data required for the synthesis of these indicators is collected by and owned by municipalities. Additionally, archival data is used mainly for the synthesis of ISO 37120 and 37123 indicators, while real-time and periodic data generated by crowdsourcing activities is used for ISO 37122 indicators.
- The environment dimension concerns the sustainable management and protection of natural resources and the environment. The issues and corresponding indicators proposed for this dimension are presented in Table 1C. Specifically, ISO 37120 proposes 31 indicators related to energy production and consumption, environmental quality, municipal waste and wastewater management, ISO 37122 proposes 24 indicators related to the exploitation of ICTs for monitoring and management of energy, the environment, solid and liquid waste and the use of alternative energy sources, with the aim of sustainability and improving the quality of life, and ISO 37123 proposes 13 indicators related to the management of extreme weather conditions and situations that threaten the ecosystem and the energy efficiency and the stability of the electricity supply network.
- The people dimension, which includes human and social capital, the proposed theme and its indicators are presented in Table 1D. ISO 37120 proposes indicators for assessing the level of citizens’ education and the provided education services, ISO 37122 proposes indicators for the evaluation of e-learning services and ISO 37123 proposes indicators for evaluating the readiness of citizens in cases of emergency and the treatment of educational interruption.
- The mobility dimension is associated with transport and ICTs in a city, and the proposed ISO themes and their indicators are presented in Table 1E. ISO 37120 proposes 10 indicators concerning the availability and provision of both ICTs and transport services, ISO 37122 proposes 17 indicators concerning the use of ICTs in transportation management aiming at sustainability and ISO 37123 proposes 2 indicators concerning the assurance of the operation of the ICT infrastructure and the evacuation of the roads in case of emergency.
- The living dimension includes all services related to quality of life, such as cultural and education facilities, housing quality, health conditions, safety, etc., and the proposed ISO themes and their indicators are presented in Table 1F. Specifically, ISO 37120 proposes 41 indicators related to the availability of urban facilities and the provision of services aimed at the well-being and happiness of citizens, ISO 37122 proposes 22 indicators that are related to the digitalization of urban services and the use of smart metering systems for the collection of data that is necessary for urban planning and improvement of service quality and ISO 37120 proposes 23 indicators, concerning preventive actions in order to ensure the uninterrupted provision of civil services and the well-being of citizens as well as the prevention of dangerous situations that threaten the city’s prosperity.
- Indicators related to the dimensions of economy and people mainly require archival data that are collected by public organizations (e.g., municipalities, chambers, labor organizations, tax services, ministry of education, etc.) and belong to local, regional and national authorities.
- The indicators proposed by ISO 37120 and ISO 37123, which concern the dimensions of governance, environment, mobility and living, require mainly archival data (e.g., data related to installed electric power, number of landfills, power generation mix, statistics for air pollution, etc.), which is collected and belongs to local, regional and national authorities. Additionally, the synthesis of some indicators requires the exploitation of real-time data, which is generated and collected by urban infrastructure and belongs to either local authorities or private companies.
- The indicators proposed by ISO 37122, which concern the dimensions of governance, environment, mobility and living, require mainly real-time data generated from the installed infrastructure owned either by local authorities or private companies, and from personal devices that are used by citizens to record their activities (e.g., energy consumption, amount of discarded solid waste, online booking, e-payments, etc.). This demand for real-time data utilization is due to the fact that these dimensions include services that affect the quality of life and performance of the city on a daily basis, and therefore real-time monitoring is required to enable immediate interventions.
- Different indicators are included in each standard aiming at the evaluation of different aspects of cities. Specifically, ISO 37120 includes indicators that measure mainly the quality of life and services in cities, ISO 37122 includes indicators that measure the exploitation of ICTs in urban services, while the indicators of the standard ISO 37123 aim at measuring the readiness of the city in dealing with emergencies and its resilience. Therefore, these standards can be used either separately by synthesizing the city profile and measuring city performance based on the indicators they include, or in combination by synthesizing the overall profile of the city and measuring its overall performance.
- The proposed indicators, which were defined and proposed after a thorough investigation and study by the ISO Technical Committees to provide a comprehensive view of the cities, focus unilaterally on specific urban services and aspects, ignoring the rest, which are probably important for other cities. As pointed out in [12], further analysis of the needs of cities and the enrichment of existing standards with new indicators is required to capture the overall city profile.
- The identification of the proposed indicators requires the existence and exploitation of relevant KPI-driven urban data. In this respect, it appears that the majority of indicators are determined by archival data, which is collected by various organizations (i.e., local authorities, private companies, citizens, etc.) and becomes available to local authorities for consumption and sharing through their open data platforms [18]. In addition, real-time data is required for the synthesis of the indicators proposed by ISO 37122. However, the existence and availability of KPI-driven urban data remains limited in several cities worldwide. This is due either to the lack of resources required to develop the appropriate infrastructure for data collection and management, or to the lack of standardization of urban data and to the limited exploitation of crowdsourcing activities. Recognizing the demand for city standardization and benchmarking, WWCD, which is the global leader in standardized city data aiming at creating smart, sustainable, resilient and prosperous cities, has developed the WCCD Global Cities Registry (https://www.dataforcities.org/global-cities-registry (accessed on 10 February 2020)), that is the internationally recognized list of cities certified according to ISO 37120 and its certification system. The certification concerns the cites’ data that are verified and comply with ISO 37120, which are then published in the WCCD Open Data Portal for a period of one year, offering city-to-city comparisons, data analytics and visualization.
- The proposed indicators are common to all cities that differ in their intrinsic and extrinsic characteristics. As [19] pointed out, each city has its own peculiarities, and for this reason, they have to adapt the ISO standards and international best practices based on them, in order to achieve their transformation. As a result, the synthesis of ISO indicators may not be feasible for some cities since they may not support the services listed in these standards or may not have relevant data.
- In the context of urban standardization, it would be practical to study and to set up a city model, which will become the reference city, and the indicators will have the ideal values for achieving smartness and resilience. According to [20], the standards developed in ISO 37120 do not provide recommended values or thresholds for cities, but provide what and how to measure ambitiously to help cities compare and evaluate performance metrics. The definition of a reference city requires a lot of effort since cities differ from each other, and they should be categorized based on their common characteristics (e.g., size, location, socio-economic situation, etc.). However, it will facilitate benchmarking of cities and the adoption of best practices for urban improvement.
5. An Organic Model for Smart City Benchmarking
5.1. The cityDNA Framework Principles and Outline
- City is a “living organism” that inherits its past (economy, environment, governance, people, living, mobility) and shapes its future based on its current conditions (infrastructures) and choices (planning).
- City is considered as a six-dimensional system, as it were defined by [35].
- KPIs proposed by ISO 37120:2018 Standard [22] are used for “cityDNA” synthesis.
- KPI-driven urban data retrieved from open data platforms is used for KPI synthesis.
5.2. “cityDNA” Model Building
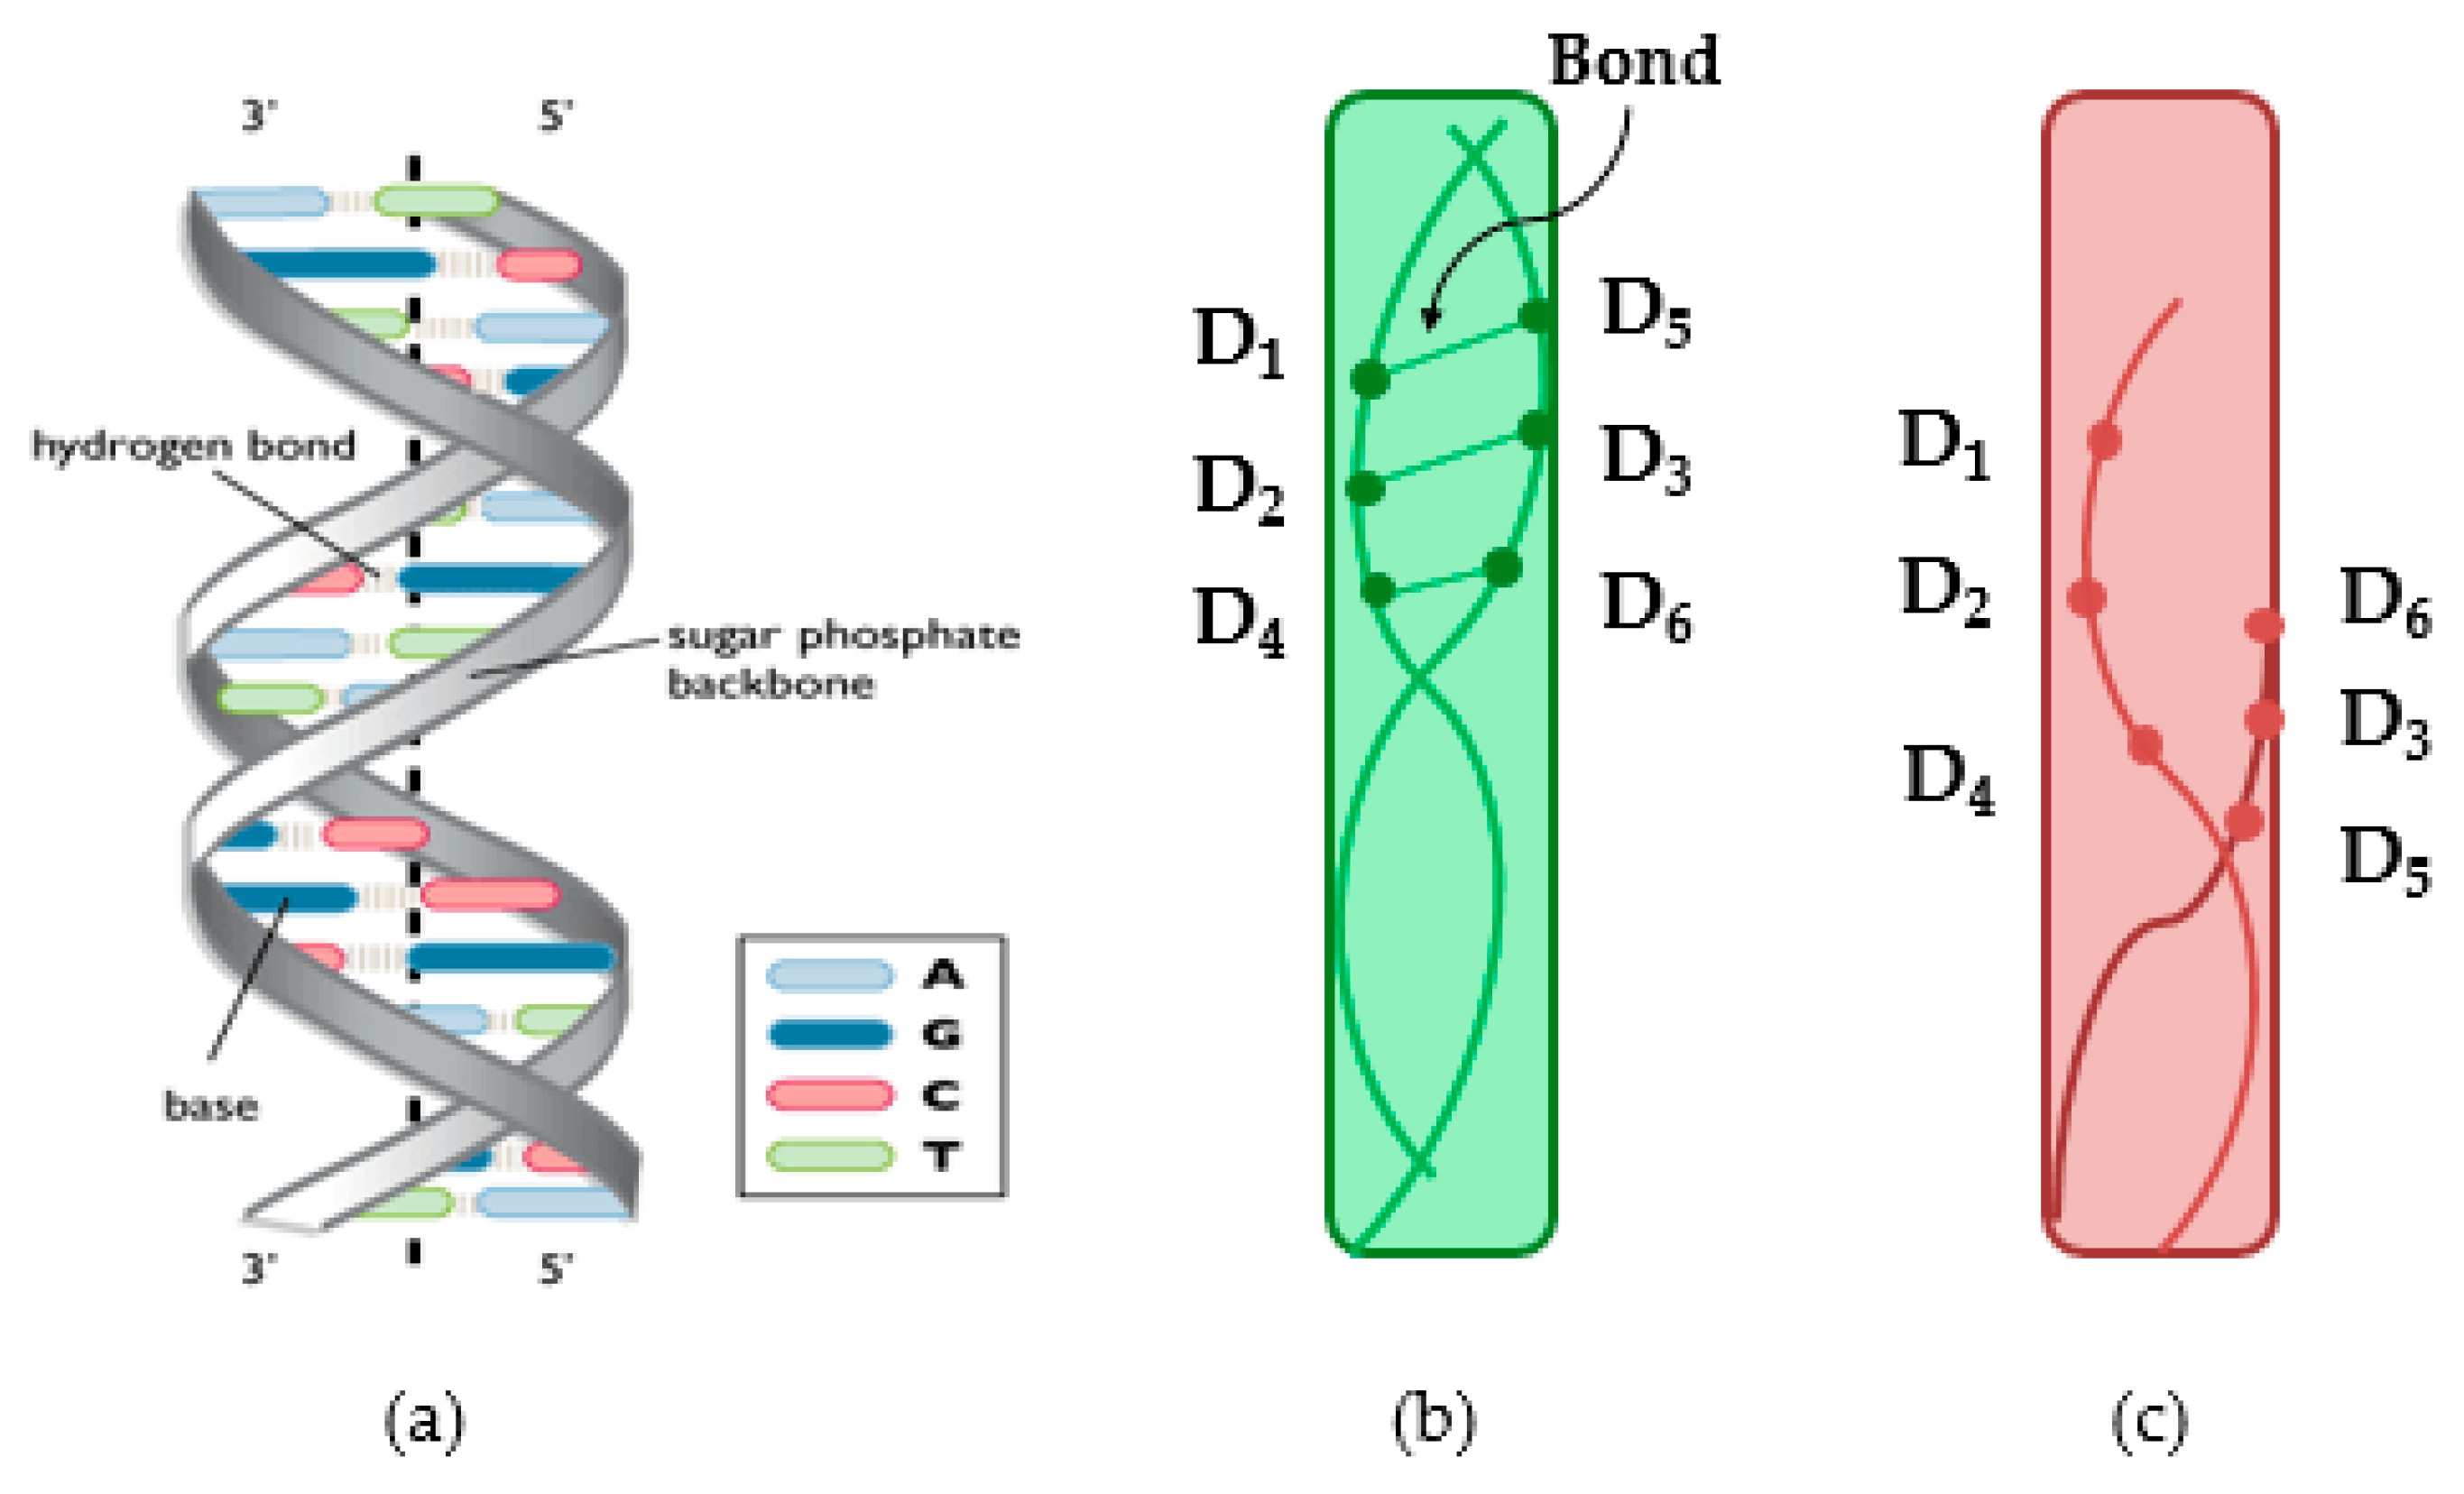
- The “cityDNA” profile, similar to human DNA, is a snapshot of the “cityDNA” double helix that reflects the current city profile and reveals the state of city health.
- The “cityDNA” double helix consist of two strands that are held together by bonds.
- Each strand consists of three city dimensions (triplet) whose states change over time.
- Each city dimension is described by a single KPI rather than multiple KPIs, as in reality. Since cities are complex ecosystems and the identification of each of the six dimensions requires the exploitation and combination of many KPIs, this simplification is performed to avoid the complexity of the calculations in this initial phase of the “cityDNA” model development.
- Each city dimension is described by at least one KPI which is defined as follows:
- Di = (x/y) × 100, where i = 1 (ecn), 2 (gov), 3 (ppl), 4 (env), 5 (liv), 6 (mob) and Di ∈ [0,1], y: strategic objective defined by the city to address the SSC challenges, and x: the achieved value. For instance, in the case of KPI 7.1 (ISO 37120), that is related to total end-user energy consumption per capita (GJ/year), x is defined as the actual value, while y is defined as the ideal value of end-user energy per capita that should have been consumed based on the municipality’s energy policy.
- Definition of reference cities (city with the best/worst performance) for the development of a benchmarking metric between them and the city under consideration.
- The data used for the synthesis of the indicators come from well-intentioned users who are interested in the city in which they live.
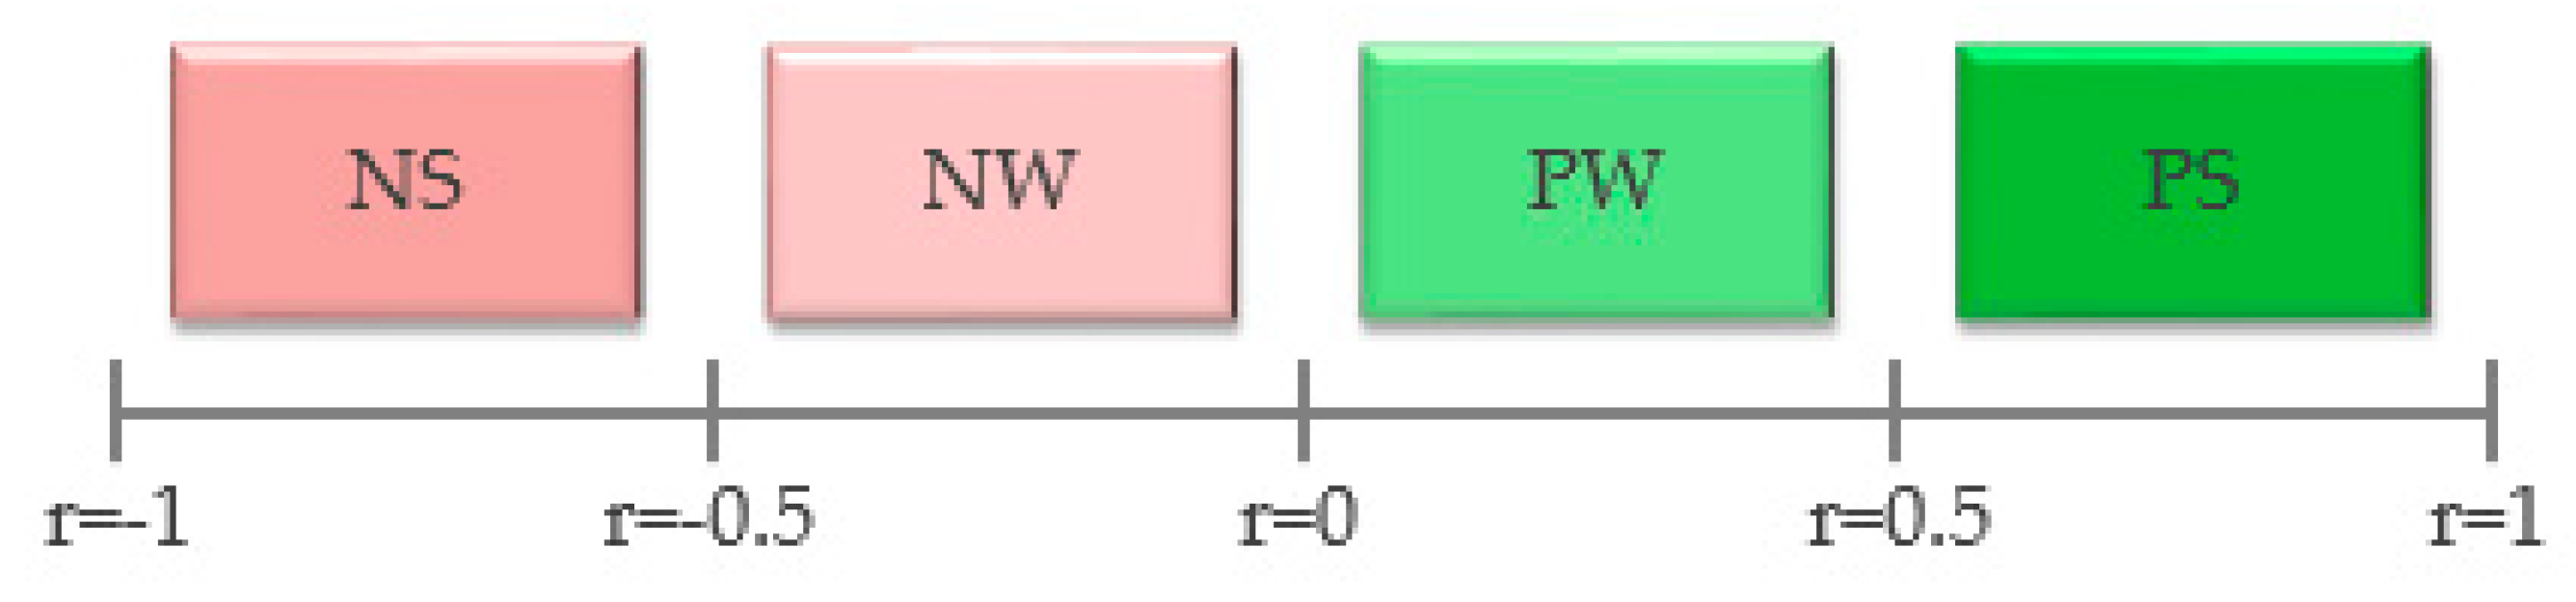
- Positive and weak bond (PW bond): 0 ≤ r ≤ 0.5.
- Positive and strong bond (PS bond): 0.5 < r ≤ 1.
- Negative and weak bond (NW bond): −0.5 ≤ r < 0.
- Negative and strong bond (NS bond): −1 ≤ r < −0.5.
6. “cityDNA” Framework Implementation and Verification
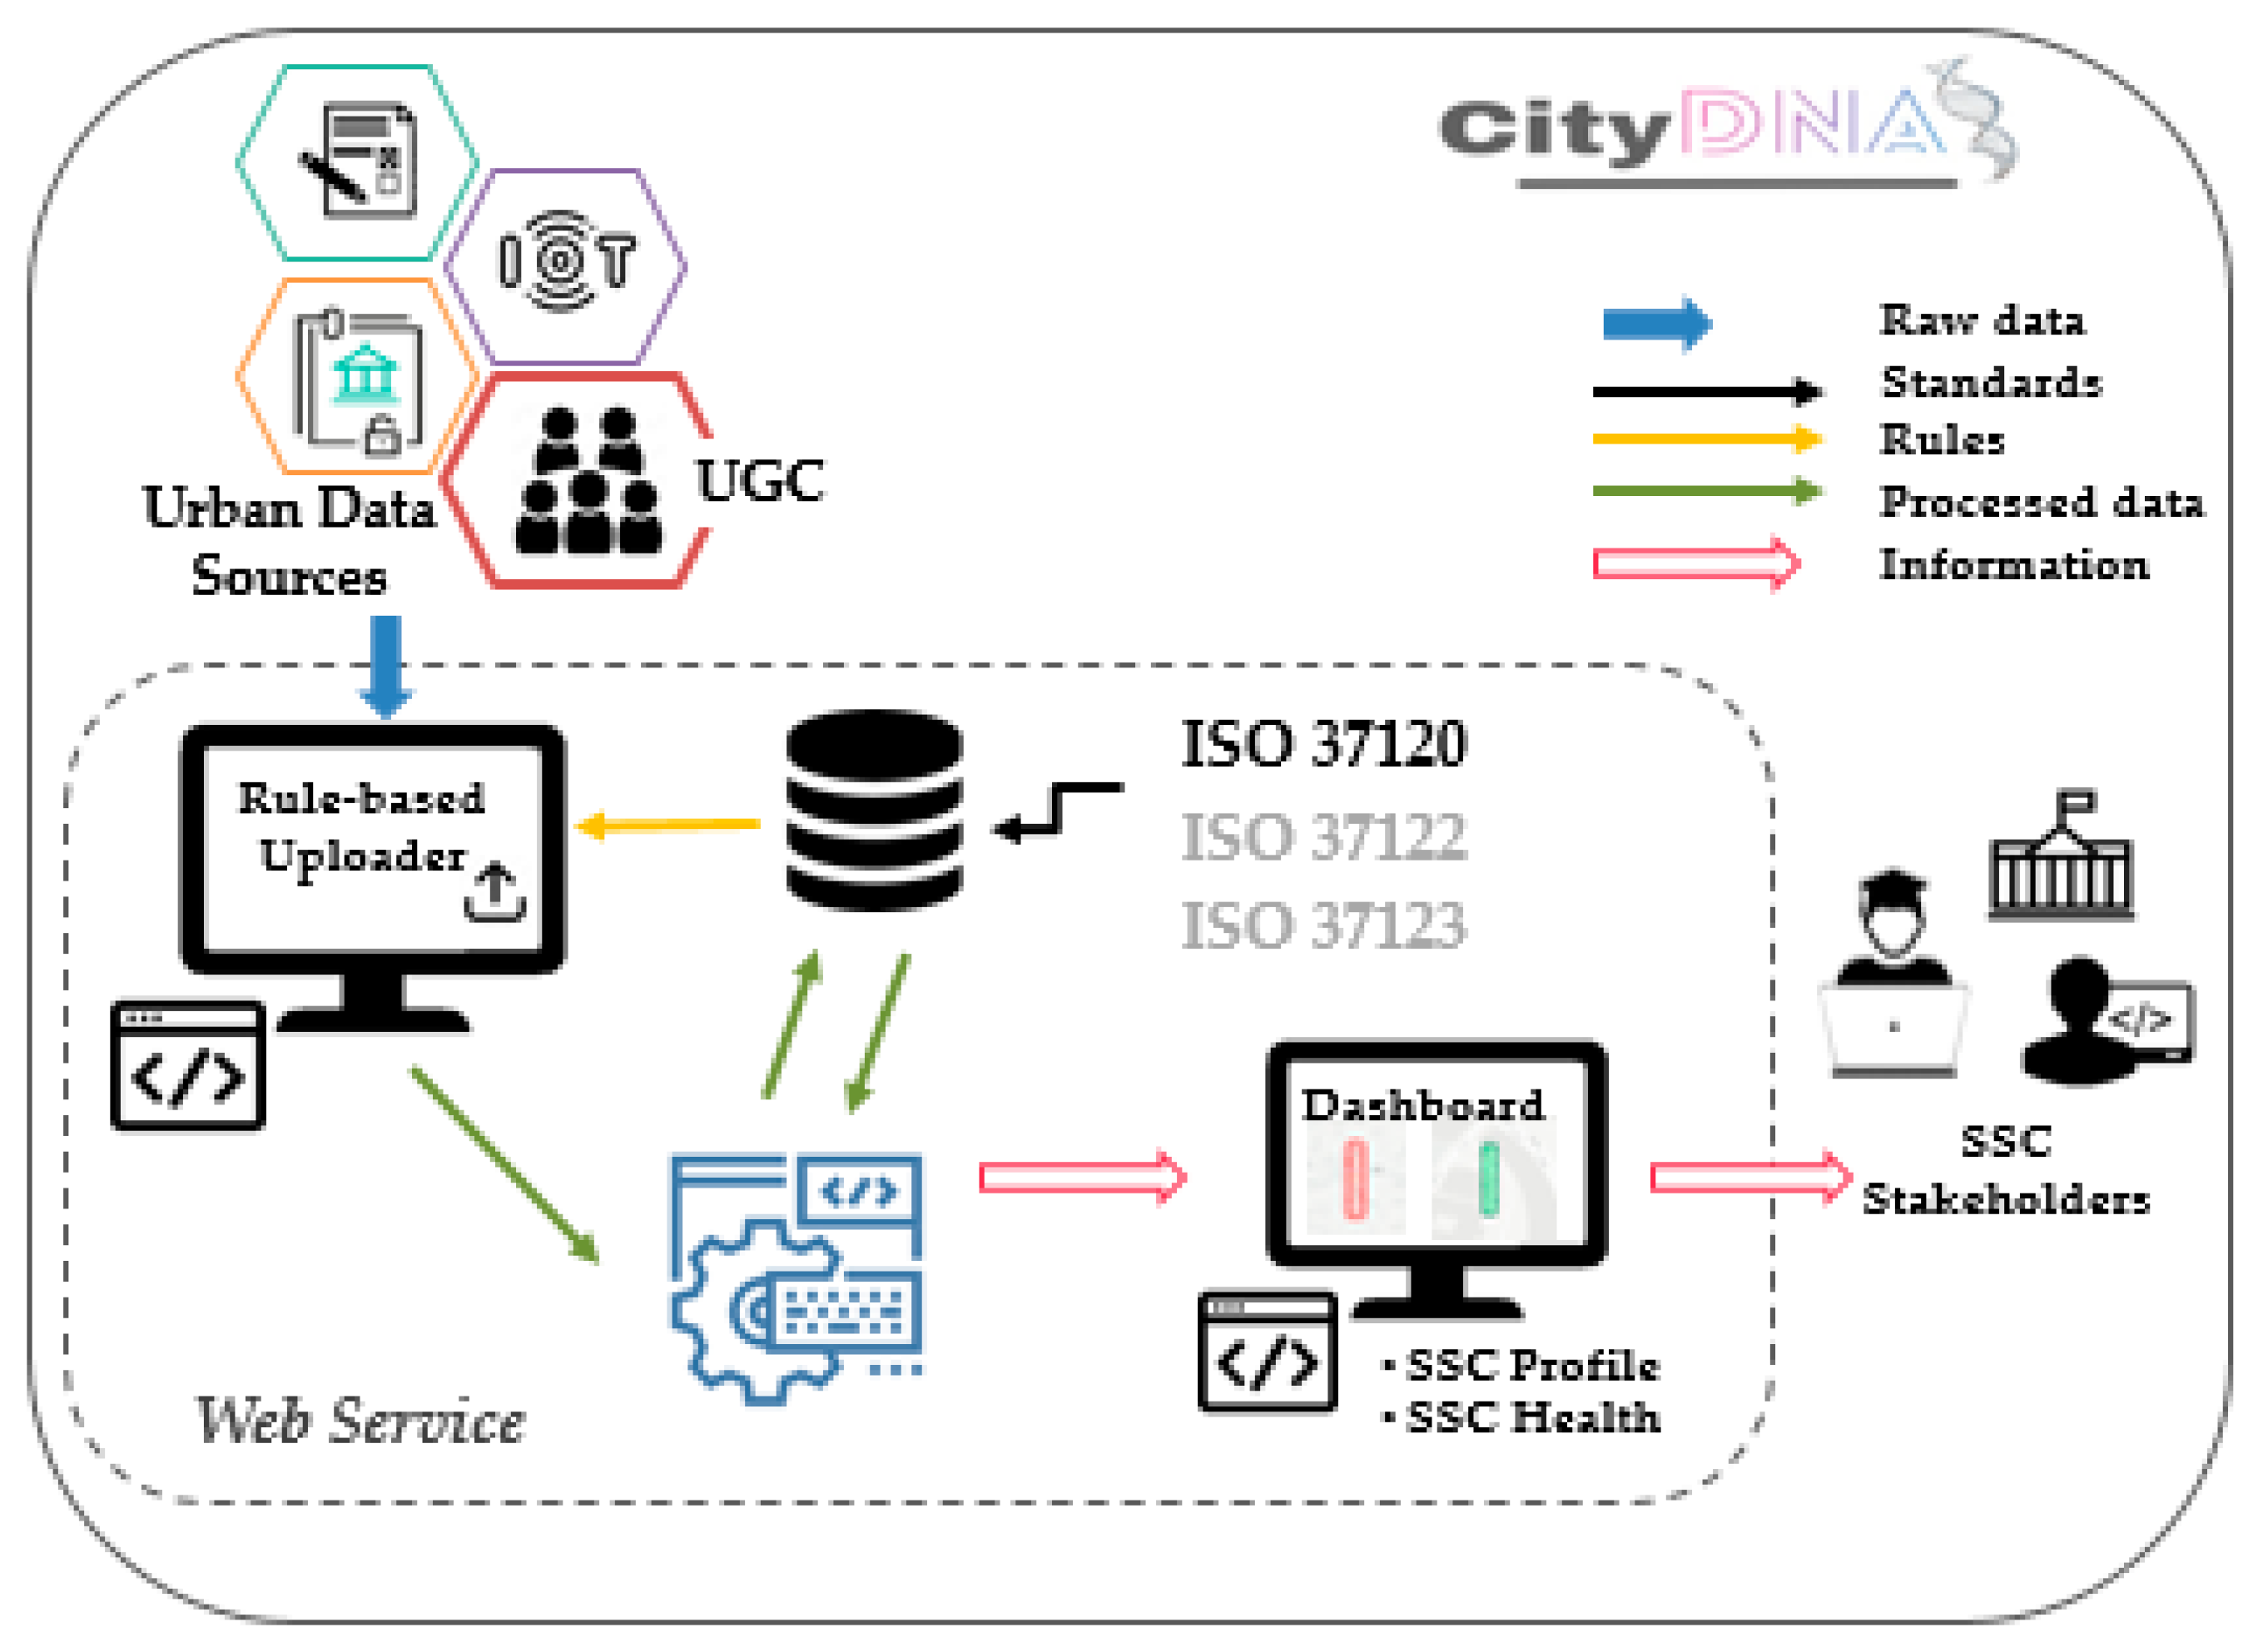
6.1. “cityDNA” Model Realization as a Web Service
6.2. Use Case for Model Verification
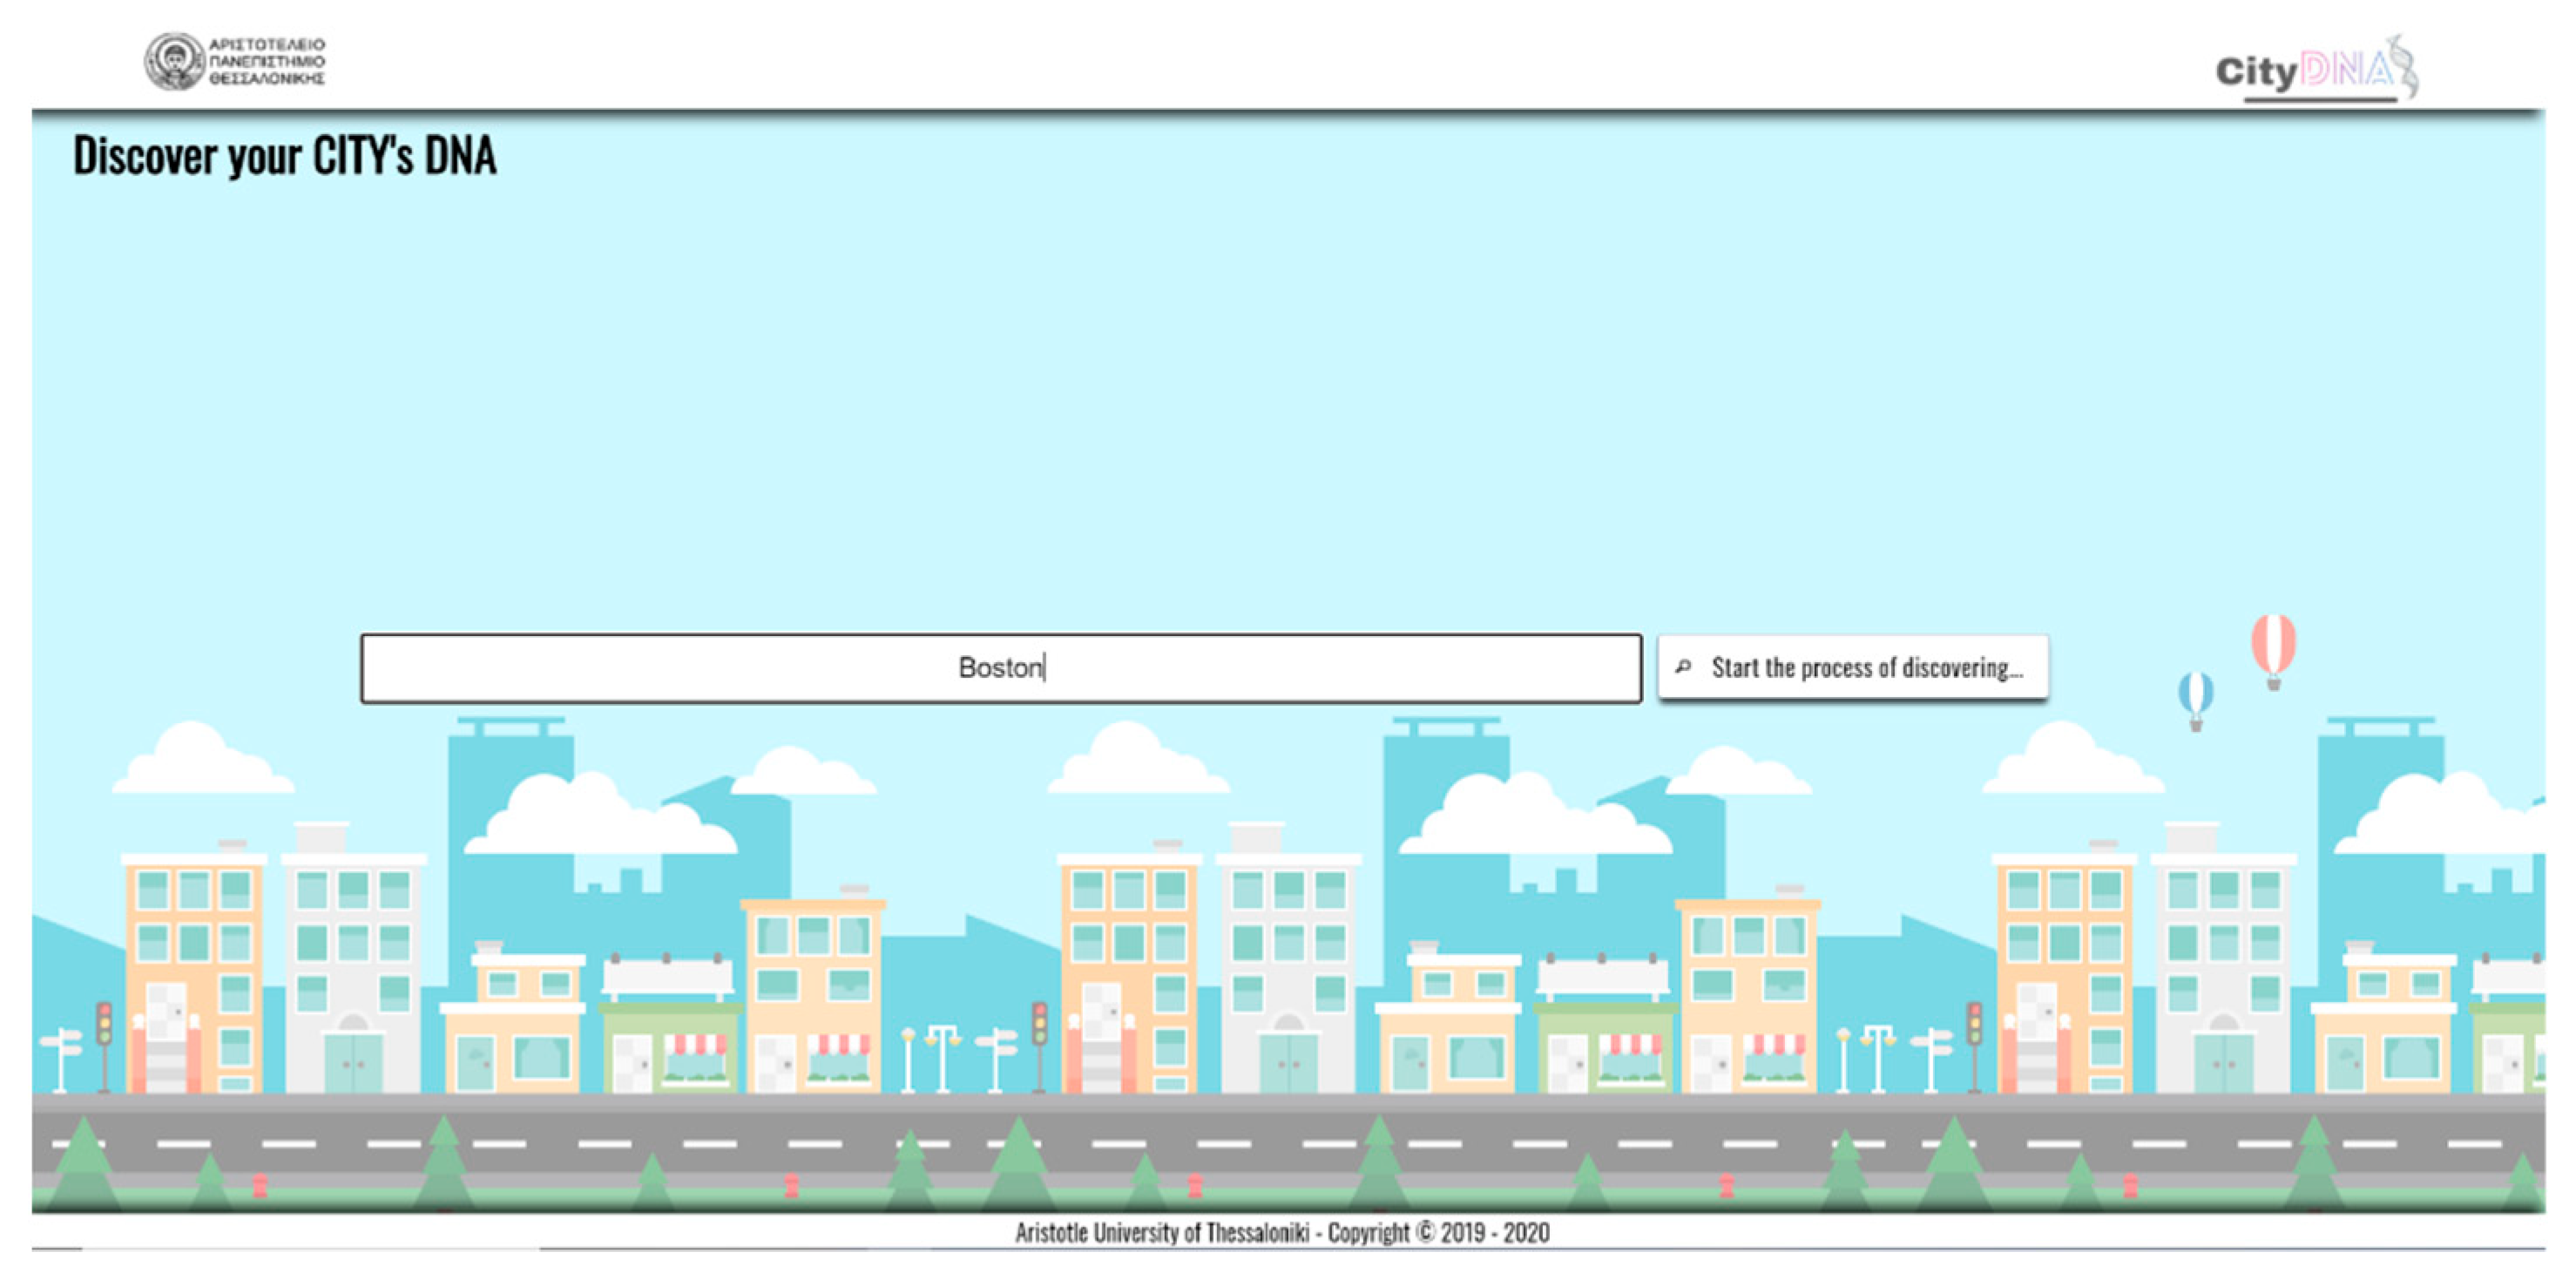
- Enter the name of the preferred city (e.g., Boston) and press the “Start the process of discovering” button (Figure 6).
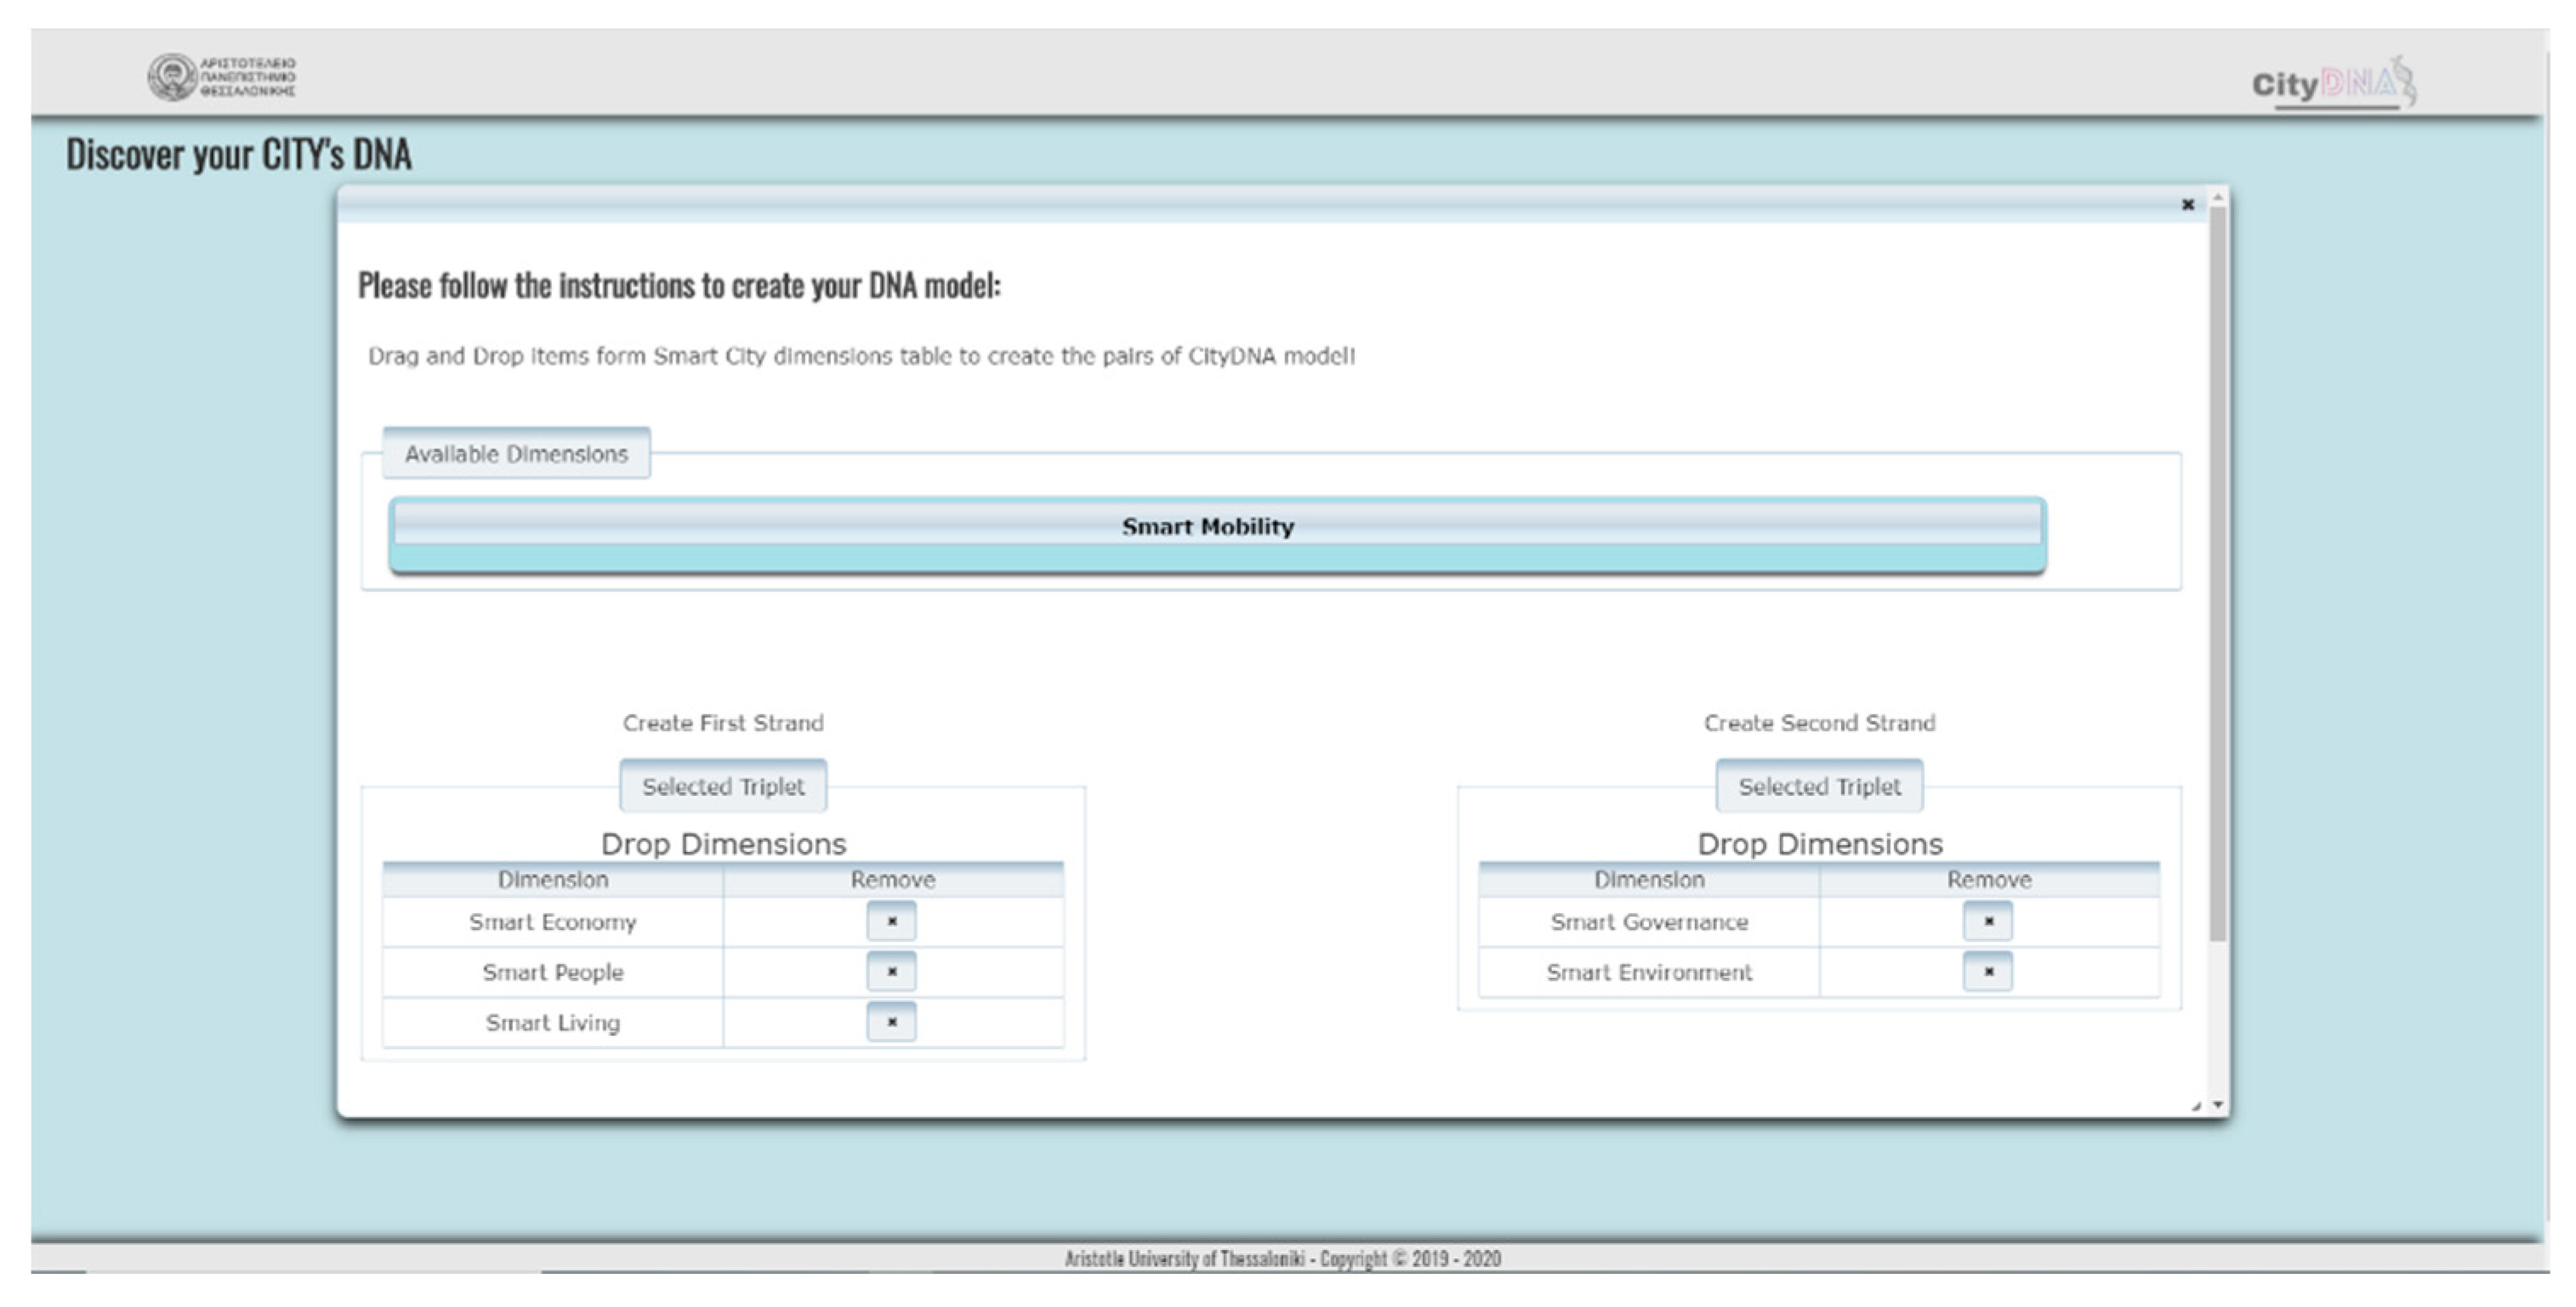
- Select the preferred pairs of dimensions through an easy-to-use “drag and drop” menu that includes the six city dimensions (Figure 7). KPIs of ISO 37120:2018 were set and are available for each of the six dimensions. These indicators are displayed by selecting the pairs of dimensions, as depicted in Figure 7. It is noted that due to the complexity due to the existence of many indicators per dimension, this version supports the selection of only one KPI per dimension.
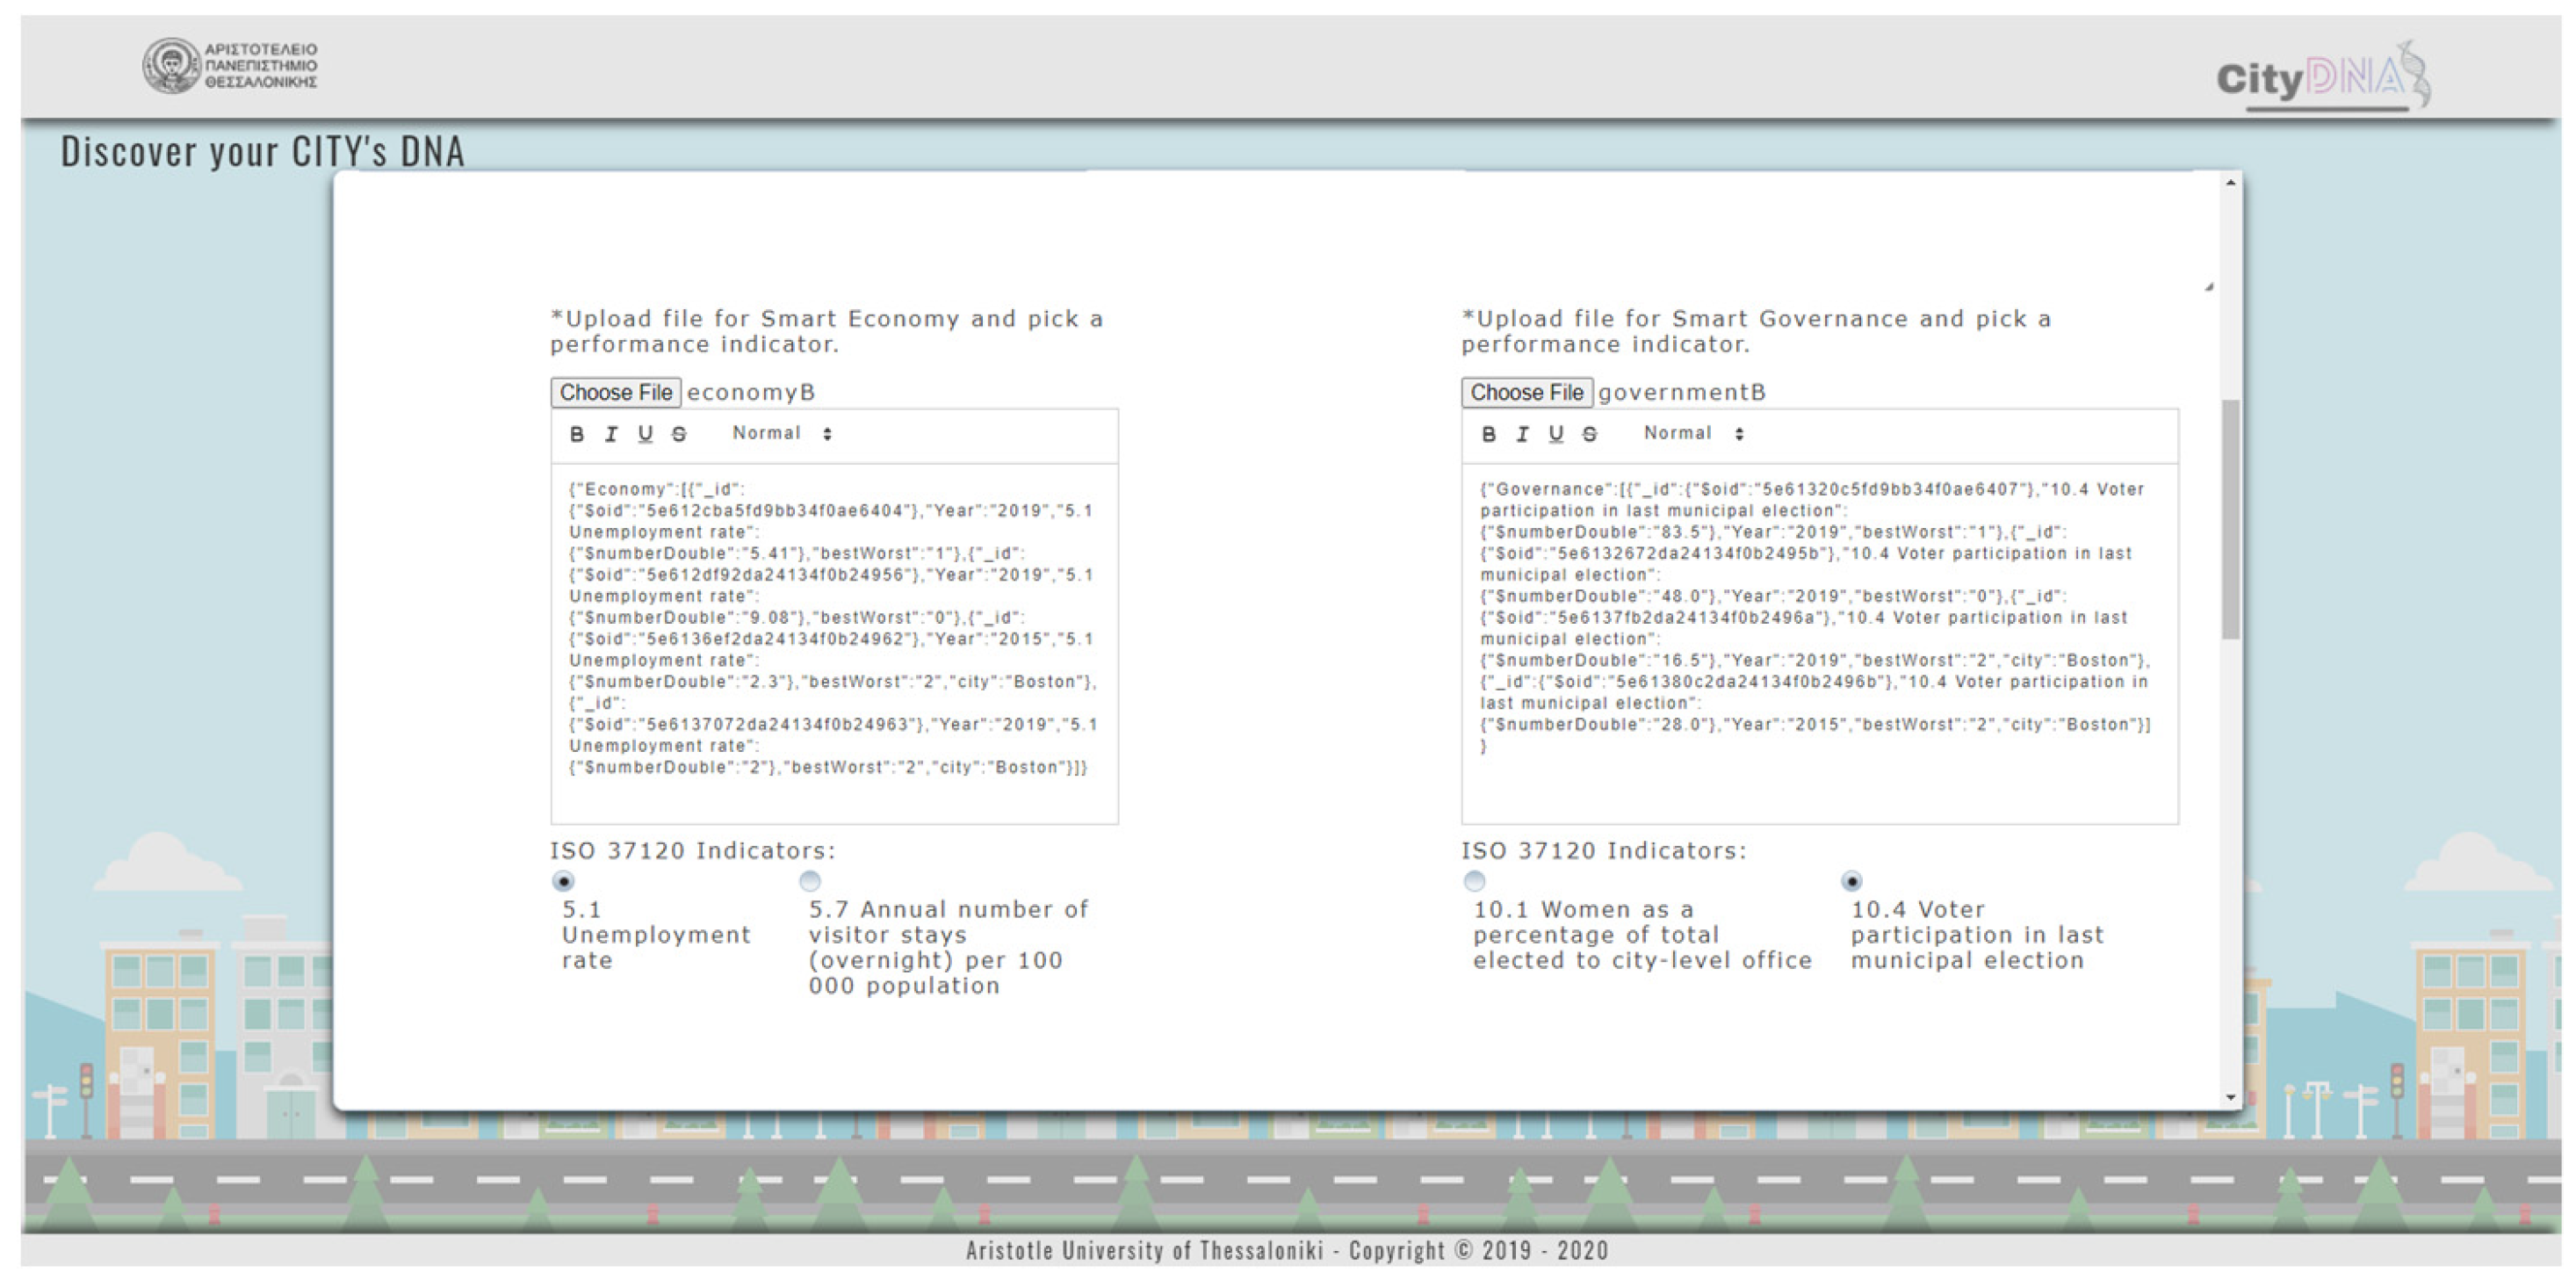
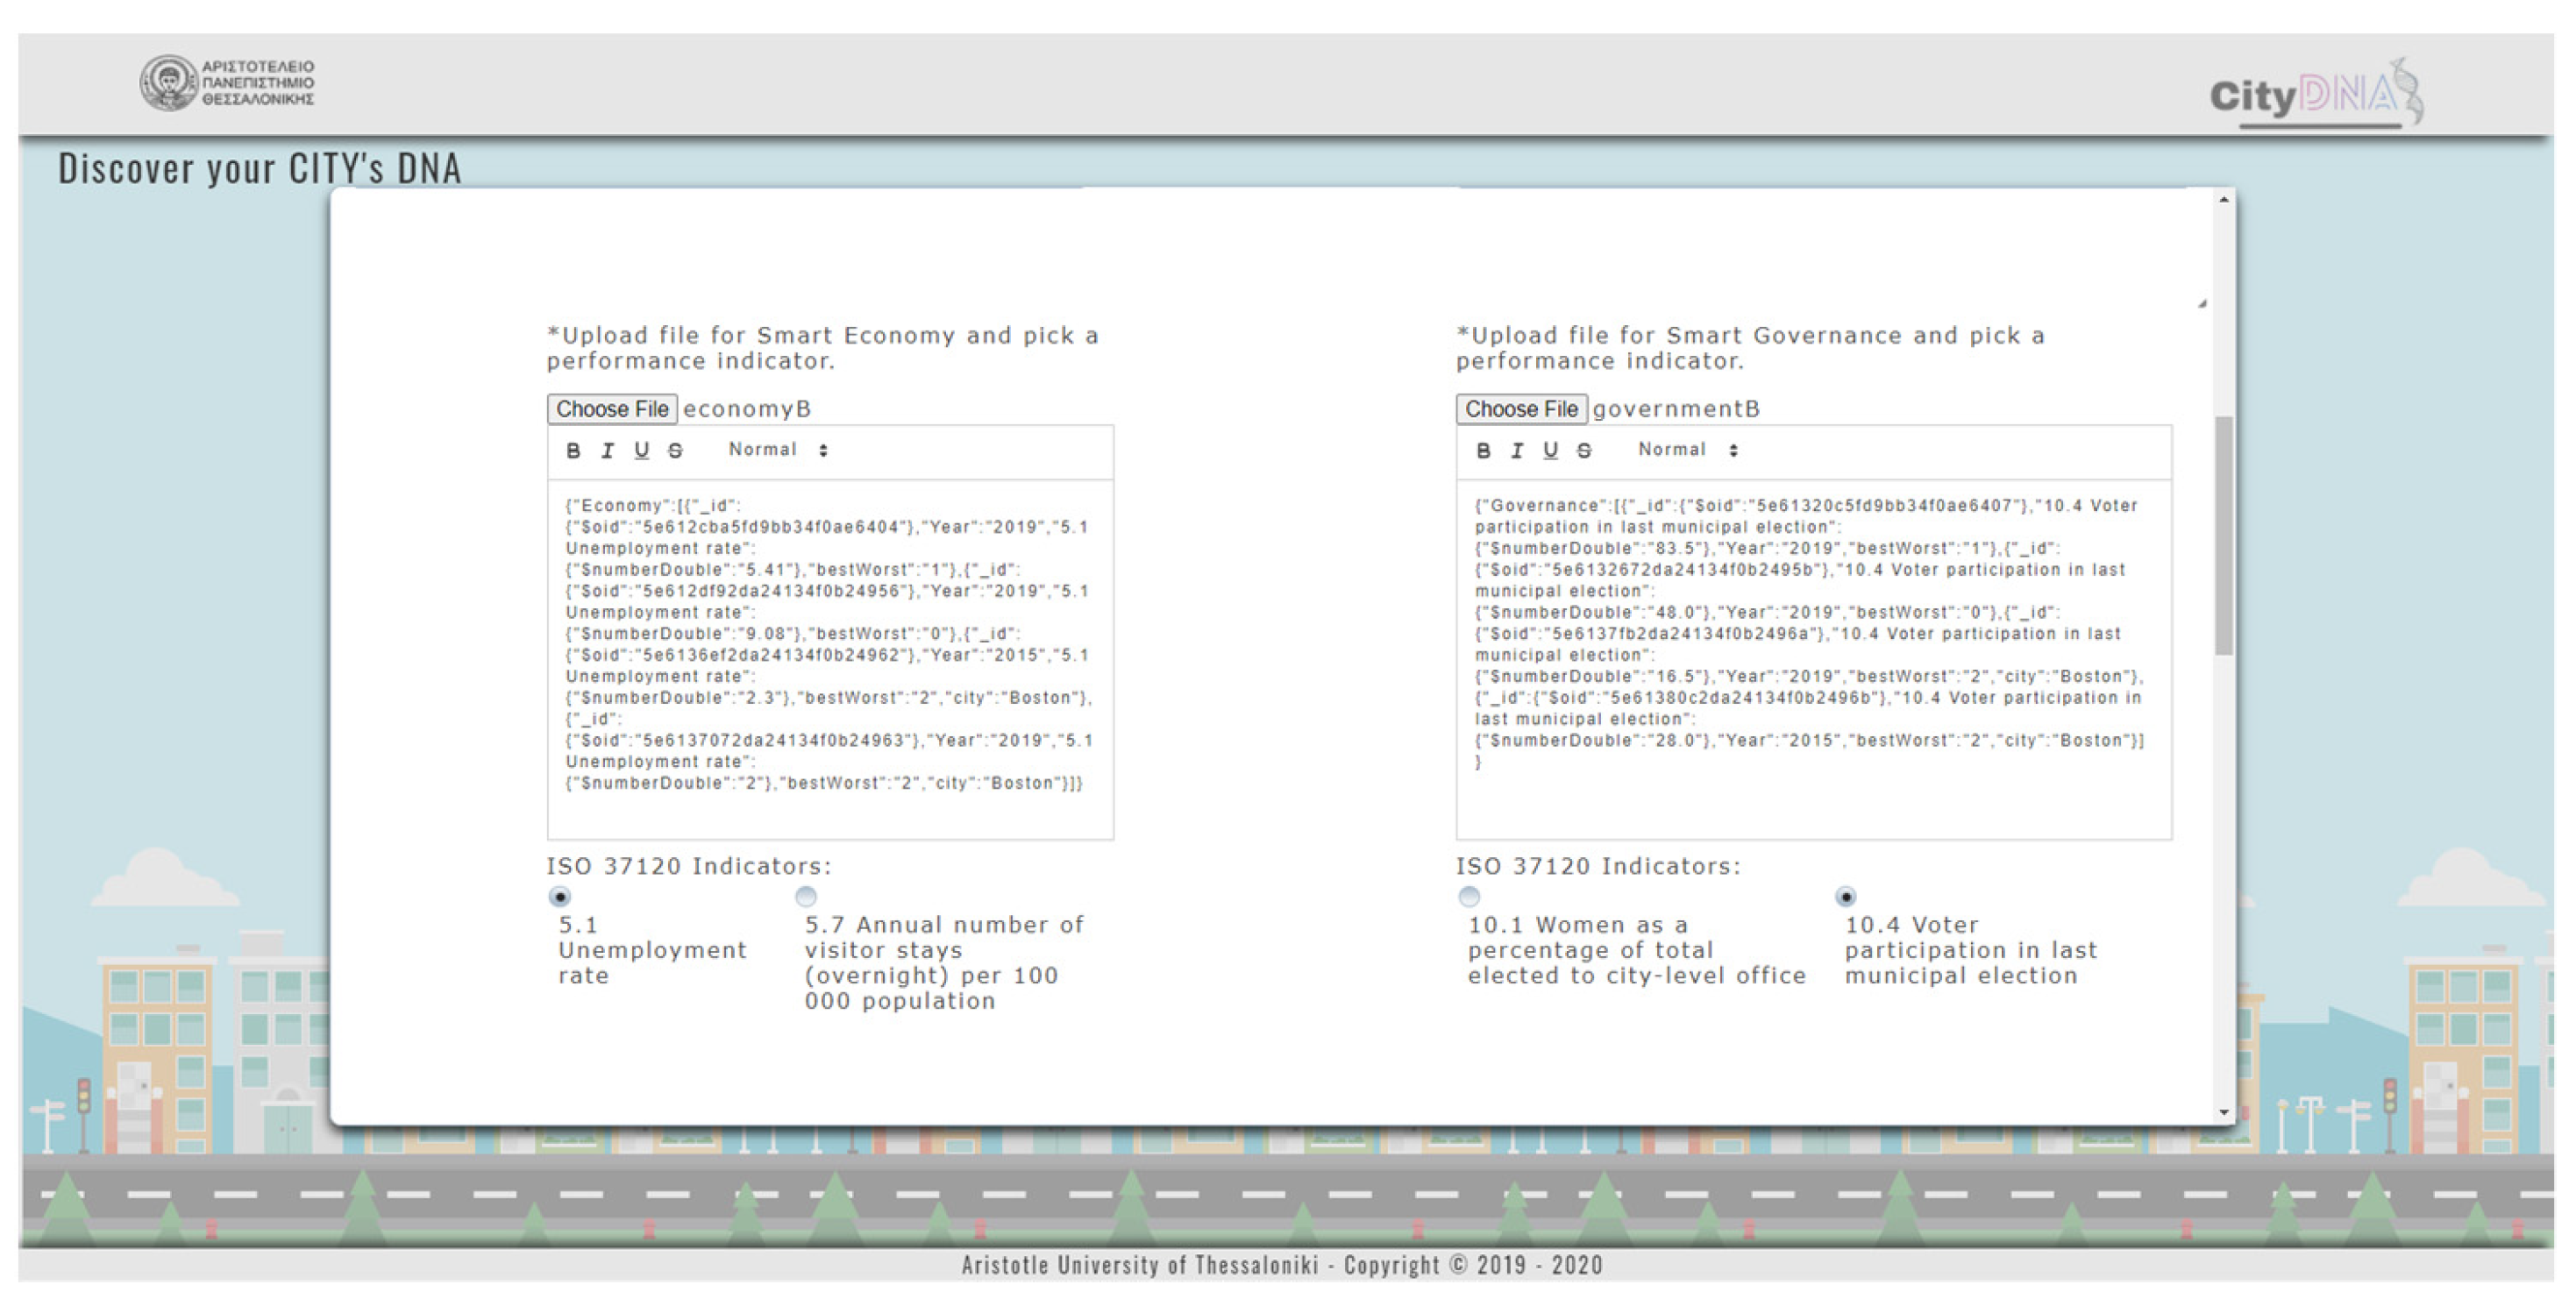
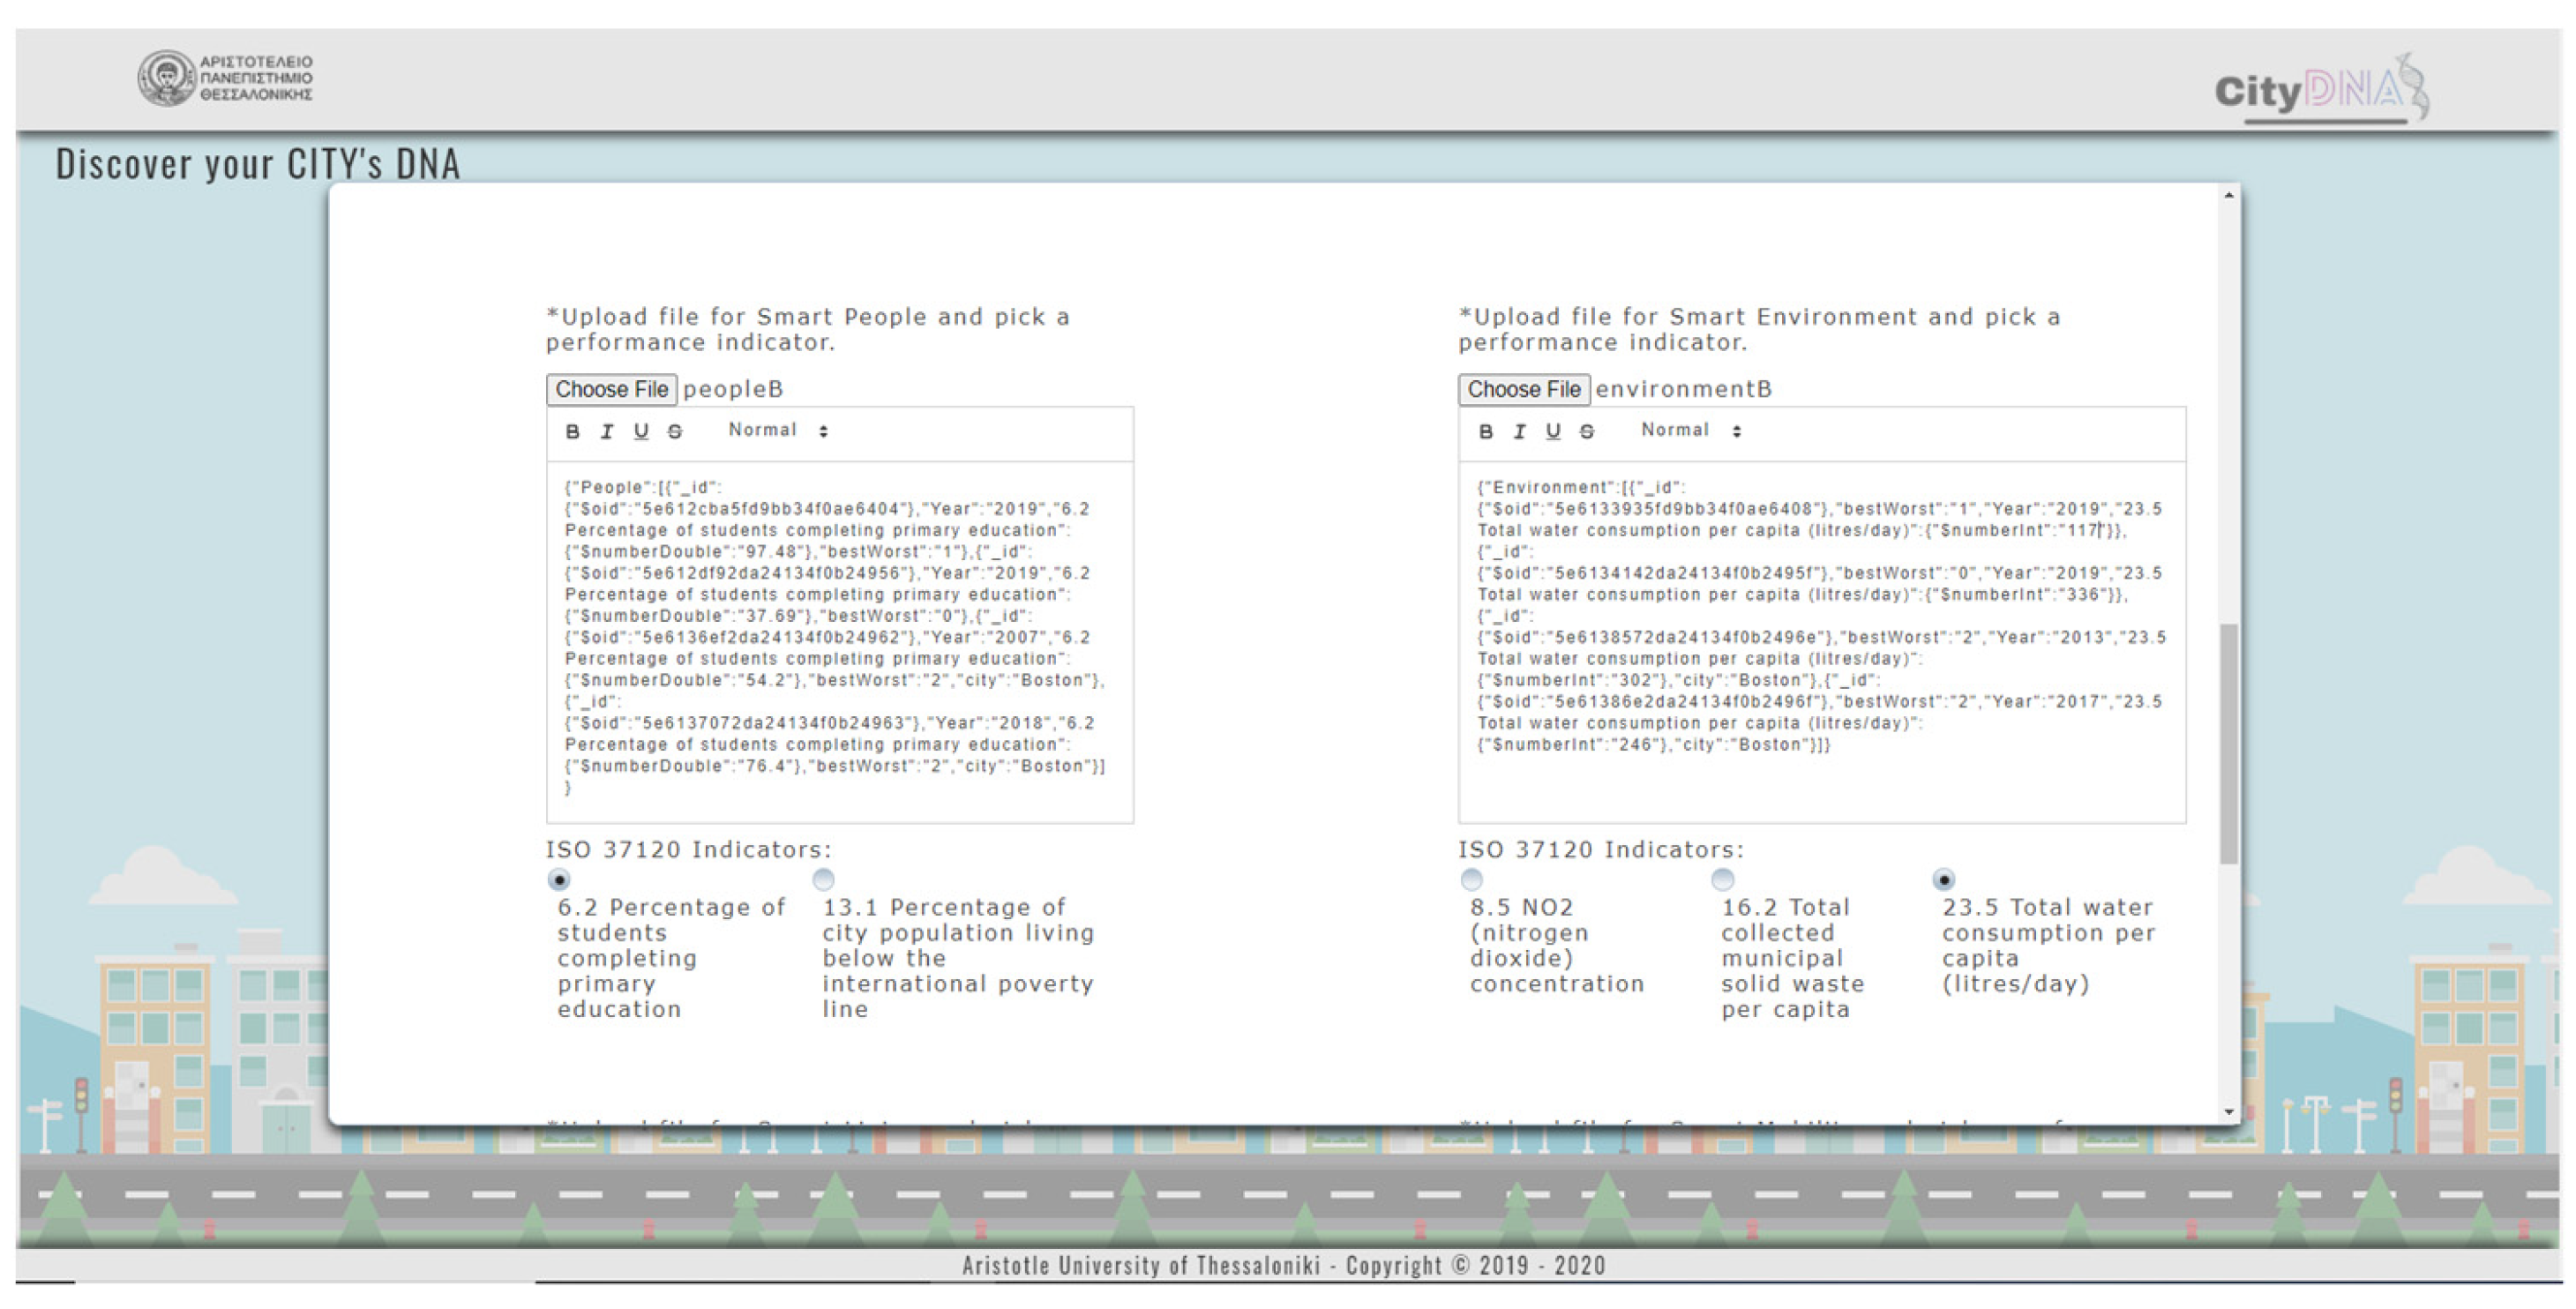
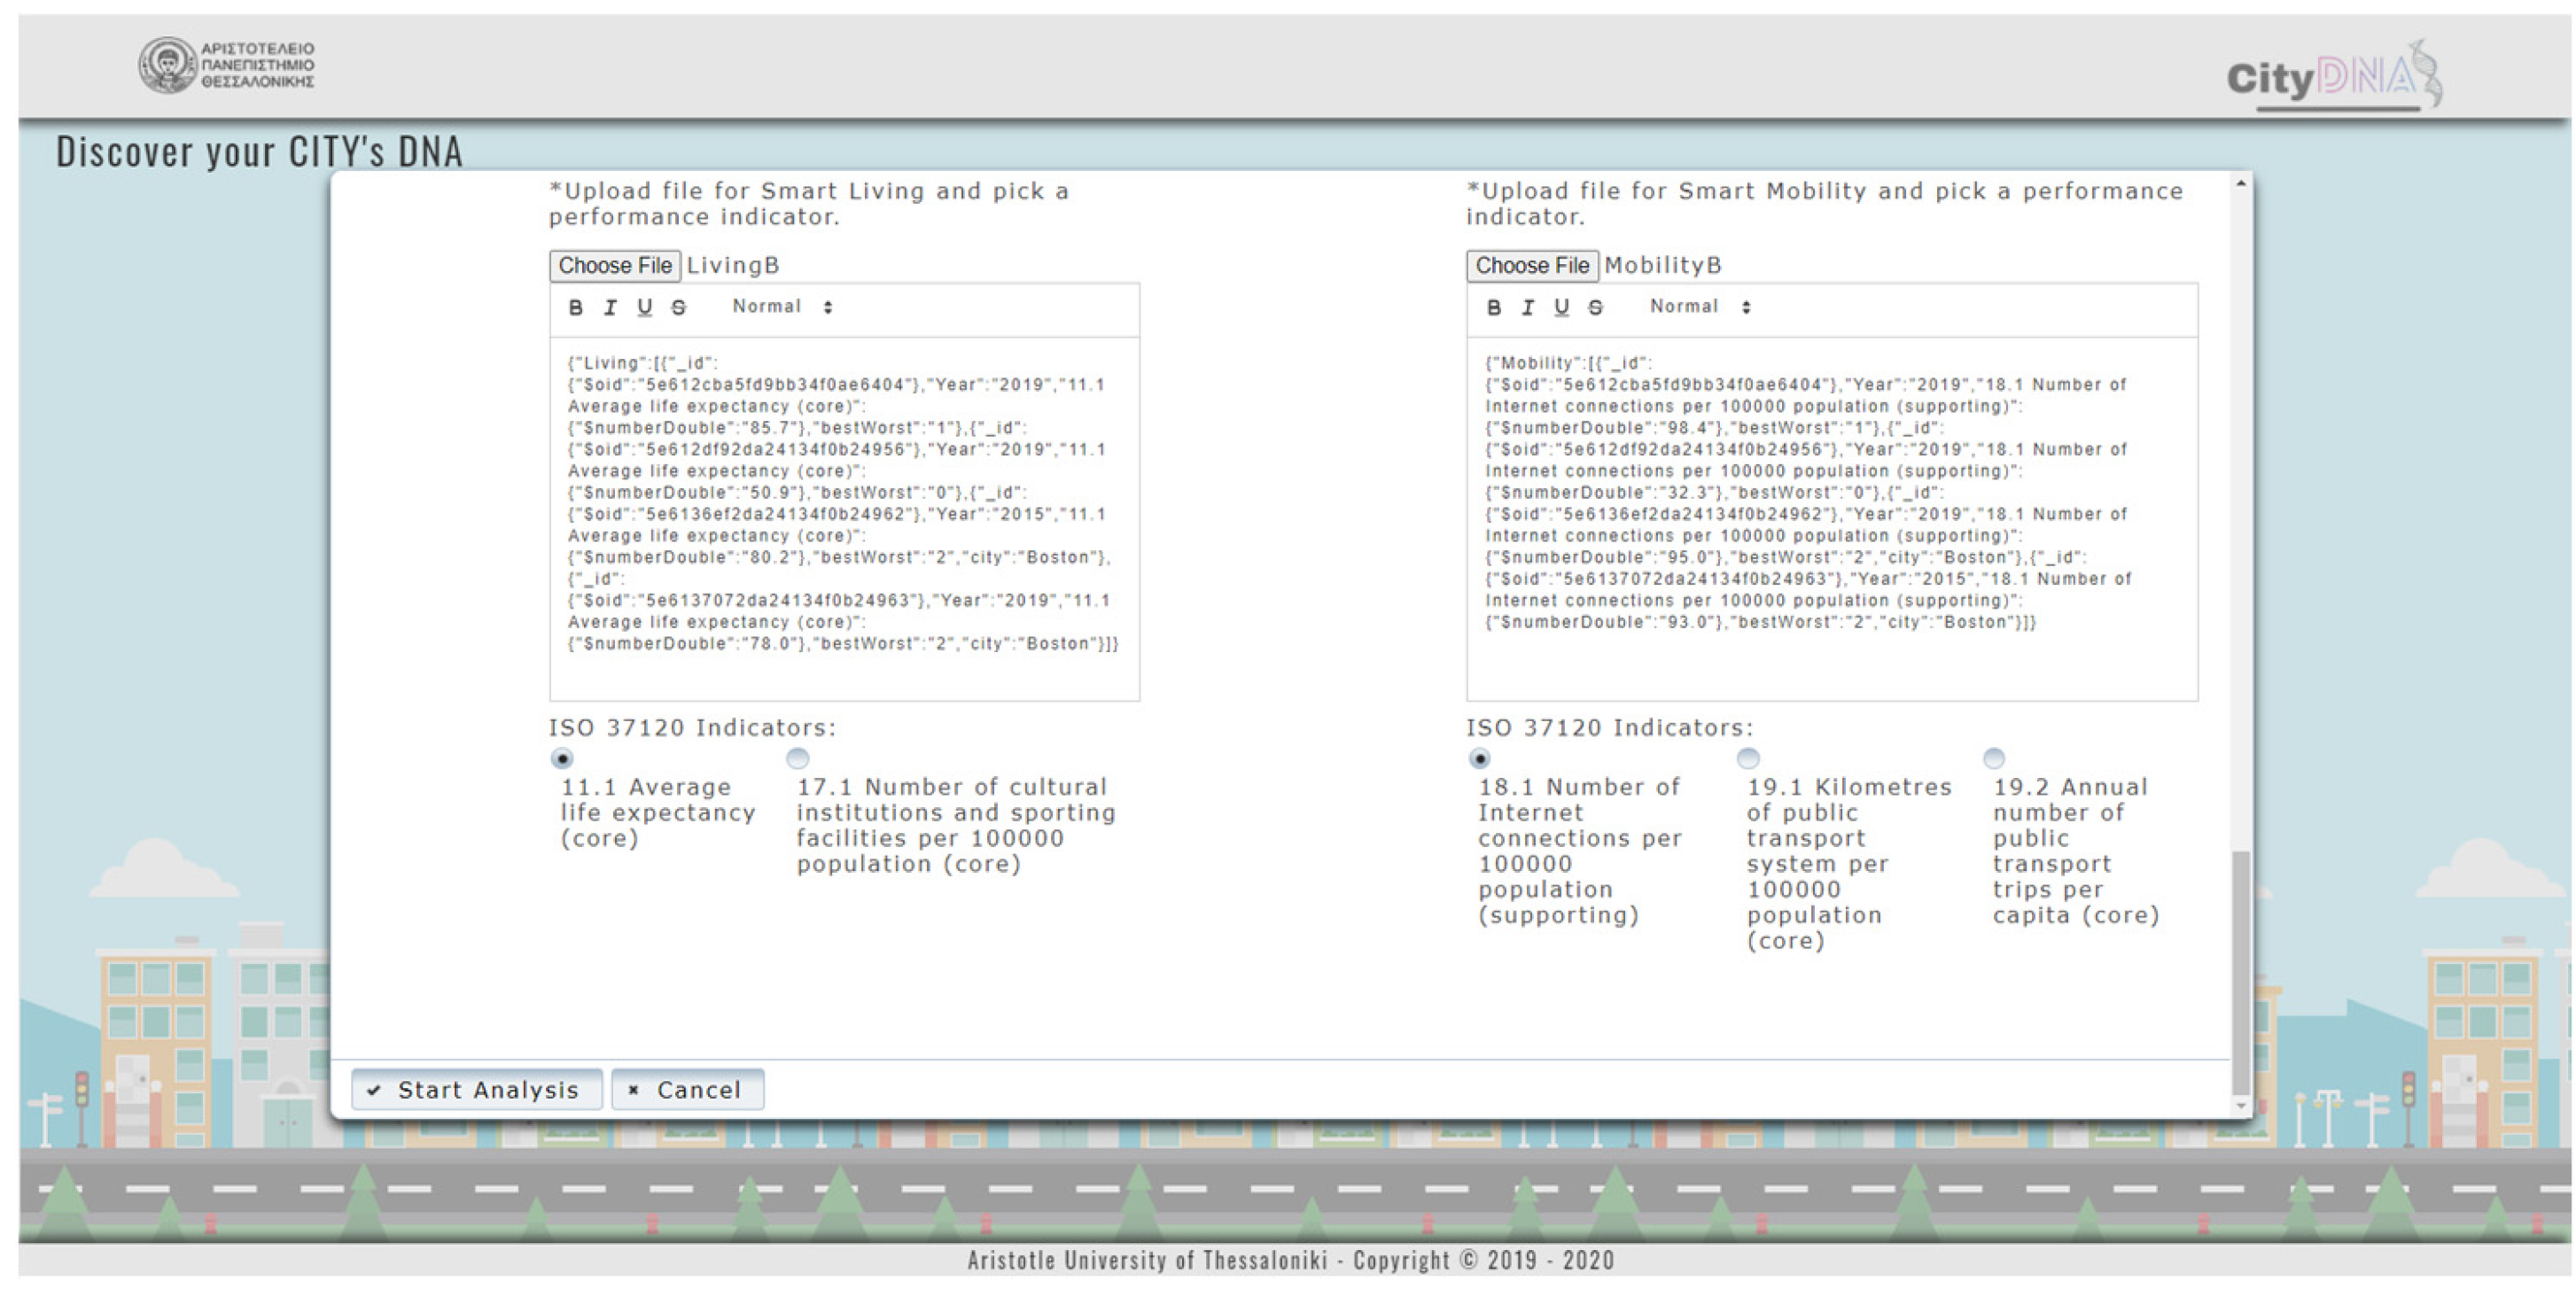
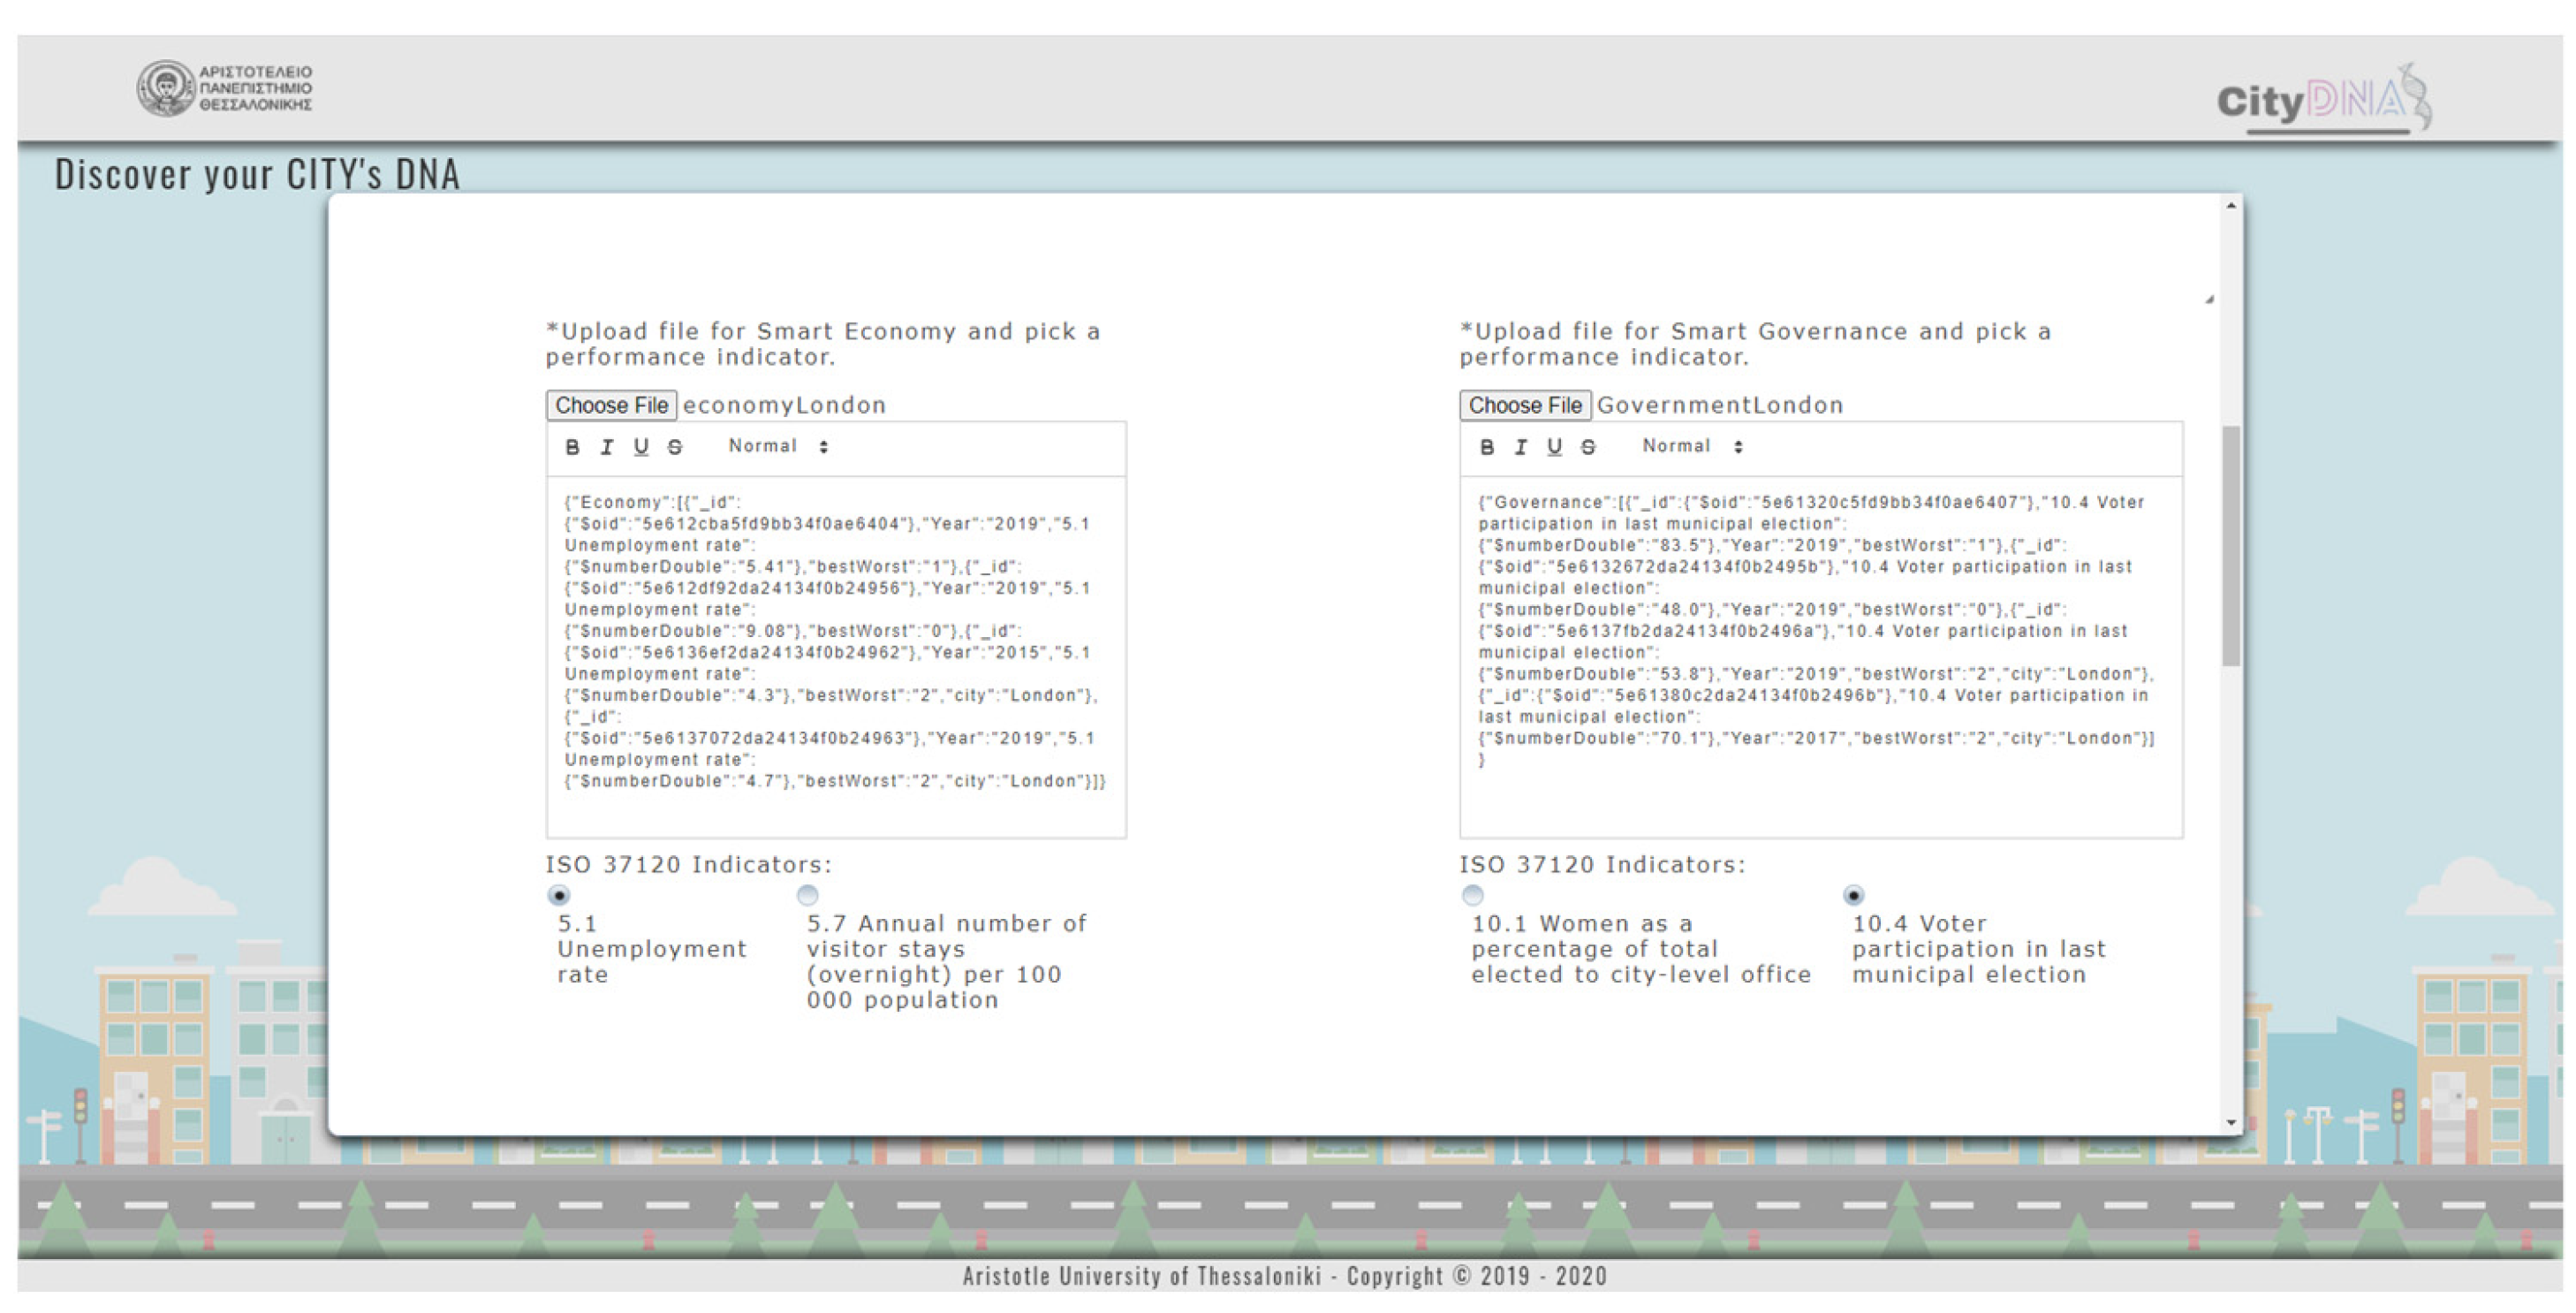
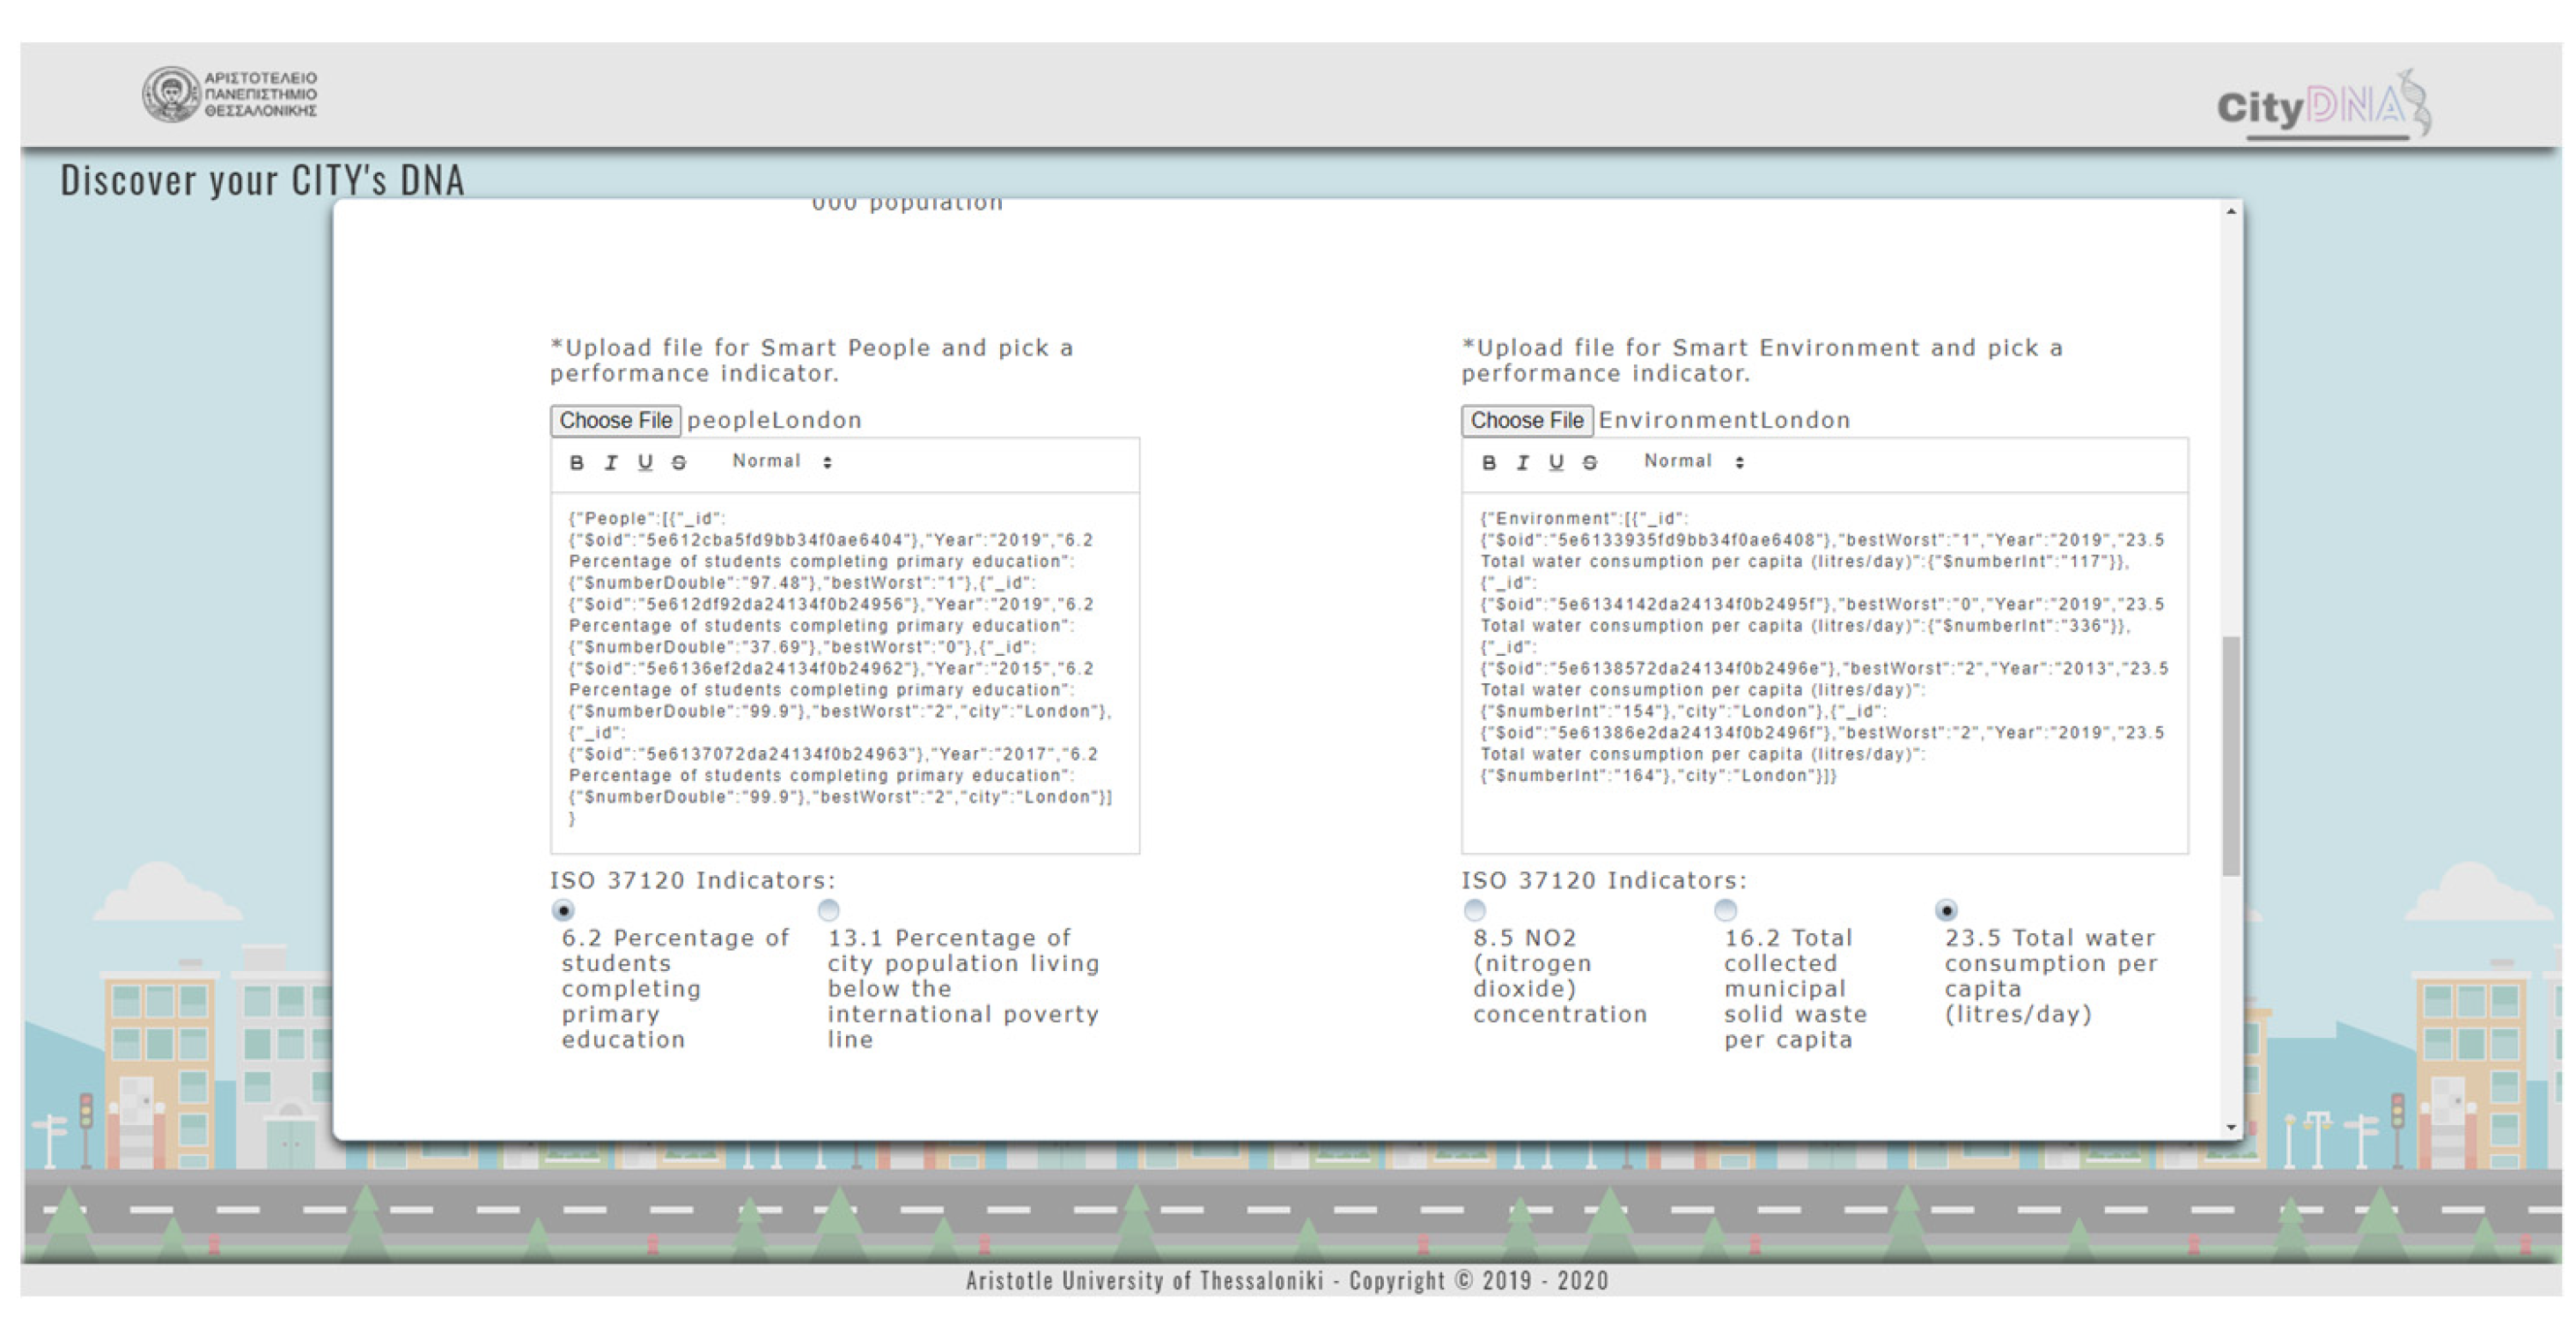
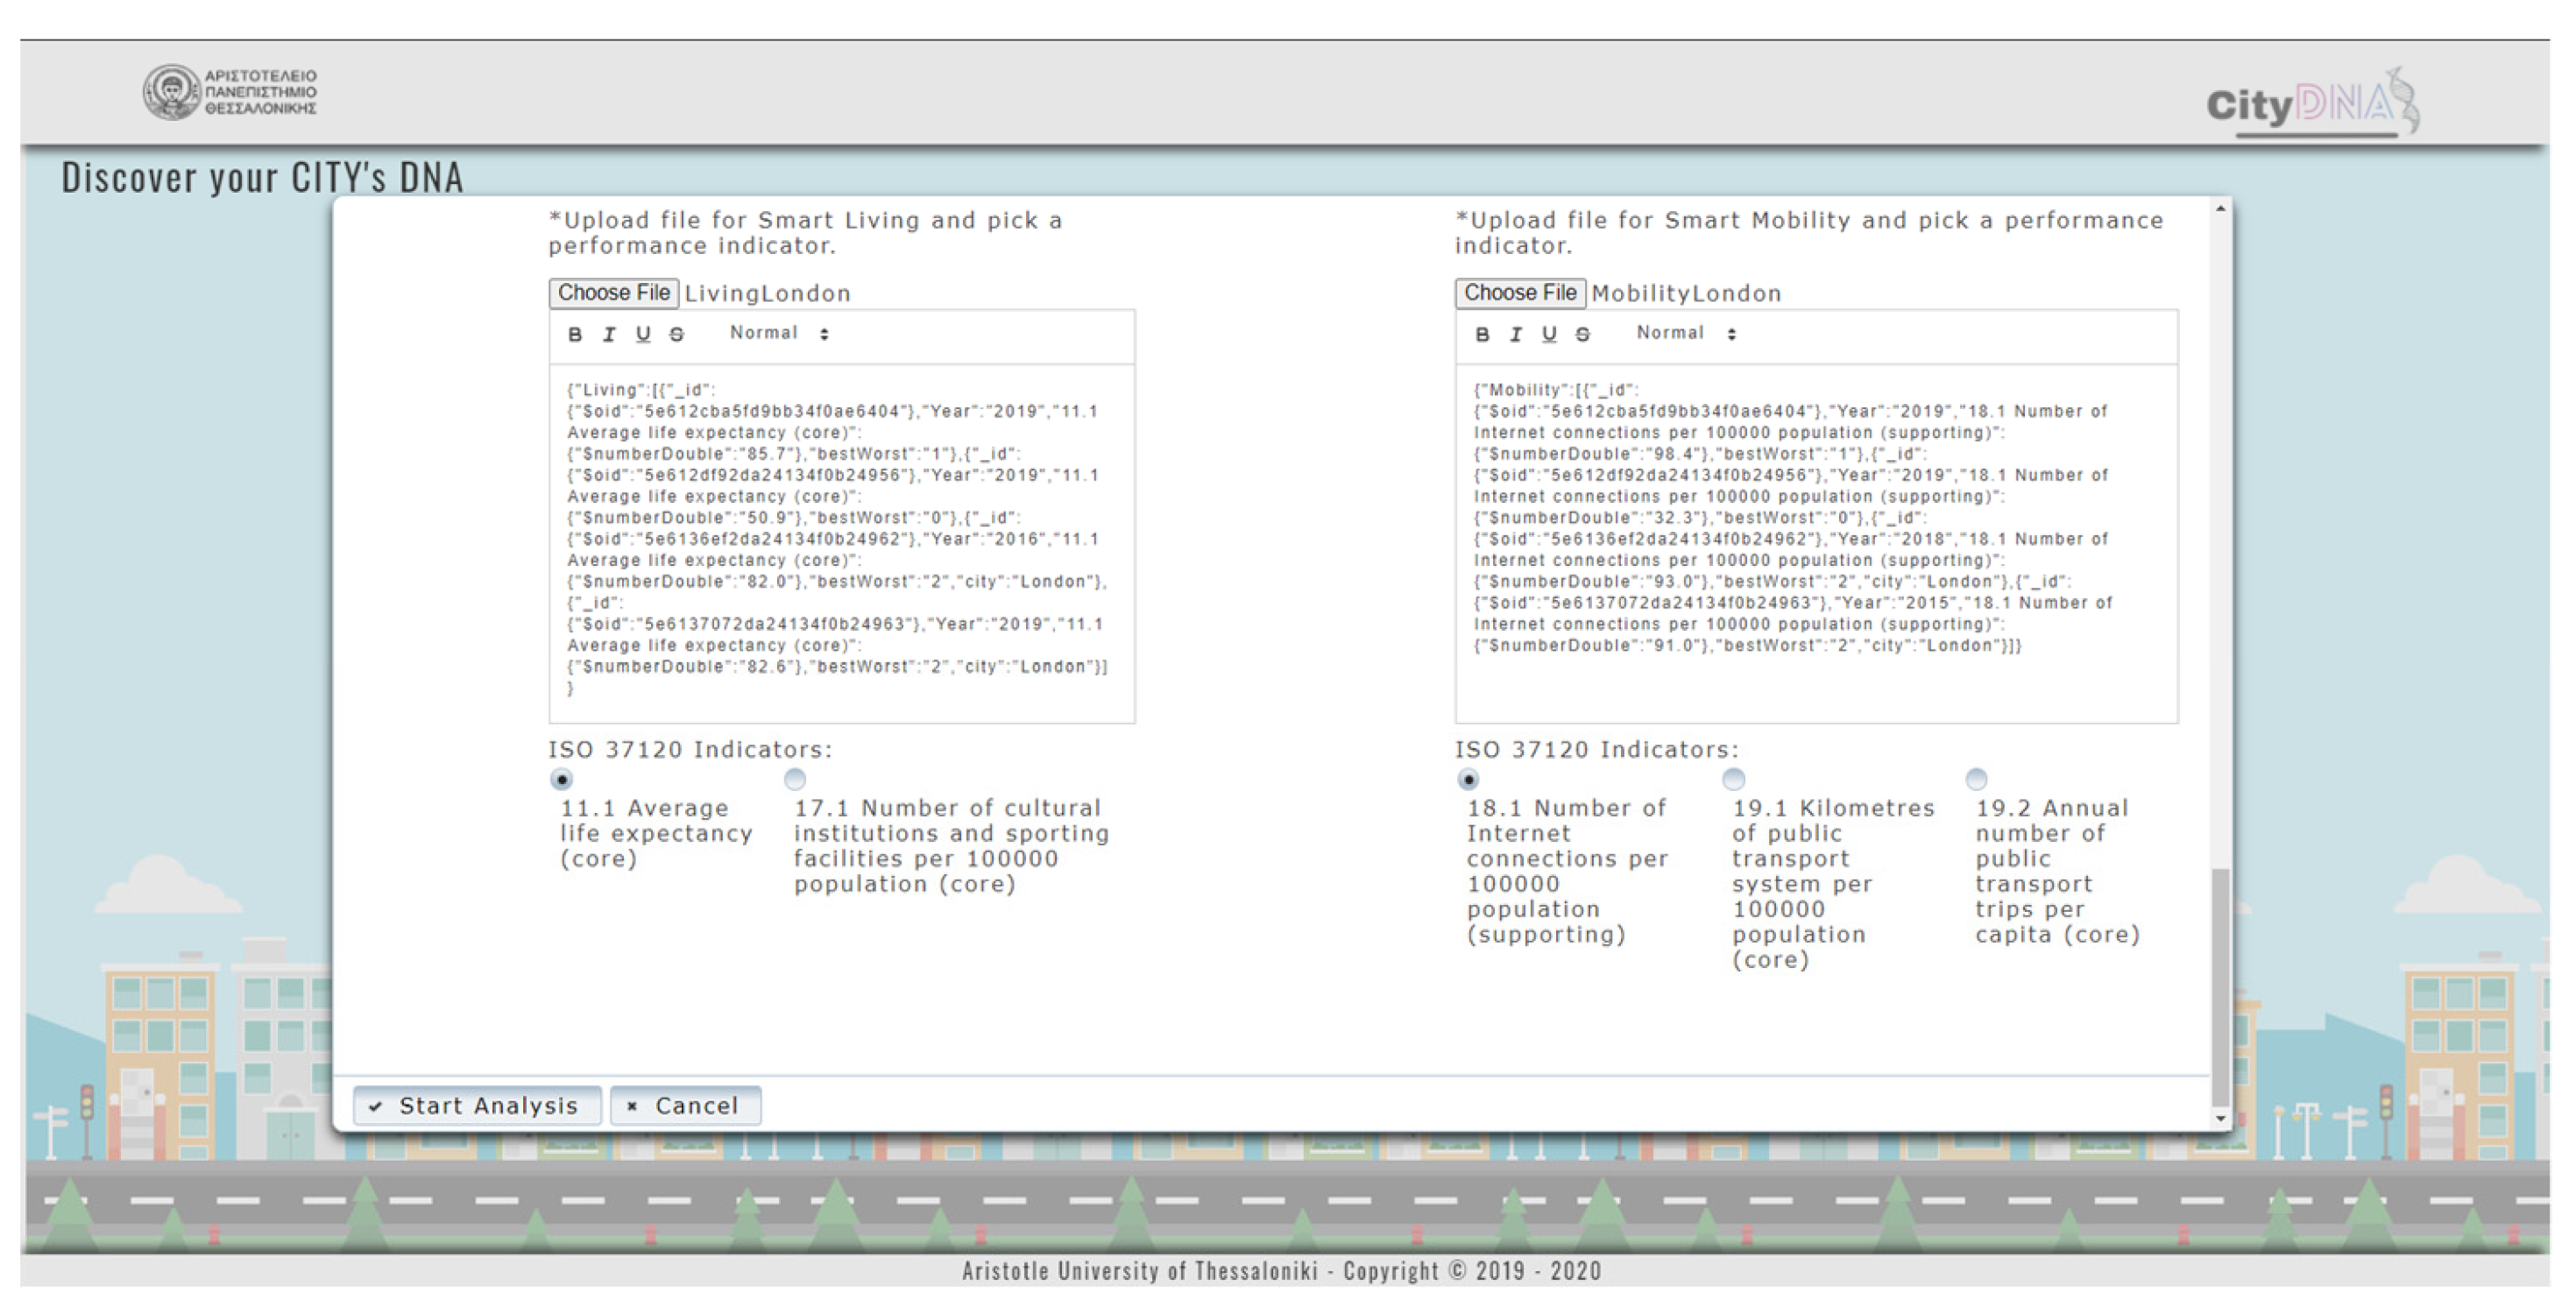
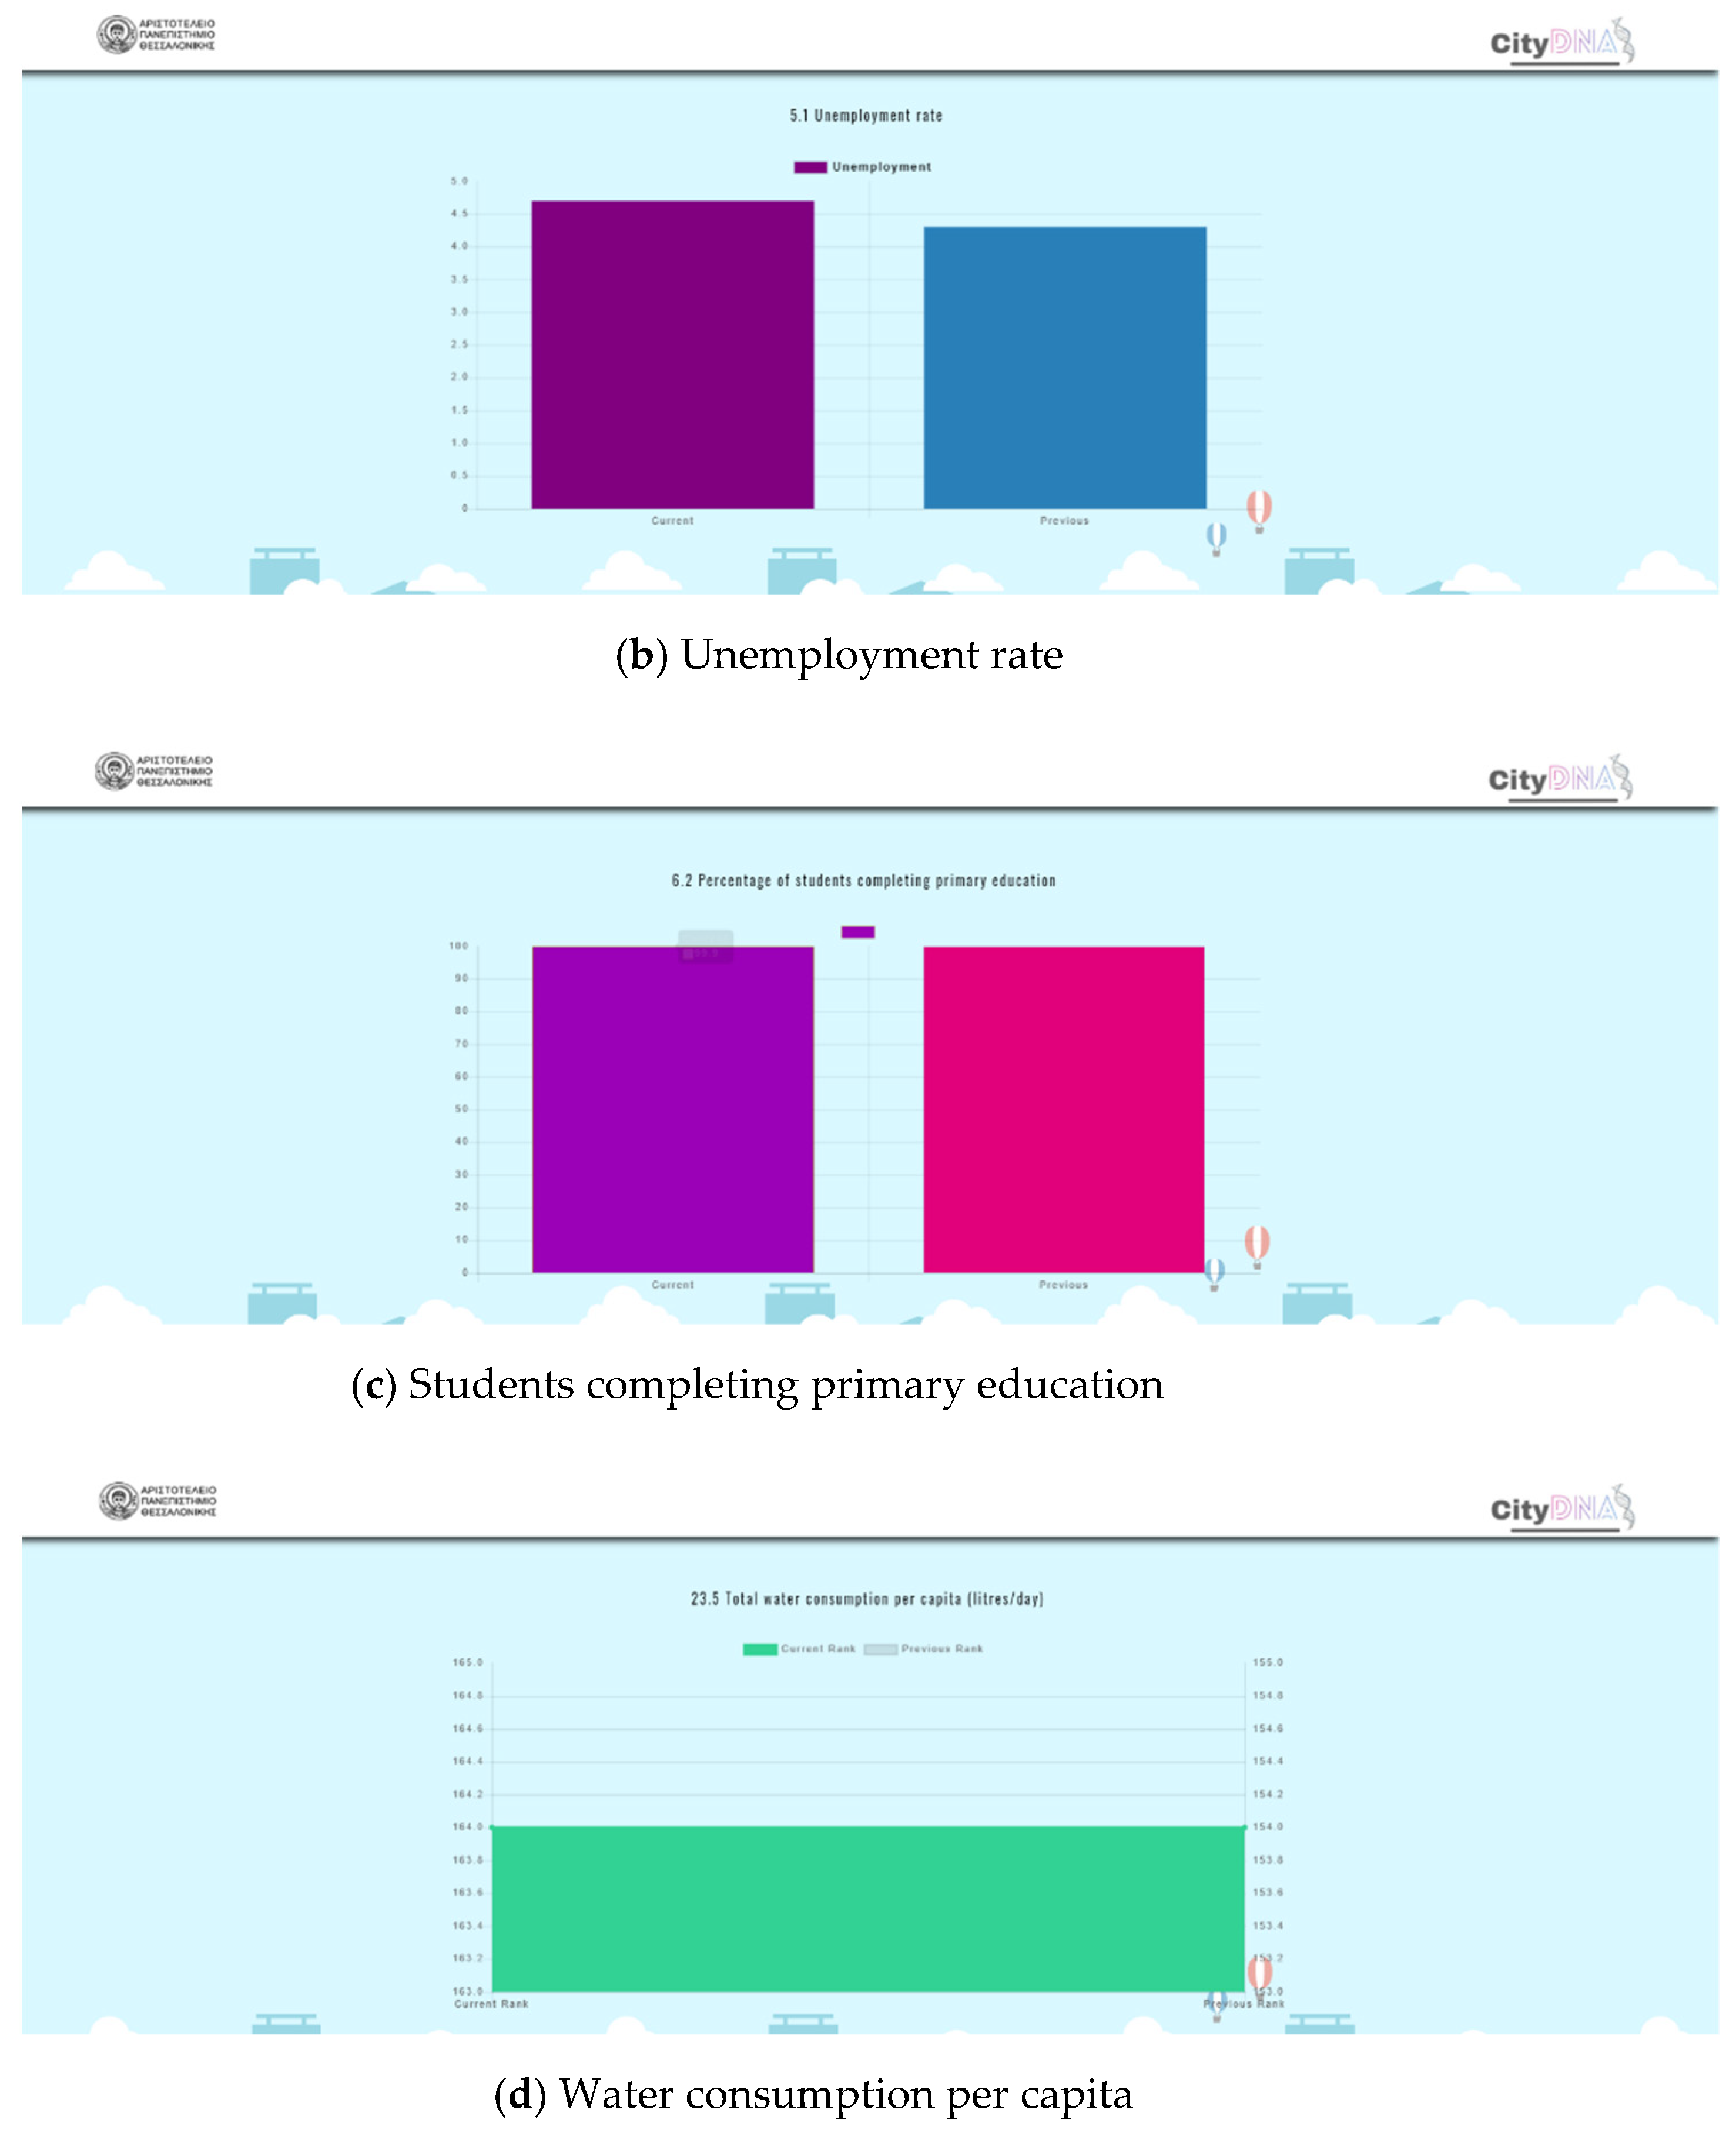
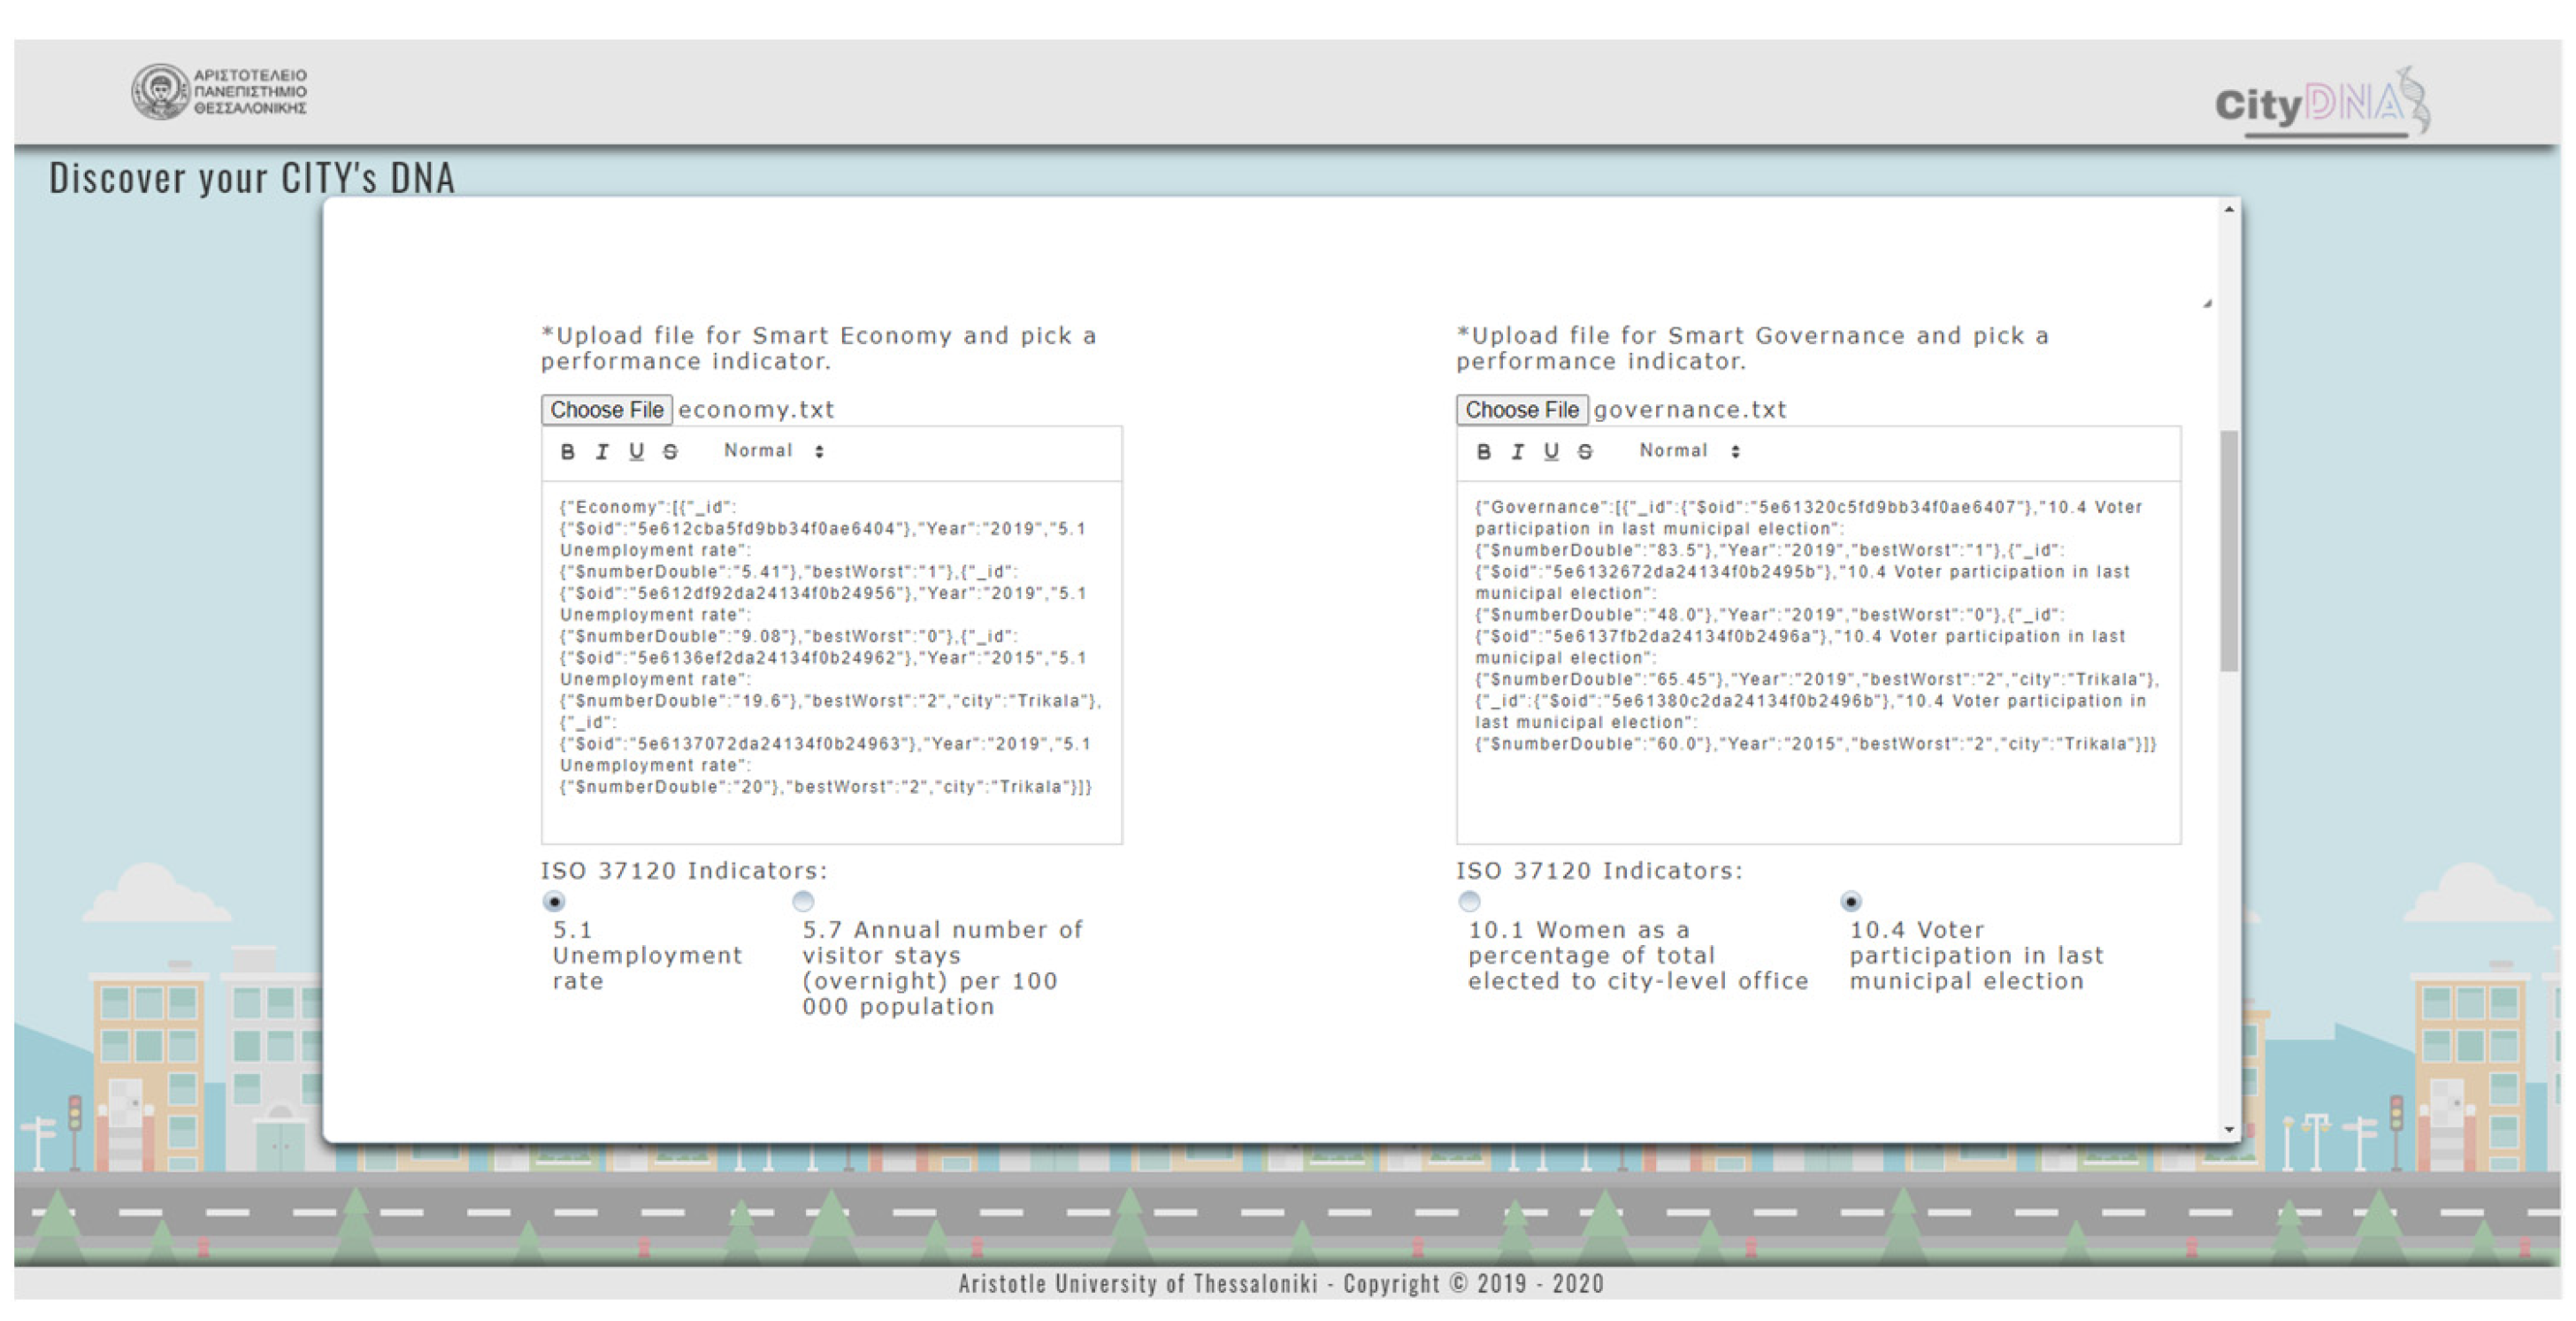
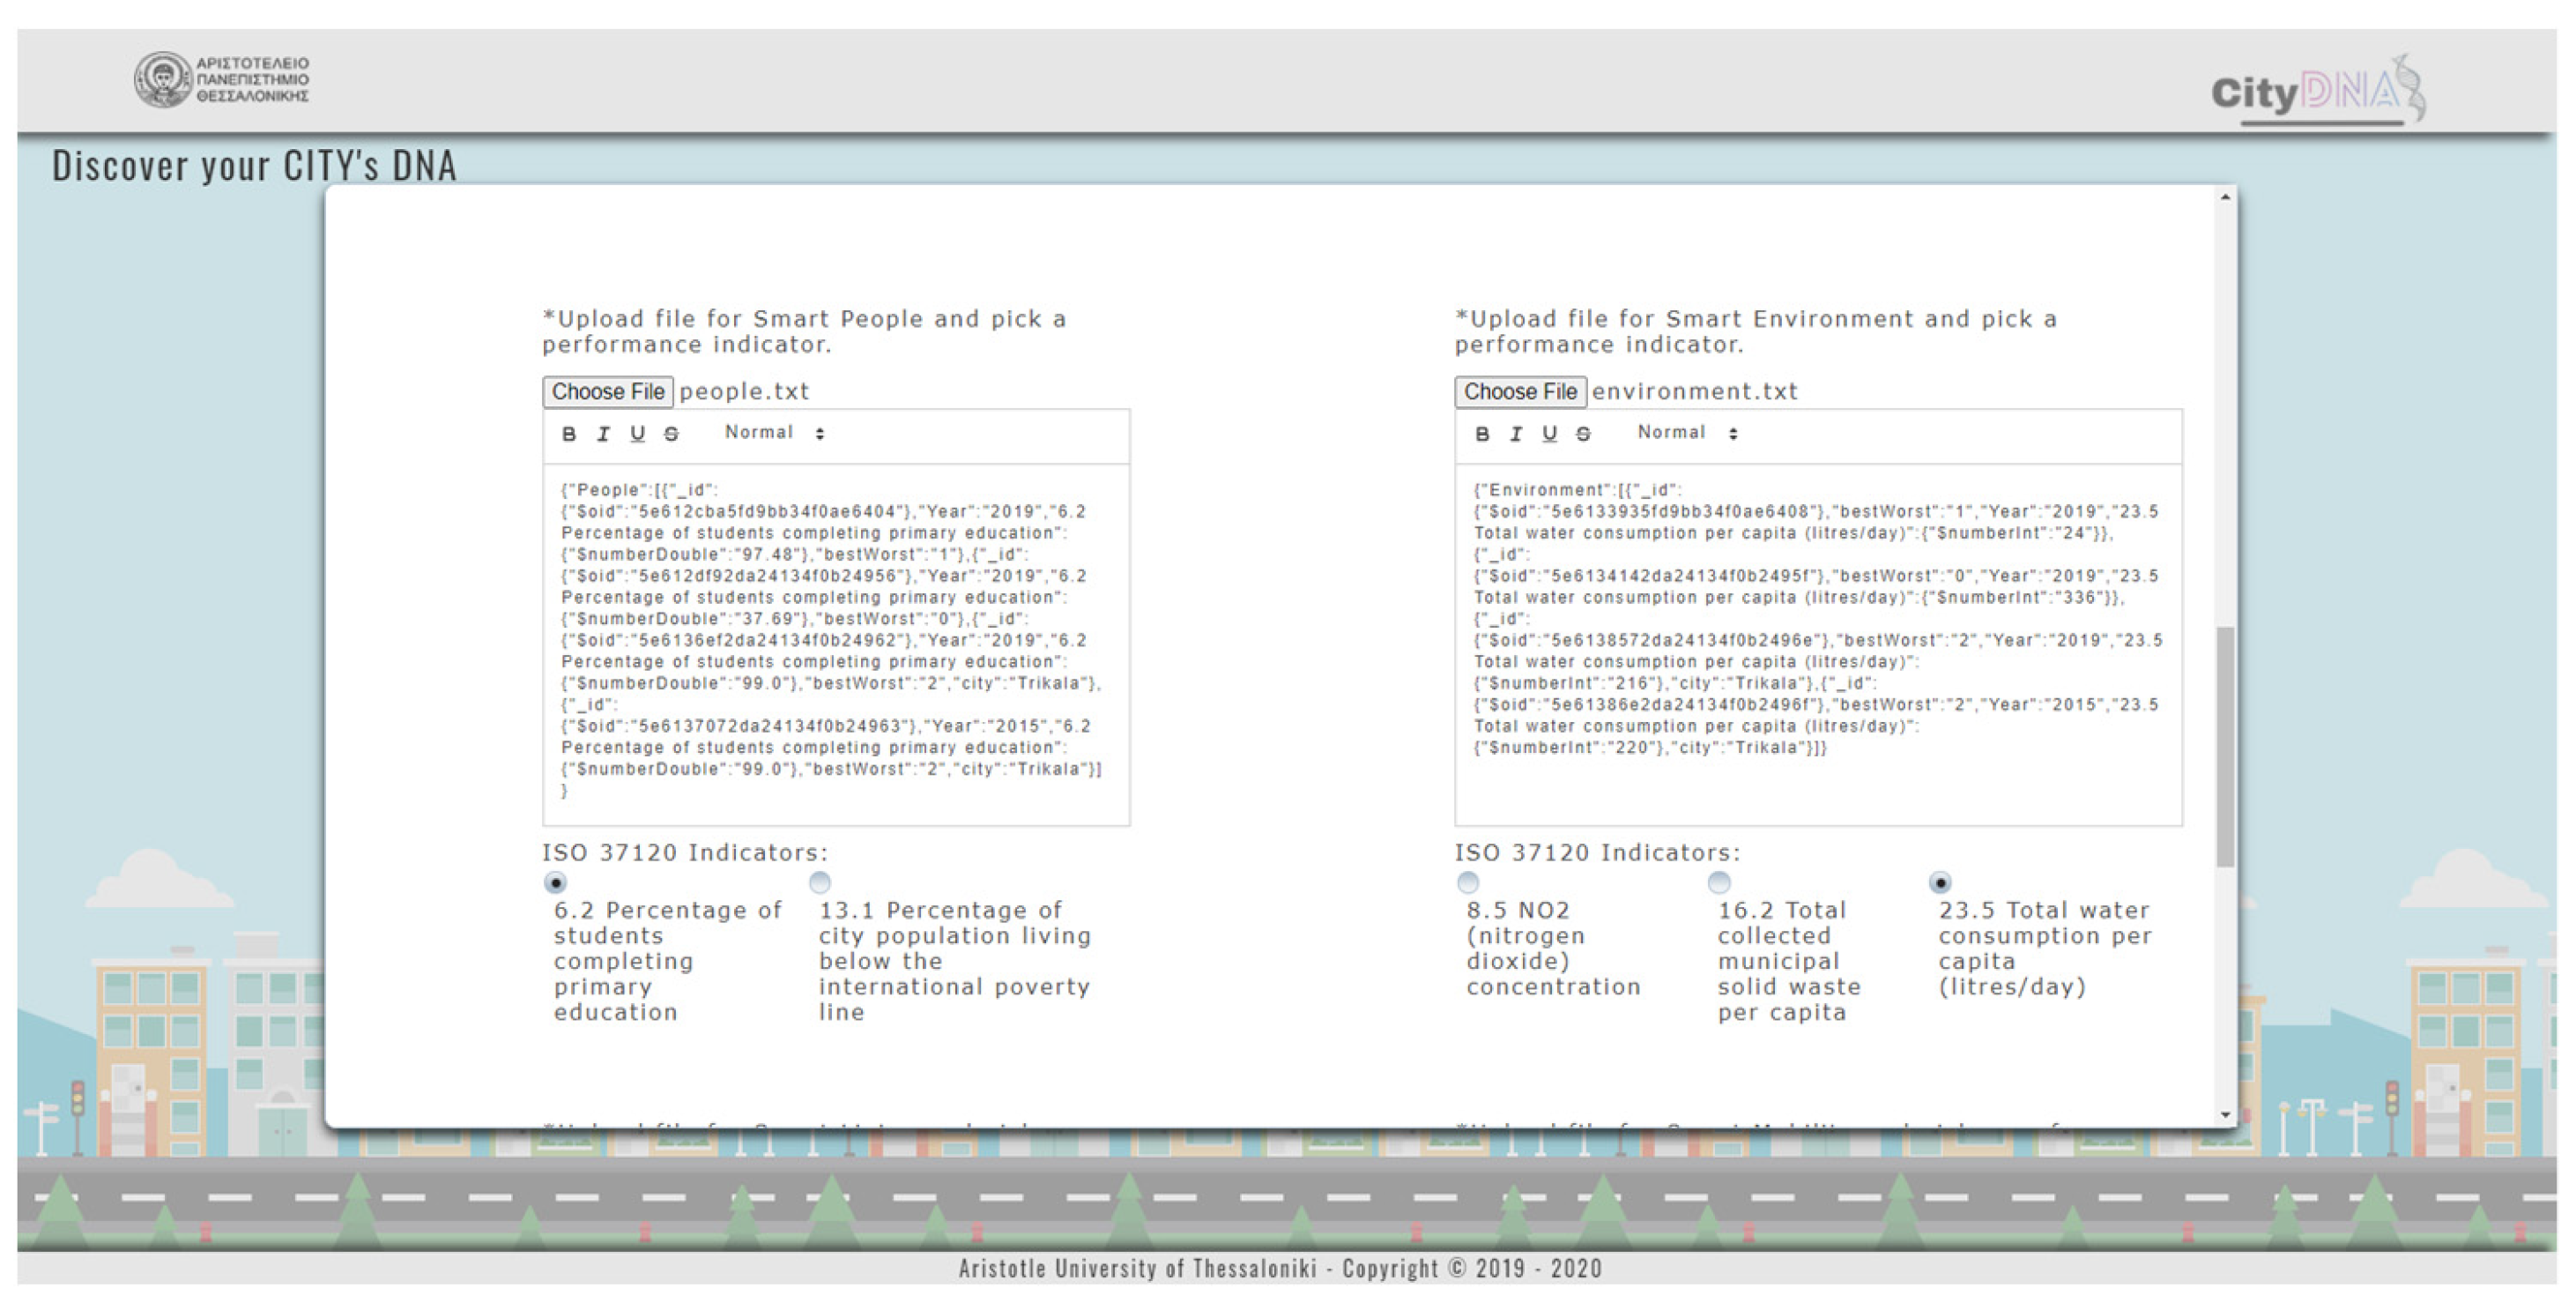
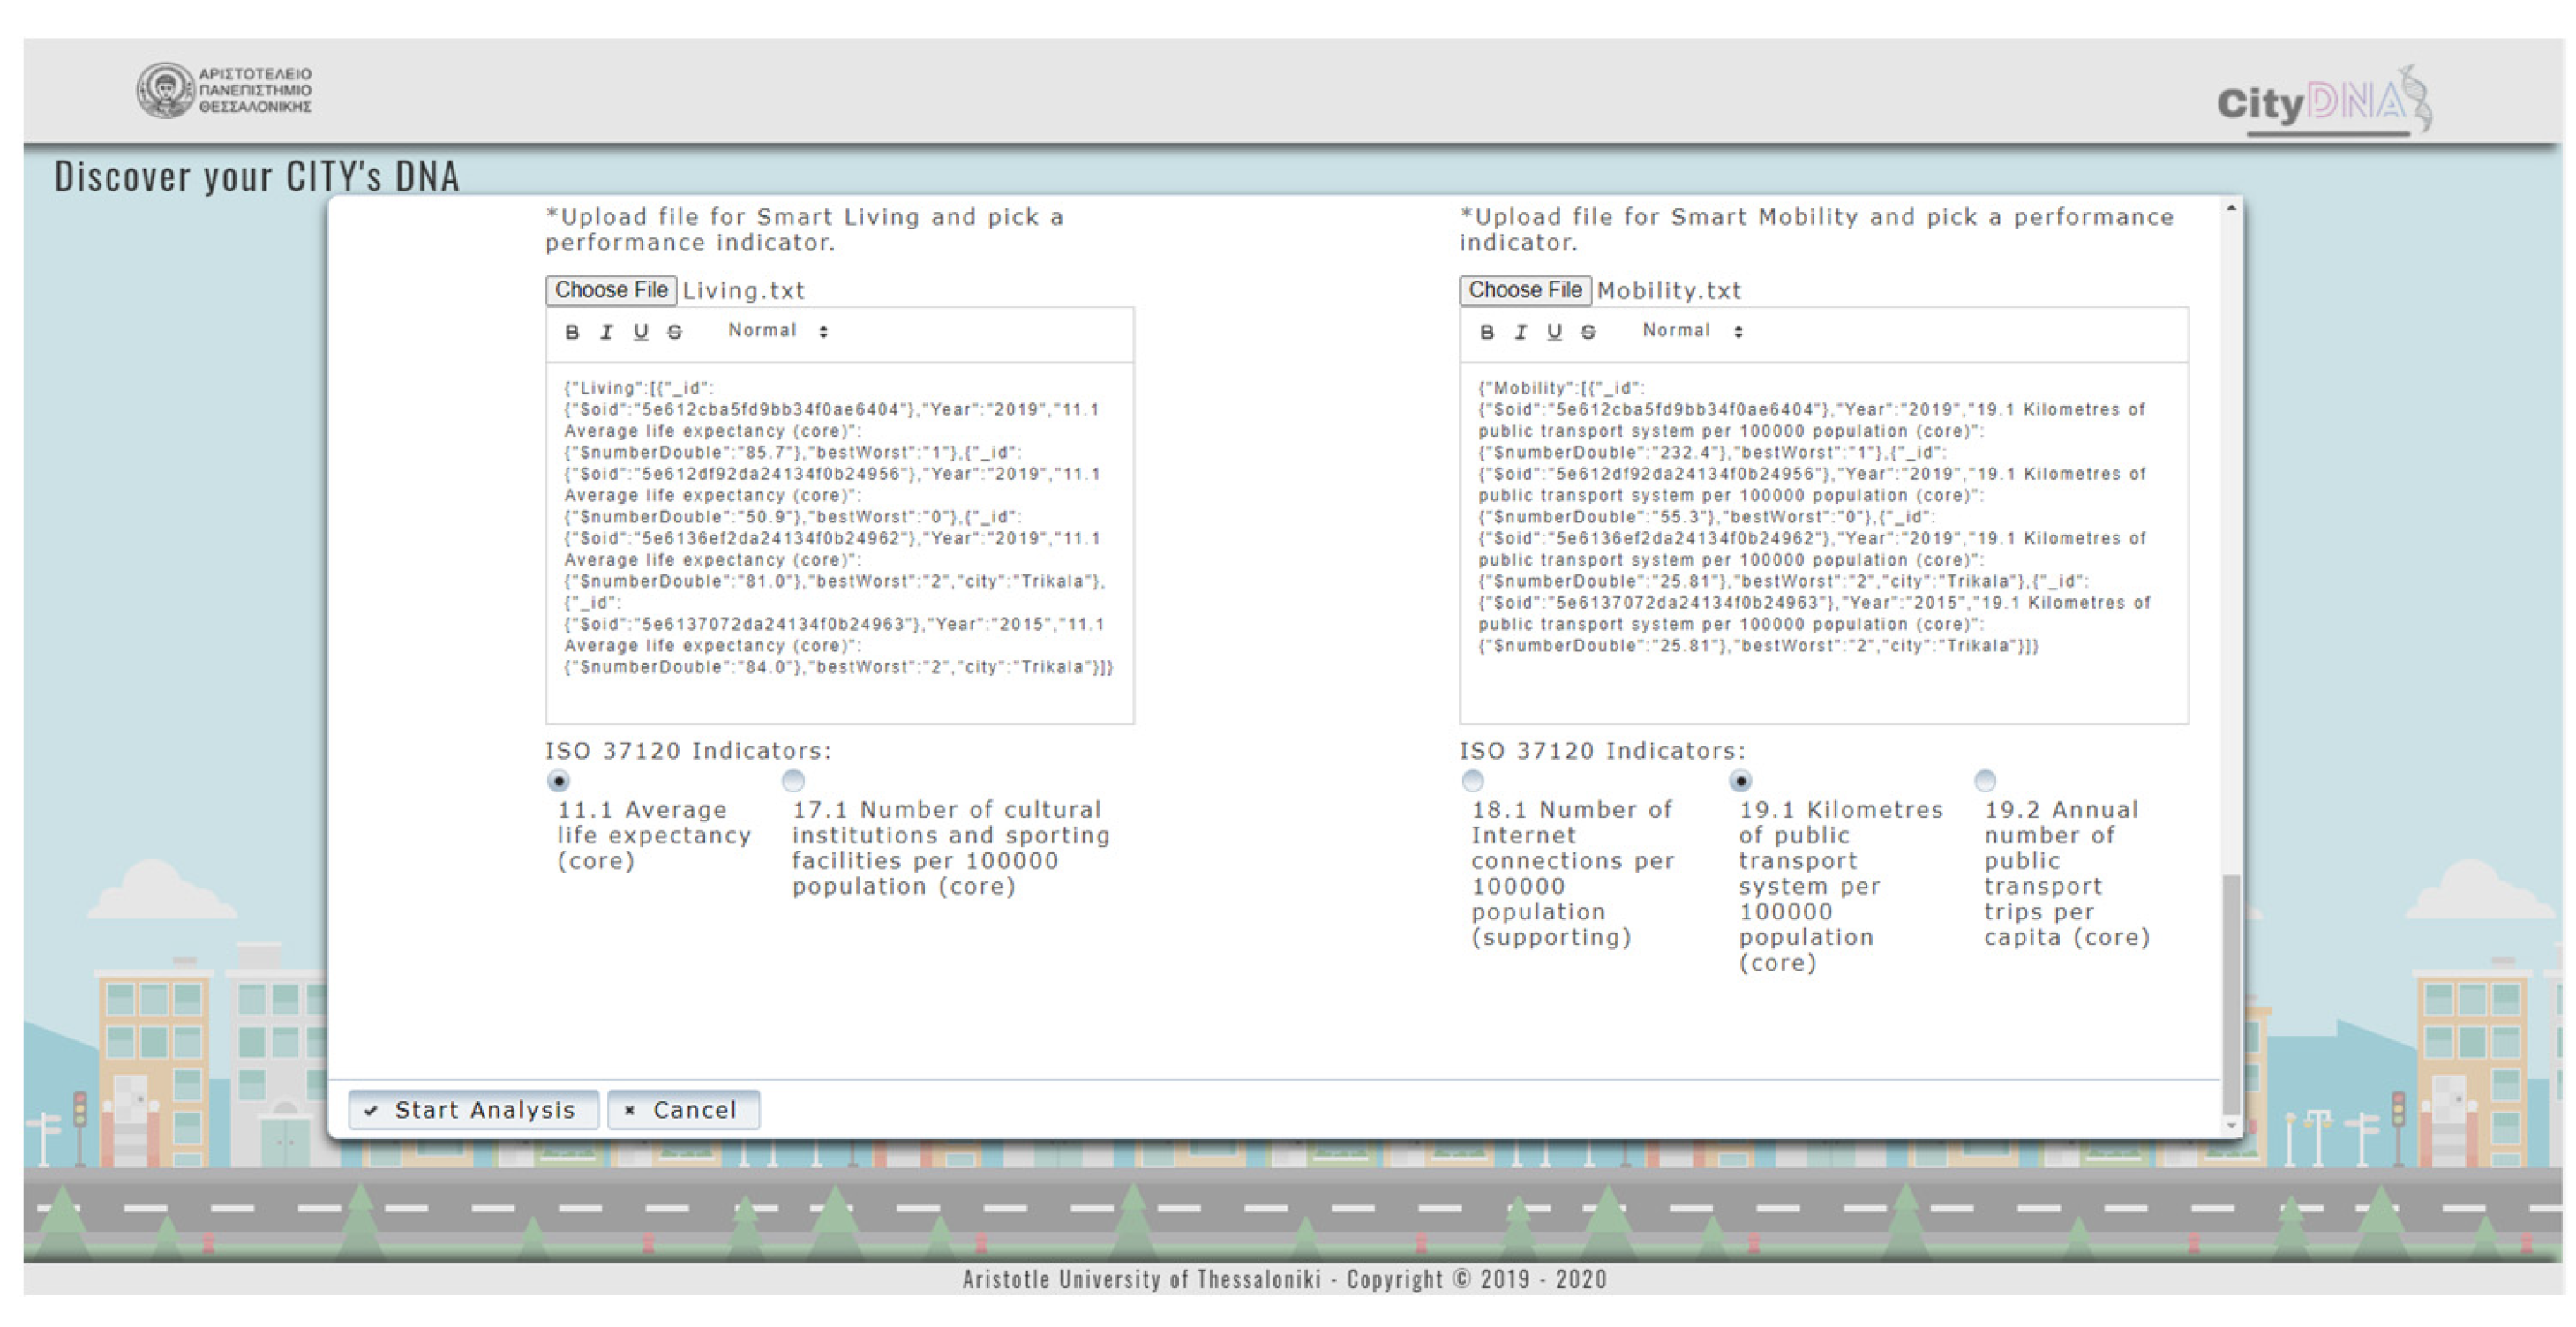
- Select the preferred KPI for each dimension (e.g., 5.1, 10.4) and upload a JSON file or create the JSON file by filling in the appropriate fields in the content box of the Web service. The KPI selection and the data entry for the dimensions of economy and governance are presented in Figure 8, while for the rest of the dimensions, are presented in Figure A2 and Figure A3 of Appendix B. The validity of the file or the content that the user uploads to the service is checked by the rules set in the Web service (rule-based uploader) to ensure the synthesis of ISO KPIs.
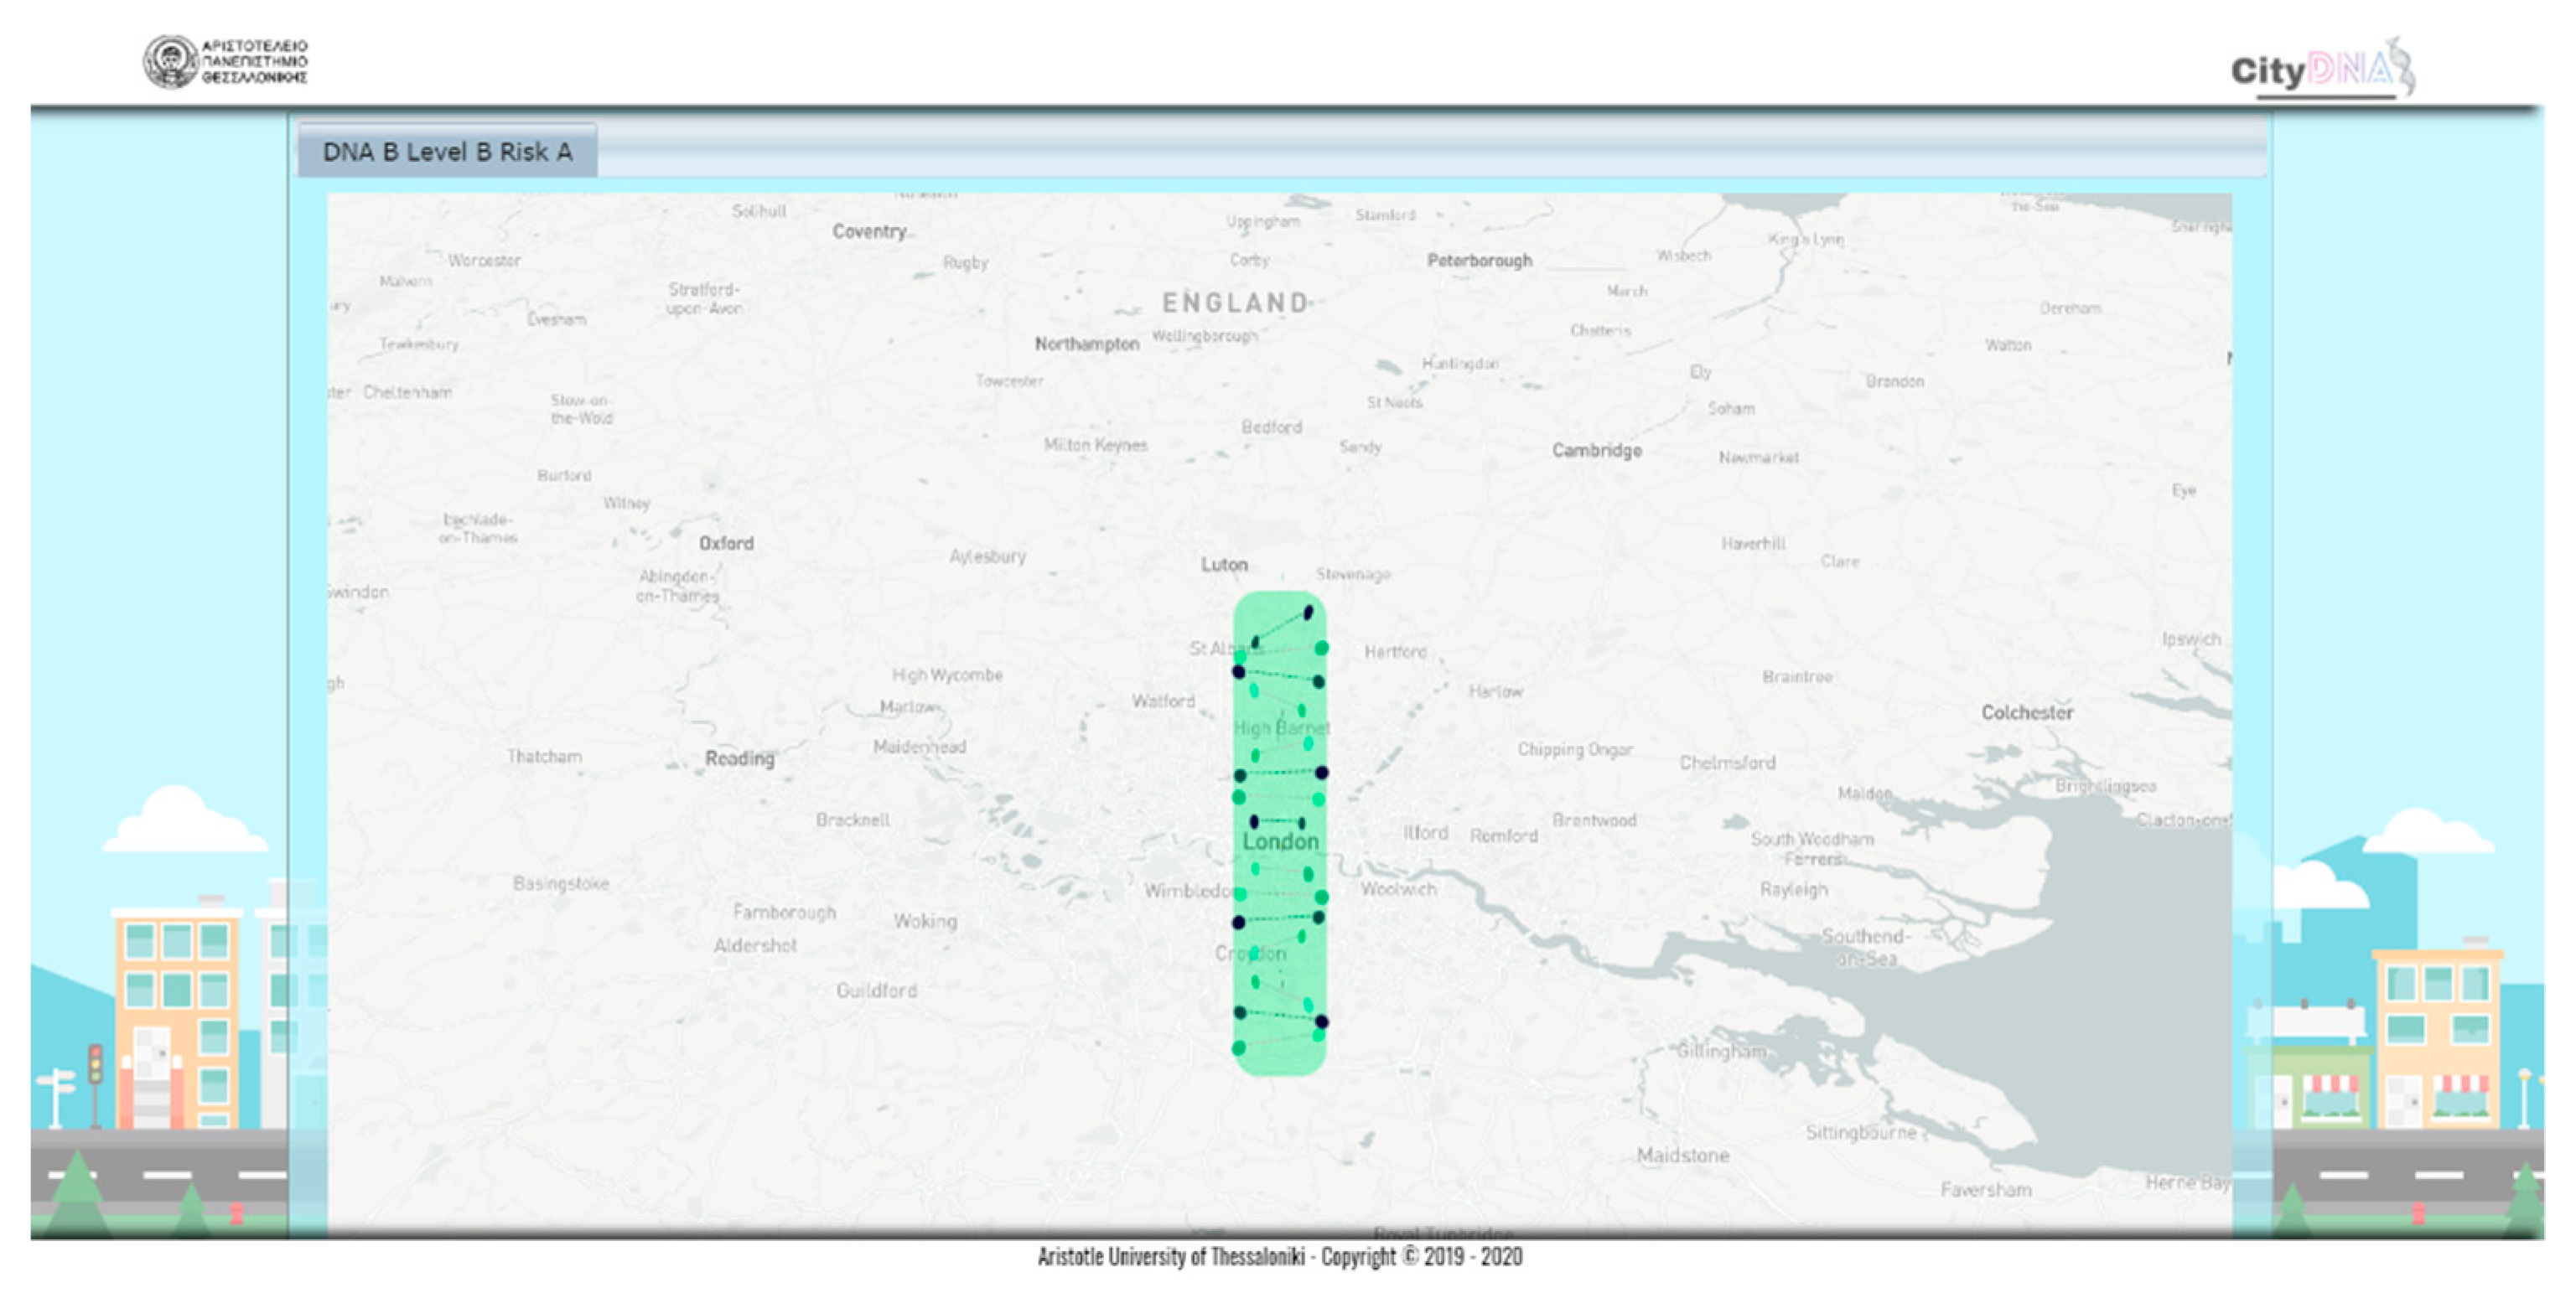
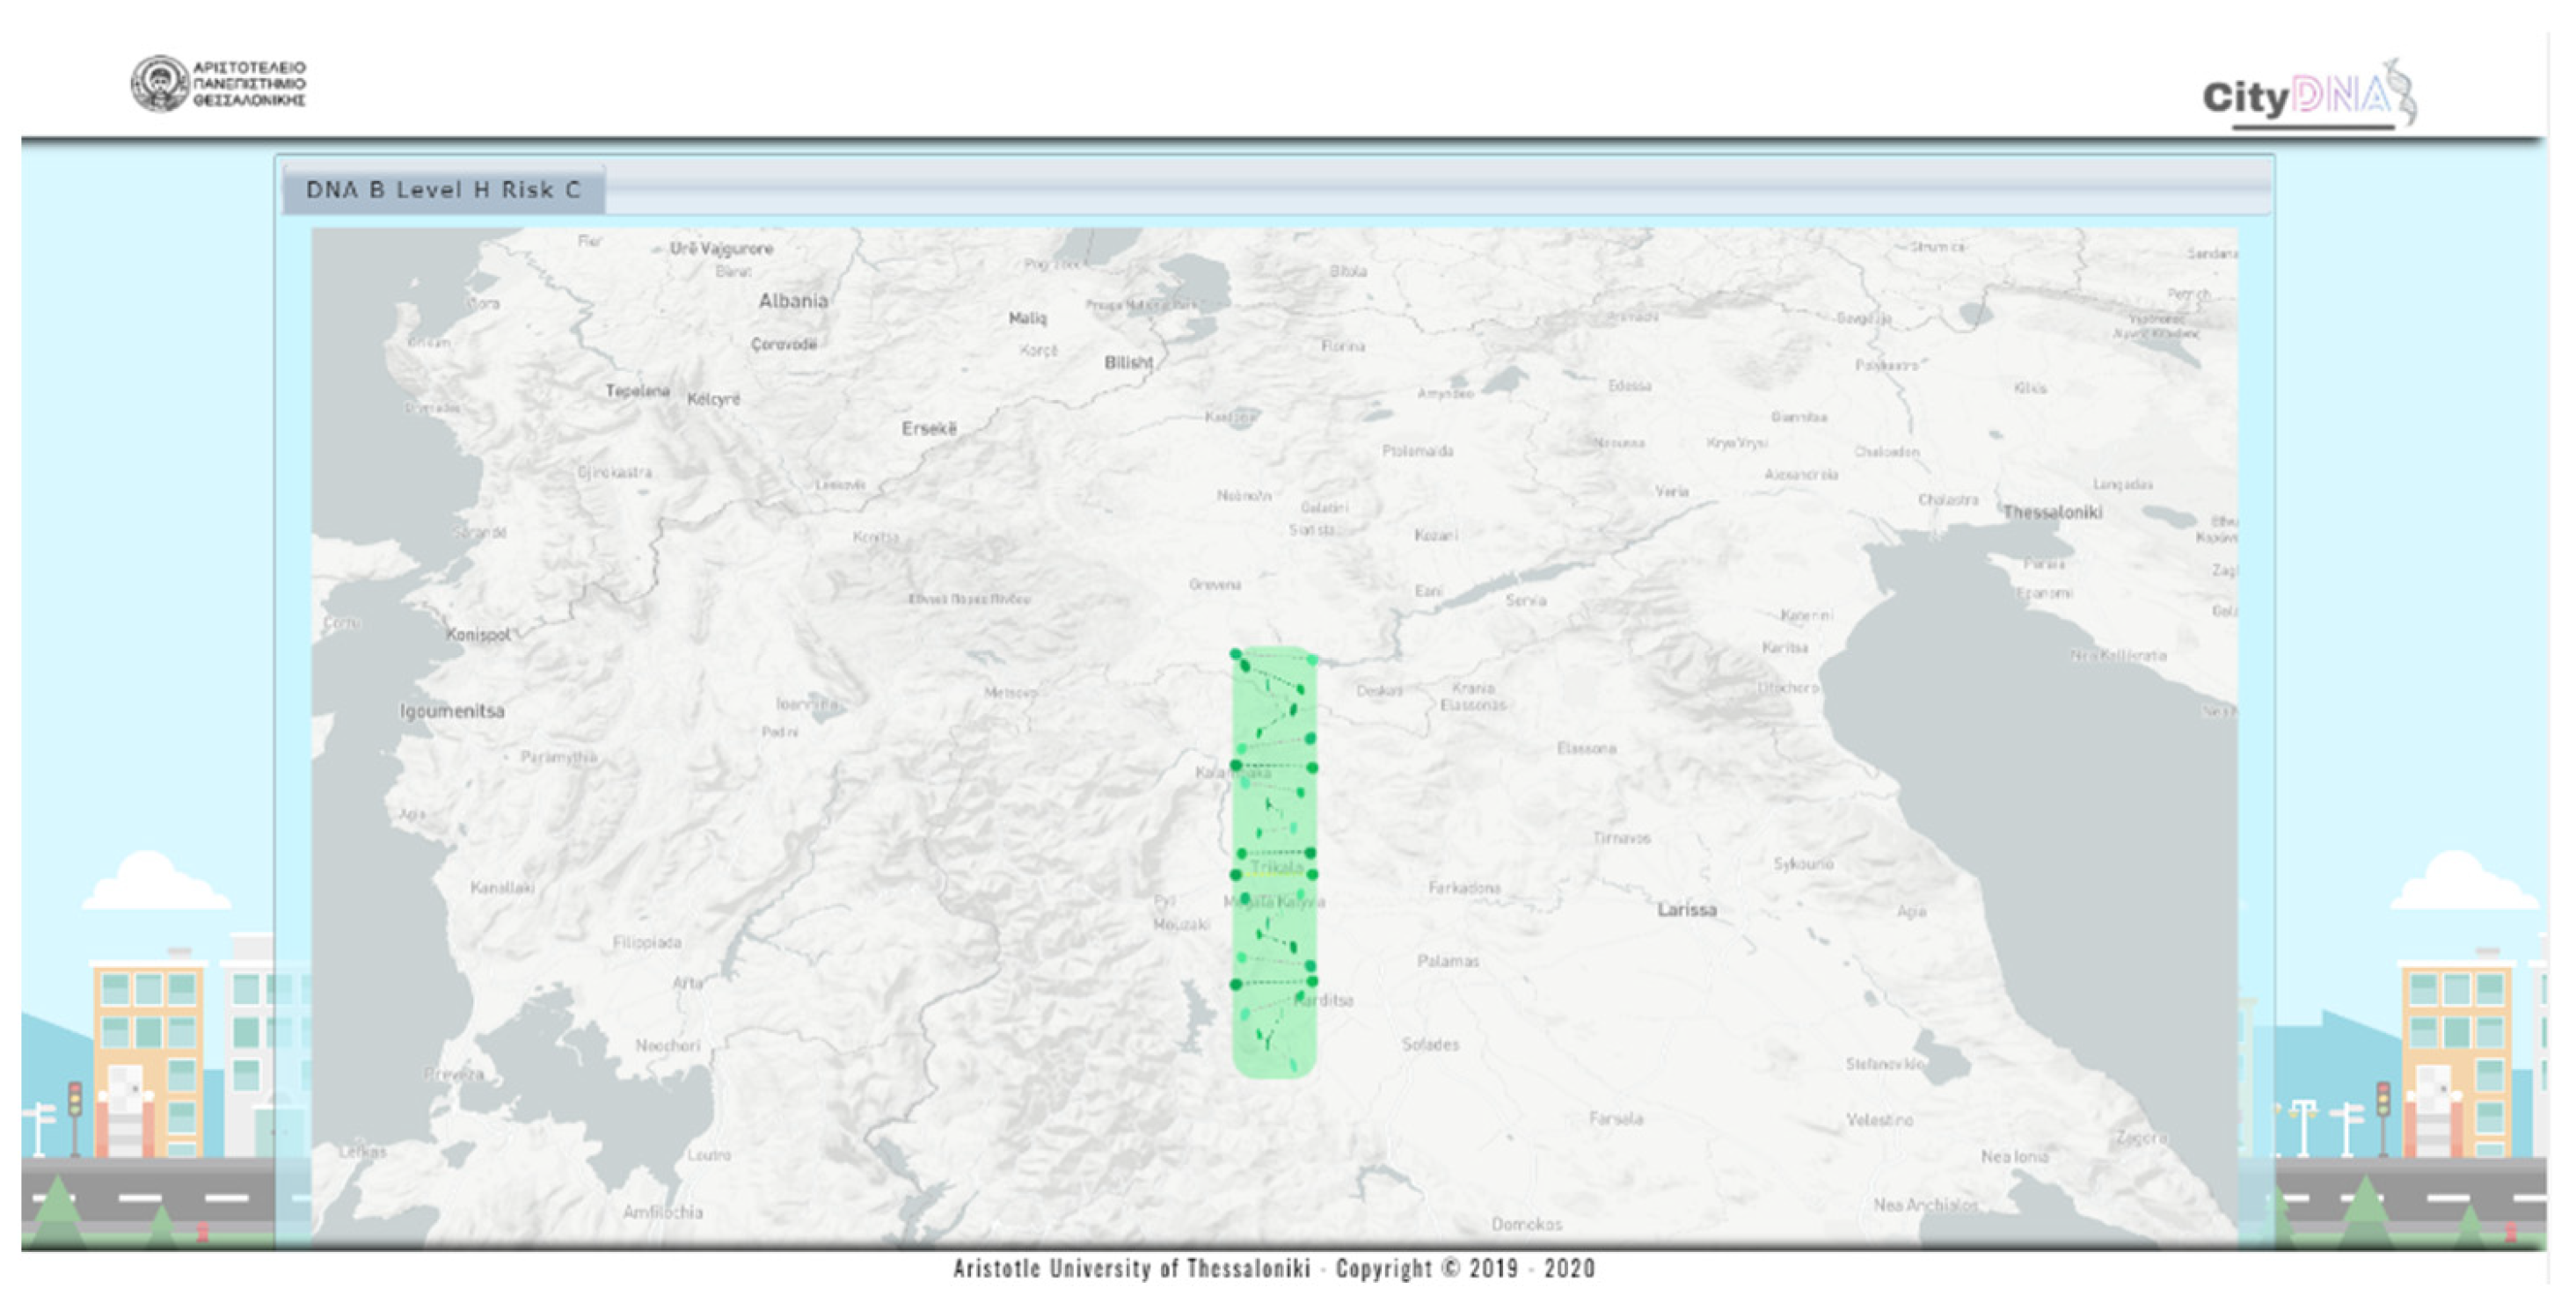
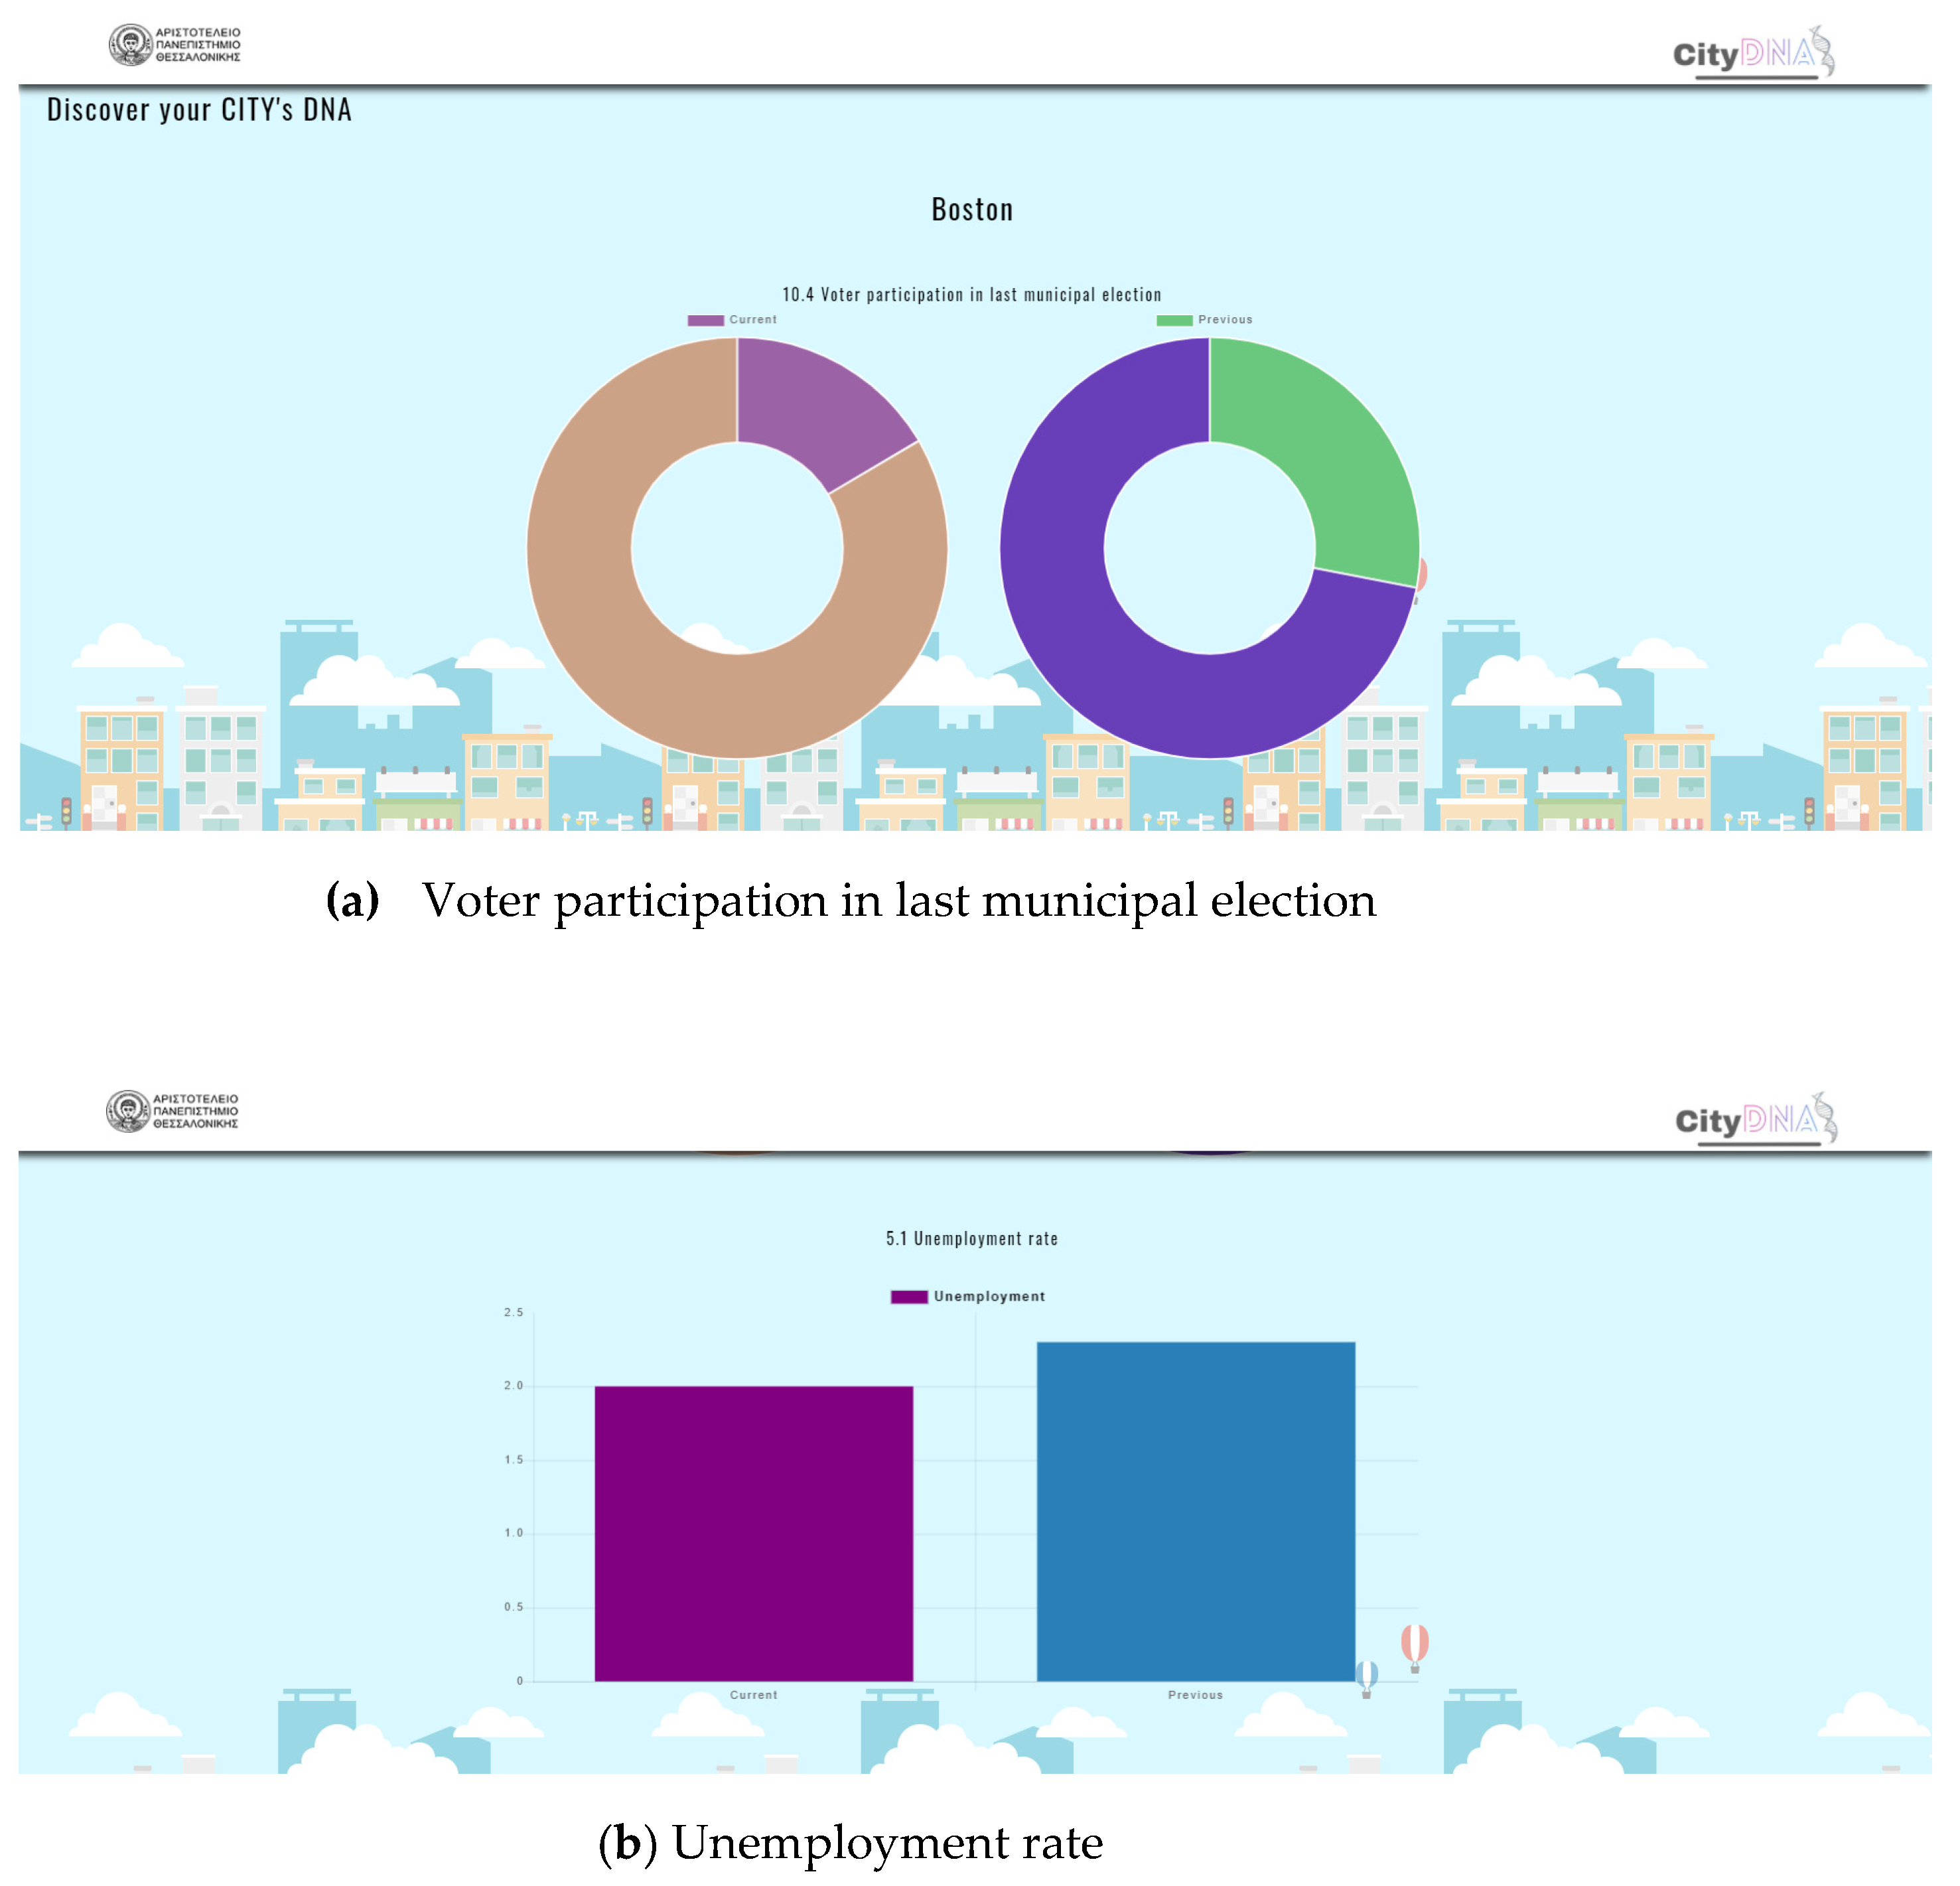
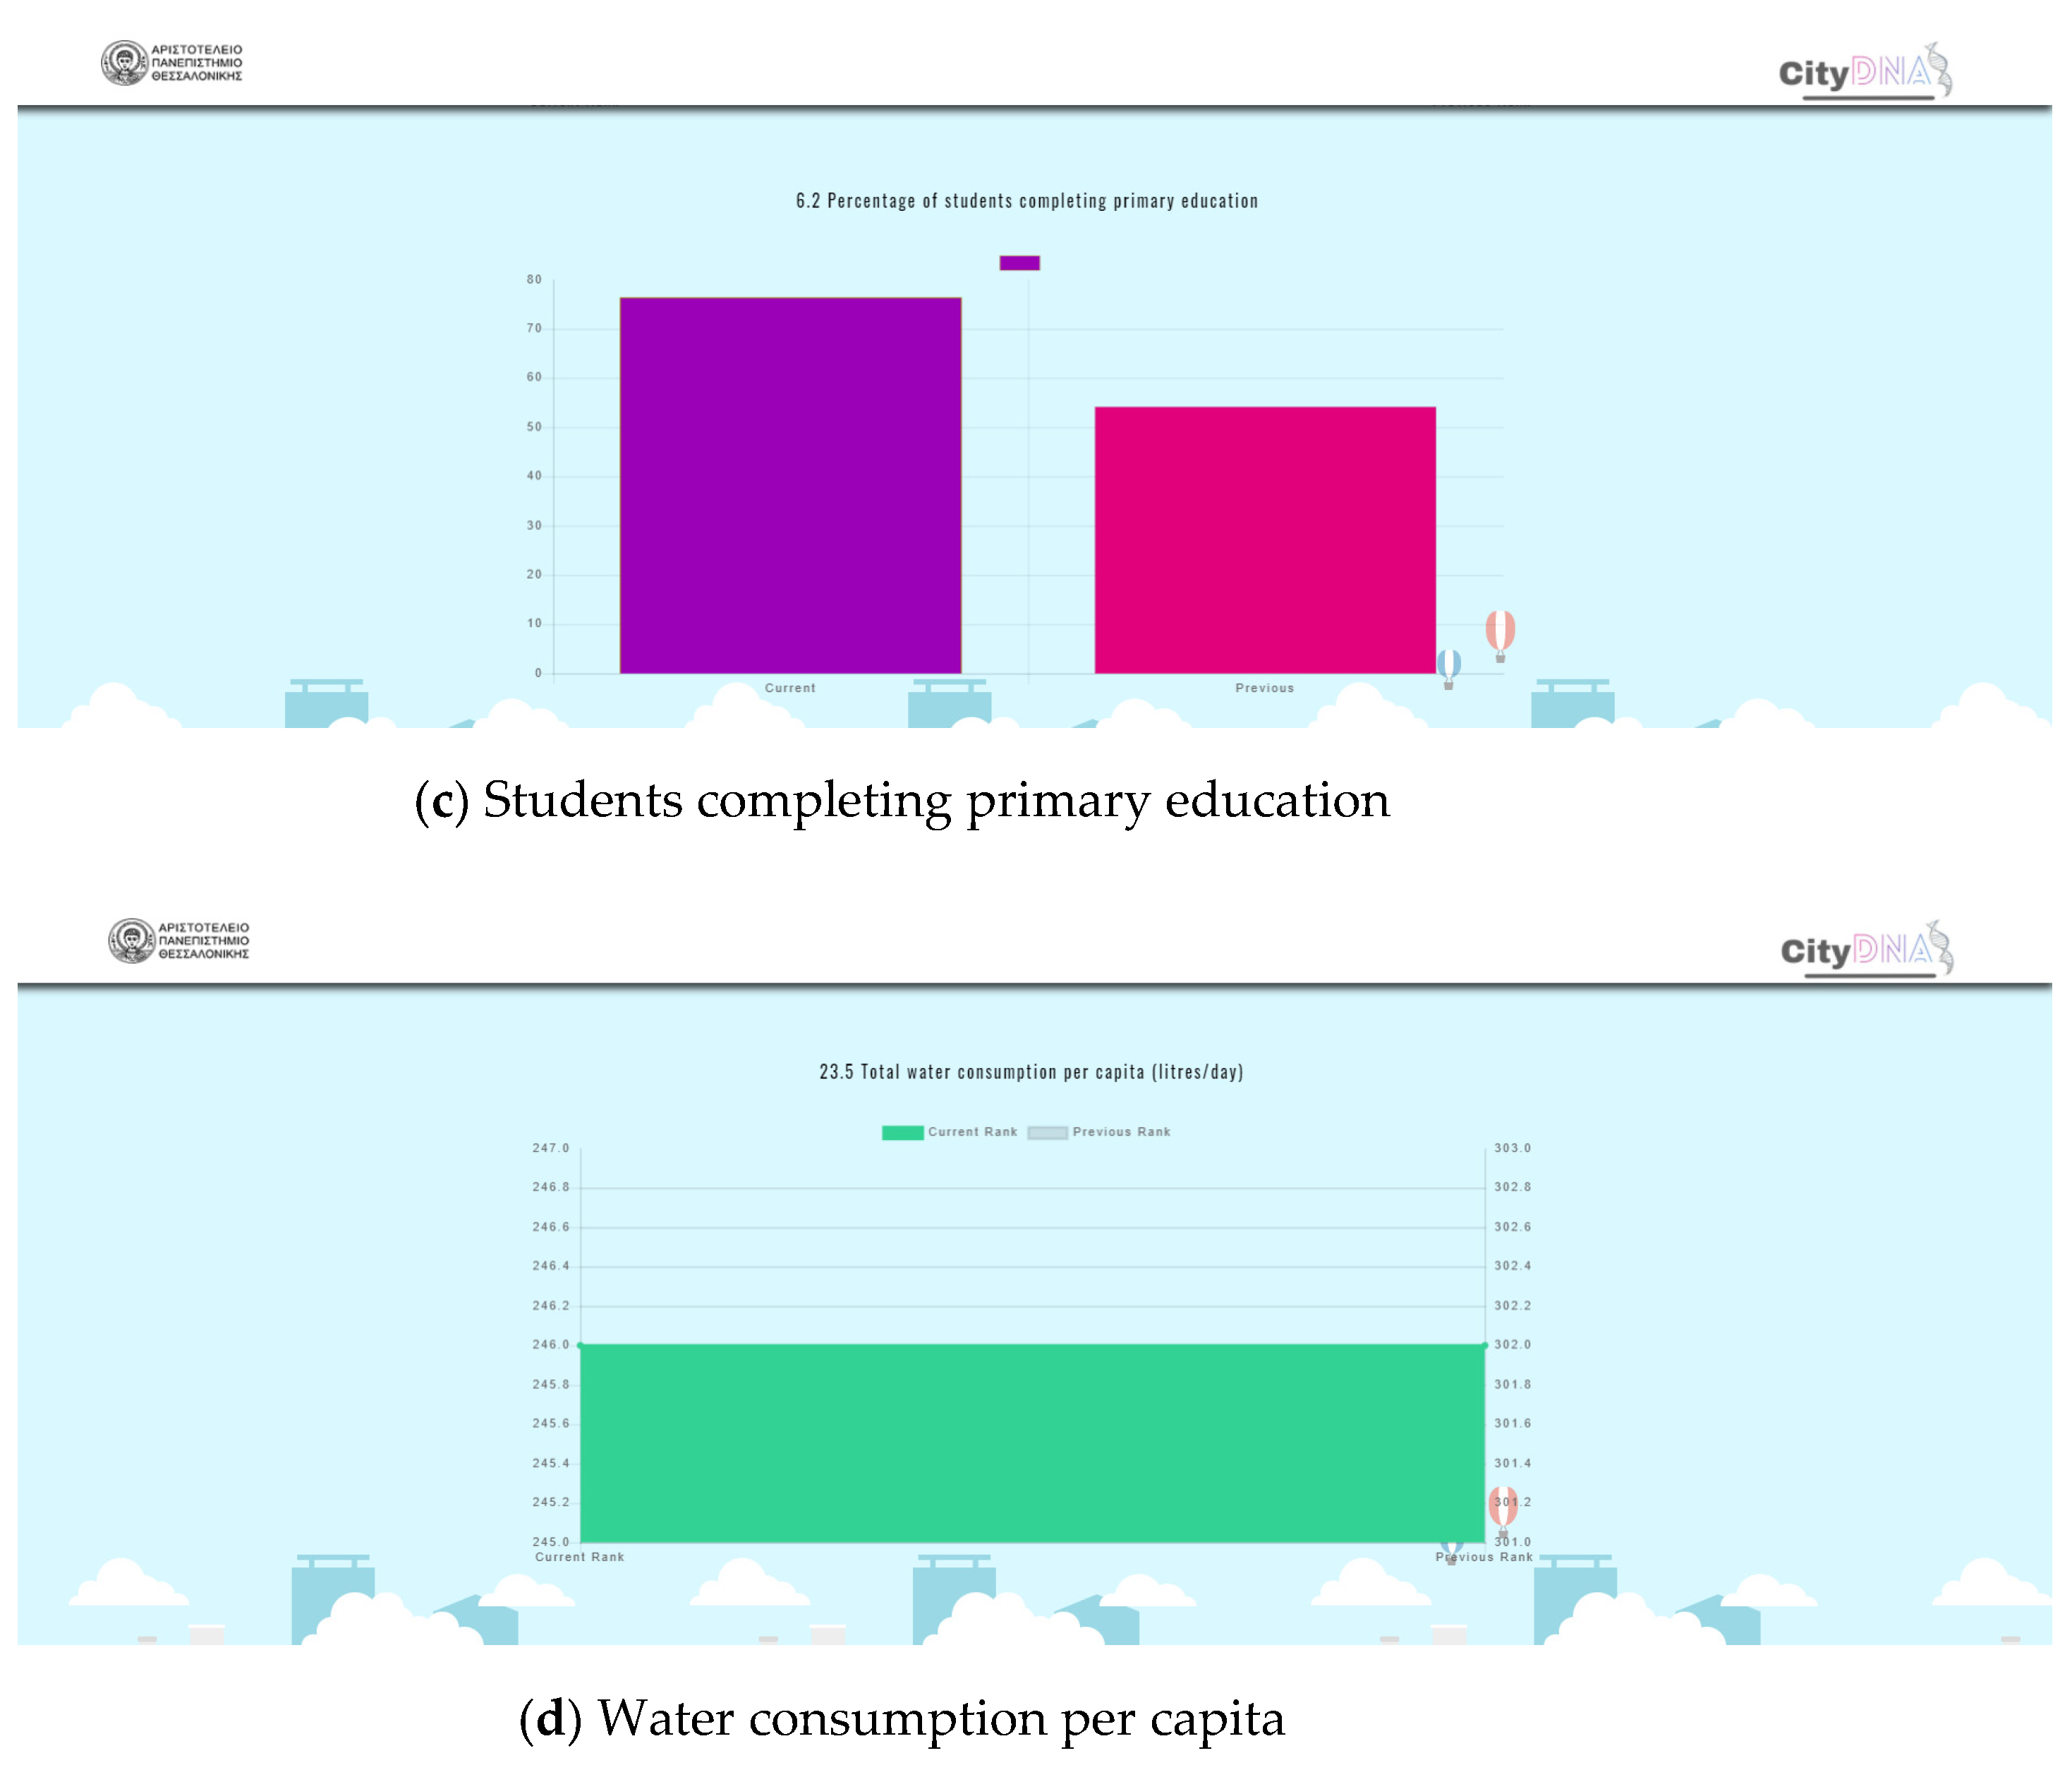
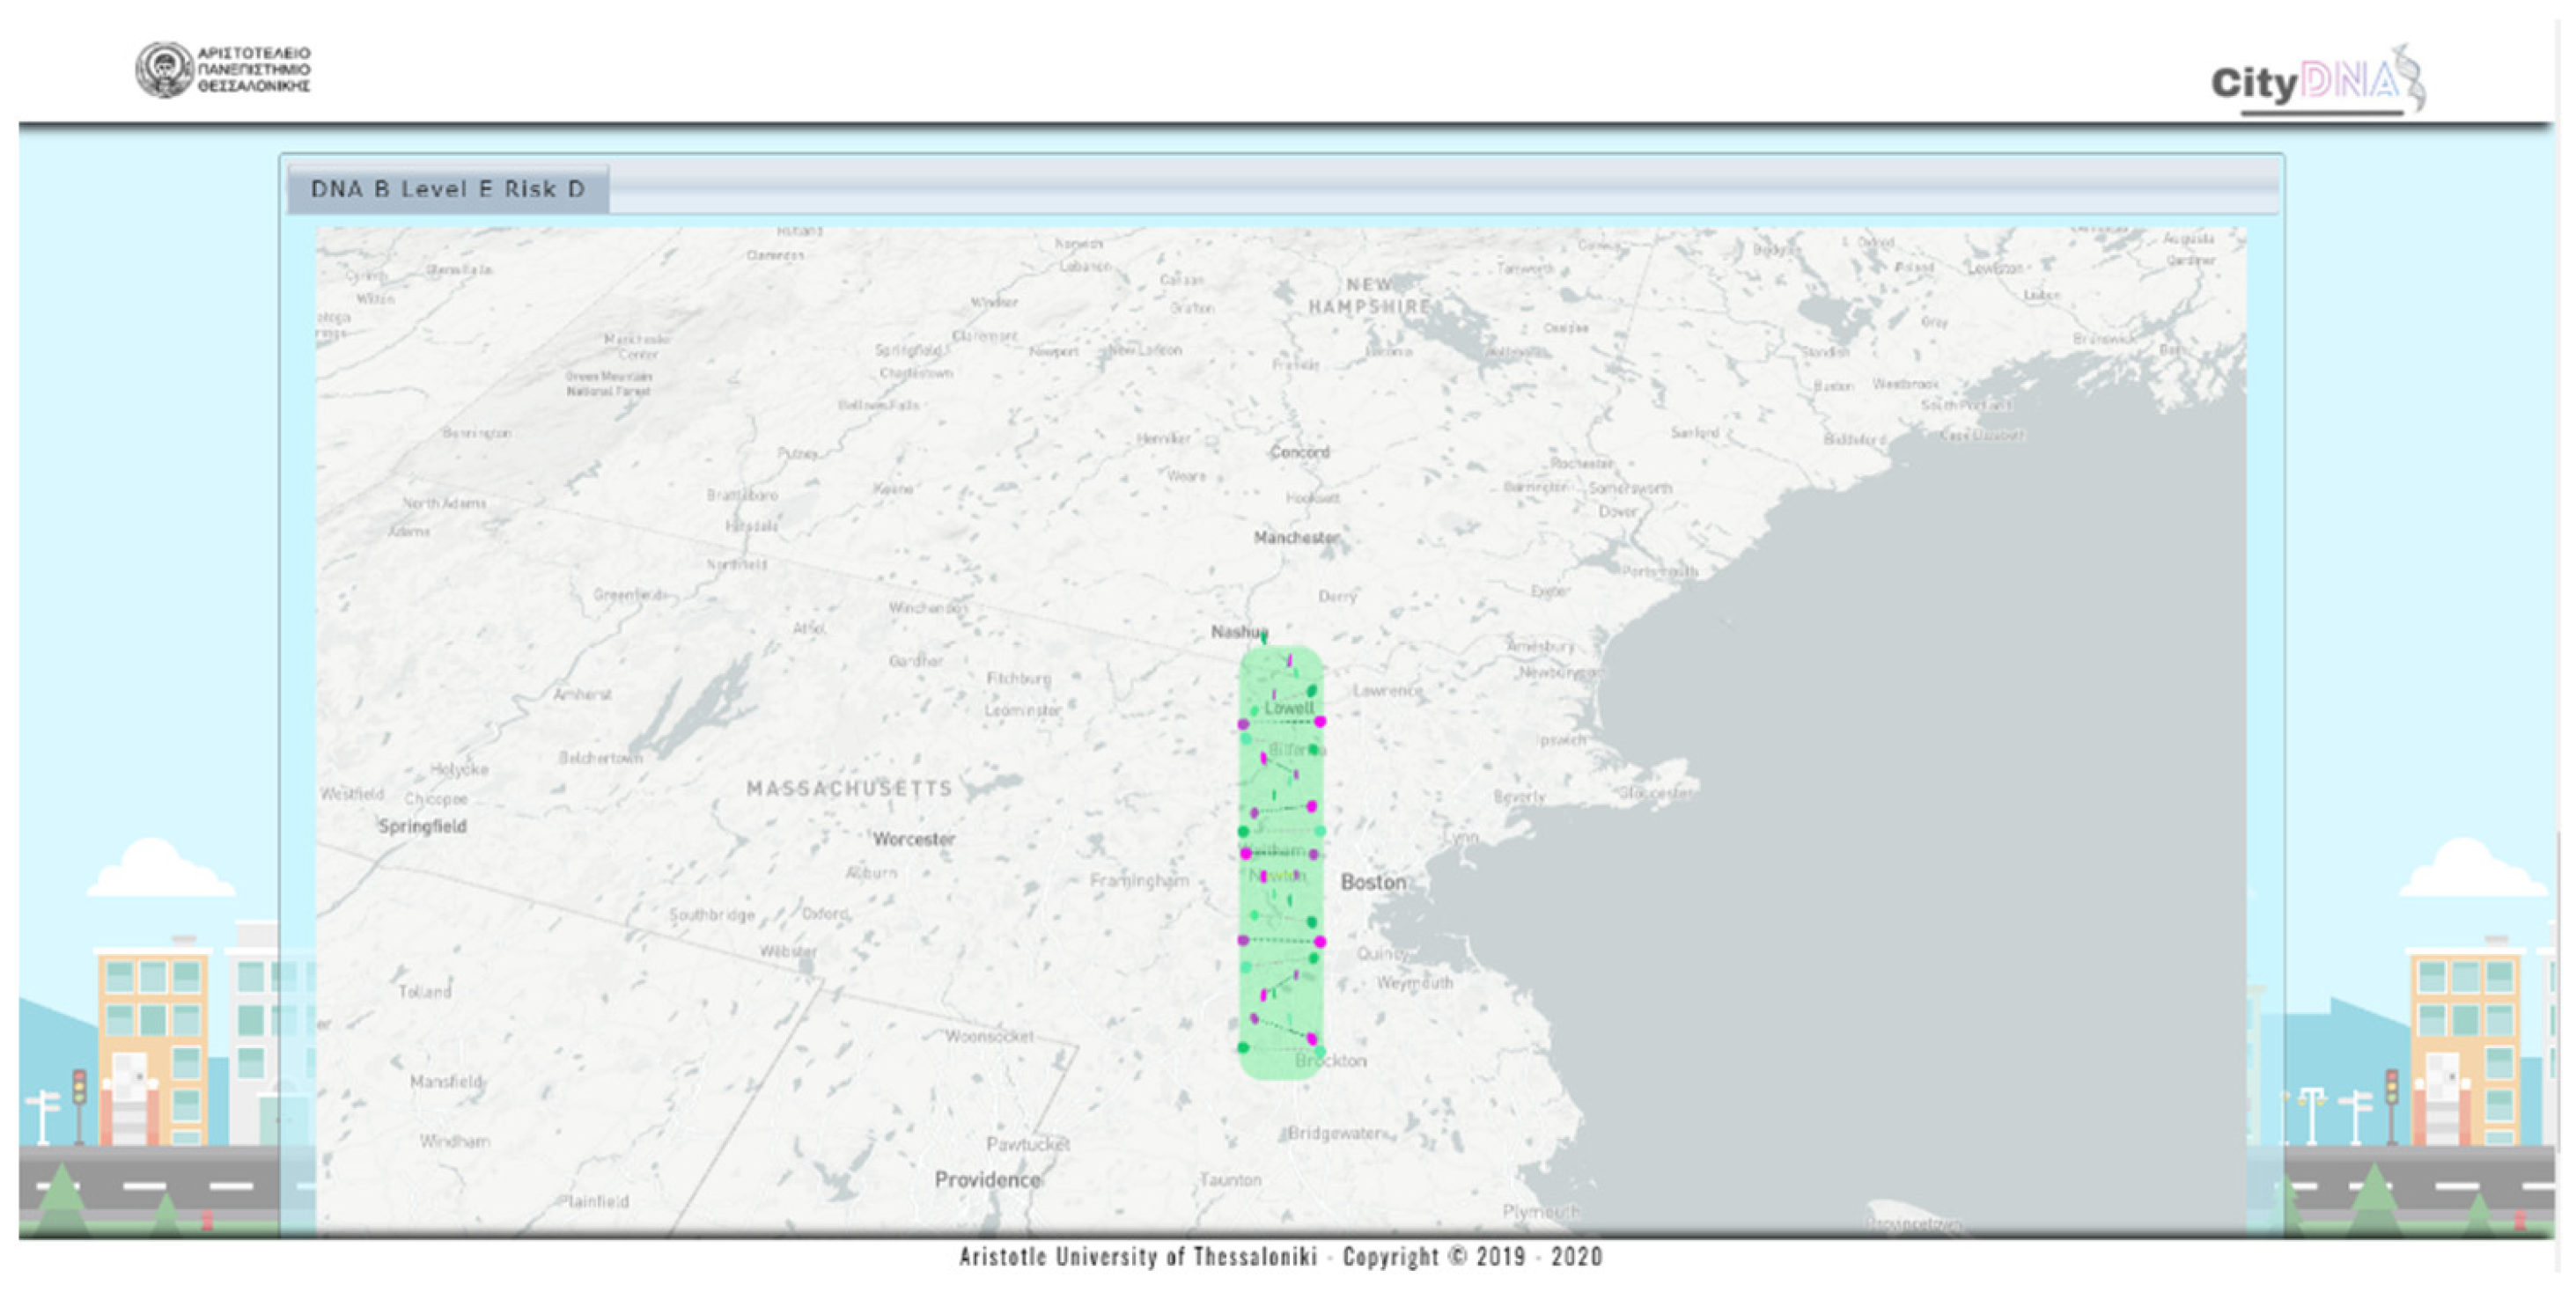
- Complete the procedure by pressing a button, entitled “Start Analysis” button. Then, all the necessary calculations are performed and the “cityDNA” profile is generated and visualized (Figure 9).
- Exploitation of data retrieved from various data sources, some of which will provide real-time data, will lead to the extraction of impartial and updated KPIs, and consequently to the synthesis of a comprehensive and representative “cityDNA” profile that will evolve over time.
- Design and development of algorithms for the data and KPI analysis and forecasting that will be integrated in the proposed service aiming at real-time data exploitation, maintenance forecasting and urban planning facilitating.
- The presentation and comparison of “cityDNA” profiles for two or more cities in a single Web page. This feature, which will facilitate the benchmarking of cities, is expected to help researchers and local authorities to draw conclusions, to seek for best practices and to improve city performance.
- Experimentation with the use of other standards for cities such as ITU standards and comparing them with the ISO standards aiming to investigate and identify similarities and differences.
7. Proof-of-Concept: Exploring the cityDNA at a Smart City Context
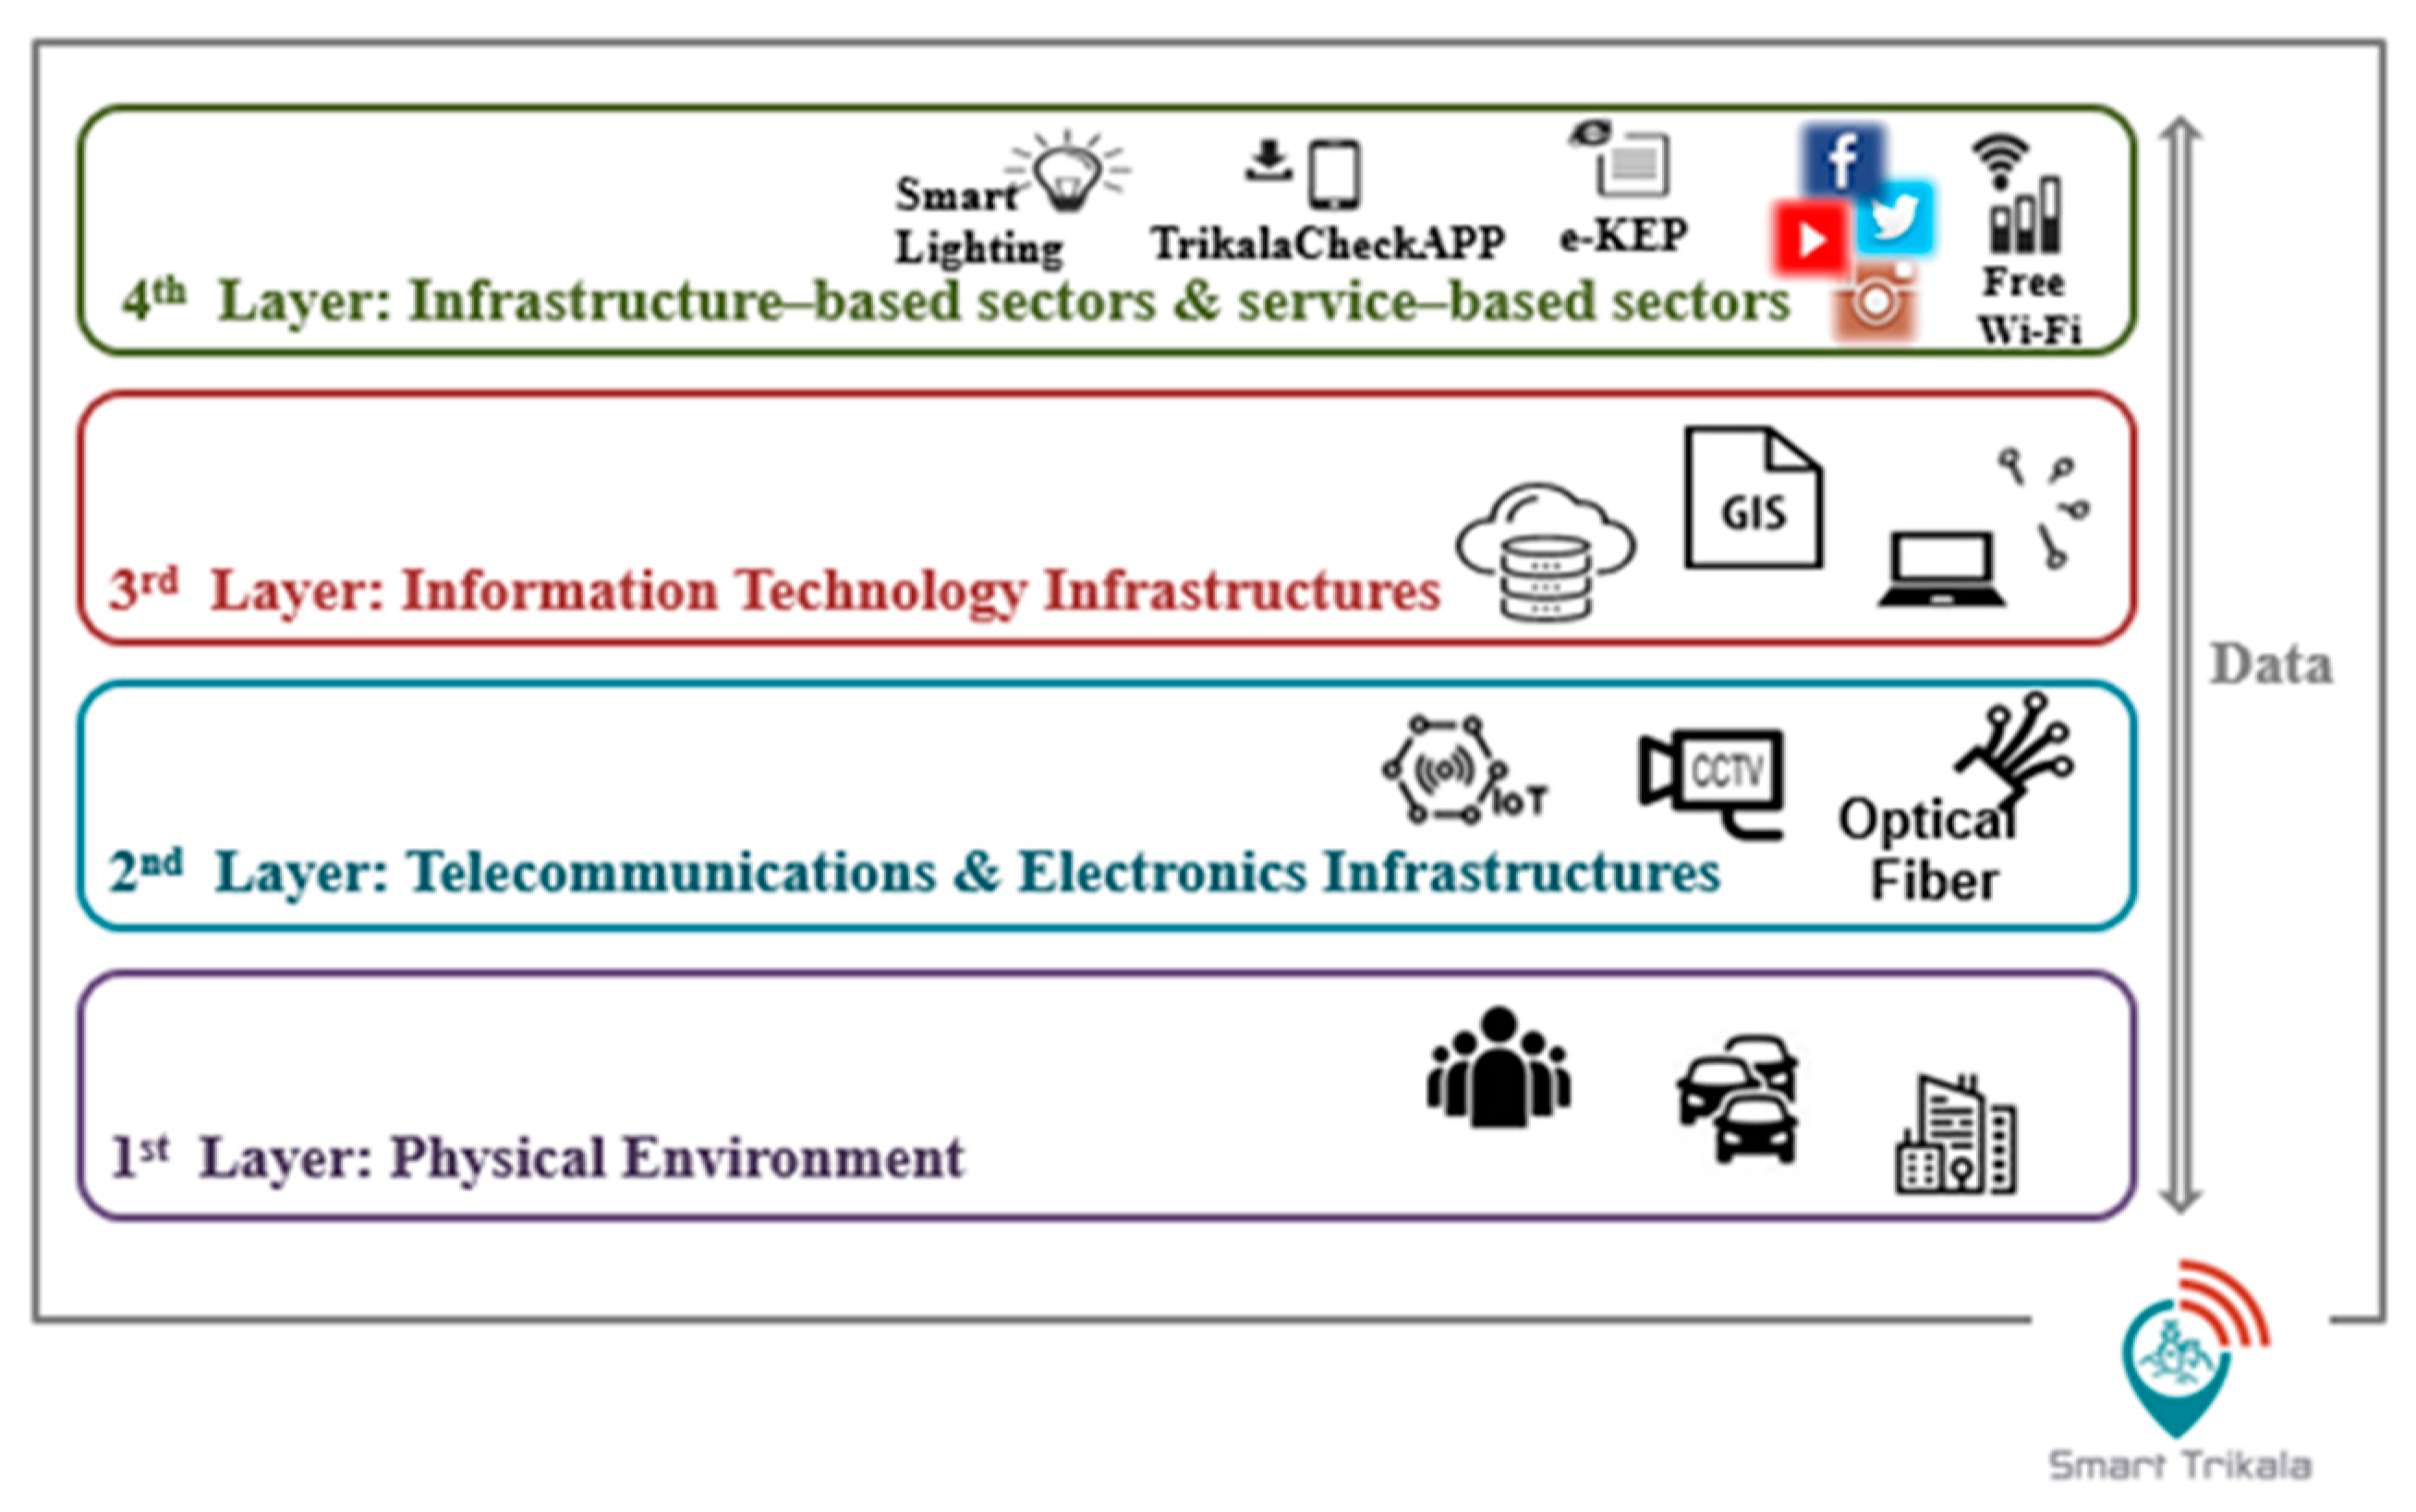
- First layer: Physical Environment.
- Second layer: Telecommunications and Electronics (hard ICT facilities).
- Third layer: Information Technologies (soft ICT facilities).
- Fourth layer: Infrastructure-based sectors and service-based sectors (end-users and applications).
8. Conclusions and Future Work
Author Contributions
Funding
Acknowledgments
Conflicts of Interest
Appendix A
- s1.
- YCHARTS. Boston, MA Unemployment Rate. Available online: https://ycharts.com/indicators/boston_ma_unemployment_rate (accessed on 25 July 2020).
- s2.
- Office for National Statistics. Unemployment. Available online: https://www.ons.gov.uk/employmentandlabourmarket/peoplenotinwork/unemployment (accessed on 25 July 2020).
- s3.
- Wikipedia. 2019 Boston City Council election. Available online: https://en.wikipedia.org/wiki/2019_Boston_City_Council_election (accessed on 25 July 2020).
- s4.
- GBH. Why Is Voter Turnout in Local Elections So Low? Available online: https://www.wgbh.org/news/commentary/2019/09/16/why-is-voter-turnout-in-local-elections-so-low 81 (accessed on 25 July 2020).
- s5.
- UK Parliament. General Election 2017: full results and analysis. Available online: https://commonslibrary.parliament.uk/research-briefings/cbp-7979/ (accessed on 25 July 2020).
- s6.
- UK Parliament. Turnout at elections. Available online: https://commonslibrary.parliament.uk/research-briefings/cbp-8060/ (accessed on 25 July 2020).
- s7.
- Boston Public School. Available online: https://www.bostonpublicschools.org/domain/238 (accessed on 25 July 2020).
- s8.
- Eurostat. Early childhood and primary education statistics. Available online: https://ec.europa.eu/eurostat/statistics-explained/index.php/Early_childhood_and_primary_education_statistics (accessed on 25 July 2020).
- s9.
- The Boston Globe. Water Consumption. Available online: https://www.bostonglobe.com/metro/regionals/south/2013/07/20/water-use-down-but-water-rates-going/q2FpV3jGRCqmKSy4XeG3QP/story.html (accessed on 25 July 2020).
- s10.
- The Commonwealth of Massachusetts. Policy for Developing Water Needs Forecasts for Public Water Suppliers and Communities and Methodology for Implementation. Available online: https://www.mass.gov/doc/water-resources-commission-policy-on-water-needs-forecasts-for-public-water-suppliers/download (accessed on 25 July 2020).
- s11.
- Mayor of London. The London Plan. Available online: https://www.london.gov.uk/what-we-do/planning/london-plan/current-london-plan/london-plan-chapter-five-londons-response/pol-14 (accessed on 25 July 2020).
- s12.
- Energy Saving Trust. Water consumption. Available online: https://energysavingtrust.org.uk/sites/default/files/reports/AtHomewithWater%287%29.pdf (accessed on 25 July 2020).
- s13.
- The Commonwealth of Massachusetts. Life expectancy rises in Massachusetts, breaking with national trend. Available online: https://www.mass.gov/news/life-expectancy-rises-in-massachusetts-breaking-with-national-trend#:~:text=BOSTON%20%E2%80%94%20The%20average%20life%20expectancy,Americans%20are%20expected%20to%20live (accessed on 25 July 2020).
- s14.
- Office for National Statistics. Health state life expectancies, UK: 2016 to 2018. Available online: https://www.ons.gov.uk/ (accessed on 25 July 2020).
- s15.
- Office for National Statistics. Internet access—households and individuals, Great Britain: 2019. Available online: https://www.ons.gov.uk/peoplepopulationandcommunity/householdcharacteristics/homeinternetandsocialmediausage/bulletins/internetaccesshouseholdsandindividuals/2019 (accessed on 25 July 2020).
Appendix B
Appendix B.1. Boston City


Appendix B.2. London City


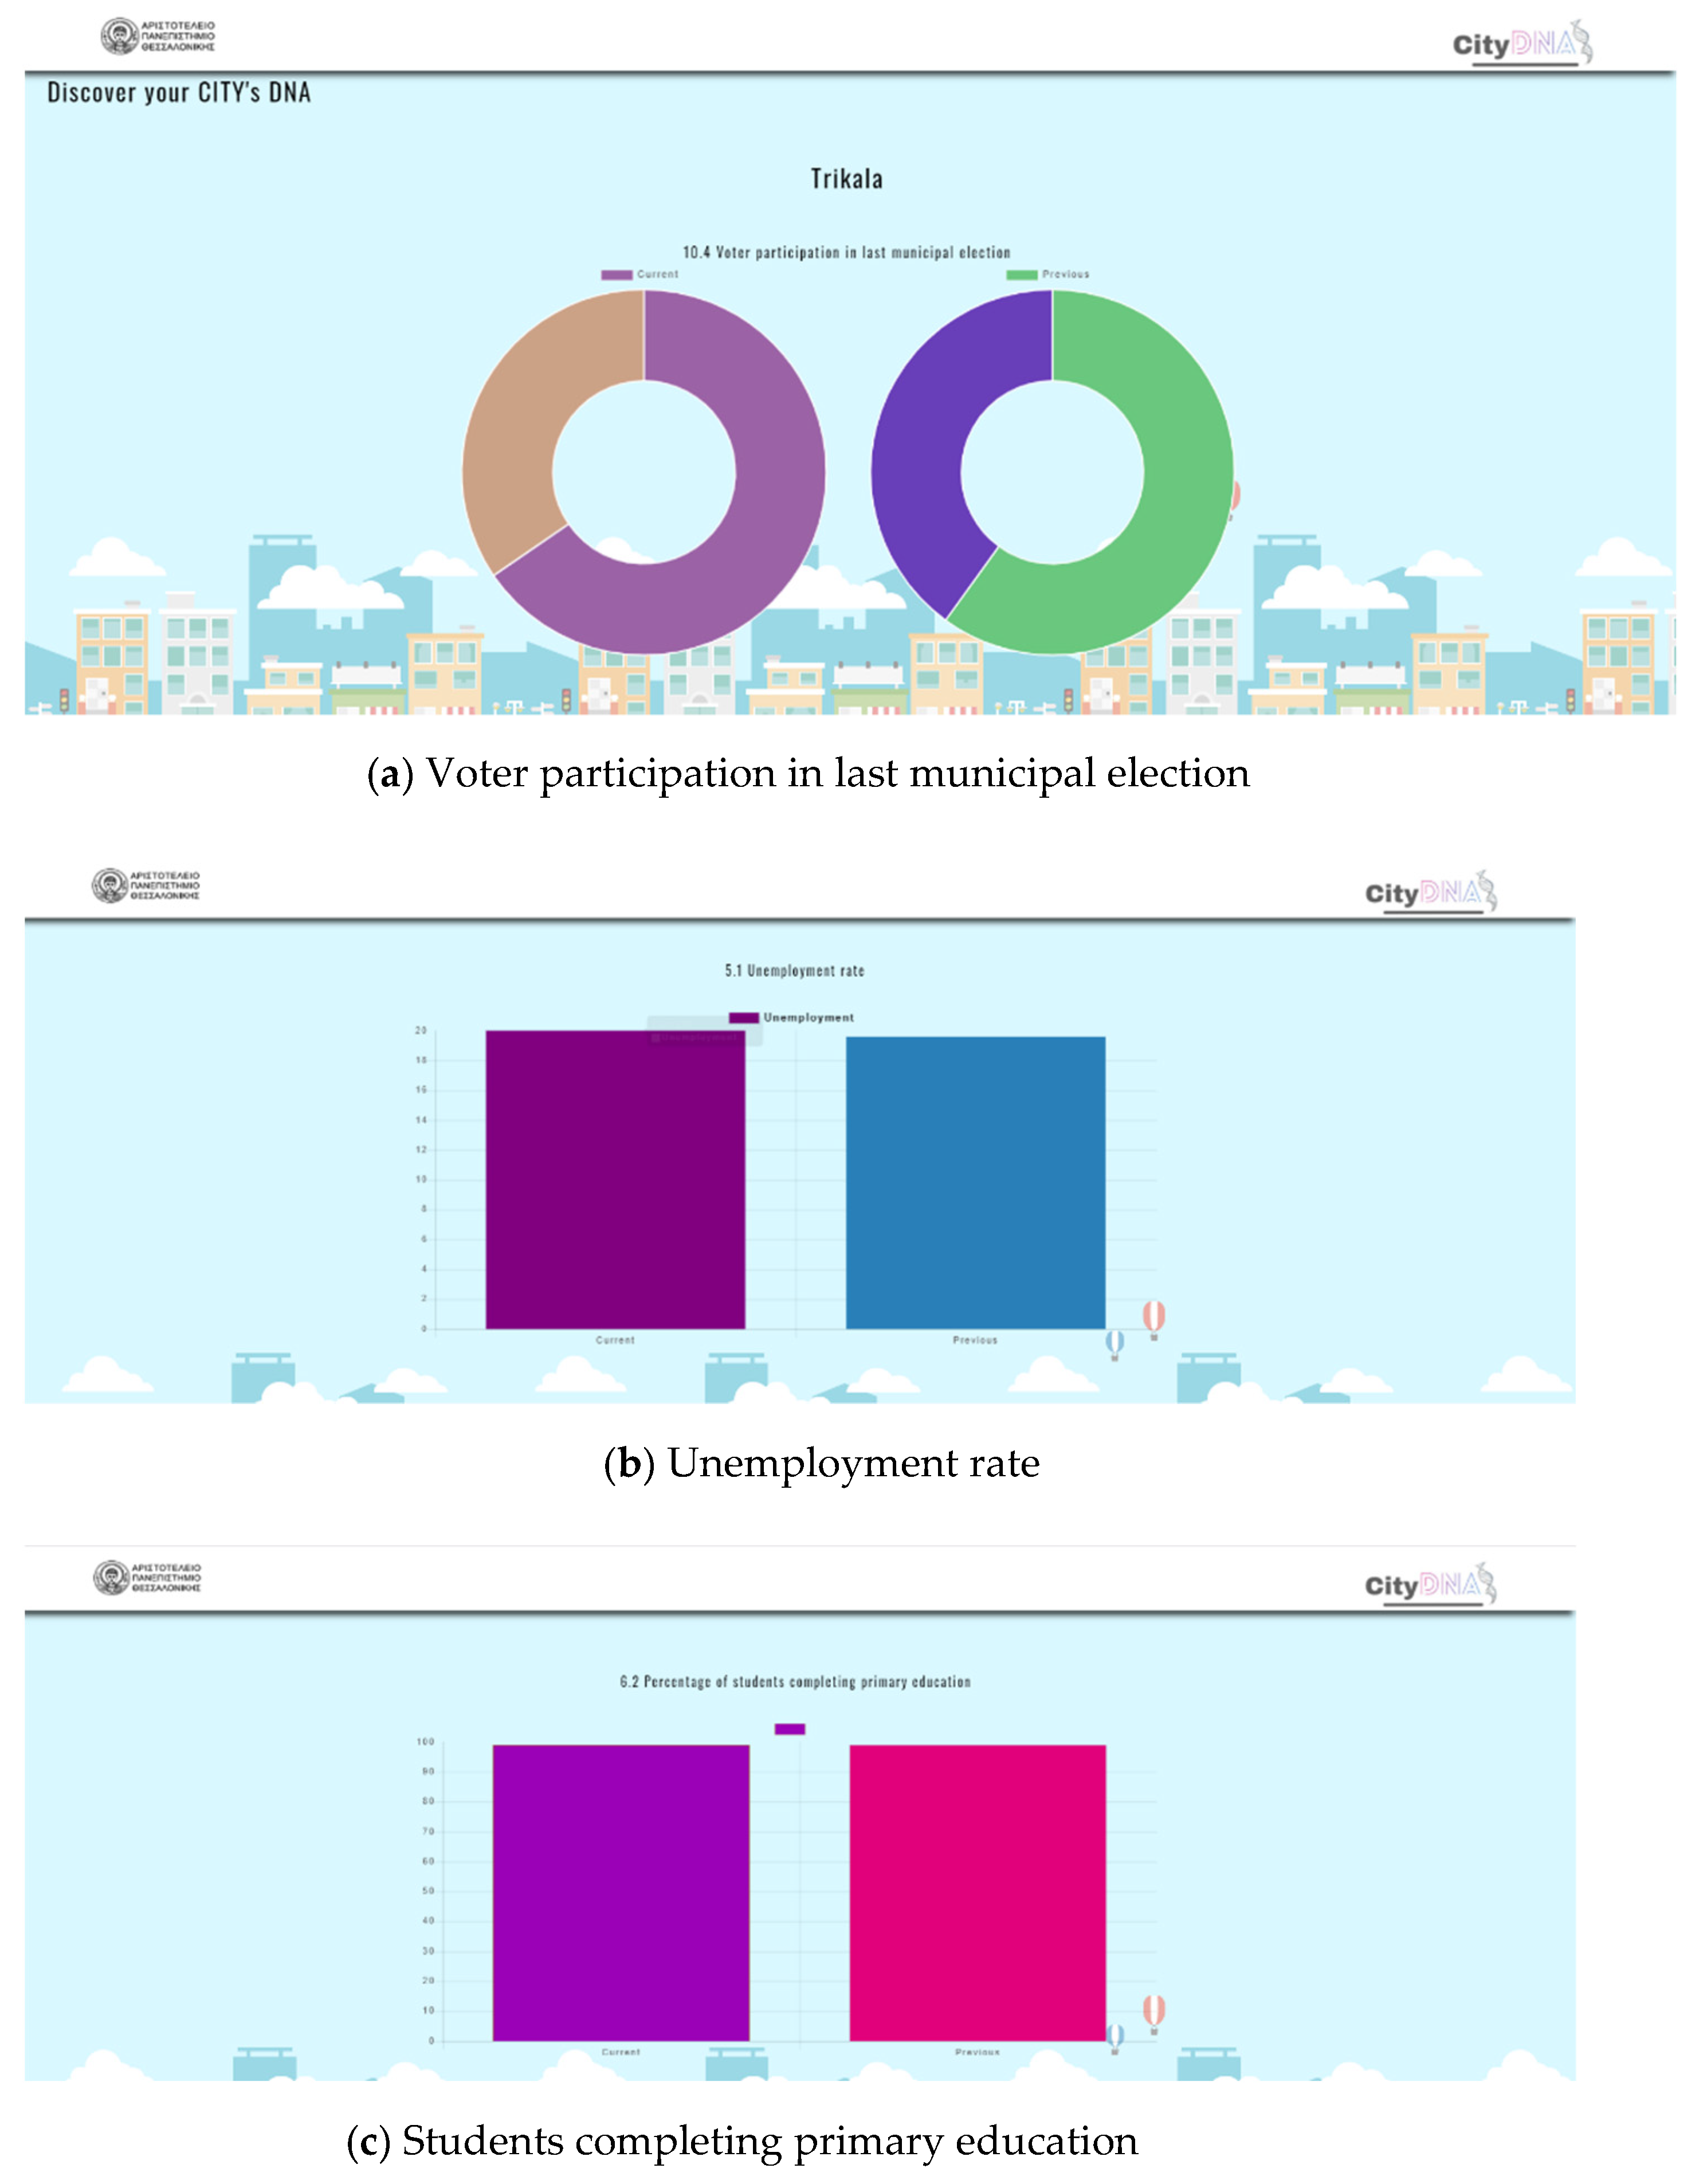
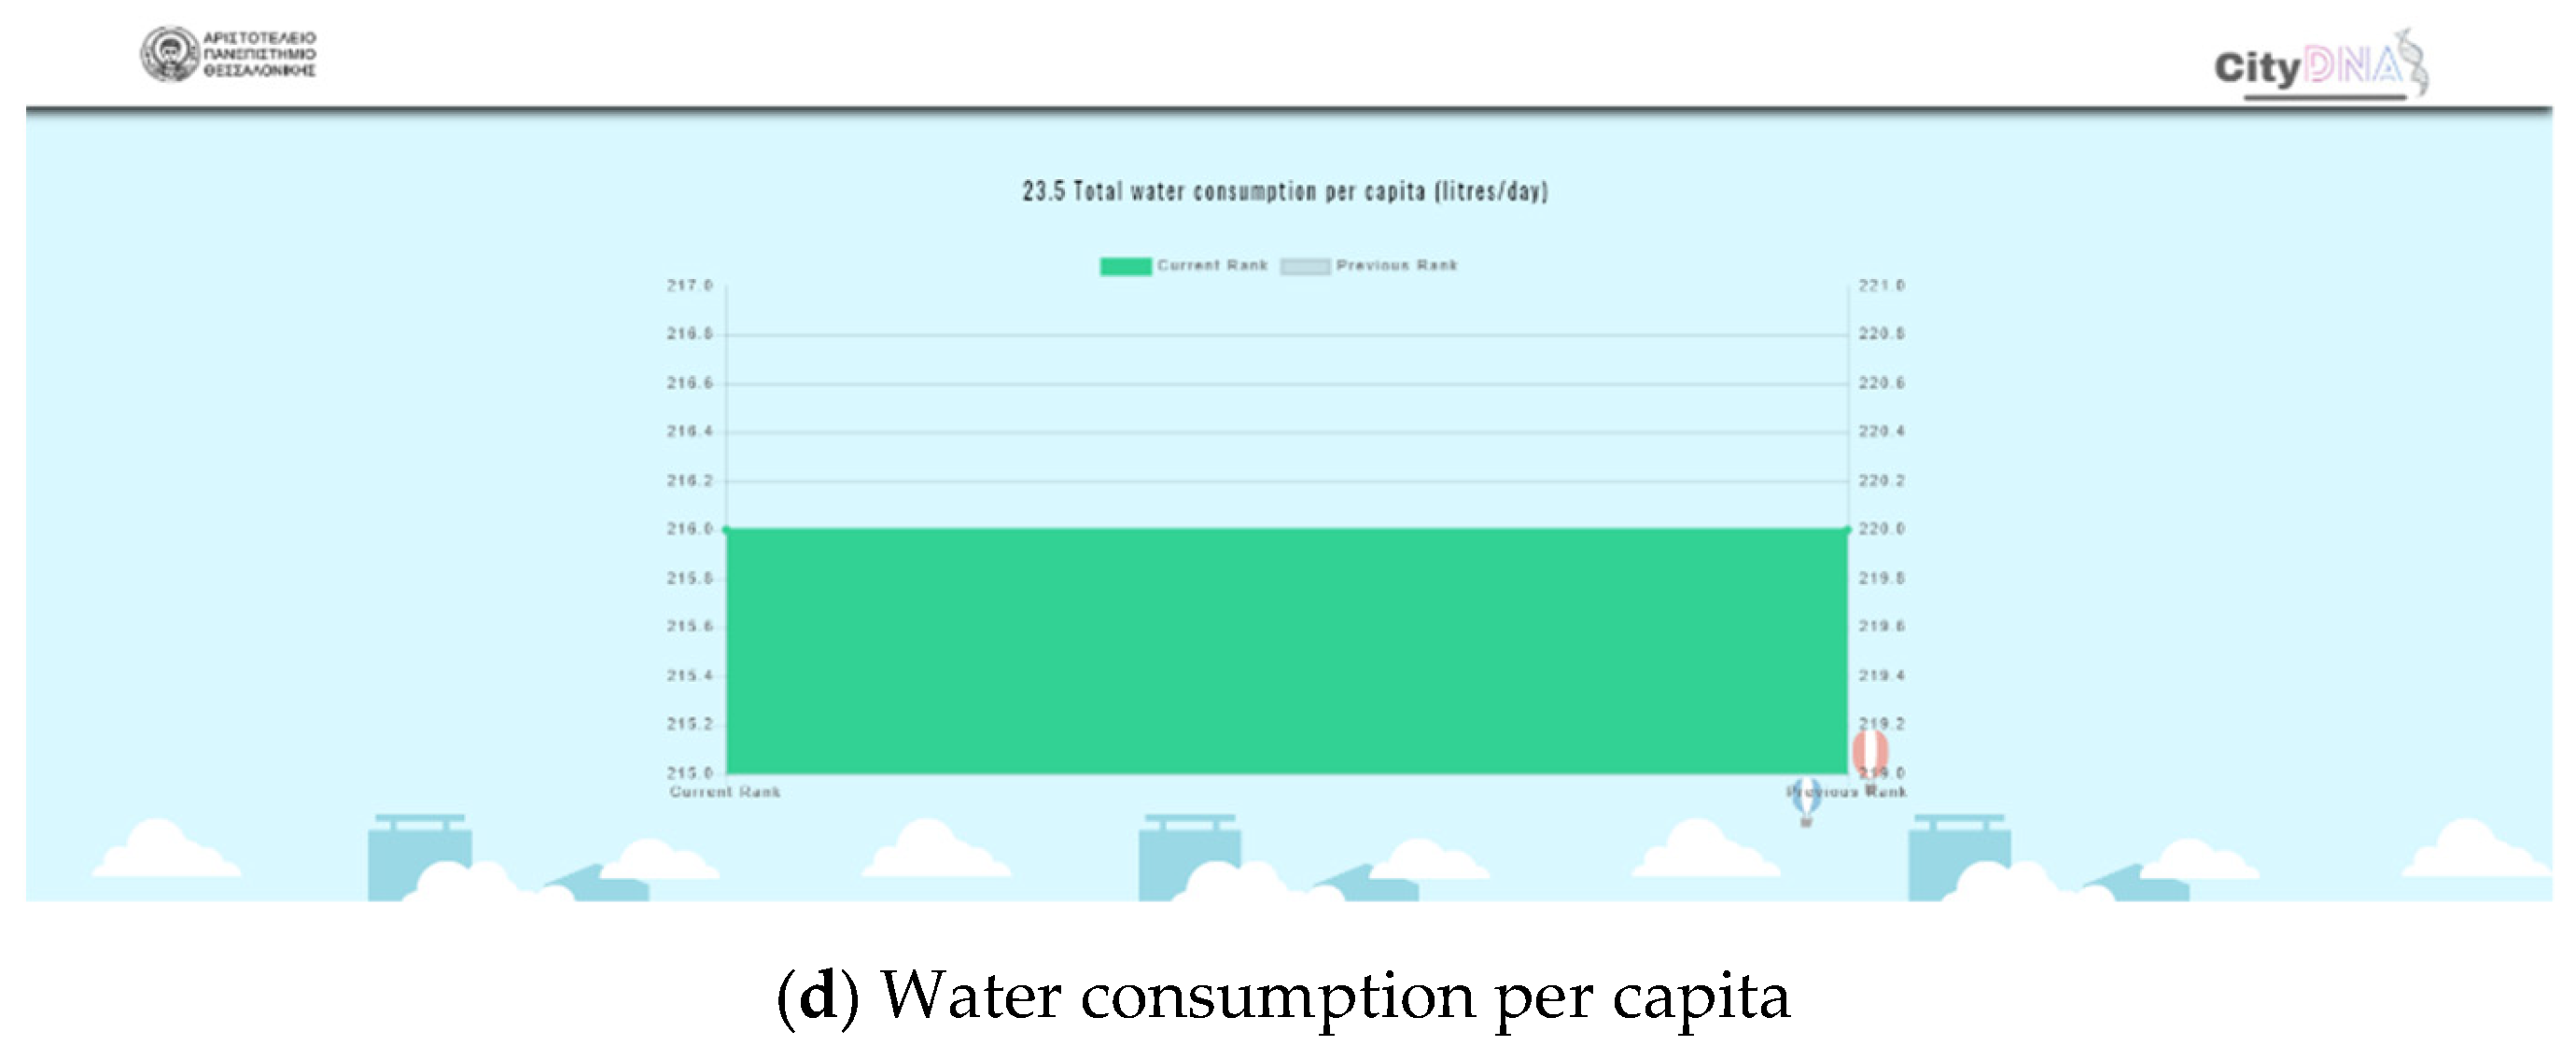
Appendix B.3. Trikala City


Appendix C

| Complaints’ Category | Issues | Number of Complaints/Year | |||
|---|---|---|---|---|---|
| 2016 | 2017 | 2018 | 2019 | ||
| Facilities maintenance | Park maintenance | 0 | 1 | 1 | 3 |
| Playground maintenance | 2 | 12 | 11 | 57 | |
| School building maintenance | 1 | 5 | 1 | 8 | |
| Square maintenance | 6 | 11 | 5 | 11 | |
| Green maintenance | 67 | 80 | 139 | 89 | |
| Public spaces maintenance | 28 | 117 | 268 | 285 | |
| Total Number of Complaints | 104 | 226 | 425 | 453 | |
| Lighting maintenance | Replacing light bulbs | 1660 | 1468 | 1694 | 2884 |
| Installation of new lighting fixtures | 6 | 13 | 24 | 24 | |
| General lighting problems | 199 | 257 | 405 | 818 | |
| Total Number of Complaints | 1865 | 1738 | 2123 | 3726 | |
| Street maintenance | General road problems | 29 | 60 | 87 | 105 |
| Asphalting of roads | 14 | 28 | 38 | 66 | |
| Cement paving/paving of sidewalks | 12 | 29 | 40 | 68 | |
| Road construction problems (potholes) | 94 | 292 | 230 | 264 | |
| Traffic signaling problems | 1 | 46 | 38 | 43 | |
| Total Number of Complaints | 150 | 455 | 433 | 546 | |
| Maintenance of water supply and sewerage infrastructure | General water supply problems | 0 | 9 | 21 | 37 |
| Water pipe leak | 0 | 12 | 13 | 24 | |
| General drainage problems | 3 | 21 | 21 | 32 | |
| Clogged drainage sump | 10 | 10 | 8 | 21 | |
| Clogged rain well | 15 | 64 | 79 | 167 | |
| Total Number of Complaints | 28 | 116 | 142 | 281 | |
| Grounds maintenance | Total Number of Complaints | 437 | 869 | 976 | 2187 |
| Solid waste management | Collection of bulky waste | 1277 | 1283 | 1274 | 971 |
| Waste collection | 140 | 123 | 180 | 187 | |
| Waste bin management | 151 | 362 | 261 | 542 | |
| Total Number of Complaints | 1568 | 1768 | 1715 | 1700 | |
| Urban cleanliness | Road cleaning | 213 | 265 | 359 | 360 |
| Plot cleaning | 6 | 12 | 42 | 395 | |
| Riverbed cleanliness | 4 | 15 | 13 | 12 | |
| General problems of municipal cleanliness | 118 | 111 | 119 | 192 | |
| Total Number of Complaints | 341 | 403 | 533 | 959 | |
| Recycling | Recycling of electrical appliances | 5 | 21 | 10 | 4 |
| Plastic recycling | 1 | 2 | 1 | 1 | |
| Paper recycling | 5 | 10 | 10 | 9 | |
| Total Number of Complaints | 11 | 33 | 21 | 14 | |
| Animals | Collection of dead animals | 29 | 39 | 73 | 90 |
| Unattended animals | 4 | 21 | 60 | 219 | |
| Total Number of Complaints | 33 | 60 | 133 | 309 | |
References
- Nam, T.; Pardo, T.A. Conceptualizing smart city with dimensions of technology, people, and institutions. In Proceedings of the 12th Annual International Digital Government Research Conference: Digital Government Innovation in Challenging Times, College Park, MA, USA, 12–15 June 2011. [Google Scholar]
- Batty, M.; Axhausen, K.W.; Giannotti, F.; Pozdnoukhov, A.; Bazzani, A.; Wachowicz, M.; Ouzounis, G.; Portugali, Y. Smart cities of the future. Eur. Phys. J. Spec. Top. 2012, 214, 481–518. [Google Scholar] [CrossRef] [Green Version]
- Anthopoulos, L.G. Understanding Smart Cities: A Tool for Smart Government or an Industrial Trick? Springer International Publishing: Cham, Switzerland, 2017. [Google Scholar]
- Moustaka, V.; Vakali, A.; Anthopoulos, L.G. A Systematic Review for Smart City Data Analytics. ACM Comput. Surv. 2019, 51, 1–41. [Google Scholar] [CrossRef]
- Anthopoulos, L.G. (Ed.) Smart City Emergence: Cases from around the World; Transportation and Smart Cities Book Series; Elsevier: New York, NY, USA, 2019. [Google Scholar]
- Bellini, E.; Ceravolo, P.; Nesi, P. Quantify resilience enhancement of UTS through exploiting connect community and internet of everything emerging technologies. ACM Trans. Internet Technol. 2017, 9, 39. [Google Scholar]
- Pramanik, M.I.; Lau, R.Y.; Demirkan, H.; Azad, M.A.K. Smart health: Big data enabled health paradigm within smart cities. Expert Syst. Appl. 2017, 87, 370–383. [Google Scholar] [CrossRef]
- Li, T. Criminal behavior analysis method based on data mining technology. In Proceedings of the International Conference on Smart City and Systems Engineering (ICSCSE’16), Hunan, China, 25–26 November 2016. [Google Scholar]
- Lin, B.; Huangfu, Y.; Lima, N.; Lamb, B.; Cook, D.J. Analyzing the relationship between human behavior and indoor air quality. J. Sens. Actuator Netw. 2017, 6, 13. [Google Scholar] [CrossRef] [Green Version]
- Moustaka, V.; Theodosiou, Z.; Vakali, A.; Kounoudes, A.; Anthopoulos, L.G. Enhancing Social Networking in Smart Cities: Privacy and Security Borderlines. Technol. Forecast. Soc. Chang. 2019, 142, 285–300. [Google Scholar] [CrossRef]
- Dameri, R.P. Smart City Definition, Goals and Performance. In Smart City Implementation. Progress in IS; Springer International Publishing: Cham, Switzerland, 2017. [Google Scholar] [CrossRef]
- Huovila, A.; Bosch, P.; Airaksinen, M. Comparative analysis of standardized indicators for Smart sustainable cities: What indicators and standards to use and when? Cities 2019, 89, 141–153. [Google Scholar] [CrossRef]
- Airaksinen, M.; Seppä, I.P.; Huovila, A.; Neumann, H.-M.; Iglar, B.; Bosch, P. Smart city performance measurement framework CITYkeys. In Proceedings of the 2017 International Conference on Engineering, Technology and Innovation (ICE/ITMC), Madeira, Portugal, 27–29 June 2017. [Google Scholar]
- Christ, O.; Czarniecki, M.; Kressig, C.; Scherer, L. Satisfaction Benchmark for Smart Cities. In Happy City—How to Plan and Create the Best Livable Area for the People; EcoProduction, Environmental Issues in Logistics and Manufacturing; Brdulak, A., Brdulak, H., Eds.; Springer International Publishing: Cham, Switzerland, 2017. [Google Scholar]
- SmartCitiesWorld. TM Forum Launches Global Smart Cities Benchmark. Available online: https://www.smartcitiesworld.net/news/news/tm-forum-launches-global-smart-cities-benchmark--1277 (accessed on 19 January 2020).
- Fox, M.S. The role of ontologies in publishing and analyzing city indicators. Comput. Environ. Urban Syst. 2015, 54, 266–279. [Google Scholar] [CrossRef]
- Fox, M.S.; Pettit, C.J. On the completeness of open city data for measuring city indicators. In Proceedings of the 2015 IEEE First International Smart Cities Conference (ISC2), Guadalajara, Mexico, 25–28 October 2015. [Google Scholar]
- Zdraveski, V.; Mishev, K.; Trajanov, D.; Kocarev, L. ISO-Standardized Smart City Platform Architecture and Dashboard. IEEE Pervasive Comput. 2017, 16, 2. [Google Scholar] [CrossRef]
- Founoun, A.; Hayar, A. Evaluation of the concept of the smart city through local regulation and the importance of local initiative. In Proceedings of the 2018 IEEE International Smart Cities Conference (ISC2), Kansas City, MO, USA, 16–19 September 2018. [Google Scholar]
- Fox, M.S.; Pettit, C.J. A Transportation Ontology for Global City Indicators (ISO 37120). Technical Report. Available online: 10.13140/RG.2.2.22520.26881 (accessed on 3 March 2020).
- ISO. ISO 37120:2014. Sustainable Development of Communities—Indicators for City Services and Quality of Life. Available online: https://www.iso.org/standard/62436.html (accessed on 1 August 2020).
- ISO. ISO 37120:2018. Sustainable Cities and Communities—Indicators for City Services and Quality of Life. Available online: https://www.iso.org/standard/68498.html (accessed on 1 August 2020).
- Berman, M.; Orttung, R.W. Measuring Progress toward Urban Sustainability: Do Global Measures Work for Arctic Cities? Sustainability 2020, 12, 3708. [Google Scholar] [CrossRef]
- Mouyal, N. Update on the Smart City Work Taking Place in ISO/IEC JTC 1. Information Technology for Smart Cities. Available online: https://etech.iec.ch/issue/2020-01/information-technology-for-smart-cities (accessed on 4 March 2020).
- Moustaka, V.; Maitis, A.; Vakali, A.; Anthopoulos, L.-G. CityDNA Dynamics: A Model for Smart City Maturity and Performance Benchmarking. In Proceedings of the Companion Proceedings of the Web Conference (WWW’ 2020), Taipei, Taiwan, 20–24 April 2020. [Google Scholar]
- WWCD. Open Data Portal. Available online: https://www.dataforcities.org (accessed on 1 September 2020).
- ISO. ISO 37122:2019, Sustainable Cities—Indicators for Smart Cities. Available online: https://www.sis.se/api/document/preview/80011945/ (accessed on 1 August 2020).
- ISO. ISO 37123:2019, Sustainable Cities—Indicators for Resilient Cities. Available online: https://www.sis.se/api/document/preview/80018865/ (accessed on 1 August 2020).
- Moustaka, V.; Vakali, A.; Anthopoulos, L.G. CityDNA: Smart City Dimensions’ Correlations for Identifying Urban Profile. In Proceedings of the 26th International Conference on World Wide Web (WWW’17 Companion), Perth, Australia, 3 April 2017. [Google Scholar]
- De Santis, R.; Fasano, A.; Mignolli, N.; Villa, V. Smart City: Fact and Fiction. Available online: https://econpapers.repec.org/paper/pramprapa/54536.htm (accessed on 15 December 2020).
- Kumar, H.; Singh, M.K.; Gupta, M.P.; Madaan, J. Moving towards smart cities: Solutions that lead to the Smart City Transformation Framework. Technol. Forecast. Soc. Chang. 2020, 153, 11928. [Google Scholar] [CrossRef]
- OECD. Resilient Cities. Available online: https://www.oecd.org/regional/resilient-cities.htm#:~:text=Resilient%20cities%20are%20cities%20that,cities%20can%20increase%20their% (accessed on 4 March 2020).
- Anthopoulos, L.G. Smart utopia vs smart reality: Learning by experience from 10 smart city cases. Cities 2017, 63, 128–148. [Google Scholar] [CrossRef]
- International Telecommunications Union (ITU). Smart Sustainable Cities: An Analysis of Definitions. 2014. Available online: www.itu.int/en/ITU-T/focusgroups/ssc/Documents/Approved_Deliverables/TR-Definitions.docx (accessed on 1 August 2020).
- Giffinger, R.; Gudrun, H. Smart cities ranking: An effective instrument for the positioning of cities? ACE 2010, 4, 7–25. [Google Scholar]
- Chelleri, L.; Kunath, A.; Minucci, G.; Olazabal, M.; Waters, J.J.; Yumalogava, L. Multidisciplinary perspective on urban resilience. Workshop Report. BC3, Basque Centre for Climate Change. Available online: http://www.bc3research.org/multidisciplinary_perspectives_on_urban_resilience (accessed on 4 March 2020).
- Papa, R.; Galderisi, A.; Vigo Majello, M.C.; Saretta, E. Smart and Resilient Cities. A Systemic Approach for Developing Cross-sectoral Strategies in the Face of Climate Change. TeMA 2015, 8, 1. [Google Scholar]
- Wray, S. COVID-19 is shifting the focus from smart cities to resilient cities. Available online: https://cities-today.com/covid-19-shifts-the-focus-from-smart-cities-to-resilient-cities/ (accessed on 14 November 2020).
- Ruiz-Mallén, I. Co-production and Resilient Cities to Climate Change. In Participatory Research and Planning in Practice; The Urban Book Series; Nared, J., Bole, D., Eds.; Springer International Publishing: Cham, Switzerland, 2020. [Google Scholar]
- Mendizabal, M.; Heidrich, O.; Feliu, E.; García-Blanco, G.; Mendizabal, A. Stimulating urban transition and transformation to achieve sustainable and resilient cities. Renew. Sustain. Energy Rev. 2018, 94, 410–418. [Google Scholar] [CrossRef]
- Remes, J.; Woetzel, J. Smarter Cities are Resilient Cities. Available online: https://www.mckinsey.com/industries/capital-projects-and-infrastructure/our-insights/smarter-cities-are-resilient-cities# (accessed on 1 August 2020).
- Zhu, S.; Li, D.; Feng, H.; Gu, T.; Hewage, K.; Sadiq, R. Smart city and resilient city: Differences and connections. WIREs Data Min. Knowl. Discov. 2020, 10, 6. [Google Scholar] [CrossRef]
- Agugiaro, G.; González, F.G.G.; Cavallo, R. The City of Tomorrow from… the Data of Today. ISPRS Int. J. Geo. Inf. 2020, 9, 554. [Google Scholar] [CrossRef]
- Kourtit, K.; Elmlund, P.; Nijkamp, P. The urban data deluge: Challenges for smart urban planning in the third data revolution. Int. J. Urban Sci. 2020, 24, 445–461. [Google Scholar] [CrossRef]
- Aguilera, U.; López-de-Ipiña, D.; Pérez, J. Collaboration-Centred Cities through Urban Apps Based on Open and User-Generated Data. Sensors 2016, 16, 1022. [Google Scholar] [CrossRef] [Green Version]
- Ottenburger, S.; Airaksinen, M.; Pinto-Seppa, I.; Raskob, W. Enhancing urban resilience via a real-time decision support system for smart cities. In Proceedings of the 2017 International Conference on Engineering, Technology and Innovation (ICE/ITMC), Madeira, Portugal, 27–29 June 2020. [Google Scholar]
- Frost and Sullivan. Smart Cities. Available online: https://ww2.frost.com/wp-content/uploads/2019/01/SmartCities.pdf (accessed on 4 March 2020).
- Misra, A.; Gooze, A.; Watkins, K.; Asad, M.; Le Dantec, C.-A. Crowdsourcing and Its Application to Transportation Data Collection and Management. Transp. Res. Rec. J. Transp. Res. Board 2014, 2414, 1–8. [Google Scholar] [CrossRef] [Green Version]
- Talari, S.; Shafie-khah, M.; Siano, P.; Loia, V.; Tommasetti, A.; Catalão, J. A Review of Smart Cities Based on the Internet of Things Concept. Energies 2017, 10, 421. [Google Scholar] [CrossRef] [Green Version]
- Miranda, J.; Mäkitalo, N.; Garcia-Alonso, J.; Berrocal, J.; Mikkonen, T.; Canal, C.; Murilloand, J.M. From the internet of things to the internet of people. IEEE Internet Comput. 2015, 19, 40–47. [Google Scholar] [CrossRef]
- Levina, O.; Kranich, L. Mobility and the Internet of People: A Morphological Analysis. In Proceedings of the 2016 Intl IEEE Conferences on Ubiquitous Intelligence & Computing, Advanced and Trusted Computing, Scalable Computing and Communications, Cloud and Big Data Computing, Internet of People, and Smart World Congress (UIC/ATC/ScalCom/CBDCom/IoP/SmartWorld), Toulouse, France, 18–21 July 2016. [Google Scholar]
- Guillén, J.; Miranda, J.; Berrocal, J.; García-Alonso, J.; Murillo, J.M.; Canal, C. People as a Service: A Mobile-centric Model for Providing Collective Sociological Profiles. IEEE Softw. 2014, 31, 48–53. [Google Scholar] [CrossRef] [Green Version]
- Vakali, A.; Moustaka, V. City dynamics tracking based on citizens data and sensing analytics. In Smart Cities in the Post-Algorithmic Era: Integrating Technologies, Platforms and Governance; Komninos, N., Kakderi, C., Eds.; Edward Elgar Publishing: Northampton, MA, USA, 2019. [Google Scholar]
- Estellés-Arolas, E.; González Ladrónâ de Guevara, F. Towards an integrated crowdsourcing definition. J. Inf. Sci. 2012, 38, 1–14. [Google Scholar] [CrossRef] [Green Version]
- Guo, B.; Wang, Z.; Yu, Z.; Wang, Y.; Yen, N.-Y.; Huang, R.; Zhou, X. Mobile crowd sensing and computing: The review of an emerging human-powered sensing paradigm. ACM Comp. Surv. 2015, 48, 1. [Google Scholar] [CrossRef]
- Srivastava, P.; Mostafavi, A. Challenges and Opportunities of Crowdsourcing and Participatory Planning in Developing Infrastructure Systems of Smart Cities. Infrastructures 2018, 3, 51. [Google Scholar] [CrossRef] [Green Version]
- Laubis, K.; Simko, V.; Schuller, A. Crowd sensing of road conditions and its monetary implications on vehicle navigation. In Proceedings of the 2016 Intl IEEE Conferences on Ubiquitous Intelligence & Computing, Advanced and Trusted Computing, Scalable Computing and Communications, Cloud and Big Data Computing, Internet of People, and Smart World Congress (UIC/ATC/ScalCom/CBDCom/IoP/SmartWorld), Toulouse, France, 18–21 July 2016. [Google Scholar]
- Fernandez-Ares, A.; Mora, A.M.; Arenas, M.G.; Garcia-Sanchez, P.; Romero, G.; Rivas, V.; Castillo, P.A.; Merelo, J.J. Studying real traffic and mobility scenarios for a smart city using a new monitoring and tracking system. Future Gener. Comput. Syst. 2017, 76, 163–179. [Google Scholar] [CrossRef]
- Wan, X.; Ghazzai, H.; Massoud, Y. Mobile Crowdsourcing for Intelligent Transportation Systems: Real-Time Navigation in Urban Areas. IEEE Access 2019, 7, 136995–137009. [Google Scholar] [CrossRef]
- Wang, L.; Yang, C.; Yu, Z.; Liu, Y.; Wang, Z.; Guo, B. CrackSense: A CrowdSourcing Based Urban Road Crack Detection System. In Proceedings of the 2019 IEEE SmartWorld, Ubiquitous Intelligence & Computing, Advanced & Trusted Computing, Scalable Computing & Communications, Cloud & Big Data Computing, Internet of People and Smart City Innovation (SmartWorld/SCALCOM/UIC/ATC/CBDCom/IOP/SCI), Leicester, UK, 19–23 August 2019. [Google Scholar]
- Glaeser, E.L.; Kominers, S.D.; Luca, M.; Naik, N. Big Data and Big Cities: The Promises and Limitations of Improved Measures of Urban Life. Econ. Inq. 2018, 56, 1. [Google Scholar] [CrossRef]
- Kong, X.; Liu, X.; Jedari, B.; Li, M.; Wan, L.; Xia, F. Mobile Crowdsourcing in Smart Cities: Technologies, Applications, and Future Challenges. IEEE Internet Things J. 2019, 6, 8095–8113. [Google Scholar] [CrossRef]
- Alizadeh, T. Crowdsourced Smart Cities versus Corporate Smart Cities. IOP Conf. Ser. Earth Environ. Sci. 2018, 158, 012046. [Google Scholar] [CrossRef] [Green Version]
- Thorsby, J.; Stowers, G.N.L.; Wolslegel, K.; Tumbuan, E. Understanding the content and features of open data portals in American cities. Gov. Inf. Q. 2017, 34, 53–61. [Google Scholar] [CrossRef]
- Badidi, E.; Maheswaran, M. Towards a Platform for Urban Data Management, Integration and Processing. In Proceedings of the 3rd International Conference on Internet of Things, Big Data and Security (IoTBDS 2018), Funchal, Portugal, 19–21 March 2018. [Google Scholar]
- City Resilience Index. Inside the CRI: A Reference Guide; Research Report: Measurement Guide; Arup and The Rockefeller Foundation: London, UK, 2016; Volume 6, Available online: www.cityresilienceindex.org (accessed on 4 March 2020).
- Science for Environment Policy, Indicators for Sustainable Cities; In-depth Report 12; Produced for the European Commission DG Environment. Science Communication Unit, UWE: Bristol, UK, 2018. Available online: http://ec.europa.eu/science-environment-policy (accessed on 12 November 2020).
- Petrova-Antonova, D.; Ilieva, S. Smart Cities Evaluation—A Survey of Performance and Sustainability Indicators. In Proceedings of the 44th Euromicro Conference on Software Engineering and Advanced Applications (SEAA), Prague, Czech Republic, 29–31 August 2018. [Google Scholar]
- Figueiredo, L.; Honiden, T.; Schumann, A. Indicators for Resilient Cities; OECD Regional Development Working Papers; OECD Publishing: Paris, France, 2018; Volume 2018/02. [Google Scholar] [CrossRef]
- Ma, Y.; Li, G.; Xie, H.; Zhang, H. City profile: Using smart data to create digital urban spaces. ISPRS Ann. Photogramm. Remote. Sens. Spat. Inf. Sci. 2018, V-4/W7, 75–82. [Google Scholar] [CrossRef] [Green Version]
- URBACT. The Profile of the City. Available online: https://urbact.eu/profile-city (accessed on 2 August 2020).
- Shen, L.; Huang, Z.; Wong, S.W.; Liao, S.; Lou, Y. A holistic evaluation of smart city performance in the context of China. J. Clean. Prod. 2018, 200, 667–679. [Google Scholar] [CrossRef]
- Picioroaga, I.-I.; Eremia, M.; Sanduleac, M. SMART CITY: Definition and Evaluation of Key Performance Indicators. In Proceedings of the 2018 International Conference and Exposition on Electrical and Power Engineering (EPE), Iaşi, Romania, 19–21 October 2018. [Google Scholar]
- Lima, E.G.; Chinelli, C.K.; Guedes, A.L.A.; Vazquez, E.G.; Hammad, A.W.A.; Haddad, A.N.; Soares, C.A.P. Smart and Sustainable Cities: The Main Guidelines of City Statute for Increasing the Intelligence of Brazilian Cities. Sustainability 2020, 12, 1025. [Google Scholar] [CrossRef] [Green Version]
- ISO. ISO and Sustainable Cities. Available online: https://www.iso.org/files/live/sites/isoorg/files/store/en/PUB100423.pdf (accessed on 2 August 2020).
- Chang, H.-T. Green City Vision, Strategy, and Planning. In Green City Planning and Practices in Asian Cities: Sustainable Development and Smart Growth in Urban Environments; Shen, Z., Huang, L., Peng, K., Pai, J., Eds.; Springer International Publishing: Cham, Switzerland, 2018. [Google Scholar]
- International Telecommunications Union (ITU). A Guide to Circular Cities. 2020. Available online: https://www.itu.int/en/myitu/Publications/2020/06/25/16/22/Guide-to-Circular-Cities (accessed on 10 July 2021).
- World Health Organization (WHO). What is a Healthy City? Available online: https://www.euro.who.int/en/health-topics/environment-and-health/urban-health/who-european-healthy-cities-network/what-is-a-healthy-city (accessed on 10 July 2021).
- U.S. National Library of Medicine. What Is DNA? Available online: https://ghr.nlm.nih.gov/primer/basics/dna (accessed on 19 January 2020).
- Merriam-Webster. Organic. Available online: https://www.merriam-webster.com/dictionary/organic (accessed on 15 December 2020).
- CyberBridge. Nucleotides and the Double Helix. Available online: http://cyberbridge.mcb.harvard.edu/dna_1.html (accessed on 19 January 2020).
- Douglas Lenat, B. The nature of heuristics. Artif. Intell. 1982, 19, 2. [Google Scholar]
- Lechler, A. Open Architecture. The International Academy for Production Engineering. In CIRP Encyclopedia of Production Engineering; Laperrière, L., Reinhart, G., Eds.; Springer: Berlin/Heidelberg, Germany, 2014. [Google Scholar]
- IESE. Resilience, a Key Concept for the World’s Smartest Cities. Available online: https://www.ieseinsight.com/doc.aspx?id=2328&ar=15&idi=2&idioma=2_blank (accessed on 4 August 2020).
- The Guardian. Inside Greece’s First Smart City: Now You Don’t Need to Know a Politician to Get Something Done. Available online: https://www.theguardian.com/cities/2018/sep/04/trikala-greece-first-smart-city-dont-need-to-know-a-politician-to-getsomething-done (accessed on 9 September 2020).
- British Standards Institute (BSI). Mapping Smart City Standards: Based on a Data Flow Model. Available online: https://www.bsigroup.com/en-GB/smart-cities/smart-cities-standards-mapping-research-and-modelling/ (accessed on 10 July 2021).
- Pan, Y.; Tian, Y.; Liu, X.; Gu, D.; Hua, G. Urban Big Data and the Development of City Intelligence. Engineering 2016, 2, 171–178. [Google Scholar] [CrossRef] [Green Version]
- EU GDPR Portal. GDPR Key Changes. Available online: https://www.eugdpr.org/theregulation.html (accessed on 4 March 2020).


| A. Indicators for Economy | |||
| ISO Themes | ISO 37120:2018 | ISO 37122:2019 | ISO 37123:2019 |
| Economy | 9 KPIs (5.1–5.9) for:
| 4 KPIs (5.1–5.4) for:
| 7 KPIs (5.1–5.7) for:
|
| Finance | 5 KPIs (9.1–9.5) for:
| 2 KPIs (9.1–9.2) for:
| 7 KPIs (9.1–9.7) for:
|
| B. Indicators for governance | |||
| ISO Themes | ISO 37120:2018 | ISO 37122:2019 | ISO 37123:2019 |
| Governance | 4 KPIs (10.1–10.4) for:
| 4 KPIs (10.1–10.4) for:
| 6 KPIs (10.1–10.6) for:
|
| Urban planning | 5 KPIs (21.1–21.5) for:
| 4 KPIs (21.1–21.4) for:
| 6 KPIs (21.1–21.6) for:
|
| C. Indicators for environment | |||
| ISO Themes | ISO 37120:2018 | ISO 37122:2019 | ISO 37123:2019 |
| Energy | 8 KPIs (7.1–7.8) which for:
| 10 KPIs (7.1–7.10) for:
| 3 KPIs (7.1–7.3) for:
|
| Environment and climate change | 9 KPIs (8.1–8.9) which relate for:
| 3 KPIs (8.1–8.3) for:
| 9 KPIs (8.1–8.9) for:
|
| Solid waste | 10 KPIs (16.1–16.10) for:
| 6 KPIs (16.1–16.6) for:
| 1 KPI (16.1) for active and temporary waste management sites available for debris and rubble |
| Wastewater | 4 KPIs (22.1–22.4) for wastewater management and sanitation | 5 KPIs (22.1–22.5) for:
| (–) |
| D. Indicators for people | |||
| ISO Themes | ISO 37120:2018 | ISO 37122:2019 | ISO 37123:2019 |
| Education | 6 KPIs (6.1–6.6) for:
| 3 KPIs (6.1–6.3) for:
| 4 KPIs (6.1–6.4) for:
|
| E. Indicators for mobility | |||
| ISO Themes | ISO 37120:2018 | ISO 37122:2019 | ISO 37123:2019 |
| Telecommunication | 2 KPIs (18.1–18.2) for Internet and mobile phone connections | 3 KPIs (18.1–18.3) for:
| 1 KPI (18.1) for emergency equipment able to operate reliably during a disaster event |
| Transportation | 8 KPIs (19.1–19.8) for:
| 14 KPIs (19.1–19.14) for:
| 1 KPI (19.1) for available evacuation routes in a city |
| F. Indicators for living | |||
| ISO Themes | ISO 37120:2018 | ISO 37122:2019 | ISO 37123:2019 |
| Health | 6 KPIs (11.1–11.6) for:
| 3 KPIs (11.1–11.3) for:
| 4 KPIs (11.1–11.4) for:
|
| Housing | 5 KPIs (12.1–12.5) for:
| 2 KPIs (12.1–12.2) for smart energy and smart water meters | 6 KPIs (12.1–12.6) for:
|
| Population and social conditions | 4 KPIs (13.1–13.4) for:
| 4 KPIs (13.1–13.4) for:
| 5 KPIs (13.1–13.5) for:
|
| Recreation | 2 KPIs (14.1–14.2) for indoor and outdoor recreation spaces | 1 KPI (14.1) for online booking of public recreation services | (–) |
| Safety | 10 KPIs (15.1 –15.10) for:
| 1 KPI (15.1) for city area covered by digital surveillance cameras | 4 KPIs (15.1–15.4) for:
|
| Sport and culture | 3 KPIs (17.1–17.3) for cultural and sport facilities and cultural events | 4 KPIs (17.1–17.4) for:
| (–) |
| Urban/local agriculture and food security | 4 KPIs (20.1–20.4) for:
| 3 KPIs (20.1–20.3) for:
| 2 KPIs (20.1–20.2) for:
|
| Water | 7 KPIs (23.1–23.7) for:
| 4 KPIs (23.1–23.4) for water quality monitoring and water distribution using smart meters and smart water systems which provide real-time data | 2 KPIs (23.1–23.2) for:
|
| Di Closest to Di, r+ | Di Closest to Di, r− | ciyDNA Helix Sign |
|---|---|---|
| 6/6 | 0/6 | + |
| 5/6 | 1/6 | + |
| 4/6 | 2/6 | <> |
| 3/6 | 3/6 | - |
| 2/6 | 4/6 | - |
| 1/6 | 5/6 | - |
| 0/6 | 6/6 | - |
| SPD of Di from Di, r+ | Level | SPD of Di from Di, r− | Risk |
|---|---|---|---|
| 0–60% | A | 540.01–600+% | A |
| 60.01–120% | B | 480.01–540% | B |
| 120.01–180% | C | 420.01–480% | C |
| 180.01–240% | D | 360.01–420% | D |
| 240.01–300% | E | 300.01–360% | E |
| 300.01–360% | F | 240.01–300% | F |
| 360.01–420% | G | 180.01–240% | G |
| 420.01–480% | H | 120.01–180% | H |
| 480.01–540% | I | 60.01–120% | I |
| 540.01–600+% | J | 0–60% | J |
| State | Category | Bond Types of Pairs of Dimensions | cityDNA Sign + | cityDNA Sign − | Level | Risk |
|---|---|---|---|---|---|---|
| A | ideal | 3 × PS | ✓ | [A-J] | [J-A] | |
| B+ | normal | (2 × PS and 1 × PW) or (1 × PS and 2 × PW) | ✓ | |||
| B- | ✓ | |||||
| B | 3 × PS | ✓ | ||||
| C+ | abnormal | 1 × NW and (2 × PS or 2 × PW or (1 × PS and 1 × PW)) | ✓ | |||
| C- | 1 × NW and (2 × PS or 2 × PW or (1 × PS and 1 × PW)) | ✓ | ||||
| C | 3 × PS or 3 × PW or (2 × PS and 1 × PW) or (1 × PS and 2 × PW) | <> | ||||
| D+ | mutated | 1 × NS and (2 × PS or 2 × PW or (1 × PS and 1 × PW)) | ✓ | |||
| D- | ✓ | |||||
| E+ | (2 × NW and 1 × NS) or (1 × NW and 2 × NS) | ✓ | ||||
| E- | ✓ | |||||
| F+ | 3 × NS or 3 × NW or (2 × NS and 1 × NW) or (1 × NS and 2 × NW) | <> | ||||
| F- | 3 × NS | ✓ | ||||
| City Dimension | KPI | Reference City + | Reference City - | Boston | London | ||
|---|---|---|---|---|---|---|---|
| Previous | Last | Previous | Last | ||||
| Economy | 5.1—Unemployment rate (https://www.statista.com/statistics/381057/unemployment-rate-in-luxembourg/ (accessed on 20 July 2020)) | Luxembourg | Kinshasa | 2.3% [s1] | 2.0% [s1] | 4.3% [s2] | 4.7% [s2] |
| 5.41% | 10.4% | ||||||
| Governance | 10.4—Voter participation in last municipal election (https://worldpopulationreview.com/country-rankings/voter-turnout-by-country (accessed on 20 July 2020)) | Brussels | Santiago | 28.0% [s3] | 16.5% [s4] | 70.1% [s5] | 53.8% [s6] |
| 83.5% | 48.0% | ||||||
| People | 6.2—Percentage of students completing primary education | Praia (https://tradingeconomics.com/cape-verde/net-intake-rate-in-grade-1-male-percent-of-official-school-age-population-wb-data.html (accessed on 20 July 2020)) | Harare (http://mopse.co.zw/sites/default/files/public/downloads/Annual%20Education%20Statistics%20Report%202018.pdf (accessed on 20 July 2020)) | 54.2% [s7] | 76.4% [s7] | 99.9% [s8] | 99.9% [s8] |
| 97.48% | 37.69% | ||||||
| Environment | 23.5—Total water consumption per capita (https://www.statista.com/statistics/263156/water-consumption-in-selected-countries/ (accessed on 20 July 2020)) (liters/day) | Kampala | Buenos Aires | 302 [s9] | 246 [s10] | 154 [s11] | 164 [s12] |
| 24 | 336 | ||||||
| Living | 11.1—Average life expectancy | Bern (https://www.statista.com/statistics/974697/life-expectancy-at-birth-in-switzerland-by-gender/ (accessed on 20 July 2020)) | Mbanane (https://en.wikipedia.org/wiki/List_of_countries_by_life_expectancy (accessed on 20 July 2020)) | 80.2 [s13] | 78.0 [s13] | 82.0 [s14] | 82.6 [s14] |
| 85.7 | 50.9 | ||||||
| Mobility | 18.1—Number of Internet connection per 100,000 population | Oslo (https://www.internetworldstats.com/top25.htm (accessed on 20 July 2020)) | Tegucigalpa (https://en.wikipedia.org/wiki/List_of_countries_by_number_of_Internet_users (accessed on 20 July 2020)) | 93.0% | 95.0% | 91.0% [s15] | 93.0% [s15] |
| 98.4% | 32.3% | ||||||
Publisher’s Note: MDPI stays neutral with regard to jurisdictional claims in published maps and institutional affiliations. |
© 2021 by the authors. Licensee MDPI, Basel, Switzerland. This article is an open access article distributed under the terms and conditions of the Creative Commons Attribution (CC BY) license (https://creativecommons.org/licenses/by/4.0/).
Share and Cite
Moustaka, V.; Maitis, A.; Vakali, A.; Anthopoulos, L.G. Urban Data Dynamics: A Systematic Benchmarking Framework to Integrate Crowdsourcing and Smart Cities’ Standardization. Sustainability 2021, 13, 8553. https://doi.org/10.3390/su13158553
Moustaka V, Maitis A, Vakali A, Anthopoulos LG. Urban Data Dynamics: A Systematic Benchmarking Framework to Integrate Crowdsourcing and Smart Cities’ Standardization. Sustainability. 2021; 13(15):8553. https://doi.org/10.3390/su13158553
Chicago/Turabian StyleMoustaka, Vaia, Antonios Maitis, Athena Vakali, and Leonidas G. Anthopoulos. 2021. "Urban Data Dynamics: A Systematic Benchmarking Framework to Integrate Crowdsourcing and Smart Cities’ Standardization" Sustainability 13, no. 15: 8553. https://doi.org/10.3390/su13158553
APA StyleMoustaka, V., Maitis, A., Vakali, A., & Anthopoulos, L. G. (2021). Urban Data Dynamics: A Systematic Benchmarking Framework to Integrate Crowdsourcing and Smart Cities’ Standardization. Sustainability, 13(15), 8553. https://doi.org/10.3390/su13158553