Abstract
In such drought-prone regions as Kazakhstan, research on regional drought characteristics and their formation conditions is of paramount importance for actions to mitigate drought risks caused by climate change. This paper presents the results of research on the spatio-temporal patterns of atmospheric droughts as one of the most important factors hindering the formation of crop yields. The influence of several potential predictors characterizing teleconnection in the coupled “atmosphere–ocean” system and cosmic-geophysical factors affecting their formation is analyzed. The spatial relationships between atmospheric aridity at the individual stations of the investigated area and the wheat yield in Kazakhstan as well as its relationships with potential predictors were determined using econometric methods. High correlation was shown between wheat yield fluctuations and Multivariate El-Niño–Southern Oscillation (ENSO), galactic cosmic radiation, solar activity, and atmospheric drought expressed through the soil moisture index, which in turn depends on precipitation levels and temperatures. The model could be modified further so that the individual components could be forecasted into the future using various time series in an ARIMA model. The resulting integration of these forecasts would allow the prediction of wheat yields in the future. The obtained results can be used in the process of creating effective mechanisms for adaptation to climate change and droughts based on their early diagnosis.
1. Introduction
There is a strong sense of urgency in dealing with climate change. The latest IPCC report outlines that “Human activities are estimated to have caused approximately 1.0 °C of global warming above preindustrial levels, with a likely range of 0.8 °C to 1.2 °C. Global warming is likely to reach 1.5 °C between 2030 and 2052 if it continues to increase at the current rate” [1]. The United Nations announced 17 Sustainable Development Goals, which include SDG1 ‘No poverty’, SDG2 ‘Zero hunger’, SDG3 ‘Good health and wellbeing’, SDG11 ‘Sustainable cities and communities’, and SDG13 ‘Climate action’, most closely related to climate change and its impacts on food security [2]. Climate change is starting to have a significant impact on ecosystems and food production. The latest IPCC report asserts that “Climate models project robust differences in regional climate characteristics between present-day and global warming of 1.5 °C, and between 1.5 °C and 2 °C. These differences include increases in: mean temperature in most land and ocean regions, hot extremes in most inhabited regions, heavy precipitation in several regions, and the probability of drought and precipitation deficits in some regions” [1]. Anomalies in rainfall, changing seasons, droughts, and heat waves are appearing with increasing frequency, which is also affecting agricultural yields and prices. All the major crops, wheat, rice, coffee, cocoa, maize, sugarcane, tea, and grapes, will likely experience a change in yields as a result of changes in climate. IPCC assesses potential reductions in wheat yields due to climate change in the range of 2% per decade [3]. It is therefore important to identify and address various climatic, economic, and institutional factors and be able to forecast the likely changes to avoid food shortages or price spikes and protect the livelihoods of vulnerable communities. According to IPCC, “Populations at disproportionately higher risk of adverse consequences of global warming of 1.5 °C and beyond include disadvantaged and vulnerable populations, some indigenous peoples, and local communities dependent on agricultural or coastal livelihoods” [1].
Kazakhstan uses 80% of its territory for growing agricultural crops, thereby creating employment for over 7 million people. The production of wheat is one of the key strategically important sectors of Kazakhstan’s economy (70% of total grain production), which largely determines the country’s food security. Agriculture is most vulnerable to climate change, frequent extreme weather events, and water stress. Each additional °C in global temperatures is likely to reduce wheat yields by 6% [1]. Drought is one of the major natural disasters in Kazakhstan and exerts a considerable pressure on the agricultural sector, which is the most vulnerable sector of the economy to drought. As for the irrigated agriculture, glaciers in the mountains are the major storage of water resources and they are extremely sensitive to climate [4,5,6]. Both natural drought and climate change-induced variation in glaciers pose a great threat to the agriculture of Kazakhstan.
At the same time, the anthropogenic impact on the climatic system enters into complex interactions with the natural factors, influenced by the rotational cycling, determining the difficulty in predicting climatic changes. Every factor therefore must be viewed in a framework of diverse interactions with positive and negative feedback loops. The most famous impacts are those determined by atmospheric teleconnection, which leads to significant changes in seasonal precipitation, which, in turn, influences droughts in some regions and floods in others, breaking the regular weather patterns on Earth. The El Niño is defined by FAO as a “naturally occurring phenomenon characterized by the abnormal warming of sea surface temperature in the central and eastern equatorial Pacific Ocean. During El Niño episodes, normal patterns of tropical precipitation and atmospheric circulation are disrupted, triggering extreme climate events around the globe”. The effect of El Niño occurring every two to seven years and lasting up to 18 months could be predicted up to 5 months in advance. If such a teleconnection exists, the extreme consequences of adverse events could be adapted to, building resilience in the agricultural sector.
Accepting the 2030 Sustainable Development Agenda and the Paris Agreement on Climate Change, the international community took responsibility for designing a sustainable future. It should be noted that in order to not only eliminate hunger and poverty by 2030, but also tackle climate change, major structural changes in food production and agricultural systems will be needed all around the world [7].
One of the most important consequences of climatic changes is the increasing frequency of extreme natural events (droughts, floods, hail, heat waves, extreme frosts, etc.), which make a considerable impact on the sustainability of agricultural systems. In order to build a risk management system in relation to these events based on predictions and advance warnings, it is necessary to study in depth the mechanisms of their development, identify the most informative predictors, and build the management system accordingly. Droughts are one of the most significant and dangerous natural events for agriculture in many parts of the world. Due to the complex mechanisms of their occurrence, they are difficult to parameterize and predict [8,9,10].
This paper develops a comprehensive model of climate change impacts on drought and crop yields affecting food security in Kazakhstan, based on consideration of the insufficiently studied teleconnections in the ocean–atmosphere system and several other cosmic and geophysical factors. There is a significant gap in the literature on the climate–water–food nexus in the context of Kazakhstan experiencing growing impacts of climate change, and our paper will provide a new modelling approach allowing the assessment and prediction of impacts of changing climate on wheat yields. The originality of our paper stems from the inclusion of the potential explanatory variables: average monthly temperatures and precipitation levels for the studied region, changes in Total Solar Irradiance, changes in the Wolf index, cosmic rays, soil moisture, North Atlantic Oscillation (NAO), and the Multivariate El Niño–Southern Oscillation Index (MEI). All variables have been included with optimal time lags. The model seeks to explore optimal parameterization of atmospheric drought, and identification of the connection between the standardized moisture index and crop yield fluctuation, as well as analyzing the large-scale atmospheric processes related to drought affecting crop yields in Kazakhstan. The paper is structured as follows: Section 2 presents a detailed literature review of the state-of-the art in climate change impacts on crop yields, Section 3 presents a case study of Kazakhstan in greater depth, Section 4 presents our econometric modeling results, including the simultaneous equations model and the ARIMA forecasting model, Section 5 offers a discussion, and Section 6 concludes.
2. Literature Review
There is considerable literature devoted to the study of factors influencing the development of droughts, early warnings, and their impacts on the yields of various agricultural crops. It has been noticed that climate change has indeed influenced agricultural productivity [11]. Crop prices and vegetable oil prices have also been found to respond to climatic variations [12]. The studies found great geographical variation among the magnitude and the nature of climatic teleconnections.
The first group of studies adopted a global perspective and revealed negative impacts of El Niño for approximately 22–24% of harvested areas in the world, including maize in the USA, China, Indonesia, and Mexico, wheat in the USA, China, Mexico, Australia, and Europe, rice in China, Tanzania, and Myanmar, and soybean in China and India. At the same time, it was found that El Niño makes a favorable impact on 30–36% of harvested areas, including wheat in Argentina, Kazakhstan, and South Africa, rice in China, Brazil, and Indonesia, soybean in Brazil and the USA, and maize in Argentina and Brazil [13]. The global studies identified Sahel, western and southern Africa, Australia and the western USA, South America and central Eurasia as experiencing flood anomalies, especially in La Niña years in western USA and El Niño years in central Eurasia [14]. Researchers have identified Galactic Cosmic Rays (GCR) as having a marked impact on the Earth’s cloud cover and climate variability [15,16].
A significant research cluster focused on the climate impacts for agriculture in Asia, the focus of the present study. Climate change impacts on crop yields in Asia were estimated to fluctuate +/−20% with south and southeast Asian countries more severely affected than east Asian countries [17]. The researchers showed that El Niño–Southern Oscillation (ENSO) had an influence on drought variation over the whole region of central Asia; NAO had significant impact on all the subregions. NAO and the Standardized Evapotranspiration Index (SPEI) were found to demonstrate significant correlations with yields in north Kazakhstan in 1974, 1983, 1992, 1996, 2005, and 2011 [8]. The studies focusing on wheat concluded that wheat productivity in China in 1978–2007 was affected by both climate change and adaptive management. Temperatures were not found to have a significant impact on wheat yield; however, the importance of the negative impact of precipitation as well as positive impacts of irrigation in China have been confirmed [18]. Research focused on wheat and maize identified a strong connection between the ENSO phases and crop yields in China and pointed towards high wheat yield probability distributions for both El Niño and La Niña years [19]. Researchers have found the Standardized Precipitation Index (SPI) and the Reconnaissance Drought Index (RDI) to be more appropriate than the SPEI for the arid regions in China [20]. In the context of India, rice productivity was shown to be correlated with monsoon fluctuations and reduced 4.3–13.8% during moderate and strong El Niño years [21]. Crop yield anomalies in India were revealed to be inversely correlated with Sea Surface Temperature (SST) anomalies from June to August over the Tropical Pacific Ocean (TPO) NINO 3 sector, rice being affected more than wheat with significant economic effects of up to USD 2.2 billion reductions in revenue in warm ENSO periods and up to USD 1.3 billion increases in revenue in the cold ENSO periods [22]. In the context of Pakistan, crop yields have been shown to be statistically correlated with solar radiation and temperatures [23]. At the same time, it was revealed that an increase of 1 °C in mean temperature during the germination and tillering stages is capable of reducing yields by up to 7.4% while a similar increase during the vegetative growth stage improved productivity by up to 6.4% [24]. In a study focused on China, Japan, and Australia, up to 73% of the yield variation was explained by biomass production, which was strongly positively correlated with intercepted radiation [25].
Studies focusing on North America found that monthly values of Pacific North American Pattern (PNA) and ENSO indices could predict summer weather in Canada up to 2–7 months in advance [26]. Crop yields have been shown to be higher in La Niña phases and lower than the trend immediately following La Niña years in south-eastern USA. Corn and tobacco yields as well as bell pepper harvests seem to be significantly affected by ENSO events, which doesn’t apply to tomatoes [27]. ENSO dynamics was found to significantly influence palm oil, soybean oil, sunflower seed oil, and rapeseed oil prices in the USA, where ENSO has been shown to include an auto-regressive nonlinearity [12]. In the context of Brazil, ENSO brings higher probability of increased rainfall in April and May in the Sao Paolo region, which could affect planting dates and yields [28]. Land use and land cover changes (LULCC) have also been found to influence albedo, humidity, precipitation, and temperature in South America [29]. In Africa, crop yields have been shown to correlate with ENSO events with El Niño having a negative impact on millet and a positive impact on maize and sorghum production with an indirect effect on temperature and rainfall during the short planting period in the Sahel [30]. Warm ENSO events in east Africa were found to coincide with drier conditions affecting surface temperatures and the Normalized Difference Vegetation Index (NDVI), while Pacific SST anomalies tend to affect air temperature in east Africa, according to Plisnier et al. [31], ENSO has been shown to be responsible for variations in temperature, wind, and humidity in Zambia, with three rainy seasons corresponding to La Niña, normal, and El Niño conditions [32].
In Europe, orange and tangerine yields have been shown to be strongly correlated with ENSO fluctuations, while wheat, orange, and lemon yields exhibited correlations with NAO index. In Spain, wheat, sunflower, barley, rye, olive, grapes, and tangerines were revealed to have lower yields during La Niña than El Niño phases. Moreover, there is an increasing interest in applying short-term climate forecasts to predict the risk of droughts for vulnerable crops [33]. The mean values of the forecast are based on atmospheric conditions, surface conditions, surface, and the depths of the ocean, which could all influence weather conditions. The Development of a European Multi-model Ensemble System for Seasonal-to-Inter-annual Prediction (DEMETER) is a project which is funded by the European Union and considers seven state-of-the-art general circulation models [34]. In detail, the models show seasonal simulations that cover the same period of 21 years. The state-of-the-art seasonal forecasting systems are presented for both maximum temperature and precipitation for the four seasons in Spain using a multimodel ensemble from the DEMETER project [34].
Atmospheric circulation is one of the determining factors of drought appearance [35]. A number of studies showed that annual variations of meteorological characteristics of the atmosphere in the northern hemisphere and hydrological variables in the ocean are associated with the ENSO and NAO phenomena [36,37,38,39,40,41]. During the El Niño phase, warmer and drier climate conditions are a crucial explanation for the negative impacts of El Niño on the crops, such as wheat in Australia, soybean in India, rice in Indonesia, and maize in Zimbabwe and Brazil [13,21,27,28]. To better assess drought in a warming climate [42] investigated the drought characteristics across different aridity zones with and without consideration of potential evapotranspiration (PET).
Numerous attempts have been made to find the ENSO response in the Atlantic–Eurasian sector [8,39,43]. El Niño contributes to a change in the localization and intensity of north Atlantic and Mediterranean storm tracks by changing the global midlatitude equator–pole temperature gradient during the ENSO period (Mokhov et al., 1995) [44]. A significant influence of ENSO on the NAO was detected in [43,45].
The influence of ENSO on air temperature over the Eurasian continent was explored by Kryjov and Park (2007) [46]. The influence works through the so-called annular mode of the northern hemisphere, an alternation of periods of an intense circumpolar vortex in the lower stratosphere and corresponding western transport in the upper troposphere to the north of 45° N. and the periods of weakening of the circumpolar vortex and the western transport. Positive air temperature anomalies are noted over all temperate and circumpolar latitudes of Eurasia in the first case, with negative temperatures observed otherwise. Significant connections appear in the second half of the 20th and beginning of the 21st centuries, whereas the analysis of longer time series (100 years and more) did not show such interactions between processes in the equatorial Pacific Ocean and the North Atlantic [25].
In the spring–summer period of El Niño (La Niña) year, the atmospheric circulation in the north Atlantic is weakening (intensifying). This contributes to the formation of positive (negative) anomalies in the SST. In spring, the biggest differences in SST in the El Niño and La Niña years are observed off the coast of Africa (5–15° N, 15–30° W), and in summer—east of Newfoundland (45–55° N, 35–45° W).
Nesterov [47] shows that the El Niño–Southern Oscillation phenomenon has the greatest impact on atmospheric circulation in the Atlantic–European region in winter, coinciding with the phase of maximum development of the phenomenon, still having an effect next winter. In the first winter of the El Niño (La Niña) period, a positive (negative) phase of the east Atlantic is energized. Next winter—a positive (negative) phase of the north Atlantic oscillation takes place. The negative phase of both oscillations is more clearly expressed on composite maps of geopotential and surface pressure. The La Niña year is characterized by more variability of the indices of the main fluctuations in the atmospheric circulation in the Atlantic–European region.
The North Atlantic Oscillation (NAO) index peaked in the early 1990s, and has been dropping steadily to the present. The NAO index exhibits a 60–70-year cycle and demonstrates a significant positive correlation with TS in the northern hemisphere [41]. Periods with positive NAO indices are characterized by intense western transport of air masses and notable warming of the most part of extra-tropical latitudes of the northern hemisphere, especially strong in the winter–spring season. NAO has been considered to be one of the possible factors of climatic change; numerous studies are devoted to the effect of NAO on weather and climate in Europe, and the links between the NAO and the state of the stratospheric polar vortex. Currently, there is widespread understanding of how El Niño–Southern Oscillation events play a crucial role in determining agricultural production. Furthermore, problems arising from variability of water availability and soil degradation are currently major challenges to agriculture globally. These problems are likely to be exacerbated in the future if global climate change reaches 1.5 °C and 2.0 °C [1].
The key publications showing the results of relevant empirical research on climate change impacts on agriculture in different global regions and specific countries are presented and analyzed in Table 1, explaining the research focus, key methods, variables, and research conclusions.

Table 1.
Comparative analysis of literature on the climatic effects on crop production.
3. Case Study
Kazakhstan, a vast country of 2.7 million km2, is almost equidistantly positioned between the Atlantic, Pacific, and Indian Oceans at the center of the Eurasian continent, which determines its continental climate. The territory of Kazakhstan is represented by four climatic zones: deserts (44%), semideserts (14%), steppe (26%), and forest-steppe (6%), and is vulnerable to climatic change.
The geography of central Asia is complex and consists of high mountains including the Tianshan and Karakoram ranges, low endorheic basins including the Tarim Basin, vast deserts including the Gobi, Kara Kum, Kyzyl Kum, and Taklimakan, and treeless grasslands in the northern part of Kazakhstan. The elevation ranges from less than −130 m in the Turpan Depression and the Karagiye Depression to over 7500 m in the Pamir and the Karakoram mountains. Due to the inland position and remoteness from oceans, central Asia is characterized by a semiarid and arid climate with low relative humidity and persistent soil moisture deficit making this region one of the most arid in the world.
As a result of climate change and human activities, central Asia is experiencing an increasingly severe deficit of water resources with increasing temperature and variable precipitation pattern [8]. Lands of Kazakhstan are featuring a variety of soils: a large part of the forest-steppe zone is occupied by chernozem (black earth), dark brown, light brown, and brown soils can be found to the south of this area. Desert and semidesert soils are represented in the form of sierozem (gray-brownish soil).
According to the [48], most of the territory of Kazakhstan is exposed to droughts of varying intensity. Scarcity and uneven distribution of water resources is amplifying the problem of droughts and leading to the emergence of sands over 30 million ha and saline land over 127 million ha.
The disturbance in the seasonal characteristics of soil formation under the effect of drought creates favorable conditions for land degradation. The weak formation of the land cover and vegetation also leads to desertification. These natural features of Kazakhstan are a cause for poor resilience of the environment to human pressures (it is estimated that about 75% of the country is under an increased risk of ecological destabilization). The analysis of the impact of adverse meteorological phenomena on agricultural crop yields showed that the share of atmospheric and soil drought is about 80%, heavy rain and hail—14%, frosts—2%, and severe frosts and strong winds—1% each [54,55].
The occurrence of drought in Kazakhstan is due to the specifics of the general circulation of the atmosphere. Drought sets almost across the entire territory of Kazakhstan, when the anticyclones of the Azores origin move from east to west, creating a band of high pressure covering the whole territory of the republic [56]. Geographic distribution of atmospheric droughts is demonstrated during invasion of arctic air from the north or from the northwest (from the water area of the Barents and Kara Seas) and the formation of a powerful anticyclone. If the Arctic air arrives from the Kara Sea to western Siberia, a stationary anticyclone is formed over central and eastern Kazakhstan. Consequently, an atmospheric drought is observed in the east of Kazakhstan. Western parts of the country at this time are exposed to cyclones. If the Arctic air invades from the Barents Sea in the western part of Russia, the center of a stationary anticyclone is located over the Urals. Accordingly, drought is observed in the west of the country. Particularly dangerous are blocking processes in the atmosphere. Due to the large area of Kazakhstan, the distribution of droughts on its territory and their intensity has considerable variation.
All three types of droughts occur in Kazakhstan: atmospheric, soil and atmospheric-soil, or general droughts. The latter represents the greatest threat to agricultural crops. The main feature of atmospheric drought is considered to be a stable anticyclone weather with long dry periods, high temperatures, and considerable air aridity. Soil drought occurs as a consequence of atmospheric drought, when deposits of soil moisture decrease rapidly during increased evaporation and become insufficient for the normal growth and development of plants.
Atmospheric-soil drought is a combination of conditions that characterize atmospheric and soil drought. They are divided into strong, medium, and weak in terms of intensity and area coverage. In terms of time of occurrence, droughts are separated into spring, summer, autumn, and winter [57]. Spring drought is characterized by low temperatures and low air humidity, low deposits of yielding moisture in the soil, and dry winds. Summer drought is usually distinguished by high fever and hot dry winds causing increased evaporation of water from soil and intensive transpiration of plants. Autumn drought is characterized by low temperatures and low deposits of yielding moisture in the root soil horizons. Winter drought occurs amid snow cover with a lack of moisture in the root soil horizons and at temperatures above 0 °C, when transpiration of some plants, especially winter crops, is resumed aggravated by sun and windy weather.
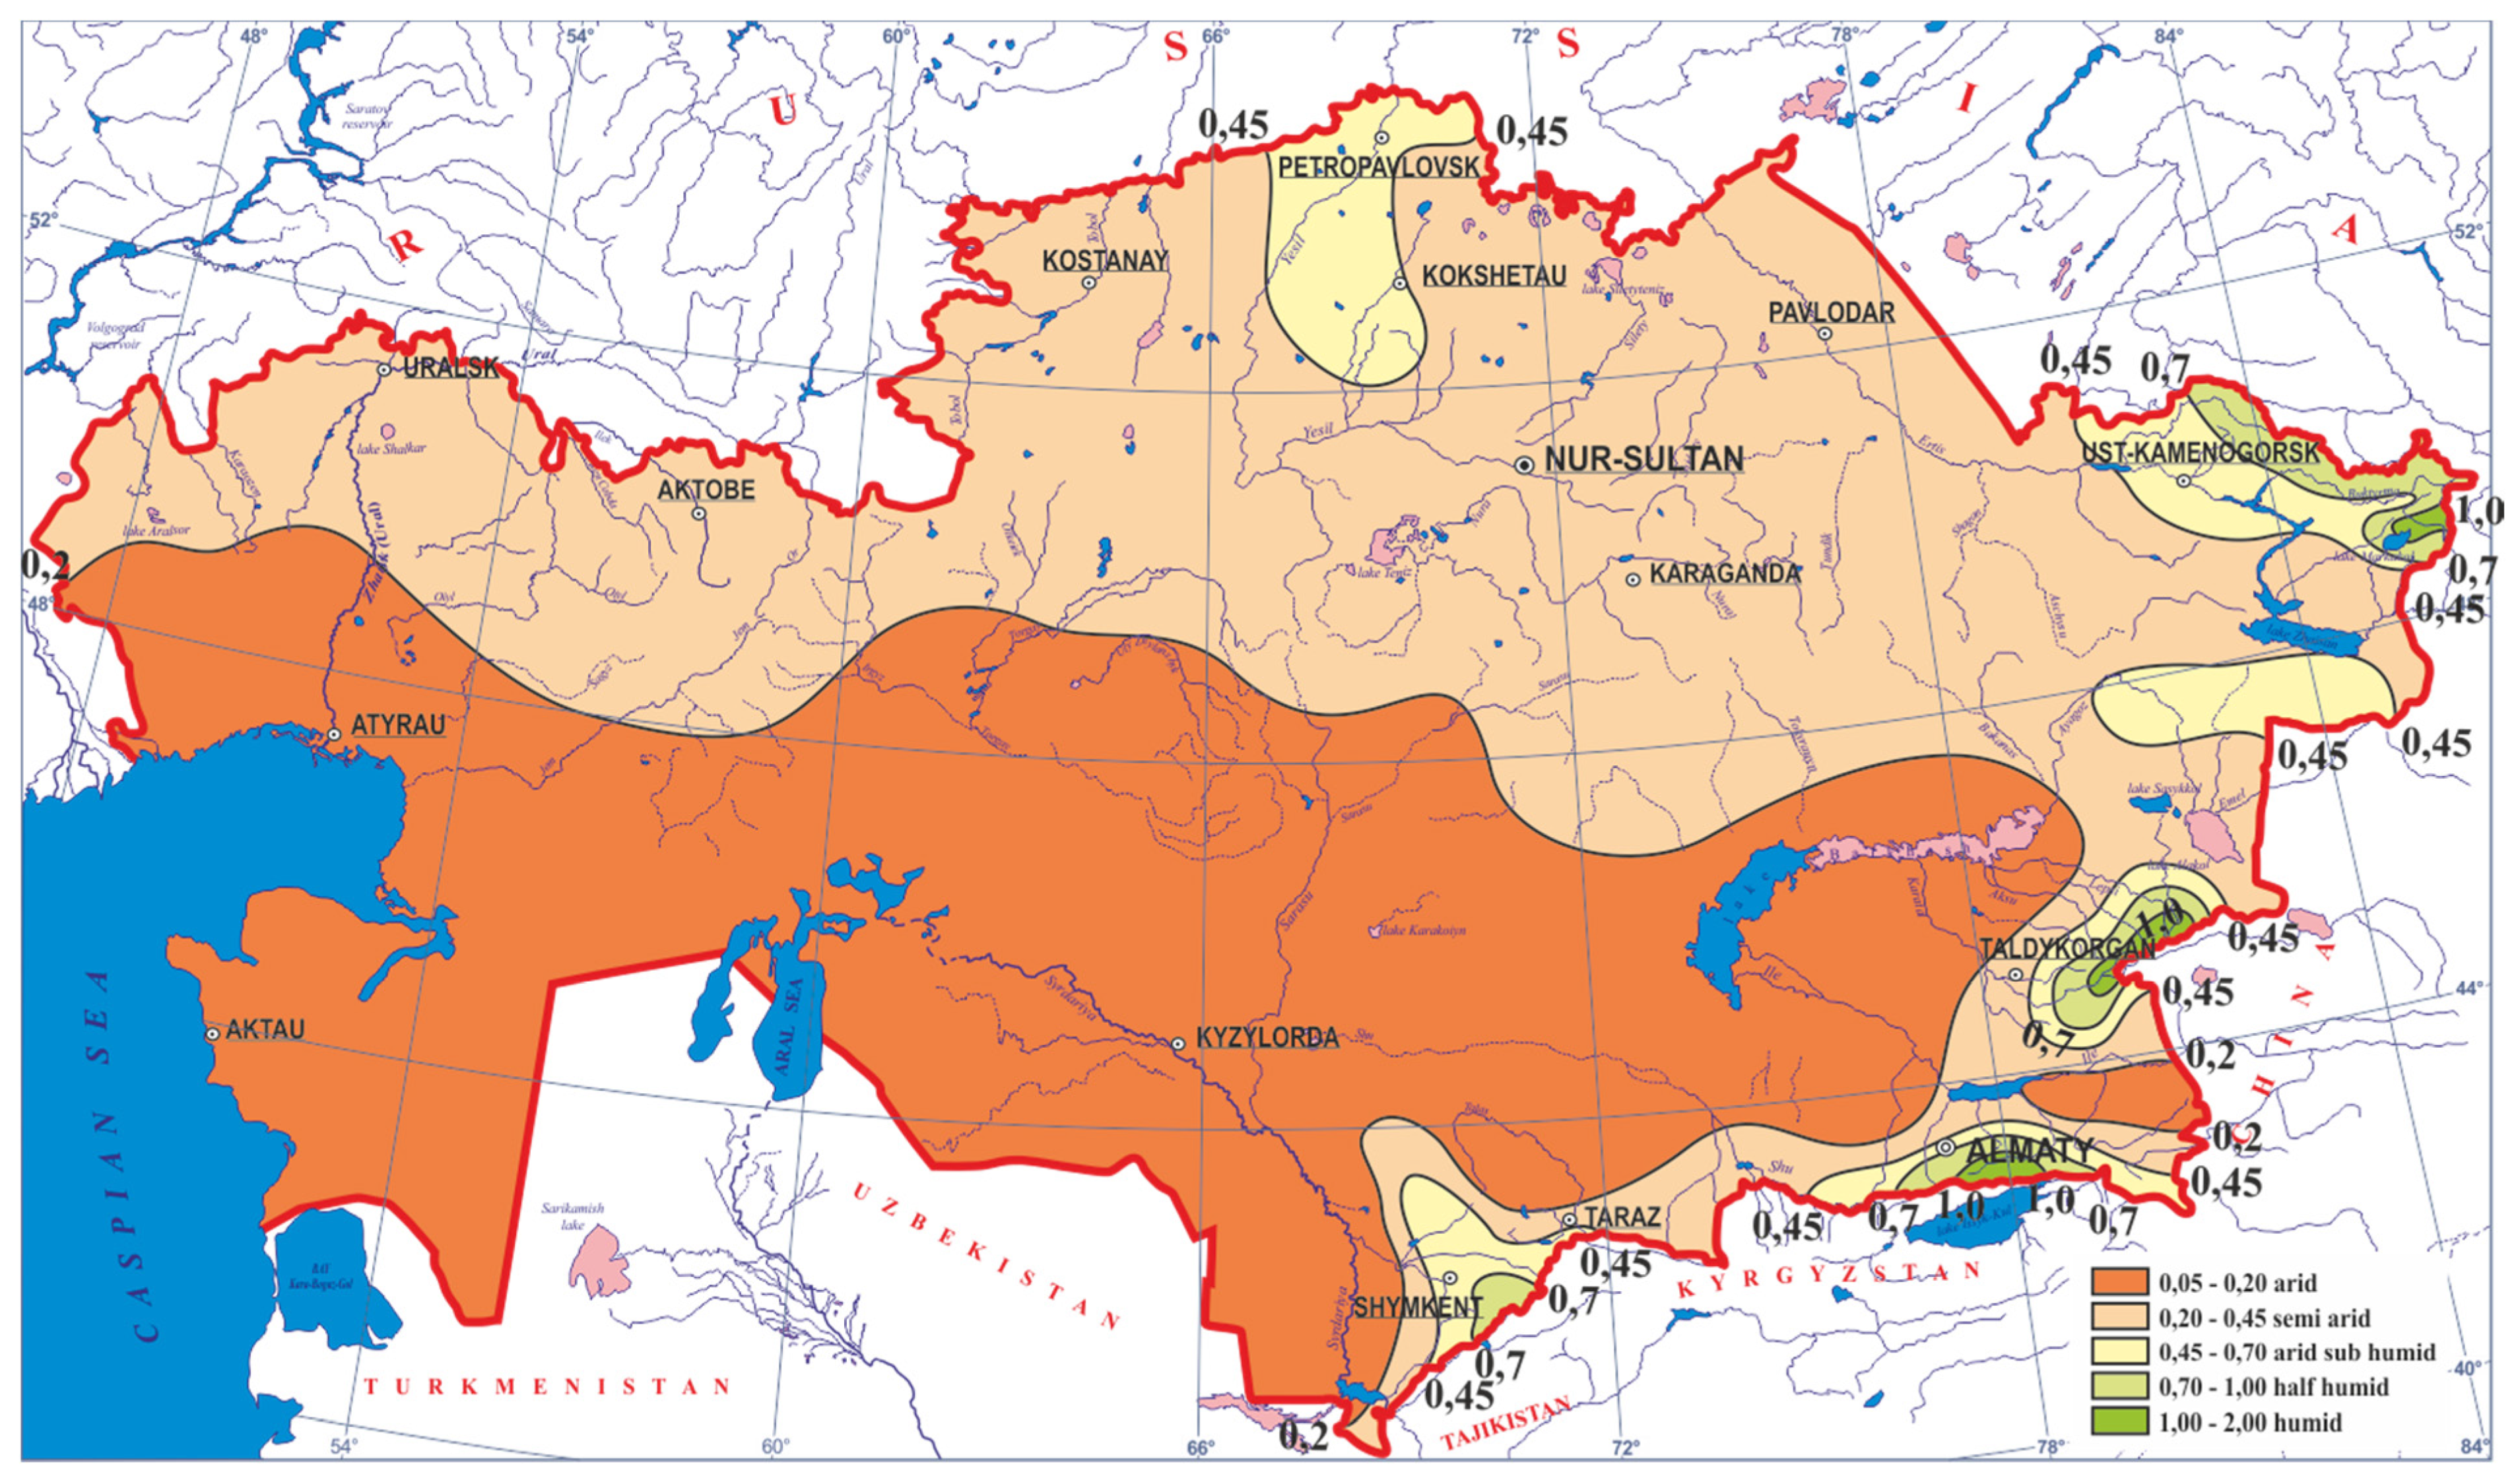
Figure 1 shows the calculated standardized moisture index (Kσ), which indicates the distribution of moisture zones in Kazakhstan.
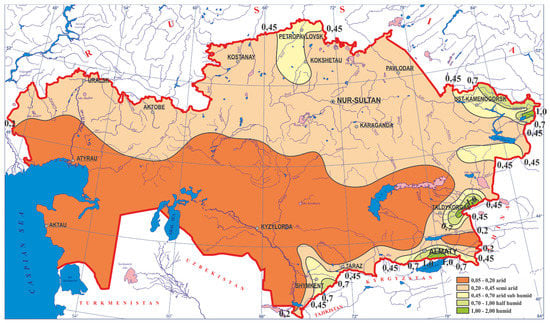
Figure 1.
Spatial distribution of standardized moisture index (Kσ) in Kazakhstan.
About 94% of the territory lies in the following zones: hyperarid zone extends to the southern half of Kazakhstan, covering Atyrau, Mangystau, southern half of Aktobe, Zhambyl, Karaganda, and Almaty regions; arid zone extends along the northern part of Kazakhstan, as well as a narrow band in the southeast; semiarid zone is situated in the flat area of the north Kazakhstan and Akmola region, on the territory of the Tarbagatay mountain range, in low and middle mountain areas of the East Kazakhstan, South Kazakhstan, Almaty, and Zhambyl regions. Subhumid and humid zones have the essentially high elevations of the Tianshan Mountains. Combating desertification, therefore, presents an important challenge for Kazakhstan [58].
Especially strong droughts in Kazakhstan tend to arise in the negative phase of the MEI. Catastrophic droughts were observed in the Kostanay region in 1975, 1983, 1991, 1995, 1998, and 2004, coinciding with strong MEI and El Niño phases. A significant number of drought cases in the area are associated with positive NAO index values.
4. Methodology
The main purpose of the present study was to identify reliable predictors for wheat yields in Kazakhstan. To achieve this, we used an econometric model developed by the lead author at Environment Europe in Oxford using OxMetrics software. In modelling the dynamics of wheat yield in the Kostanay region of Kazakhstan we employed the cointegration and error-correction methodology, where explanation of the long-run changes is combined with short-term dynamics. To find adequate predictors that have a significant impact on drought formation and crop yield in Kazakhstan we analyzed the role of changes in soil moisture resulting from precipitation and temperature dynamics, cosmic radiation, and solar activity. First, an attempt was made to find a significant signal of the influence of the ENSO phenomenon in the formation of the weather regime in the northern regions of Kazakhstan.
The data for this research comes from the National Oceanic and Atmospheric Administration, the Ministry of Education and Research of the Republic of Kazakhstan, the Ministry of Agriculture of the Republic of Kazakhstan, Kazhydromet, Novosibirsk Neutron Monitor, NASA, and other sources.
The research shows that interannual climate variability in Kazakhstan is affected by several factors: El Niño and North Atlantic Oscillation (ENSO/NAO), Solar Irradiance (SI), and Galactic Cosmic Rays (GCR) [8,16,59].
In this paper we have chosen the Multivariate ENSO Index (MEI) based on the six main observed variables: sea level pressure (SLP), sea surface temperature (SST), zonal and the outgoing long wave radiation over the Tropical Pacific basin sky [60,61].
To study drought in Kazakhstan in this article we used the soil moisture index (K), which shows the ratio of annual precipitation to annual evaporation:
R—sum of precipitation for the year, mm; —evaporation for the year, mm.
If the value of K > 1, then there is an excess of moisture, K < 1 indicates a drought.
To assess the severity of droughts we used the standardized moisture index (Kσ), calculated as the ratio of the anomaly to the standard deviation of K:
Ki—soil moisture index K in i-year; —average value of moisture index for the period from 1971 to 2011; σ—standard deviation of the soil moisture index.
The results obtained correspond to the conclusions of [20] who showed that both drought and aridity indicate an imbalance in water availability. While drought is a natural temporal hazard, aridity is a constant climatic feature.
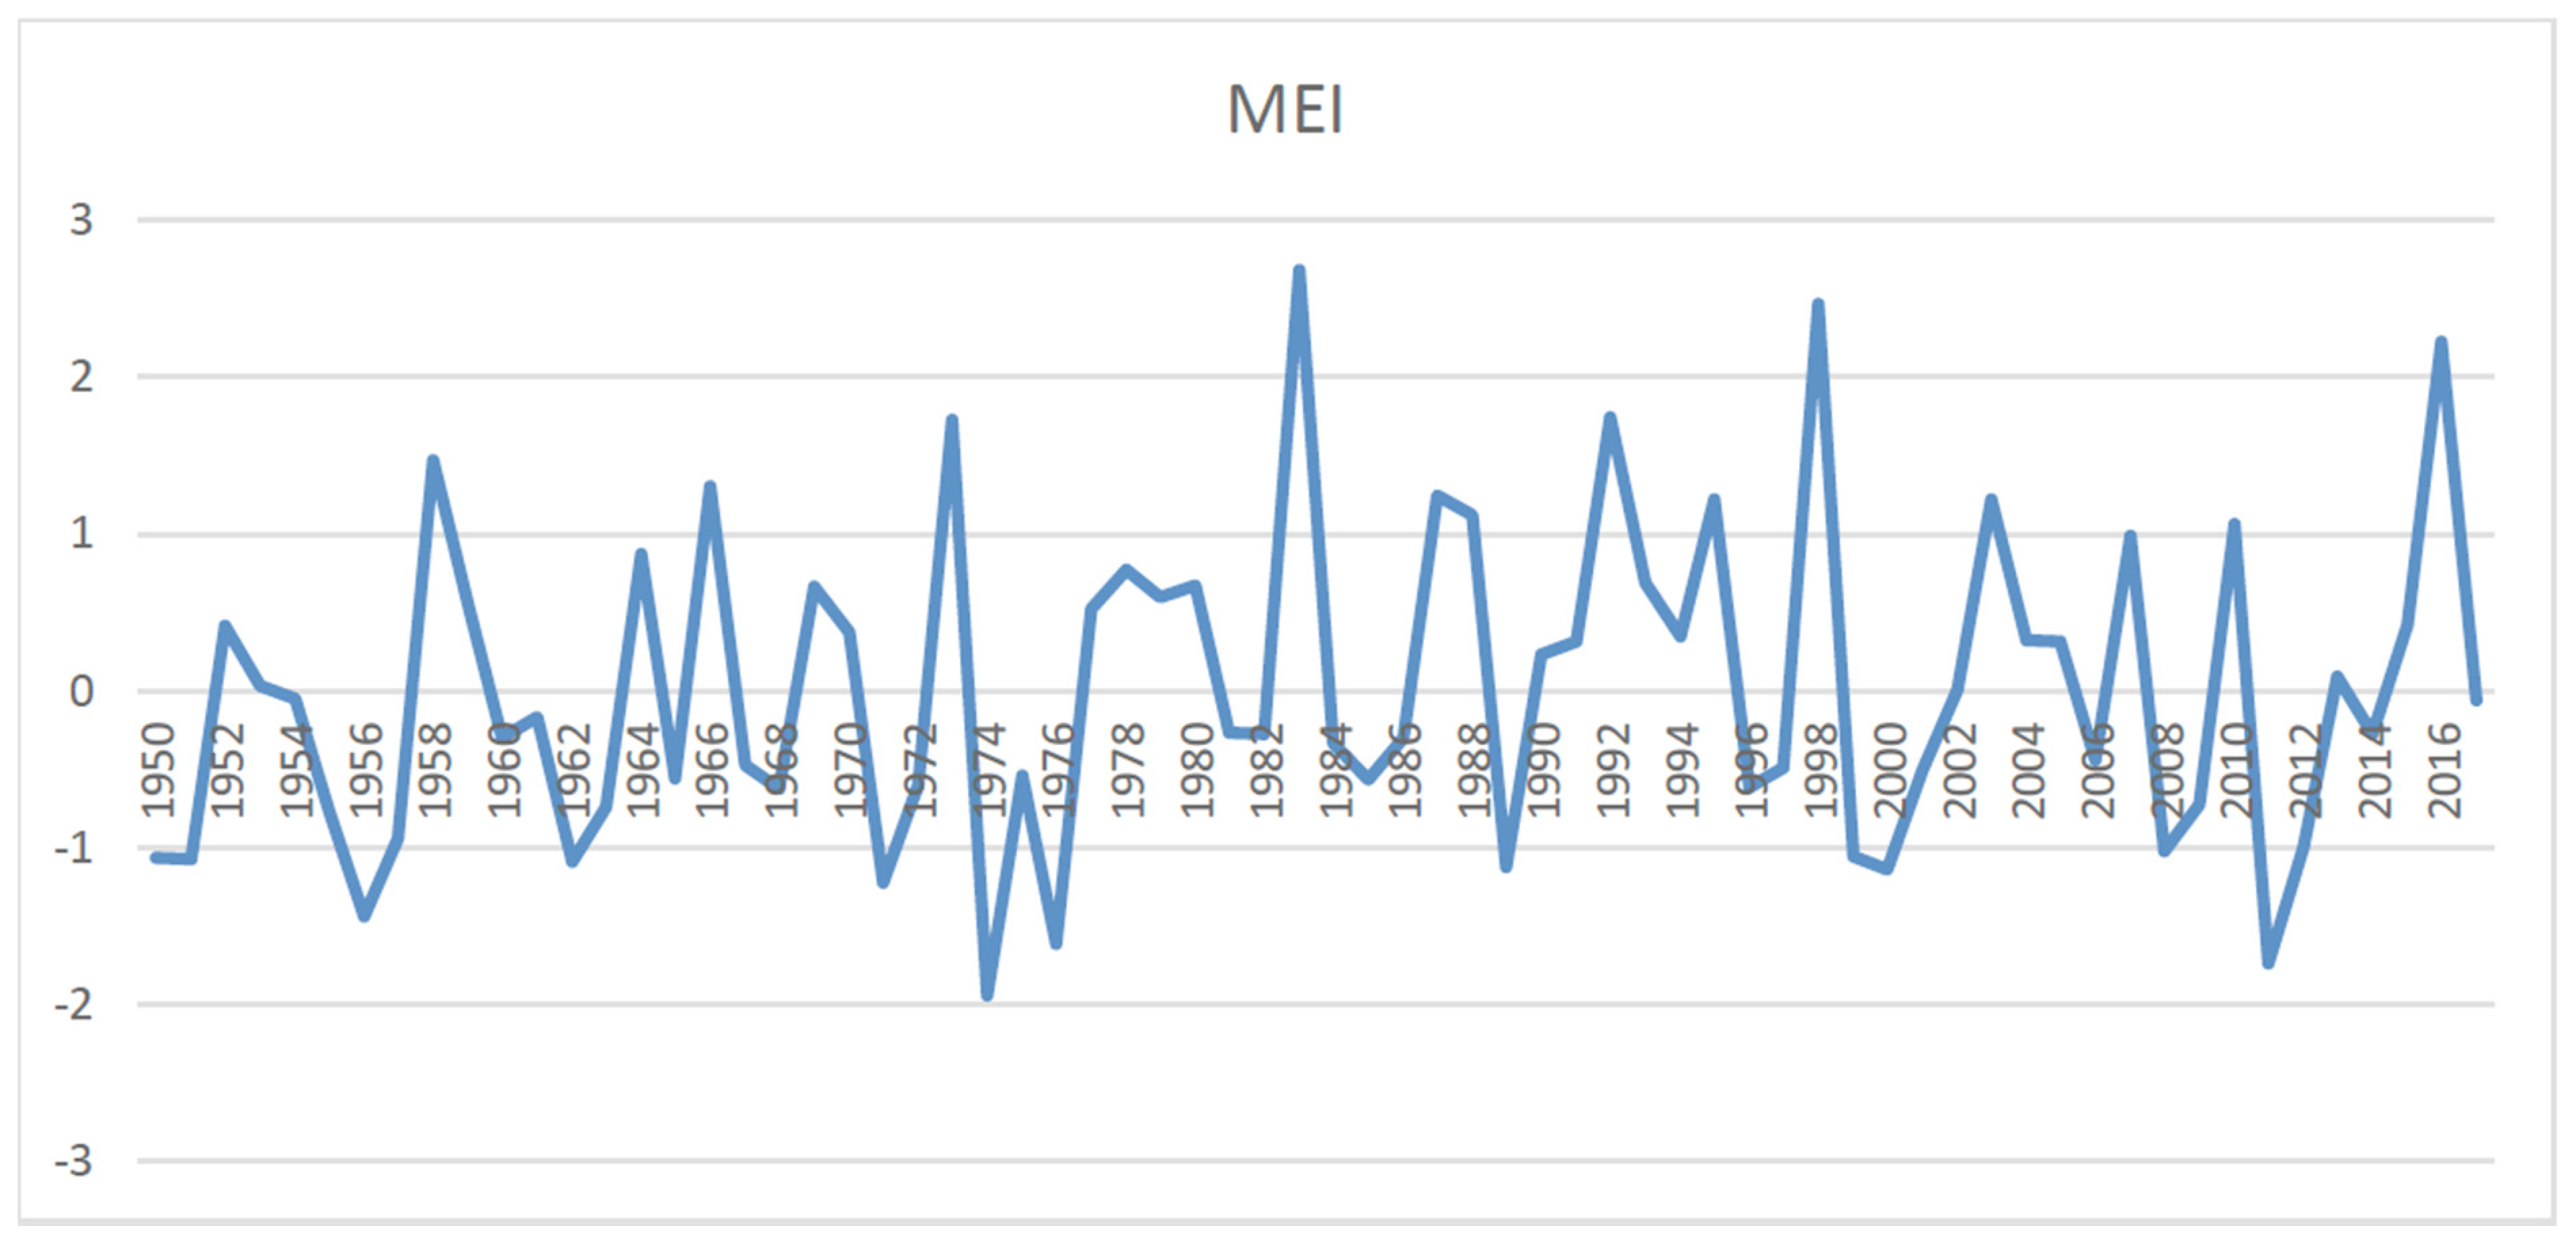
Figure 2 shows ENSO MEI series from 1950 to 2017. During our study period between 1971 to 2011, MEI is characterized by considerable variability in time and predominance of negative values is observed in the last few decades, which means the warm phase of ENSO. Strong El Niño occurred in 1982–1983, 1991–1993, 1997–1998, and 2010. During these years, the value Kσ was below 0 and the Kostanay region of Kazakhstan observed droughts of varying intensity.
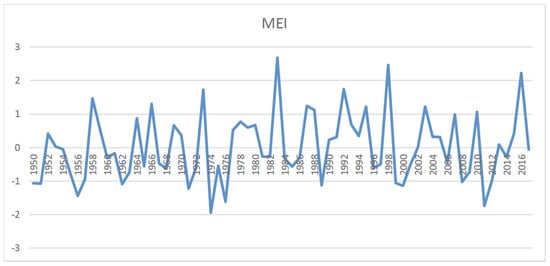
Figure 2.
Multivariate El-Niño–Southern Oscillation Index, 1950–2017.
The amount of cloud cover and the intensity of Galactic Cosmic Rays (GCR) registered on the surface of the Earth were shown to be statistically correlated as demonstrated by satellite data [15,16]. Marsch and Svensmark [62] revealed that the interannual variability of ISCCP-D2 low-cloud properties observed in 1983–1994 was highly statistically correlated to both Galactic Cosmic Rays and El Niño–Southern Oscillation. It was shown as early as 1962 that cosmic radiation is likely to have an impact on plant growth [63]. This has been proven with recent data in a study focusing on tree growth in Britain [64]. The physics of Galactic Cosmic Rays—cloud cover interdependence can be explained as follows: at the height of 10–15 km from the Earth’s surface, the altitude of the tropopause separating the troposphere and the stratosphere, the Galactic Cosmic Rays reach the top of the clouds and lose a significant portion of their energy. Ref. [62] found that during two 11-year solar activity cycles, the correlation coefficient between the variations of the Galactic Cosmic Rays’ fluxes and the cloud cover on Earth was extremely high.
Based on the research outlined in the literature review, combining variables that are rarely found together, we have built a complex of econometric models, covering time series data between 1971 and 2009. Our approach comprised a simultaneous equations model of wheat yield and soil moisture in Kazakhstan as functions of a range of climatic and astronomical variables as well as the forecasting model capable of predicting likely changes in wheat yield into the future. The next section will deal with our econometric modeling experiments in greater depth.
5. Modelling Results
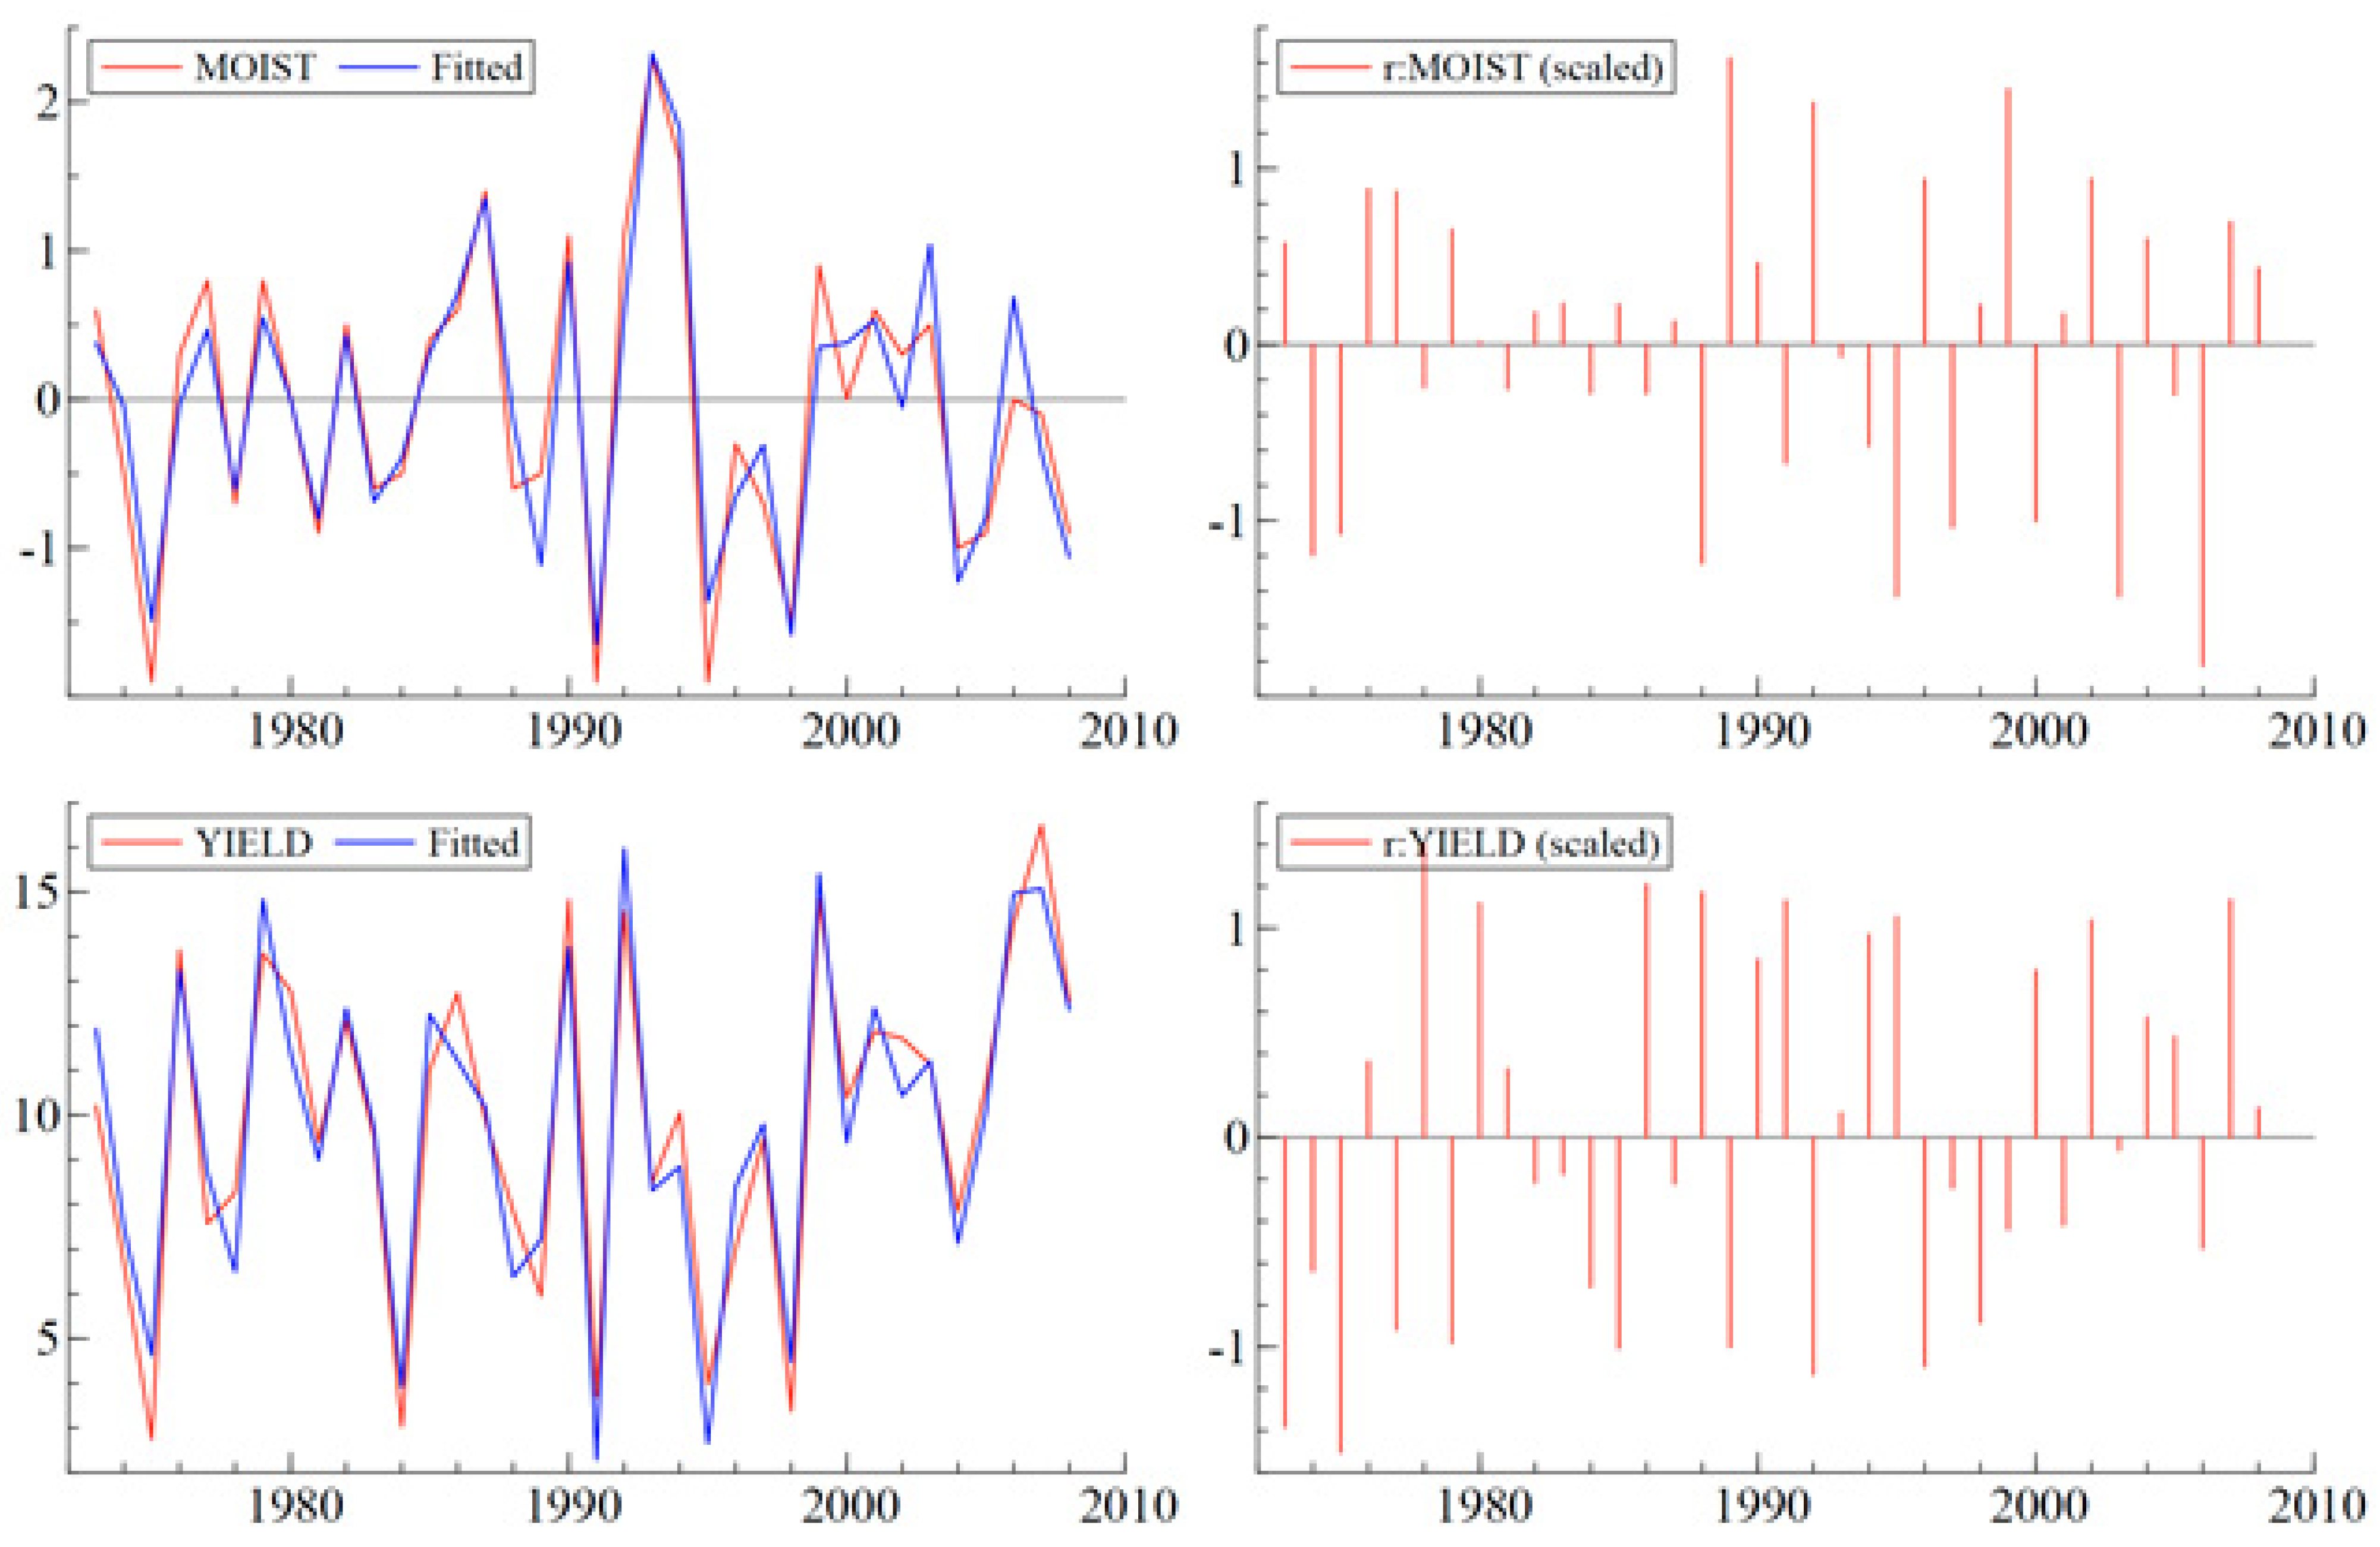
One of our hypotheses in this study was that soil moisture is affecting agricultural productivity under climatic change. Analysis showed that sufficiently good coherence was observed between temporal dependence of standardized moisture index and crop yield fluctuation, i.e., high values of Kσ corresponded to high yield values, and negative values to low-yielding years. These results are in agreement with the Second National Report of Climate Changes of the Republic of Kazakhstan [4]. We were able to model soil moisture based on the precipitation and temperature variables.
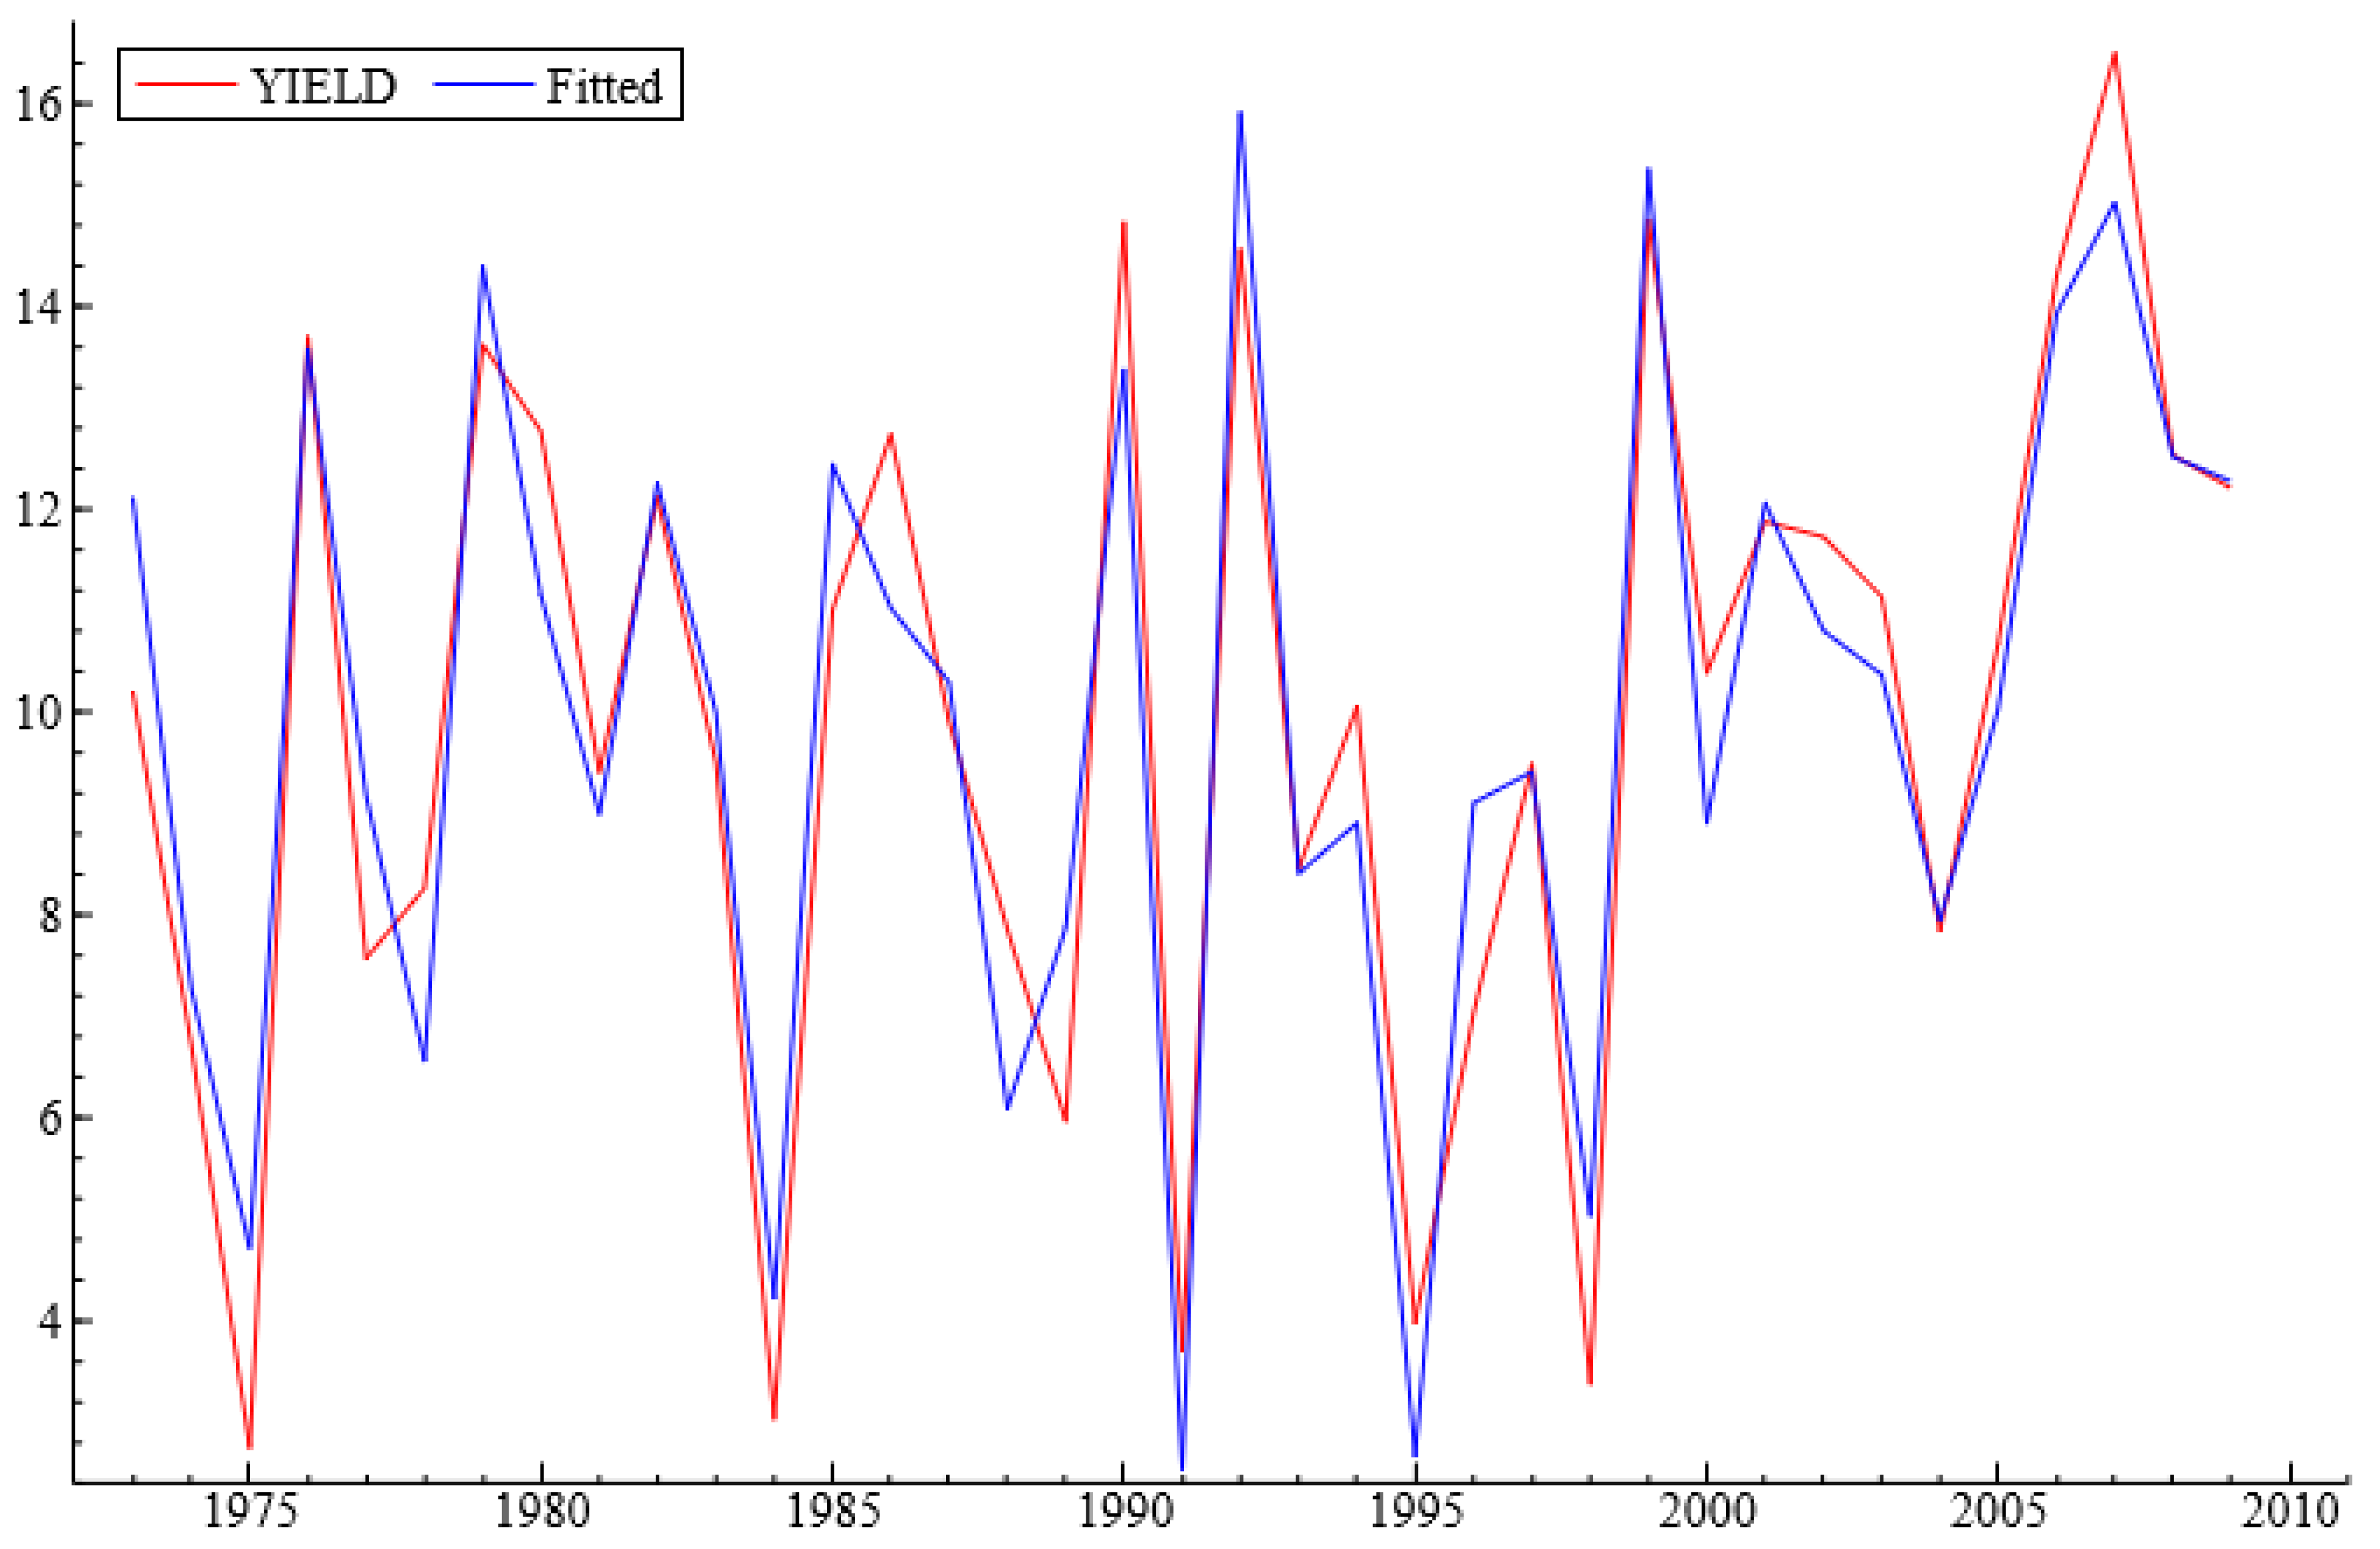
The second hypothesis that we tested was that a combination of El-Niño-related variables, characteristics of the solar activity, and cosmic radiation coupled with soil moisture will be enough to explain the variations in wheat yields. First, we estimated the short-run difference model of wheat yields. We then modelled the wheat yields dynamics in levels and combined the short-term and long-term elements in the yield model to arrive at a final equation. The fitted values and the data for wheat yields in Kazakhstan are presented in Figure 3.
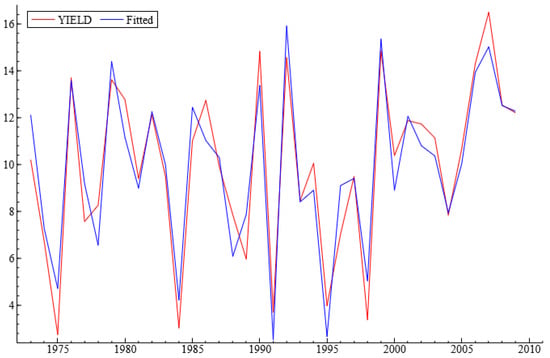
Figure 3.
The final econometric model of wheat yield dynamics in the Kostanay region, Kazakhstan. The estimation sample is: 1973–2009. Red line—original wheat yield data. Blue line—modelled data. Source: author calculations.
The model coefficients can be seen in Table 2.

Table 2.
Econometric model of wheat yield dynamics in the Kostanay region, Kazakhstan.
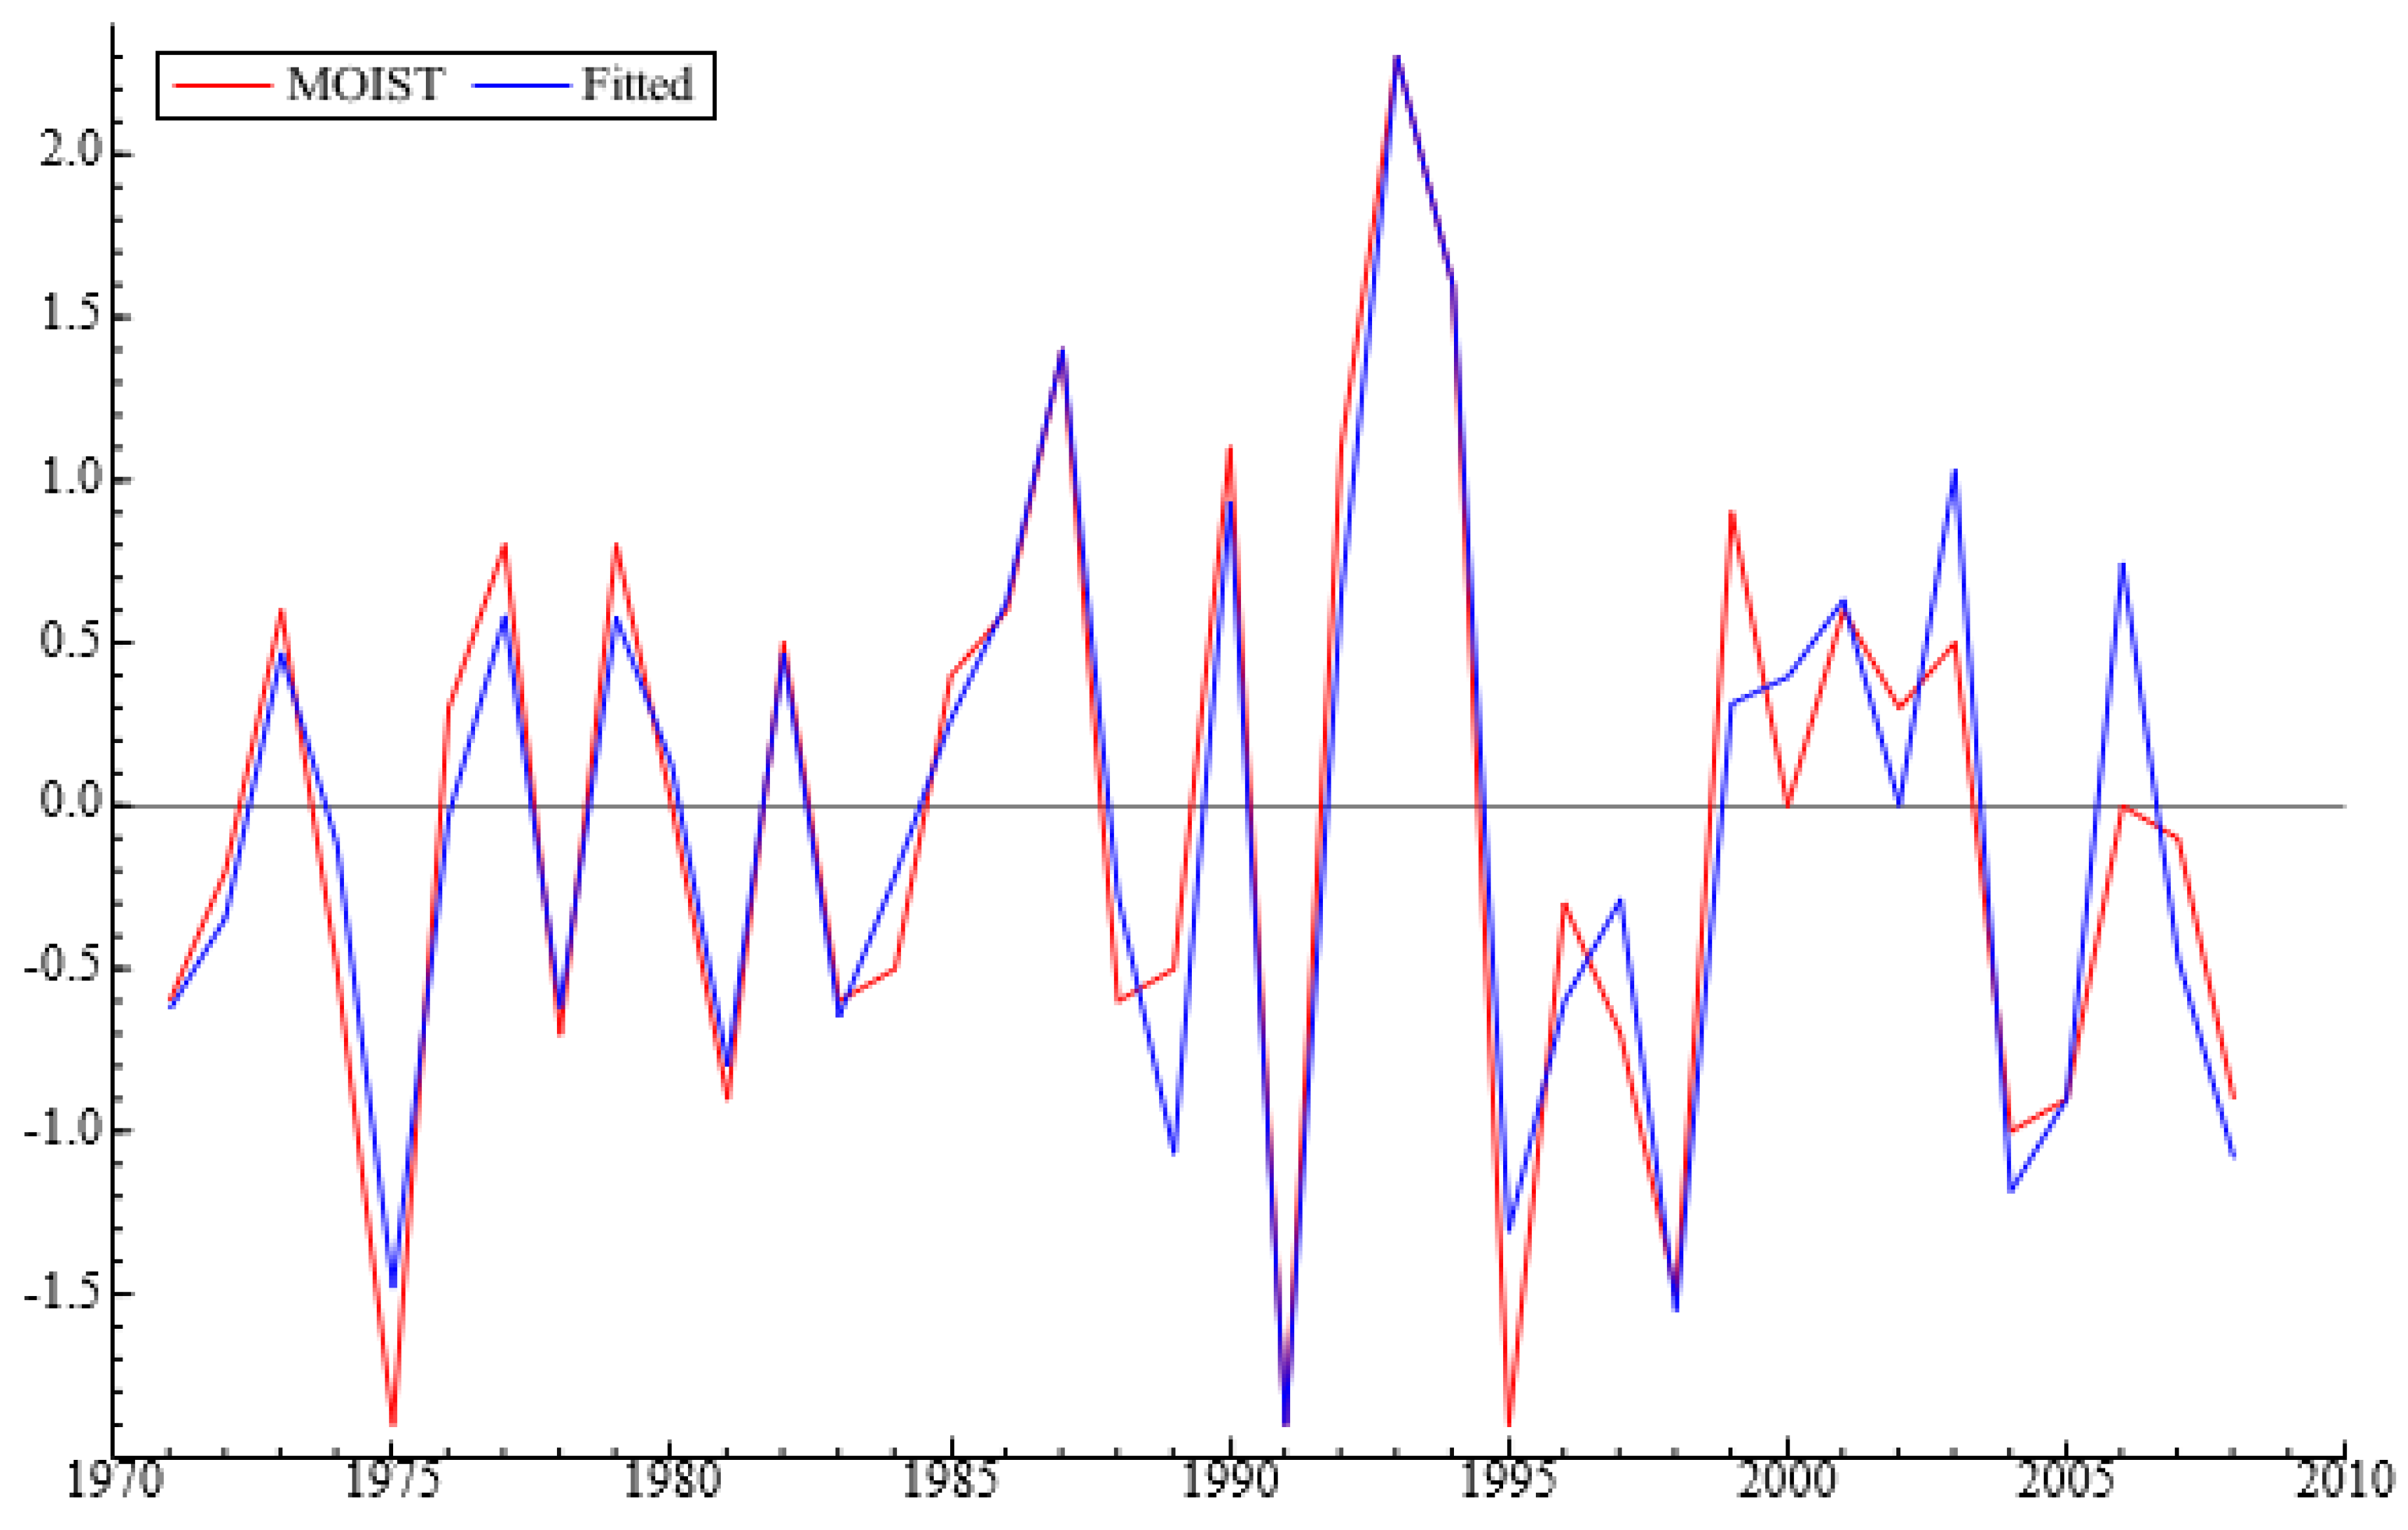
At the same time, we modeled soil moisture separately in an additional equation based on the connections with precipitation and temperatures. Figure 4 presents the performance of our model for soil moisture. It is interesting to note the years that came up as significant outliers in the model equation: 1987, 1991, 1993, 1994, and 2005. During the years of 1987 and 1991 moderate El Niño events were observed; 1994 and 2005 were the years of weak El Niño.
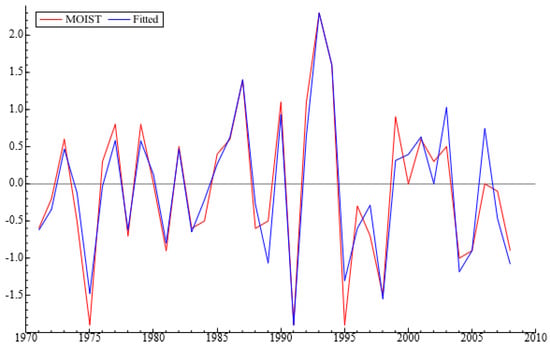
Figure 4.
Econometric model of soil moisture dynamics in the Kostanay region, Kazakhstan. The estimation sample is: 1971–2008. Red line—original soil moisture data. Blue line—modelled data. Source: author calculations.
It is shown in Table 3 that soil moisture depends on precipitation in June, July, August, and October and temperatures in July.

Table 3.
Econometric model of soil moisture dynamics in the Kostanay region, Kazakhstan.
Finally, we obtained a resulting two-equation model (Table 4 and Table 5) capable of explaining the dynamic of wheat yields and the soil moisture in response to changes in climatic variables.

Table 4.
Simultaneous equation for soil moisture.

Table 5.
Simultaneous equation for wheat yield.
The final two-equation model (Figure 5) is composed of the two interrelated equations for soil moisture and wheat yield changing over time. The first equation explains variation in soil moisture through precipitation in June, July, August, and October (moisture tends to increase with higher precipitation levels), July average temperatures (moisture tends to decrease with higher temperatures), strong positive impacts in 1987 (moderate El Niño), 1993 (weak El Niño), and 1994 (moderate El Niño), and negative impacts in 1991 (strong El Niño year) and 2005 (weak El Niño year). All variables in this equation are statistically significant at levels below 1% and only two variables, I1991 and I2005, are significant at 5%.
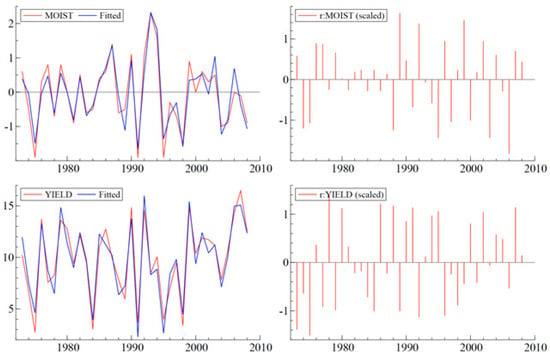
Figure 5.
Final two-equation model of wheat yield. Source: author calculations.
The second equation explains variation in wheat yields through a range of variables: there is an acceleration effect of a change in yield (with a positive coefficient), change in average June temperatures (yields tend to be lower with higher June temperatures), and change in total solar irradiance in the previous year (yields tend to be lower the greater the change); change in the Wolf number of the previous year (higher number of sunspots tends to increase yields); December amount of cosmic rays hitting the Earth (the higher the amount of cosmic rays hitting the Earth, the higher the yields); MEI in June of the previous year (yields tend to be lower if El Niño was observed in June of the previous year and higher if La Niña was observed in the same period), soil moisture (higher moisture in the soil tends to produce higher yields), and an error-correction term. It should be added that most variables are statistically significant at a level lower than 1% with one exception of the change in June temperatures, where it is significant at 5%.
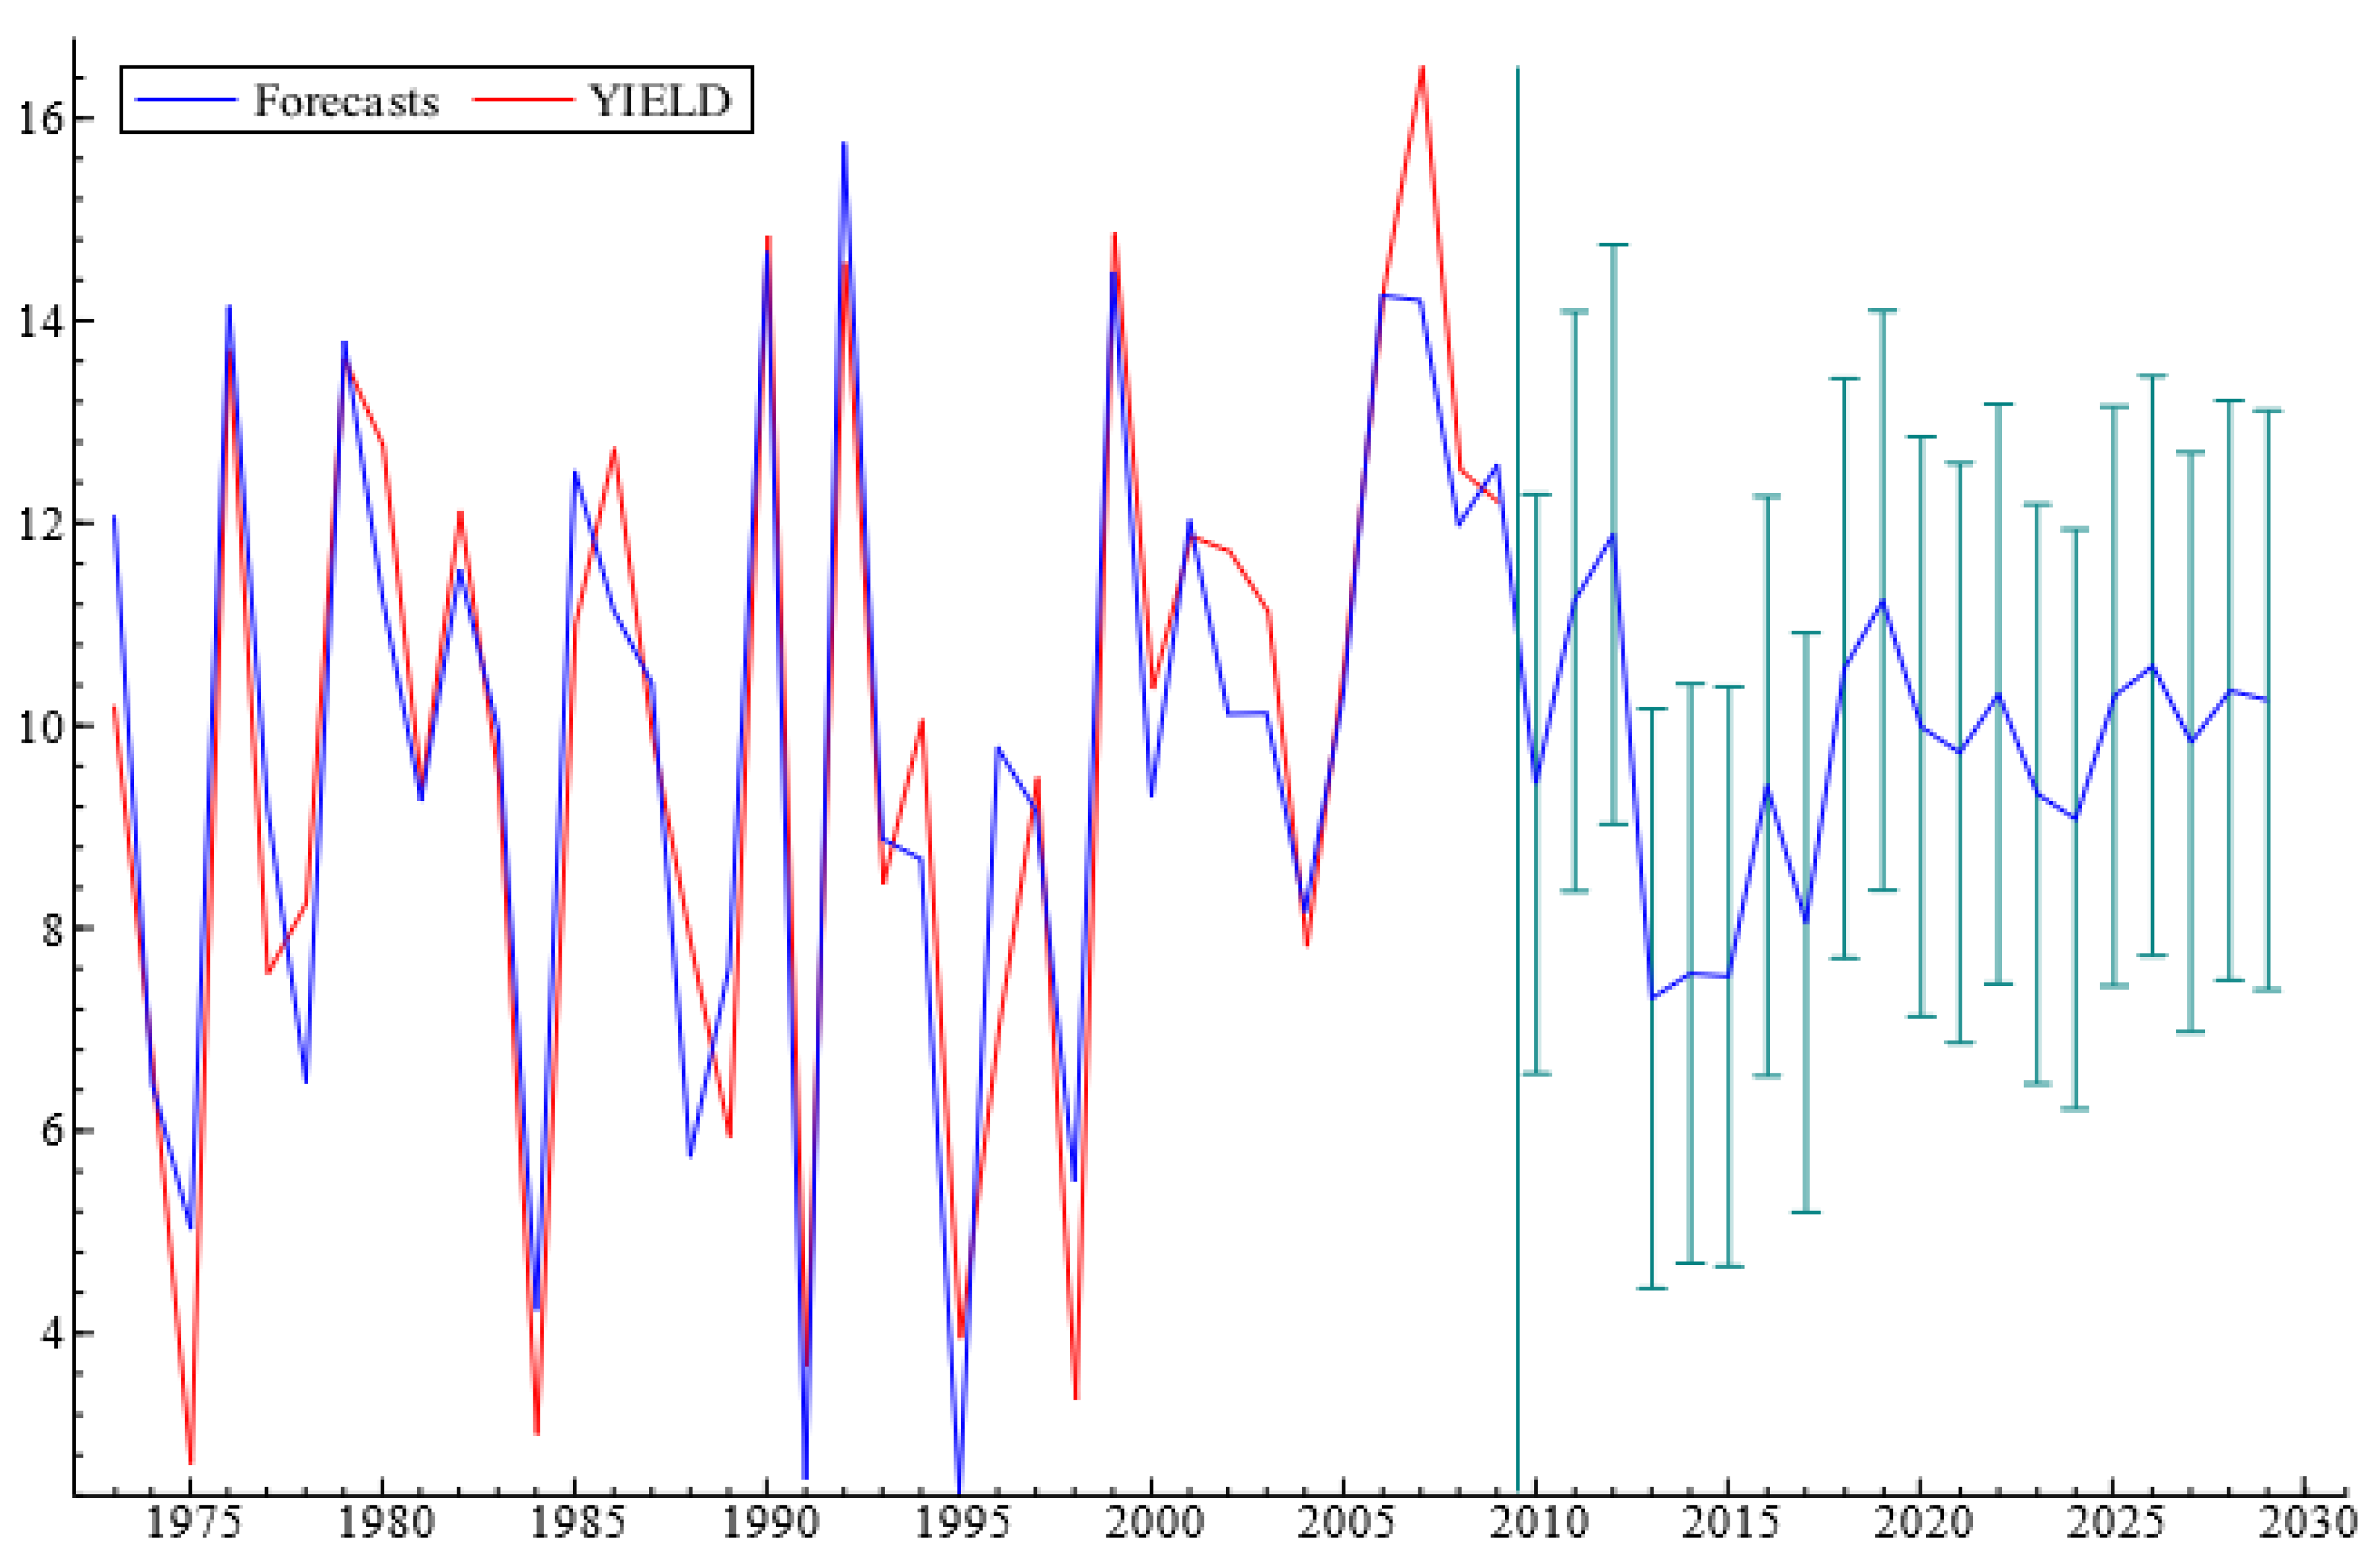
The visual observation of the moisture and yield curves in Figure 5 points to the fact that the model covering the 36 observations between 1973 and 2008 fits the data well. The explanatory model has been transformed into a forecasting model via ARIMA time series modelling and final integration. The resulting model is capable of forecasting fluctuations in yields up to the year 2030. As Figure 6 illustrates, we should have expected a drop in yields in 2013 to a level of just above 7 t/ha and should expect gradual increases to a maximum yield level of approximately 11 t/ha in 2019, after which the yields continue fluctuating at around 10 t/ha.
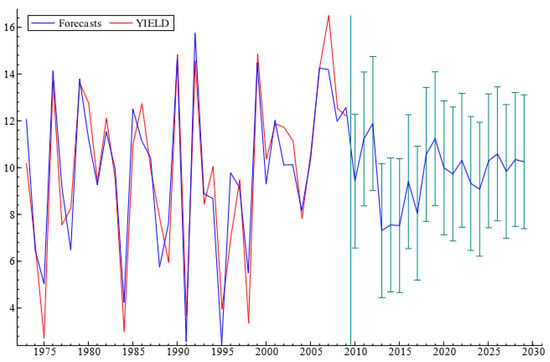
Figure 6.
ARIMA based model of wheat yield forecast for 2010–2030. The error bars in green on the righthand side denote +/−2 forecast standard errors, denoting the 95% confidence intervals.
In our final model, wheat yield depends on soil moisture; there is a significant El Niño response in the form of MEI6t−1, and it also depends on the CR12t−1 (cosmic rays in December of the previous year). There is a significant response to the changes in TSIt−1 (total solar irradiance) and the changes in solar activity (Wolft−1) as well as changes in the temperatures in June and changes in wheat yield itself.
The estimation sample is: 1973–2008.
We can see that most model specification tests have been satisfied apart from the slight issues with autoregression in individual equations. All vector tests for normality of residuals, autocorrelation of residuals, and residual homoscedasticity have been met.
6. Discussion
Our results reflect the most recent discoveries in the climatic drivers for crop yields. We have identified several effects to be significant in the model of wheat yield in Kazakhstan; most importantly, the connection between El Niño and wheat yield, the role of changes in cosmic radiation, solar activity, and soil moisture, resulting from precipitation and temperature dynamics. Our paper has confirmed a link between cosmic rays, solar activity, and wheat yield, which are rarely studied together with traditional climatic variables such as precipitation and temperatures. The model could be modified further so that the individual components could be forecasted into the future using various forms of a time series ARIMA model. The resulting integration of these forecasts allows the prediction of wheat yields into the future (Figure 6).
This model will have a significant practical value for predicting crop yields in Kazakhstan under changing climatic conditions and will be tested further as new data becomes available. Currently it can forecast wheat yields into the future up to 2030 under the “ceteris paribus” assumption (everything else being equal). Both our hypotheses have therefore been confirmed.
7. Conclusions
This paper presents recent research highlighting the impacts of climatic factors on droughts and yields of wheat in northern Kazakhstan. Drought is one of the major manifestations of climate change in Kazakhstan and exerts a considerable pressure on the agricultural sector, which is the most vulnerable sector to drought in the economy. To mitigate its impact, a warning system to deliver timely information about the possible occurrence of droughts is needed. This is possible only if the influence of large-scale atmospheric processes, formed due to the impact of cosmic-geophysical conditions and interdependent factors in the ocean–glacier–land-atmosphere systems with direct and reverse links, is taken into account.
Climatic change is clearly a process determined by the complex interaction of natural and anthropogenic causes. Without explaining the exact mechanism of anthropogenic impacts on the climatic system, we explore the impact of a range of indicators, some of them experiencing clear anthropogenic pressures, to explain the variability in wheat yields in Kazakhstan.
In modelling the dynamics of wheat yield in the Kostanay region of Kazakhstan we employed the cointegration and error-correction methodology, where explanation of the long-run changes has been combined with short-term dynamics. The results can be summarized as follows.
We have conducted the zoning of the territory of Kazakhstan based on the standardized moisture index. It was demonstrated that the region under study, the Kostanay region, is characterized by almost all zones from arid to moist. Most parts of Kazakhstan, about 94% of the territory, lie in two zones: arid and semiarid. Catastrophic droughts were observed in the Kostanay region in Kazakhstan in 1975, 1983, 1991, 1995, 1998, and 2004, coinciding with strong MEI and El Niño phases.
Our analysis showed that sufficiently good coherence was observed in the relationship between temporal variation of standardized moisture index and crop yield fluctuation, i.e., high values of moisture index correspond to high yield values, and negative values to low-yielding years.
The article found an important connection between the Multivariate ENSO Index (MEI) and wheat yields in Kazakhstan. Our research found significant correlation between Galactic Cosmic Rays (GCR) received on Earth and wheat yield in the Kostanay region of Kazakhstan. If the impact of the cosmic rays on droughts is real, the mechanism is attributed to the ionization caused by GCR influencing droughts through the microphysics of the cloud formation. Our research has confirmed the effect of total solar irradiance (TSI) on wheat yield.
The econometric model proposed in this paper explains changes in wheat yield as a function of changes in soil moisture, changes in June air temperatures, changes in total solar irradiance, changes in TSIt−1 (total solar irradiance), and changes in solar activity (Wolft−1). In our model, there is a significant El Niño response in the form of MEI6t−1, and wheat yield also depends on the CR12t−1 (cosmic rays in December of the previous year) and changes in wheat yield itself.
Our results reflect the most recent discoveries in the climatic drivers for crop yields. We have identified several effects to be significant in the model of wheat yield in Kazakhstan, most importantly, the connection between El Niño, the role of changes in cosmic radiation, solar activity, and soil moisture, resulting from precipitation and temperature dynamics. The model proposed in our paper could be modified further so that the individual components could be forecasted into the future using various forms of a time series ARIMA model. The resulting integration of these forecasts allows the prediction of wheat yields into the future, thereby building resilience and strengthening food security in the face of a changing climate.
One of the potential limitations of this study stems from the fact that Kazakhstan has vastly different climatic conditions in various regions and new modeling experiments would need to be conducted to confirm the found dependencies for other regions.
Our future research plans include more in-depth analysis of the climate–water–food nexus in relation to other sensitive agricultural crops experiencing significant impacts of climate change, such as rice, coffee, etc.
Author Contributions
Conceptualisation: S.E.S. and V.S.; methodology: S.E.S., V.S., G.T.; formal analysis: S.E.S.; data curation: S.P., S.E.S.; writing—original draft preparation: G.T., T.T., S.E.S.; writing—review and editing: S.E.S., T.S., I.A.S.; funding acquisition: V.S. All authors have read and agreed to the published version of the manuscript.
Funding
This research was funded by Republic of Kazakhstan 0376/GF «Develop methods, models and GIS technologies to control, analyze and forecast the dynamics of desertification in the Republic of Kazakhstan».
Institutional Review Board Statement
Not applicable.
Informed Consent Statement
Not applicable.
Data Availability Statement
Not applicable.
Conflicts of Interest
The authors declare no conflict of interest.
References
- Global Warming of 1.5 °C: An IPCC Special Report on the Impacts of Global Warming of 1.5 °C Above Pre-Industrial Levels and Related Global Greenhouse Gas Emission Pathways, in the Context of Strengthening the Global Response to the Threat of Climate Change, Sustainable Development, and Efforts to Eradicate Poverty; WMO, UNEP: Geneva, Switzerland, 2014.
- United Nations. Transforming Our World: The 2030 Agenda for Sustainable Development, Resolution Adopted by the General Assembly on 25 September 2015, A/RES/70/1; United Nations: New York, NY, USA, 2015. [Google Scholar]
- Porter, J.R.; Xie, L.; Challinor, A.J.; Cochrane, K.; Howden, S.M.; Iqbal, M.M.; Lobell, D.B.; Travasso, M.I. Food security and food production systems. In Climate Change 2014: Impacts, Adaptation, and Vulnerability—Part A: Global and Sectoral Aspects; Field, C.B.V.R., Barros, D.J., Dokken, K.J., Mach, M.D., Mastrandrea, T.E., Bilir, M., Chatterjee, K.L., Ebi, Y.O., Estrada, R.C., Genova, B., et al., Eds.; Cambridge University Press: Cambridge, UK, 2004; pp. 485–533. [Google Scholar]
- Ministry of Environment Protection. Kazakhstan’s Second National Communication to the Conference of the Parties to the United Nations Framework Convention on Climate Change; Ministry of Environment Protection: Astana, Kazakhstan, 2009.
- Vaughan, D.G.; Comiso, J.C.; Allison, I.; Carrasco, J.; Kaser, G.; Kwok, R.; Mote, P.; Murray, T.; Paul, F.; Ren, J.R.; et al. Observations: Cryosphere. In Climate Change 2013: The Physical Science Basis; Stocker, T.F.D., Qin, G.-K., Plattner, M., Tignor, S.K., Allen, J., Boschung, A., Nauels, Y., Xia, V., Midgley, P.M., Eds.; Cambridge University Press: Cambridge, UK, 2013. [Google Scholar]
- Shahgedanova, M.; Nosenko, G.; Bushueva, I.; Ivanov, M. Changes in area and geodetic mass balance of small glaciers, Polar Urals, Russia, 1950–2008. J. Glaciol. 2012, 58, 953–964. [Google Scholar] [CrossRef]
- Food and Agriculture Organization (FAO). The State of Food and Agriculture: Climate Change, Agriculture and Food Security; Food and Agriculture Organization of the United Nations: Rome, Italy, 2016. [Google Scholar]
- Guo, H.; Bao, A.; Liu, T.; Jiapaer, G.; Ndayisaba, F.; Jiang, L.; Kurban, A.; De Maeyer, P. Spatial and temporal characteristics of droughts in Central Asia during 1966–2015. Sci. Total Environ. 2018, 624, 1523–1538. [Google Scholar] [CrossRef] [PubMed]
- Portela, M.M.; Zeleňáková, M.; Silva, A.T.; Hlavatá, H.; Santos, J.F.; Purcz, P. Comprehensive Characterization of Droughts in Slovakia. Int. J. Environ. Sci. Dev. 2017, 8, 25–29. [Google Scholar] [CrossRef][Green Version]
- Gelcer, E.; Fraisse, C.; Dzotsi, K.; Hu, Z.; Mendes, R.; Zotarelli, L. Effects of El Niño Southern Oscillation on the space–time variability of Agricultural Reference Index for Drought in midlatitudes. Agric. For. Meteorol. 2013, 174–175, 110–128. [Google Scholar] [CrossRef]
- Elagib, N. Development and application of a drought risk index for food crop yield in Eastern Sahel. Ecol. Indic. 2014, 43, 114–125. [Google Scholar] [CrossRef]
- Ubilava, D.; Holt, M. El Niño southern oscillation and its effects on world vegetable oil prices: Assessing asymmetries using smooth transition models. Aust. J. Agric. Resour. Econ. 2013, 57, 273–297. [Google Scholar] [CrossRef]
- Iizumi, T.; Luo, J.-J.; Challinor, A.J.; Sakurai, G.; Yokozawa, M.; Sakuma, H.; Brown, M.E.; Yamagata, T. Impacts of El Niño Southern Oscillation on the Global Yields of Major Crops. Nat. Commun. IPCC 2018, 5, 3712. [Google Scholar] [CrossRef]
- Ward, P.J.; Jongman, B.; Kummu, M.; Dettinger, M.D.; Weiland, F.C.S.; Winsemius, H.C. Strong influence of El Nino Southern Oscillation on flood risk around the world. Proc. Natl. Acad. Sci. USA 2014, 111, 15659–15664. [Google Scholar] [CrossRef]
- Svensmark, H. Cosmic Rays and Earth’s Climate. Space Sci. Rev. 2000, 93, 175–185. [Google Scholar] [CrossRef]
- Svensmark, H. Cosmic Rays, Clouds and Climate. Europhys. News 2015, 46, 26–29. [Google Scholar] [CrossRef]
- Iglesias, A.; Erda, L.; Rosenzweig, C. Climate Change in Asia: A Review of the Vulnerability and Adaptation of Crop Production; Springer: Dordrechti, The Netherlands, 1996; pp. 13–27. [Google Scholar]
- Min, M.; Zhao, W.; Hu, T.; Chen, J.; Nie, X. Influential Factors of Spatial Distribution of Wheat Yield in China During 1978–2007: A Spatial Econometric Analysis. IEEE J. Sel. Top. Appl. Earth Obs. Remote. Sens. 2014, 7, 4453–4460. [Google Scholar] [CrossRef]
- Liu, Y.; Yang, X.; Wang, E.; Xue, C. Climate and crop yields impacted by ENSO episodes on the North China Plain: 1956–2006. Reg. Environ. Chang. 2013, 14, 49–59. [Google Scholar] [CrossRef]
- Xu, K.; Dawen, Y.; Hanbo, Y.; Zhe, L.; Yue, Q.; Yan, S. Spatio-Temporal Variation of Drought in China during 1961–2012: A Climatic Perspective. J. Hydrol. 2015, 526, 253–264. [Google Scholar] [CrossRef]
- Subash, N.; Gangwar, B. Statistical analysis of Indian rainfall and rice productivity anomalies over the last decades. Int. J. Clim. 2013, 34, 2378–2392. [Google Scholar] [CrossRef]
- Selvaraju, R. Impact of El Niño-southern oscillation on Indian foodgrain production. Int. J. Clim. 2003, 23, 187–206. [Google Scholar] [CrossRef]
- Ahmed, M.; Hassan, F.-U. Cumulative Effect of Temperature and Solar Radiation on Wheat Yield. Not. Bot. Horti Agrobot. Cluj-Napoca 2011, 39, 146–152. [Google Scholar] [CrossRef]
- Ahmad, M.; Siftan, H.; Iqbal, M. Impact of Climate Change on Wheat Productivity in Pakistan: A District Level Analysis. MPRA Pap. 2016. [Google Scholar] [CrossRef]
- Huang, J.; Ma, J.; Guan, X.; Li, Y.; He, Y. Progress in Semi-arid Climate Change Studies in China. Adv. Atmos. Sci. 2019, 36, 922–937. [Google Scholar] [CrossRef]
- Garnett, E.R.; Khandekar, M.L.; Babb, J.C. On the Utility of ENSO and PNA Indices for Long-Lead Forecasting of Summer Weather over the Crop-Growing Region of the Canadian Prairies. Theor. Appl. Clim. 1998, 60, 37–45. [Google Scholar] [CrossRef]
- Hansen, J.W.; Jones, J.W.; Kiker, J.C.; Hodges, A.W. El Niño–Southern Oscillation Impacts on Winter Vegetable Production in Florida. J. Clim. 1999, 12, 92–102. [Google Scholar] [CrossRef]
- Soler, C.M.T.; Sentelhas, P.C.; Hoogenboom, G. The impact of El Niño Southern Oscillation phases on off-season maize yield for a subtropical region of Brazil. Int. J. Clim. 2009, 30, 1056–1066. [Google Scholar] [CrossRef]
- Beltrán-Przekurat, A.; Sr, R.A.P.; Eastman, J.L.; Coughenour, M.B. Modelling the effects of land-use/land-cover changes on the near-surface atmosphere in southern South America. Int. J. Clim. 2011, 32, 1206–1225. [Google Scholar] [CrossRef]
- Okonkwo, C.; Demoz, B. The relationship between El Niño Southern Oscillations and cereal production in Sahel. Environ. Hazards 2014, 13, 343–357. [Google Scholar] [CrossRef]
- Plisnier, P.D.; Serneels, S.; Lambin, E.F. Impact of ENSO on East African ecosystems: A multivariate analysis based on climate and remote sensing data. Glob. Ecol. Biogeogr. 2000, 9, 481–497. [Google Scholar] [CrossRef]
- Kanno, H.; Sakurai, T.; Shinjo, H.; Miyazaki, H.; Ishimoto, Y.; Saeki, T.; Umetsu, C. Analysis of Meteorological Measurements Made over Three Rainy Seasons and Rainfall Simulations in Sinazongwe District, Southern Province, Zambia. Jpn. Agric. Res. Q. 2015, 49, 59–71. [Google Scholar] [CrossRef][Green Version]
- Gimeno, L.; Ribera, P.; Iglesias, R.; De La Torre, L.; García, R.; Hernández, E. Identification of empirical relationships between indices of ENSO and NAO and agricultural yields in Spain. Clim. Res. 2002, 21, 165–172. [Google Scholar] [CrossRef]
- Frías, M.D.; Herrera, S.; Cofiño, A.S.; Gutiérrez, J.M.; García, S.H. Assessing the Skill of Precipitation and Temperature Seasonal Forecasts in Spain: Windows of Opportunity Related to ENSO Events. J. Clim. 2010, 23, 209–220. [Google Scholar] [CrossRef]
- Wallace, J.M.; Lim, G.-H.; Blackmon, M.L. Relationship between Cyclone Tracks, Anticyclone Tracks and Baroclinic Waveguides. J. Atmos. Sci. 1988, 45, 439–462. [Google Scholar] [CrossRef]
- Rasmusson, E.M.; Hall, J.M. El Niño: The Great Equatorial Warming: Pacific Ocean Event of 1982–1983. Weatherwise 1983, 36, 166–176. [Google Scholar] [CrossRef]
- Fraedrich, K. European grosswetter during the warm and cold extremes of the El Niñco/Southern Oscillation. Int. J. Clim. 1990, 10, 21–31. [Google Scholar] [CrossRef]
- Volkov, Y.N.; Kalashnikov, B.M. El Niño: Identification and Possibility of Forecasting. Work. Fehmri 1990, 158–172. [Google Scholar]
- Gruza, G.V.; Ranjkova, E.; Kleshchenko, L.K.; Aristova, L.N. On Relations of Climatic Abnormalities on the Territory of Russia with El Nino Event—South Oscillation. Meteorol. Hydrol. 2002, 5, 32–51. [Google Scholar]
- Petrosyants, M.A.; Gushchina, D.Y. On Definition of El Niño and La Niña Events. Meteorol. Hydrol. 2002, 8, 24–35. [Google Scholar]
- Perevedentsev, Y.P.; Shattalinskiy, K.M.; Vazhnova, N.A.; Naumov, E.P.; Shumikhina, A.V. Climate Changes on the Territory of Privolzhsky Federal District for the Last Decades and Its Connection with the Geophysical Factors. Bull. Udmurt Univ. 2012, 4, 122–135. [Google Scholar]
- Zarch, A.; Amin, M.; Sivakumar, B.; Sharma, A. Droughts in a Warming Climate: A Global Assessment of Standardized Precipitation Index (SPI) and Reconnaissance Drought Index (RDI). J. Hydrol. 2015, 526, 183–195. [Google Scholar] [CrossRef]
- Mokhov, I.I.; Smirnov, D.A. El Niño–Southern Oscillation drives North Atlantic Oscillation as revealed with nonlinear techniques from climatic indices. Geophys. Res. Lett. 2006, 33. [Google Scholar] [CrossRef]
- Weare, B.C.; Mokhov, I.I. Evaluation of Total Cloudiness and Its Variability in the Atmospheric Model Intercomparison Project. J. Clim. 1995, 8, 2224–2238. [Google Scholar] [CrossRef]
- Polonsky, A.B.; Voskresenskaya, E.N. On the Statistical Structure of Hydrometeorological Fields in the North Atlantic. Phys. Oceanogr. 2004, 14, 15–26. [Google Scholar] [CrossRef]
- Kryjov, V.N.; Park, C.-K. Solar modulation of the El-Nino/Southern oscillation impact on the Northern Hemisphere annular mode. Geophys. Res. Lett. 2007, 34, L10701. [Google Scholar] [CrossRef]
- Nesterov, E.S. The North Atlantic Oscillation: The Atmosphere and the Ocean; Triada: Houston, TX, USA, 2013; p. 144. [Google Scholar]
- Government of Kazakhstan. Program on Desertification Control in the Republic of Kazakhstan for 2005–2015 Period; Government of the Republic of Kazakhstan: Nur-Sultan, Kazakhstan, 2005. [Google Scholar]
- Sidorenkov, N.S. Celestial mechanical causes of weather and climate change. Izv. Atmos. Ocean. Phys. 2016, 52, 667–682. [Google Scholar] [CrossRef]
- Yulihastin, E.; Nur, F. Trismidianto: Impacts of El Niño and IOD on the Indonesian Climate; National Institute of Aeronautics and Space: Jakarta, Indonesia, 2008.
- Diamond, H.J.; Lorrey, A.M.; Renwick, J.A. A Southwest Pacific Tropical Cyclone Climatology and Linkages to the El Niño–Southern Oscillation. J. Clim. 2013, 26, 3–25. [Google Scholar] [CrossRef]
- Zhao, C.; Liu, B.; Xiao, L.; Hoogenboom, G.; Boote, K.J.; Kassie, B.T.; Pavan, W.; Sheila, V.; Kim, K.S.; Hernandez-Ochoa, I.; et al. A SIMPLE Crop Model. Eur. J. Agron. 2019, 104, 97–106. [Google Scholar] [CrossRef]
- Makaudze, E.M. Assessing the economic value of El Niño-based seasonal climate forecasts for smallholder farmers in Zimbabwe. Meteorol. Appl. 2012, 21, 535–544. [Google Scholar] [CrossRef]
- WMO. National Drought Management Policy Guidelines: A Template for Action; World Meteorological Organization: Geneva, Switzerland, 2014. [Google Scholar]
- WMO. Atlas of Mortality and Economic Losses from Weather, Climate and Water Extremes (1970–2012); World Meteorological Organization: Geneva, Switzerland, 2014. [Google Scholar]
- Palmer, W.C. Meteorological Drought, Research Paper No. 45, Washington, D.C.: U.S. Department of Commerce & Weather Bureau. 1965. Available online: https://www.ncdc.noaa.gov/temp-and-precip/drought/docs/palmer.pdf (accessed on 28 June 2021).
- Gringof, I.G.; Paseciniuc, A.D. Agrometeorology and Agro-Meteorological Observations; Gidrometeoizdat: Leningrad, Russia, 2005. [Google Scholar]
- Zhumbaev, E.E. Strategic Measures Combating Desertification in the Republic of Kazakhstan until 2025; UNDP: Nur-Sultan, Kazakhstan, 2015. [Google Scholar]
- Ormes, J.F. Cosmic Rays and Climate. Adv. Space Res. 2018, 62, 2880–2891. [Google Scholar] [CrossRef]
- Wolter, K. The Southern Oscillation in Surface Circulation and Climate over the Tropical Atlantic, Eastern Pacific, and Indian Oceans as Captured by Cluster Analysis. J. Clim. Appl. Meteorol. 1987, 26, 540–558. [Google Scholar] [CrossRef]
- Wolter, K.; Timlin, M.S. El Niño/Southern Oscillation behaviour since 1871 as diagnosed in an extended multivariate ENSO index (MEI.ext). Int. J. Clim. 2011, 31, 1074–1087. [Google Scholar] [CrossRef]
- Marsh, N.; Svensmark, H. Galactic cosmic ray and El Niño–Southern Oscillation trends in International Satellite Cloud Climatology Project D2 low-cloud properties. J. Geophys. Res. Space Phys. 2003, 108. [Google Scholar] [CrossRef]
- Shakhov, A.A. The Effect of Cosmic Radiation on Plant Activity. Zhurnal Obs. Biol. 1962, 23, 81–89. [Google Scholar]
- Dengel, S.; Aeby, D.; Grace, J. A relationship between galactic cosmic radiation and tree rings. New Phytol. 2009, 184, 545–551. [Google Scholar] [CrossRef]
Publisher’s Note: MDPI stays neutral with regard to jurisdictional claims in published maps and institutional affiliations. |
© 2021 by the authors. Licensee MDPI, Basel, Switzerland. This article is an open access article distributed under the terms and conditions of the Creative Commons Attribution (CC BY) license (https://creativecommons.org/licenses/by/4.0/).

