Abstract
Lack of understanding of the ways local subpopulations perceive various changes associated with rapid growth of the tourism industry may lead to unsustainable development. This study assessed the levels and determinants of residents’ perception regarding the changes in environmental, sociocultural, and economic conditions associated with tourism development in Phuket, Thailand. A structured questionnaire survey was conducted with 450 residents covering all three districts of Phuket Province to capture overall indicators and detailed sub-indicators of perception, whilst factors affecting the perceived changes were examined through ordered logistic regression and seemingly unrelated regression (SUR) analyses. The descriptive statistics showed that residents perceived unfavorable changes in various conditions in the island such as increased levels of pollution, road accidents, traffic congestion, and costs of living, while at the same time acknowledging the importance of long-term economic contribution of tourism development. Moreover, regression analyses revealed that various sociodemographic factors such as gender, education, residency duration, and occupation influenced residents’ perception of the changing local conditions. At the sub-indicator level, detailed insights were obtained such as female residents being more likely to positively perceive some of the changes such as increased availability of public space. Implications and suggestions for policy design and planning are discussed in detail.
1. Introduction
Tourism has been an important instrument in economic development strategies and is regard as the largest and fastest growing industry in many countries around the world [1,2,3]. Tourism development has been a cornerstone policy for socioeconomic development, especially in developing countries [4,5,6]. Many studies found that growth in tourism generally improves the local standards of living, provides new businesses and job opportunities, and promotes the development of infrastructure and public facilities, possibly becoming the primary source of economic growth and support for livelihoods of the local community [1,7,8,9]. Inskeep [10] also states that tourism development supports the development of basic infrastructure for host communities—such as airports, seaports, roads, telecommunication network, and electricity grids. Moreover, tourism development helps improve public facilities such as outdoor recreation facilities, public parks, roads, and sport facilities [3,11] and promotes environmental education and conservation through ecotourism activities as well as boost an investment in the environmental infrastructure of the destination [12]. As the tourism sector expands globally, tourism activities tend to concentrate in islands and coastal areas in a number of countries [13,14]. Since travelling to remote island destinations is a growing trend, tourism acts as the primary source of income for local population on such islands [15,16].
While tourism development is likely to yield economic prosperity to the tourism sector and other complementary sectors in the locality, it can also influence residents’ livelihoods negatively, depending on the extent and mode of tourism development [11,17]. Literature points out that a major inevitable concern at tourism destinations in developing countries is an issue of sustainability, since tourism development can cause significant impacts on environments, society, culture, and economy [18,19,20,21]. From the economic perspective, past studies observed that rapid tourism development often entails increases in the costs of living [17,22], prices for goods and services [1,23], and costs of housing and properties [24]. From the environmental perspective, tourism caused significant impacts on natural environments and ecosystems, including increases in emissions of waste and different forms of pollutants [1,11,23]. From the societal perspective, tourism development has been associated with problems such as crimes, conflicts in communities, traffic congestion, and crowd in public areas [1,11,25,26]. In addition, tourism development lowered the moral and ethical values, boosted the consumption of alcohol, heightened the tension in communities [26,27,28], and caused drug abuse and prostitution [1,29].
With the massive growth of tourism globally, it can be crucial to pay attention to how residents perceive various dimensions of the changes delivered during the course of tourism development as well as its recent conditions. By acknowledging both positive and negative impacts of tourism, literature attempted to understand the various changes caused by tourism development from the residents’ perspective [1,30]. Haralambopoulos and Pizam [31] explored residents’ perception and sociodemographic variables regarding tourism development and its impacts in the Greek Island of Samos, and found that residents who were economically dependent on tourism tended to have positive perception toward tourism sector development while acknowledging the adverse impacts of tourism within their community such as rising prices of goods and services, drug addiction, vandalism, brawls, and sexual harassment. Similarly, Almeida et al. [32] investigated residents’ perception of tourism development in Benalmadena, the seaside resort town in Spain, and found that being native, education level, and length of residency were the factors associated with perceived impacts of tourism development on the community. Further, Akis et al. [33] studied residents’ perception of tourism development in Cyprus and found that while residents appreciated the benefits of tourism development, they also believed that they received negative impacts. Rasoolimanesh et al. [34] examined the effects of community factors on residents’ perception of tourism development in rural Lenggong and urban George Town World Heritage Site, Malaysia, and found that the extent of community involvement significantly influenced residents’ perceptions toward tourism development. These studies indeed highlight the importance of investigation of residents’ perception at certain stages of tourism development. Furthermore, as tourist destinations develop over time, residents’ perception is likely to evolve as well. Stylidis et al. [35] suggest that relationship between residents’ perception and detailed conditions of localities should be analyzed periodically for effective and harmonized planning on tourism development as it can help identify and measure tourism impacts [36], while Dyer et al. [9] and Vargas-Sánchez, Plaza-Mejía, and Porras-Bueno [37] emphasized monitoring of residents’ perception to ensure sustainable development and to help planners address residents’ priorities.
While the developing world with emerging tourism destinations tends to experience extensive developmental impacts within a short period of time, existing literature has largely focused on developed countries [38,39]. The sociocultural and economic differences between developed and developing regions in terms of stage of tourism development make it more complex to compare the understanding of tourism destination between the two [40,41]. This knowledge gap implies that understanding residents’ viewpoint is critical for long-term success of tourist destinations [17,42,43]. Gaining such insight can aid planning and policies in reducing adverse impacts of tourism development and help ensure that tourism planning and development remain aligned with local identity and values [44,45,46,47].
Thailand is home to multiple reputed tourist sites and particularly famous for its island destinations such as Phuket, Samui, and Samet. Yet, residents’ perception in such established island destinations has been understudied to date, leaving a dearth of information that can potentially be useful for key stakeholders in both the private and public sectors in those sites. Studies point out that residents’ perception in islands tends to be rather diverse across a variety of sociodemographic segments and that lack of information on and attention to the ways different segments of people perceived impacts of tourism development can be a ground for social tension and conflicts among local residents, as observed in other island destinations [11,48,49]. This paper examines the case of Phuket, known as the Pearl of the Andaman, which is one of the strategically important provinces of Thailand in terms of economic contribution to the tourism sector after Bangkok, Chiangmai, and Chonburi. When the tin mining industry era in Phuket phased out in the 1970s, the island geared its investment and economic activities toward developing a tourism industry. The first major hotel was built in 1976. The number of international visitors increased from around 20,000 in 1976 to more than 530,000 in 1989 [50,51]. Eventually, the tourism sector of Phuket began playing a pivotal role in both local and national economies. From 2012 to 2016, the tourism sector of the island generated revenue of over THB 200 billion, equivalent to USD 5.7 billion, and received more than 10 million visitors annually, ranked number one among the southern provinces of Thailand [52]. As observed in other global tourist destinations, Phuket was developed in tandem with infrastructural development, intensive land use, urbanization, and mass tourism, which must have affected the local environments, societies, and economy in one way or another.
There are two main interrelated objectives in this study. The first is to assess the changes in local conditions in environmental, sociocultural, and economic dimensions in association with tourism sector development from the perspectives of residents in Phuket, Thailand. The second objective is to examine sociodemographic determinants of such perceived changes using ordered logistic and seemingly unrelated regression (SUR) analyses. The outcome of this study may inform relevant stakeholders and foster discussions toward a more sustainable mode of development in island destinations where residents are an integral part of planning and management. Following this introductory section, Section 2 discuss literature on residents’ perception of changes in local conditions along with tourism development, and the resident-level factors influencing such perceptions, respectively. Section 3 describes the methodology while Section 4 presents the results. Section 5 provides discussions, followed by concluding remarks in Section 6.
2. Review of Literature
2.1. Residents’ Perception of Impacts of Tourism Development
According to Lindsay and Norman [53] and Pickens [54], perceptions are ‘beliefs or opinions’ that are held by people based on how things seem to be, which is a representation of one’s own reality or experience. In other words, perception is part of a psychological thinking process subject to individuals, which feeds into decision making or judgment by each individual [55]. According to Lindberg and Johnson [26], residents’ perception of tourism development is psychological trends which express the evaluation of tourism development. Furthermore, literature generally agrees that various factors such as personal values and sociodemographic attributes may influence individual perception regarding tourism development [1,39,56,57].
Studies on residents’ perception of tourism development and its impacts have gradually gained popularity in recent decades due to their relevance with sustainable development [39]. Jurowski, Uysal, and Williams [58] stated that once a community becomes a tourist destination, the livelihoods of community members are affected by tourism activities. Subsequently, researchers studied the perceived impacts of tourism development from residents’ perspectives [1,56,59,60]. These studies show that residents are aware of, and concerned about, the changes that occurred in relation to tourism development. Furthermore, to assess residents’ perception, a large body of literature adopted the three-bottom-line approach by classifying the changes or impacts into environmental, sociocultural, and economic dimensions [1,7,22,37,57,61].
In the environmental aspects, studies found that residents perceived both positive and negative changes in local environments associated with tourism development [43,62,63], depending on the context of each destination. In some sites, residents recognized tourism’s contribution to conservation [1,33,64] and improvement in environmental conditions in peri-urban areas [1,65]. Nevertheless, in many more cases, residents perceived tourism as causing unfavorable changes such as heightened pollution levels, waste disposal, and natural resources depletion [1,2,23,28].
Likewise, there are diverse findings on how residents perceived the sociocultural impacts. In some cases, they perceived favorable changes in leisure and cultural activities [57,64,66], a sense of pride in cultural values and identity [1,67], an interest in preserving historic buildings and archeological sites [33,65], and quality of life [2,68,69]. On the other hand, residents also recognized unfavorable changes in sociocultural aspects such as vandalism and crime rates [1,23], traffic congestion and parking space [1,23,28,68], and alcohol consumption [27,68].
In the economic aspects, tourism development tends to be highly appreciated and generally recognized by residents as part of favorable contribution of the tourism sector [7,70] through increasing employment opportunities and income for their family [1,64,66,67,71,72]. Moreover, residents tend to recognize that tourism contributes to improvement in community infrastructure, public facilities, and living standards in general [1,65,72,73]. On the other hand, Johnson, Snepenger, and Akis [47] found from Silver Valley, Idaho that the residents perceived the tourism industry offered low-salary, low-quality jobs and the economic gain would not be shared by communities. In addition, local people are aware of the trade-off in tourism development such as higher costs of living [2,66,74,75], rising prices of goods and services [31,47,65], as well as the increase in prices of properties and housing [3,65,76,77], including land price [65,75].
One tendency, as far as our observation is concerned, is that the majority of the existing studies collected residents’ responses in the form of levels of agreement or disagreement with positive or negative statements pre-coded by the researchers [1,35,78]. In other words, those studies, while adopting different approaches, categorized the perceived impacts and changes into positive and negative ones, or benefits and costs. Examples of the statements often presented include “tourism creates job opportunities” [7], “tourism creates investment opportunities” [17], “tourism increases the crime rate” [17,32], “tourism increases pollution and garbage” [32], and “tourism leads to rising price levels” [79]. While the dichotomous pre-coding is convenient and useful, it may fail to adequately incorporate residents’ own perception of the extent and quality of changes and may thus lead to response bias [1,78] and unidimensional viewpoints [35]. Our interviews attempted to minimize a prejudice by eliciting respondents’ perception with this statement “Your perceived changes in environmental, sociocultural, and economic conditions in relation to tourism development in the following aspects” where the environmental aspects included waste emissions, air pollution, water pollution, noise pollution, among others; the sociocultural conditions included crime level, social conflict, cultural conservation, congestion, etc.; and the economic conditions included price of goods and services, job opportunities, cost of living, and so forth.
2.2. Individual Factors Associated with Residents’ Perception
For effective policy recommendations, it is important to understand different factors influencing residents’ perception of tourism development [1,2,60]. Sharpley [39] conducted a meta-study and highlighted some intrinsic factors such as livelihood dependency on tourism, duration of residency, level of tourist interaction, and social background, while some studies examined several selected factors statistically [80,81]. A variety of sociodemographic factors such as age, gender, education, income, and residency duration have been studied as possible factors, and the findings indicate that these variables are often associated with residents’ perception of environmental, sociocultural, and economic changes [1,82,83,84,85]. While some scholars arrived at mixed findings on influential factors [39,86], patterns were observed across various places with similar characteristics of tourism development [80].
Haralambopoulos and Pizam [31] found in Samos, Greece that residents’ perception of tourism impacts was worse as years of residency were longer, particularly regarding environmental and social conditions. Similar findings were reported in other parts of developed countries such as Benalmadena in Spain [32], Balearic Islands of Spain [66], Bath in the UK [87], Columbia River Gorge region of Oregon [11], Kusadasi in Turkey [70], and North Wales [88].
Regarding residents’ dependency on tourism, McGehee and Anderek [2] in Arizona and Almeida et al. [32] in Benalmadena, Spain found that those who benefited economically from tourism were more likely to perceive favorable changes due to tourism development. Similar findings were reported in Belek resort town, Turkey [89] and Samos Island, Greece [31]. In Bigodi, Uganda, perception of positive changes due to tourism development was homogeneous across communities [8]. In some developed places, the relationship was found insignificant. Liu and Var [74] reported in Hawaii that there was no significant relationship between economic dependence on tourism and perception of tourism development, and Wan and Li [90] found in Macau that job dependency was not an influencing factor for perception of tourism impacts. In contrast, Teye, Sirakaya, and Sonmez [84] found in Ghana that residents with jobs related with the tourism sector tended to perceive unfavorable changes such as stagnant wages and economic leakage.
Regarding education, Sheldon and Abenoja [91] found in Hawaii that educated groups of residents were more concerned with environmental deterioration, whereas Almeida et al. [32] found that higher education was associated with favorable perception of environmental, sociocultural, and economic changes. The link between education and favorable perception was also found in other sites such as Samos Island in Greece [31], Puerto Rico [92], Cape Coast and Elmina fishing port of Ghana [84], and Petra Region, Jordan [93]. In addition, Latkova and Vogt [94] reported in rural areas of Dubrovnik, Croatia that educated residents perceived larger extent of both positive and negative impacts of tourism.
Gender gap in tourism perception has gained attention since the 1990s [80,95]. Mason and Cheyne [96] found in rural areas of Pohangina Valley, New Zealand that women were more likely to perceive unfavorable changes in traffic jam, road safety crimes, and noise, thus tended to oppose tourism development, while Harrill and Potts [97] reported in Charleston, South Carolina that in general women tended to perceive negative changes from tourism development compared to men. Nonetheless, other studies found no significant difference between women and men in perceived impacts in environmental, sociocultural, and economic domains [2,3,76,82].
Bujosa and Rosselló [66] found in Balearic Islands of Spain that older residents were more likely to perceive favorable environmental changes from tourism development while younger ones tended to perceive positive economic gain. In Benalmadena of Spain, Almeida et al. [32] analyzed two additional variables representing interaction with tourists and frequency of their own travel for tourism purposes, and found that experiences in interaction with tourists and travel activities had favorable effects on perceived impacts of tourism development, particularly the environmental and sociocultural changes.
In light of these discussions, our study examined the extent to which some of the aforementioned factors influenced those perceived changes in Phuket, Thailand as a case of established island tourism destinations in the developing world.
3. Methodology
3.1. Study Site
The island of Phuket is a province located in the Andaman Sea which borders the southwestern coast of Thailand. Phuket is the largest island in the country, covering 543 square kilometers of land spanning between 7°45′ and 8°15′ north latitude and 98°15′ and 98°40′ east longitude. The island is connected to the mainland by Sarasin Bridge (Figure 1). In 2016, there were 386,605 registered residents distributed among three districts, namely, Thalang, Kathu, and Mueang Phuket (hereinafter referred to as Mueang) [52]. All the three districts were included in the study.

Figure 1.
Map of Phuket, Thailand. Source: Adapted from [98].
Phuket is one of the major contributors to Thailand’s tourism sector, received more than 15 million visitors per annum including over 9.5 million international visitors and 3.8 million domestic visitors, with 1664 registered tourism accommodations, and generated THB 377.9 billion or USD 10.8 billion in 2016 [52]. The island has unique diversity of tourism resources ranging from scenic beaches, mountains, waterfalls, multi-cultural attractions, and vibrant nightlife in Bangla Road. Phuket has been chosen as a City of Gastronomy by the UNESCO Creative Cities Network. In 2017, the government set the vision for Phuket to become an “international tourist destination on the basis of sustainable development”.
3.2. Sampling Frame
Primary data were collected via a questionnaire survey with residents. With the population of 386,605, the minimum sample size of 384 was suggested by the formula of Yamane [99] at 95% confidence level. Proportionate district-stratified convenience sampling was applied, by which the subsample sizes were allocated to the three districts in proportion to the district populations (Table 1). Respondents were approached in 14 major public parks and public areas across the three districts, namely, Bang Wad Dam, Thetsaban Tambon Kathu Park, Central Festival Phuket, Phuket Rajabhat University, Chillva Market, Saphan Hin Park, Lime Light, Suan Luang King Rama IX park, Chalong Public Park, the Old Town, Phuket City Hall, Khao Rang, Lotus, and Big C Market. The survey was implemented between June and August 2018 during the daytime on both weekends and weekdays. While the questionnaire was basically self-administered by the respondents, trained enumerators stood by to offer guidance to the respondents during the filling of the questionnaire. To serve the purpose of the study, an initial screening question was used to include only adult permanent residents who had been residing for at least one year, whilst other people including non-residents and non-adults were guided not to proceed with the questionnaire. With the use of hardcopy questionnaires and self-entries of responses, it was expected that responses from some respondents would be dropped at the data cleaning stage. Therefore, adequately more than the minimum suggested sample size of questionnaires (520) were administered. After removing 25 observations with response failures, 495 questionnaires were subjected into quantitative analysis, which is reflected in the last column of Table 1.

Table 1.
Proportionate sampling with district stratification. Source: Authors’ analysis; [52].
3.3. Questionnaire Development
The questionnaire was divided into two parts. The first part aimed to elicit indicators of residents’ perception of changes in environmental, sociocultural, and economic conditions. Ko [100] argues that if sustainable development is one of the major contemporary objectives of the tourism industry, multidimensional assessment should be conducted of the local changes associated with tourism development. Accordingly, three sets of sub-indicators were measured. Following Ko and Stewart [17], all the sub-indicators were elicited on the five-point Likert scale so that the collected data could be aggregated without rescaling. The indicators were selected based on literature on the three pillars of sustainable development [1,32,49,78,79,101,102,103] as well as the relevance to the local context in Phuket (Table 2). The questionnaire was pre-tested with 30 respondents outside the sample to evaluate the quality of the questionnaire and make adjustments prior to the actual survey.
Table 2.
Aggregate indicators and sub-indicators of perceived changes in three dimensions.
The indicators of perceived changes were phrased in neutral tones with an aim to minimize preconception and biased responses [35,78]. For instance, the statement in the environmental domain was “your perception of changes in environmental conditions in relation to tourism development” followed by “air pollution”, “noise pollution”, etc. instead of sounding like “tourism increased air pollution”, “tourism increased noise”, etc. In the Likert scale, Level 1 referred to severe deterioration of local conditions, while Level 5 referred to substantial improvement, with Level 3 indicating unobservable change.
The second part of the questionnaire was designed to collect the sociodemographic profile of the respondents such as gender, age, duration of residency, having a job related to tourism, education level, monthly income, level of tourist interaction, and frequency of involvement in tourism sector activities. The detail of these variables is shown in the next section.
The indicators of perceived changes were phrased in neutral tones with an aim to minimize preconception and biased responses [35,78]. For instance, the statement in the environmental domain was “your perception of changes in environmental conditions in relation to tourism development” followed by “air pollution”, “noise pollution”, etc.; instead of sounding like “tourism increased air pollution”, “tourism increased noise”, etc. In the Likert scale, Level 1 referred to severe deterioration of local conditions, while Level 5 referred to substantial improvement, with Level 3 indicating unobservable change.
The second part of the questionnaire was designed to collect the sociodemographic profile of the respondents such as gender, age, duration of residency, having a job related to tourism, education level, monthly income, level of tourist interaction, and frequency of involvement in tourism sector activities. The detail of these variables is shown in the next section.
3.4. Construction of Aggregate Indicators per Dimension
Overall assessment of multiple indicators can be facilitated by use of aggregate indicators. Aggregate indicators are mathematical formulation of a set of sub-indicators under a certain category or dimension [133]. In this study, arithmetic mean of sub-indicators is used as the aggregate indicator as
where is the aggregate indicator value for dimension for individual , is the value (1–5) of sub-indicator under dimension for individual , and is the number of sub-indicators for dimension . is nine, nine, and five when is environmental, sociocultural, economic dimensions, respectively. To test the consistency among the sub-indicators within a certain dimension, Cronbach’s alpha coefficient was calculated [134]. While each is an ordinal variable with five possible values, can take numerous values as a result of the aggregation. Thus, are regarded as quasi-numerical variables in the subsequent analytical procedures.
3.5. Statistical Analysis
Descriptive statistics were presented using frequency distribution, mean, median, and standard deviation. Regression analysis was employed to analyze factors influencing the perceived changes in local conditions in the environmental, sociocultural, and economic aspects. In this study, the dependent variables are the indicators of perceived changes in local conditions, whilst the independent variables are various factors such as respondents’ duration of residence, involvement in tourism sector activities and related jobs, and the sociodemographic variables.
To analyze the factors associated with the aggregate indicators of changes in local conditions, we begin with the ordinary least squares (OLS) regression
where is the dependent variable representing the changes in local conditions in dimension as perceived by respondent , is the intercept term, corresponds to the j explanatory variable of the model ( = 1 to ), are the coefficients to be estimated, and is the random error term with mean zero and variance .
In our study, consists of nine sociodemographic factors, namely, gender, age, duration of residency, district of residency, job related to tourism, education level, monthly income, interaction with tourists, frequency of tourism activities.
The estimated coefficients can be biased when multiple correlated dependent variables are analyzed in separate OLS regressions. To account for this likely nature of the data, the seemingly unrelated regression (SUR) [135,136] was adopted, which allows for correlation in the error term across the different equations corresponding to the different dependent variables
(3) was verified by the Breusch Pagan test [137] to justify the model selection. The SUR reduces to the multivariate regression [138] when the sets of independent variables are the same across the equations, which applies to our case. Hence, the SUR and multivariate regression are equivalent in this paper.
Furthermore, it may be useful to investigate which sub-indicators contributed to the estimated coefficients in the SUR results. The ordered logistic regression (OLR) [139] was applied to examine the influences of the same sociodemographic factors on the sub-indicators. The underlying relationship in the OLR is expressed as
where is the exact but unobserved degree of agreement by respondent ; the other terms are the same as in Equation (2). While the latent variable is not precisely observed, the five discrete levels of agreement can be observed instead as
where 1 refers to severe deterioration, 2 moderate deterioration, 3 unobservable change, 4 moderate improvement, 5 substantial improvement. The OLR estimation uses the equation
where the left-hand side represents natural logarithm of the odds ratio for observing ; is the probability of observing (i.e., the proportion of observations with ). The OLR model assumes that the same Equation (6) holds for all levels of .
The IBM-SPSS Statistics 25 was used to perform all the statistical analyses. To keep the result tables succinct, only the summary of signs and statistical significance of the coefficients was presented in the result section.
The detail of the dependent variables and independent variables is summarized in Table 3, which shows the scale and unit of each variable and the expected sign of the coefficient, as well as some supporting references.
Table 3.
Definition and scale of the independent variables with expected signs of their coefficients.
4. Results
4.1. Respondents’ Profile
The demographic background of the respondents in the study is summarized in Table 4 in the form of frequency distribution. Of the total of 495 respondents who participated in the study, 40.4% were male and 59.6% were female. The majority were young adults aged between 18 and 35 (58%), followed by 36–50 (28%), 51–60 (12%), and above 60 (2%). In terms of highest educational attainment, the majority had the bachelor’s degree (44%), followed by vocational school (28%), high school (22%), and primary school (6%). By the sampling design, residents in Mueang District constituted the largest share of respondents (57%), followed by Thalang (22%), and Kathu (21%). Furthermore, a large number of respondents were long-term residents of Phuket Island with more than 20 years of duration (36%). On the whole, over 80 % of the respondents had resided there for at least five years, while the remainder had immigrated relatively recently.
Table 4.
Sociodemographic profile of the respondents (n = 495).
4.2. Perceived Changes in Local Conditions
Table 5 summarizes perceived changes in the three dimensions of local conditions in the context of tourism development in Phuket Island. From the environmental perspective, the conditions for all items were perceived as deteriorating, as shown by all the mean scores being below the mid value of 3.0. In the ascending order of mean values, waste problems were perceived as the most unfavorable change (2.32), water pollution (2.36), air pollution (2.38), noise pollution (2.41), physical conditions of road (2.45), public tap water management and quality (2.62), beach quality (2.82), public space management (2.93), and city planning (2.97). The response distribution reveals that considerable proportions of residents observed moderate to severe deterioration in waste problems (60.0%), air pollution (58.8%), water pollution (57.5%), physical conditions of roads (55.9%), noise pollution (54.5%), and beach quality (40.6%), while smaller proportions noticed moderate to substantial improvement in city planning (27.8%), beach quality (26.4%), public space management (26.2%), physical conditions of road (13.1%), public tap water management and quality (11.9%), waste problems (10.7%), water pollution (8.7%), noise pollution (8.1%), and air pollution (7.5%). Nonetheless, it is important to note that fair proportions of residents perceived unobservable changes in three sub-indicators, namely, public tap water management and quality (47.7%), public space management (43.0%), and city planning (42.8%).
Table 5.
Distribution of sub-indicators on perceived changes in environmental, sociocultural, and economic conditions in Phuket.
As for the sociocultural dimension, residents perceived worsening conditions in traffic accident problems (mean 2.33), followed by congestion (2.36), public transportation infrastructure and services (2.54), safety and security (2.61), crime (2.62), social inequality (2.62), social conflict (2.63), while they noted minimal unfavorable changes in public participation (2.92). The only sub-indicator that received a mean score higher than the mid value was cultural conservation (3.12). Similarly, considerable portions of residents perceived moderate to severe deterioration in sociocultural conditions in terms of traffic accident problems (61.2%), congestion (54.8%), public transportation (46.4%), safety and security (45.5%), crime (44.9%), and social conflict (40.0%). On the other hand, cultural conservation recorded favorable changes by 32.2% of the residents. Nonetheless, the majority of the residents were neutral as to changes in public participation (51.5%), social conflict (49.9%), and cultural conservation (46.7%).
Regarding the changes in economic conditions, unfavorable changes were perceived in price of goods and services (mean 2.45), followed by land and housing prices (2.52), costs of living (2.57), while the perceived changes were almost neutral in job opportunities (2.97) and income distribution (2.87). The response distribution shows that the majority of the residents perceived worsening conditions in prices of goods and services (51.9%), land and housing costs (47.5%), costs of living (47.9%), while 27.2% of the residents perceived favorable changes in job opportunities. Nevertheless, in three out of the five sub-indicators, the most common response was no perceived change, i.e., job opportunities (45.1%), land and housing costs (44.0%), and income distribution (42.0%).
The frequency distribution of the aggregate indicator values are presented in Figure 2. The mean of aggregate indicators was 2.58, 2.64, and 2.67 for the environmental, sociocultural, and economic dimensions, while the mode value range was 2.0–3.0 (62.0%, 60.2%, 53.4%), followed by 3.0–4.0 (23.6%, 26.3%, 32.5%), 1.0–2.0 (12.5%, 10.7%, 11.9%), and 4.0–5.0 (1.8%, 2.8%, 2.2%), respectively.

Figure 2.
Frequency distribution of the aggregate indicator values. n = 495. Mean ± Std.Dev.: Environmental Agg. = 2.58 ± 0.59, Sociocultural Agg. = 2.64 ± 0.59 Economic Agg. = 2.67 ± 0.66, Overall Agg. = 2.63 ± 0.52.
4.3. Factors Associated with Perceived Changes
Table 6 shows the results of SUR analysis of the factors associated with perceived changes in local conditions, where the dependent variables are the three aggregate indicators. The Breusch–Pagan test suggested that the error term from the three separate OLS regressions would be correlated and would have caused estimation bias, which has been corrected by the SUR model. Seven out of the nine factors affected the aggregate indicator of environmental conditions, two affected the sociocultural indicator, and none affected the economic indicator. Gender appeared to have no significant influence on sociocultural and economic conditions in the locality while it showed a significant effect on the environmental indicator. This suggests that female residents were more likely to perceive improvement or less deterioration in environmental conditions than male residents. The quantitative interpretation is that the aggregate indicator value would decrease by 0.10 on average when switching the sex from male to female while keeping all other factors in the model constant. The result also reveals no statistically significant effect of age on any of the three aggregate indicators.
Table 6.
Factors associated with the three aggregate indicators of local changes: seemingly unrelated regression (SUR).
Duration of residency in Phuket was negatively linked to environmental and sociocultural indicators. The longer they had resided in Phuket, the more unfavorable changes were perceived. Compared to those who had resided for less than 11 years, those who had lived longer had the environmental indicator values lower by 0.20–0.21 on average, holding other variables unchanged. Besides, those who had lived in Phuket for 11–20 years perceived sociocultural changes more negatively than those who lived shorter. Residency duration, however, did not influence the perceived economic changes.
Residential district was found to be associated with perception of environmental changes. Those in Thalang district tended to perceive less favorable environmental changes than those in the other districts. In contrast, residential district appeared to have no influence on sociocultural and economic changes. Having a job in the tourism sector was associated with perceived environmental changes. Those with a job directly and indirectly related to tourism were more likely to perceive deterioration in environmental conditions than those whose job was unrelated to tourism. The result showed a significant negative effect of formal education on perceived environmental changes. Those with a university degree tended to perceive environmental deterioration compared to those who had not completed university studies. On the other hand, no significant influence of education was found on perceived sociocultural and economic changes.
Somewhat surprisingly, no significant effect of income was found on any of the indicators. Interaction with tourists had a significant influence on the environmental indicator. Residents with regular interaction with tourists tended to perceive improvement in environmental conditions in comparison to those with less interaction with tourists. Again, this factor had no significant influence on sociocultural and economic conditions. The result shows that participation in tourism activities led to favorable perception of environmental and sociocultural changes, whereas it had no effect on perceived economic conditions. However, frequent participation did not seem to enhance the perception further.
4.4. Sub-Indicator Analysis
To examine which specific sub-indicators contributed to the results in Section 4.3, Table 7, Table 8 and Table 9 present the ordered probit regression analysis of sociodemographic factors associated with each sub-indicator of perceived changes in local conditions. Table 7 suggests that the gender effect found on the aggregate environmental indicator was due to its effect on public space, where female residents were more likely to perceive favorable changes in availability and quality of public space. The negative effect of residency duration on the aggregate environmental indicator was through seven sub-indicators, namely, air pollution, noise pollution, waste problems, beach quality, public space, water quality, and city planning. In particular, air pollution, noise pollution, waste problems, and water quality were the most significant elements in which negative changes were perceived by long-term residents of Phuket.
Table 7.
Factors associated with the environmental sub-indicators: ordinal logistic regression.
Table 8.
Factors associated with the sociocultural sub-indicators: ordinal logistic regression.
Table 9.
Factors associated with the economic sub-indicators: ordinal logistic regression.
The negative fixed effect of Thalang district on the aggregate environmental indicator was through five sub-indicators, where residents in Thalang were more likely to perceive unfavorable changes related to air pollution, waste problems, beach quality, public space, and city planning. The negative effect of having tourism-related jobs came through two sub-indicators, namely, air pollution and public space. The negative effect of education was due to its effect on two sub-indicators, where those with university degrees tended to perceive increased levels of air pollution and noise pollution. The positive effect of tourist interaction was through four sub-indicators: waste problems, public space, road conditions, and city planning. The positive effect of frequent participation in tourism activities was explained by its effect on four sub-indicators: air pollution, noise pollution, water pollution, and road conditions.
The sub-indicator analysis in Table 8 reveals that the negative effect of residency duration on the aggregate sociocultural indicator was due to its effect on three sub-indicators, namely, road accident problems, social conflict, and safety and security. The positive effect of participation in tourism activities was due to its effect on four sub-indicators: traffic accident problems, congestion, cultural conservation, and public participation. Although no effect was observed on the aggregate indicator, residency in Thalang district was found to be negatively associated with perceived changes in public transportation infrastructure and services, congestion, cultural conservation, and public participation. Likewise, those with university degrees tended to perceive unfavorable changes in cultural conservation.
Although no effect of these factors was found on the aggregate economic indicators. The sub-indicator analysis in Table 9 reveals that women were more likely to perceive improved income distribution. Longer-term residents were more likely to perceive increases in costs of living. Moreover, residents in Thalang and Mueang districts were more likely to perceive decreases in job opportunities than those in Kathu district. Similarly, those with university degrees tended to perceive decreases in job opportunities. On the other hand, those regularly interacting with tourists were more likely to perceive social inequality, while those engaged regularly in tourism activities tended to perceive improved income distribution and increased job opportunities.
5. Discussions
In light of tourism planning and management in Phuket, the study may offer a multidimensional view of how residents perceived changes in local conditions with tourism development. While the aggregate indicators indicated the overall decline in local conditions, the declining tendency was most salient in the environmental dimension and least in the economic dimension.
Residents in Phuket generally observed a surge in environmental problems. Of primary concern appear to be issues surrounding solid waste disposal, air and water pollution, noise, and road conditions. As noted by Thongphon, Aree, and Patarapong [142], waste management systems (land fill and incineration) in Phuket were not capable of coping with the rising levels of waste emissions by residents and visitors. Furthermore, the Pollution Control Department (PCD) reported in 2019 [143] that the water treatment facilities in Phuket did not possess enough capacity to treat the existing wastewater discharges, most of which were not even connected to treatment facilities. The environmental concerns perceived by Phuket residents, if not effectively addressed by provincial officials, may continue to escalate and might ultimately lower the living standards. Similar environmental challenges have been observed and documented in other popular island tourism destinations such as the Bahamas, Maldives, Tuvalu [144], Bali, Fiji, and Hawaii [145]. Tropical islands tend to have limited resources and yet attract a large number of visitors, exceeding their carrying capacity [146].
With regard to sociocultural conditions, a large portion of residents perceived aggravation in traffic accidents, congestion, lack of public transportation, and crime rates. In fact, traffic injury cases increased from 6705 in 2015 to 10,108 in 2019 [119]. Although the numbers involving tourists were unknown, car and motorcycle rentals by the increasing number of tourists may be one of the contributors. The aggravation in congestion may allude to the issue of overtourism [147,148] by which some parts of the island may have experienced high densities of tourism activities. Congestion or overcrowding is regarded as one of the underlying drivers of environmental, sociocultural, and economic indicators [149]. Fox [150] reported in Mauritius that due to the lack of public transport options, most tourists had to rent a motor vehicle, leading to traffic congestion. Furthermore, Phuket Provincial Police [151] reported that the number of drug and criminal arrest cases increased from 3407 in 2011 to 5905 in 2016 in Phuket, which may explain our findings on the residents’ perception. Soontayatron [129] found in Samui Island of Thailand that tourism development led to an increase in congestion, slum areas, crime rates, and drug abuse.
At the same time, residents perceived contribution of tourism development to preservation of cultural heritages. The finding may reflect the efforts of local authorities to promote cultural tourism, particularly in relation to traditional cuisine and Sino-Portuguese architecture [152,153] as exemplified by the UNESCO award of “the Creative City of Gastronomy” in 2015.
Phuket residents also perceived changes concerning economic aspects, particularly rising prices of goods, services, land, and housing. This is a common characteristic of tourism development among established island destinations [154]. As international tourists visiting island resorts in developing countries generally exert greater purchasing power than local population, the influx of consumption often leads to moderate inflation locally, including the land price [155,156].
On the bright side, a considerable proportion of residents reported favorable changes in public space conditions, urban planning, and beach quality. For the past several years, as part of the Provincial Tourism Strategic Plan, Phuket municipalities invested in the installation of public lightning, surveillance cameras, and trash receptacles at various tourist attractions around the island, leading in part to improvement in hygiene standards, safety, security, and tourist confidence levels [157]. Several studies suggest that when tourism planners strive to ensure attractive environments, tourism development may contribute to improving public space management [158,159]. In general, better care and cleaning of public spaces contribute to hygiene, while better lighting contributes to enhancing safety and security [109,110,111].
The results also suggested that more than a few residents benefited from long-term economic contributions from the tourism industry through increased job opportunities and improved income distribution. In 2017, average monthly household income in Phuket was THB 39,593, much higher than the national average of THB 26,946, whilst the minimum daily wage was the highest (THB 346) among all provinces in Thailand [160].
By examining the relationship between the sociodemographic profile of residents and their perception of changes in local conditions, it was found that women were more positive about environmental changes than men, particularly regarding public space. Some research showed that the design and availability of public spaces had greater impacts on the daily lives of women than men; for instance, how safe women felt in that public space [161,162,163]. Private sector companies created shopping attractions targeting female groups such as central festivals, villa markets, and the Old Town night market. On the other hand, some studies showed that gender was a predictor of both positive and negative perceptions toward tourism development [41,49,85,96].
While McGehee and Anderek [2] found no significant relation between education and perceived impacts of tourism development, our results indicate that those with higher education tended to recognize unfavorable changes in local conditions than the less educated, particularly in the issues of air and noise pollution, cultural conservation, and job opportunities. This is consistent with Ko and Stewart [17] who observed that educated people were often more concerned about negative aspects of tourism development as education helped raise awareness of various environmental and social issues. The declining job opportunities for highly educated people may be linked to increased demand for unskilled labor required to assist and support tourists. As tourism is a labor-intensive industry, a significant proportion of income is derived from wages for serving the needs of tourists [163]. Moreover, various studies reported that managerial and executive positions in the tourism industry are often assumed by expatriates whilst local residents tend to be engaged with relatively unskilled and low-paid jobs [149,164,165,166]. In contrast, Almeida et al. [32] found in Benalmádena, Spain that educated residents benefited from employment opportunities in the tourism sector.
Residents in Thalang district perceived changes in environmental conditions more negatively than those in Kathu and Mueang districts. A possible reason is that over the past decade, there has been substantial investment in Thalang for accommodations, marinas, and tourist attractions [167], which suggests that Thalang residents noted rapid changes in physical environments. In fact, there was a marina development project at Ao Kung Bay, which was opposed by residents, resulting in the project withdrawal [168]. On the other hand, residents in Kathu perceived increased job opportunities in comparison to Thalang and Mueang. This may be because Kathu is home to major shopping centers—namely Central Phuket Festival, Central Floresta, King Power, Jungceylon Shopping Center, Decathlon Phuket, and GMS Duty Free—likely contributing to a significant increase in employment [169].
The study found that longer-term residents tended to perceive unfavorable changes in environmental and sociocultural conditions. This is consistent with several previous studies showing the link between residency duration and perceived negative impacts of tourism on their communities [32,76,91,170]. Sheldon and Abenoja [91] found in Waikiki, Hawaii that longer-term residents were more sensitive to the sociocultural impacts of tourism development. Likewise, Almeida et al. [32] found in Benalmadena of Spain that native residents generally perceived impacts of tourism less favorably on environmental and sociocultural conditions, with evidence that their perception toward tourism worsened after 5–10 years of residence. It must be noted, however, that in the current study, duration of residency was not associated with perceived changes in economic conditions.
Income levels were not related to perception of changes in local conditions, which is consistent with findings of McGehee and Anderek [2]; Latkova and Vogt [94]; Hao, Long, and Kleckley [171]; and Korça [172]. Residents employed in the tourism sector were more likely to perceive unfavorable changes in air pollution, public space, and public transportation than those working in other sectors. This may be because those in the tourism industry are more exposed to outdoor activities and may therefore be more aware of those changes. This is echoed by the findings in Ghana [84] and India [173] similarly reporting the linkage between tourism-related jobs and negative perception toward tourism development, particularly as it concerned environmental aspects. On the contrary, in developed countries, those in the tourism sector seemed to have rather favorable perception toward tourism development compared to those in non-tourism industries [1,11,27,31,49,71,89] presumably owing to better environmental management as well as higher living standards.
Lastly, residents who had more interaction with tourists were more likely to perceive favorable changes in environmental conditions. Previous studies found that residents interacting with tourists tended to have favorable perception of tourism development in general [1,33,174,175]. In our study, however, those with tourist interaction were more likely to observe widening social inequality, whereas those who were regular tourists themselves tended to perceive increased job opportunities. In tourism host communities, daily interaction with tourists inevitably influences the recognition of social and cultural differences between tourists and residents. Williams [176] observed that while tourists tend to exhibit extravagant lifestyles during their vacation, such consumption behaviors do not necessarily reflect their mode of everyday life at their hometowns.
6. Conclusions
While there is mounting literature on residents’ perception of tourism development in general, this study is the first from Phuket that quantitatively analyzes multidimensional local changes as perceived by residents. The results may provide the basis for tourism authorities to identify and address specific issues that are of concern to residents in major island destinations in the developing region. While the five-year strategic tourism plan for Phuket stipulated sustainability as integral part of it, our empirical findings alluded to a development dilemma on the island. Unbridled growth and development of the tourism sector appears to be reaching a point where the majority of the local population have observed some unfavorable changes. Part of this dilemma may be due to the emphasis on economic indicators such as income levels, employment rates, and tourism revenue. Our findings imply the importance of utilizing a broader range of insight into environmental and sociocultural changes in conjunction with the economic indicators in evaluating the progress of tourism development in Phuket.
More specifically, the study provides several policy recommendations based on the analytical results. First, tourism planners and policy makers ought to recognize the differences in perceptions across sociodemographic segments (e.g., female vs. male, residential location, residency duration). On the whole, long-term residents appear to represent a source of insight. Hence, it would be worth soliciting public comments from this segment of local population, which may inform planners in understanding the issues within the community, thereby leading to more compatible and sustainable development in the future. Second, the positive effects of participation in tourism activities suggest that staycation tourism should be promoted for residents in Phuket, which will contribute to sensitizing locals to tourism activities in the island. This will also help reduce the industry’s dependence on international tourists, serving as adaptation to the new normal with the COVID-19 pandemic. Future research should explore motivation and behavior behind local tourists in order to effectively promote staycation tourism. Third, as Phuket seems to have undergone uneven expansion of tourism, it is recommended that an inclusive approach be adopted instead of the exclusive approach of serving a specific segment of people or tourists in certain tourism spots. For instance, pollution in Thalang would require more attention whilst job opportunities in Kathu should spill over to Thalang and Muang. A partnership between local governments, the private sector, and residents should be organized and reinforced for symbiotic relationship toward sustainable development, while ensuring the relevant background on environmental, sociocultural, and economic issues.
Lastly, several limitations of this study should be noted. First, since studies on the nexus between residents and tourism development are limited in Thailand, the theoretical framework was based on research in other countries, which might not be entirely relevant. Further research needs to accumulate evidence in other parts of Thailand, which will contribute to building a theoretical framework potentially more suited to this country. Second, this research largely employed quantitative methods to establish the effects of key variables on residents’ perception of changes associated with tourism development. Although the quantitative approach is conducive to generalization of findings and external applicability of implications, it may not adequately elucidate in-depth reasons behind the findings. Qualitative exploration may supplement to advance the implications from this study. Third, the data collection process was non-randomized. While it is indeed useful from the practical perspective, the sampled residents may not be an accurate representation of the whole resident population. Further studies based on probability sampling may help enhance the degree of representation of population.
Author Contributions
P.T.: conceptualization, data curation, investigation, and writing—original draft. T.W.T.: conceptualization, methodology, formal analysis, supervision, and writing—review and editing. S.M.K.: investigation and methodology. R.P.S.: investigation and methodology. N.S.: conceptualization, investigation, and methodology. All authors have read and agreed to the published version of the manuscript.
Funding
The authors acknowledge funding for open access publication from the United Kingdom Research and Innovation’s Global Challenges Research Fund (UKRI GCRF) through the Trade, Development and the Environment Hub project (project number ES/S008160/1) led by the UN Environment Programme World Conservation Monitoring Centre (UNEP-WCMC). The field work was partly funded by the Royal Thai Government Fellowship granted to the first author.
Institutional Review Board Statement
Not applicable.
Informed Consent Statement
Not applicable.
Data Availability Statement
All data will be provided upon request.
Conflicts of Interest
The authors declare no conflict of interest.
References
- Andereck, K.L.; Valentine, K.M.; Knopf, R.C.; Vogt, C.A. Residents’ perceptions of community tourism impacts. Ann. Tour. Res. 2005, 32, 1056–1076. [Google Scholar] [CrossRef]
- McGehee, N.; Anderek, K. Factors predicting rural residents’ support for tourism. J. Travel Res. 2004, 43, 131–140. [Google Scholar] [CrossRef]
- Perdue, R.; Long, P.; Allen, L. Resident support for tourism development. Ann. Tour. Res. 1990, 17, 586–599. [Google Scholar] [CrossRef]
- Berno, T.; Bricker, K. Sustainable tourism development: The long road from theory to practice. Issues & challenge. Int. J. Econ. Dev. 2001, 3, 1–18. [Google Scholar]
- Butcher, J. Can ecotourism contribute to tackling poverty? The importance of ‘symbiosis’. Curr. Issues Tour. 2011, 14, 295–307. [Google Scholar] [CrossRef]
- Iorio, M.; Corsale, A. Community-based tourism and networking: Viscri, Romania. J. Sustain. Tour. 2013, 22, 234–255. [Google Scholar] [CrossRef] [Green Version]
- Gursoy, D.; Rutherford, D.G. Host attitudes toward tourism: An improved structural model. Ann. Tour. Res. 2004, 31, 495–516. [Google Scholar] [CrossRef]
- Lepp, A. Residents’ attitudes towards tourism in Bigodi village, Uganda. Tour. Manag. 2007, 28, 876–885. [Google Scholar] [CrossRef]
- Dyer, P.; Gursoy, D.; Sharma, B.; Carter, J. Structural modeling of resident perceptions of tourism and associated development on the Sunshine Coast, Australia. Tour. Manag. 2007, 28, 409–422. [Google Scholar] [CrossRef]
- Inskeep, E. Tourism Planning–An Integrated and Sustainable Development Approach; Van Nostrand Reinhold: New York, NY, USA, 1991. [Google Scholar]
- Lankford, S.V.; Howard, D.R. Developing a tourism impact attitude scale. Ann. Tour. Res. 1994, 21, 121–139. [Google Scholar] [CrossRef]
- Cole, S. Information and empowerment: The keys to achieving sustainable tourism. J. Sustain. Tour. 2006, 14, 629–644. [Google Scholar] [CrossRef]
- Hall, M.C. Trends in Ocean and Coastal Tourism: The End of The Last Frontier? Ocean. Coast. Manag. 2001, 44, 601–618. [Google Scholar] [CrossRef]
- Miller, M. The rise of coastal and marine tourism. Ocean. Coast. Manag. 1993, 20, 181–199. [Google Scholar] [CrossRef]
- Reddy, M.V. Global tourism and travel industry: Performance during the double-dip recession and recommendations for transition to a green economy. World Financ. Rev. 2013, Jan-Feb, 26–31. [Google Scholar]
- World Bank. Pacific Possible Report. 2020. Available online: http://pubdocs.worldbank.org/en/95491462763645997/WB-PP-Tourism.pdf (accessed on 1 September 2020).
- Ko, D.W.; Stewart, W.P. A structural equation model of residents’ attitudes for tourism development. Tour. Manag. 2002, 23, 521–530. [Google Scholar] [CrossRef]
- Simpson, K. Strategic planning and community involvement as contributors to sustainable tourism development. Curr. Issues Tour. 2001, 4, 341. [Google Scholar] [CrossRef]
- Ruhanen, L. Strategic planning for local tourism destinations: An analysis of tourism plans. Tour. Hospit. Plan. Dev. 2004, 1, 239–253. [Google Scholar] [CrossRef] [Green Version]
- Simao, J.; Partidario, M. How does tourism planning contribute to sustainable development? Sustain. Dev. 2010, 20, 372–385. [Google Scholar] [CrossRef]
- Wall, G.; Mathieson, A. Tourism: Change, Impacts and Opportunities; Pearson Education Limited: Harlow, UK, 2006. [Google Scholar]
- Nunkoo, R.; Ramkissoon, H. Power, trust, social exchange and community support. Ann. Tour. Res. 2012, 39, 997–1023. [Google Scholar] [CrossRef]
- Brunt, P.; Courtney, P. Host perceptions of sociocultural impacts. Ann. Tour. Res. 1999, 26, 493–515. [Google Scholar] [CrossRef]
- Tsai, H.; Huang, W.-J.; Li, Y. The Impact of tourism resources on tourism real estate value. Asia Pac. J. Tour. Res. 2016, 21, 1114–1125. [Google Scholar] [CrossRef]
- Backman, K.F.; Backman, S.J. An Examination of the Impacts of Tourism in a Gateway Community. Development in Quality of Life Studies; Meadow, H.L., Ed.; International Society for Quality of Life Studies: Blacksburg, VA, USA, 1997. [Google Scholar]
- Lindberg, K.; Johnson, R.L. Modeling resident attitudes toward tourism. Ann. Tour. Res. 1997, 24, 402–424. [Google Scholar] [CrossRef]
- Milman, A.; Pizam, A. Social impacts of tourism on Central Florida. Ann. Tour. Res. 1988, 15, 191–204. [Google Scholar] [CrossRef]
- Lankford, S.V. Attitudes and perceptions toward tourism and rural regional development. J. Travel Res. 1994, 32, 35–43. [Google Scholar] [CrossRef]
- Carter, R.W.; Beeton, R.J.S. A model of cultural change and tourism. Asia Pac. J. Tour. Res. 2004, 9, 423–442. [Google Scholar] [CrossRef]
- Nunkoo, R.; Smith, S.L.; Ramkissoon, H. Residents’ attitudes to tourism: A longitudinal study of 140 articles from 1984 to 2010. J. Sustain. Tour. 2013, 21, 5–25. [Google Scholar] [CrossRef]
- Haralambopoulos, N.; Pizam, A. Perceived impacts of tourism: The case of Samos. Ann. Tour. Res. 1996, 23, 503–526. [Google Scholar] [CrossRef]
- Almeida-García, F.; Fernández, M.P.; Balbuena-Vázquez, A.; Macías, R.C. Residents’ perceptions of tourism development in Benalmádena (Spain). Tour. Manag. 2016, 54, 259–274. [Google Scholar] [CrossRef] [Green Version]
- Akis, S.; Peristianis, N.; Warner, J. Residents’ attitudes to tourism development: The case of Cyprus. Tour. Manag. 1996, 17, 481–494. [Google Scholar] [CrossRef]
- Rasoolimanesh, S.M.; Ringle, C.; Jaafar, M.; Ramayah, T. Urban vs. rural destinations: Residents’ perceptions, community participation and support for tourism development. Tour. Manag. 2017, 60, 147–158. [Google Scholar] [CrossRef]
- Stylidis, D.; Biran, A.; Sit, J.; Szivas, E. Residents’ support for tourism development: The role of residents’ place image and perceived tourism impacts. Tour. Manag. 2014, 45, 260–274. [Google Scholar] [CrossRef]
- Getz, D. Residents’ Attitudes Towards Tourism: A Longitudinal Study in Spey Valley, Scotland. Tour. Manag. 1994, 15, 247–258. [Google Scholar] [CrossRef]
- Vargas-Sánchez, A.; Plaza-Mejía, M.; Porras-Bueno, N. Understanding residents’ attitudes toward the development of industrial tourism in a former mining community. J. Travel Res. 2008, 47, 373–387. [Google Scholar] [CrossRef]
- Baum, T. Revisiting the TALC: Is there an Off-Ramp? In R.W. The Tourism Area Life Cycle: Conceptual and theoretical issues; Channel View Publications: Clevedon, UK, 2006. [Google Scholar]
- Sharpley, R. Host perceptions of tourism: A review of the research. Tour. Manag. 2014, 42, 37–49. [Google Scholar] [CrossRef]
- Oppermann, M.; Chon, K. Convention participation decision-making process. Ann. Tour. Res. 1997, 24, 178–191. [Google Scholar] [CrossRef]
- Nunkoo, R.; Gursoy, D. Residents’ support for tourism: An identity perspective. Ann. Tour. Res. 2012, 39, 243–268. [Google Scholar] [CrossRef]
- Yu, C.P.; Chancellor, H.C.; Cole, S.T. Measuring residents’ attitudes toward sustainable tourism: A reexamination of the sustainable tourism attitude scale. J. Travel Res. 2009, 50, 57–63. [Google Scholar] [CrossRef]
- Yoon, Y.; Gursoy, D.; Chen, J.S. Validating a tourism development theory with structural equation modeling. Tour. Manag. 2001, 22, 363–372. [Google Scholar] [CrossRef]
- Prayag, G.; Hosany, S.; Nunkoo, R.; Alders, T. London residents’ support for the 2012 Olympic Games: The mediating effect of overall attitude. Tour. Manag. 2013, 36, 629–640. [Google Scholar] [CrossRef]
- Allen, L.R.; Long, P.T.; Perdue, R.R.; Kieselbach, S. The impact of tourism development on residents’ perceptions of community life. J. Travel Res. 1988, 27, 16–21. [Google Scholar] [CrossRef]
- Pearce, J.A. Host community acceptance of foreign tourists. Strategic Considerations. Ann. Tour. Res. 1980, 7, 224–233. [Google Scholar] [CrossRef]
- Johnson, J.; Snepenger, D.; Akis, S. Residents’ perceptions of tourism development. Ann. Tour. Res. 1994, 21, 629–642. [Google Scholar] [CrossRef]
- Teo, P. Assessing socio-cultural impacts: The case of Singapore. Tour. Manag. 1994, 15, 126–136. [Google Scholar] [CrossRef]
- Snaith, T.; Haley, A. Residents’ opinions of tourism development in the historic city of York, England. Tour. Manag. 1999, 20, 595–603. [Google Scholar] [CrossRef]
- Ludwig, H. Environmentalism and Phuket: A Case Study. Sawaddi Magazine, 19 June 1976; 14–17. [Google Scholar]
- Tourism Authority of Thailand (TAT). Internal Documents from Statistics and Research Division; Tourism Authority of Thailand: Bangkok, Thailand, 1997.
- Phuket Provincial Statistical Report Office. 2016. Available online: http://phuket.nso.go.th/images/new/intereststat/provincialstatreport/2560/chapter1760.pdf (accessed on 1 January 2018).
- Lindsay, P.; Norman, D.A. Human Information Processing: An Introduction to Psychology; Academic Press: Cambridge, MA, USA, 2013. [Google Scholar]
- Pickens, J. Attitudes and Perceptions. In Organizational Behavior in Health Care; Jones and Bartlett Publishers: Sudbury, MA, USA, 2005; pp. 43–75. [Google Scholar]
- Bonnes, M.; Lee, T.; Bonaiuto, M. Psychological Theories for Environmental Issues; Ashgate Publishing, Ltd.: Burlington, VT, USA, 2003. [Google Scholar]
- Ap, J. Residents’ perceptions on tourism impacts. Ann. Tour. Res. 1992, 19, 665–690. [Google Scholar] [CrossRef]
- Gursoy, D.; Jurowski, C.; Uysal, M. Resident attitudes. A structural modeling approach. Ann. Tour. Res. 2002, 29, 79–105. [Google Scholar] [CrossRef]
- Jurowski, C.; Uysal, M.; Williams, D.R. A theoretical analysis of host community resident reactions to tourism. J. Travel Res. 1997, 36, 3–11. [Google Scholar] [CrossRef]
- Nicholas, L.N.; Thapa, B.; Ko, Y.J. Residents’ perspectives of a world heritage site: The Pitons management area, St. Lucia. Ann. Tour. Res. 2009, 36, 390–412. [Google Scholar] [CrossRef]
- Wang, Y.; Pfister, R.E. Residents’ attitudes toward tourism and perceived personal benefits in a rural community. J. Travel Res. 2008, 47, 84–93. [Google Scholar] [CrossRef]
- Jurowski, C.; Gursoy, D. Distance effects on residents’ attitudes toward tourism. Ann. Tour. Res. 2004, 31, 296–312. [Google Scholar] [CrossRef]
- Brida, J.G.; Disegna, M.; Osti, L. Residents’ perceptions of tourism impacts and attitudes towards tourism policies in a small mountain community. Benchmark. Int. J. Forthcom. 2011, 18, 359–385. [Google Scholar] [CrossRef]
- Sharma, B.; Dyer, P. An investigation of differences in residents’ perceptions on the Sunshine Coast: Tourism impacts and demographic variables. Tour. Geogr. 2009, 11, 187–213. [Google Scholar] [CrossRef]
- Andereck, K.L.; Nyaupane, G.P. Exploring the nature of tourism and quality of life perceptions among residents. J. Travel Res. 2010, 50, 248–260. [Google Scholar] [CrossRef]
- Korça, P. Resident attitudes toward tourism impacts. Ann. Tour. Res. 1996, 23, 695–726. [Google Scholar] [CrossRef]
- Bestard, A.B.; Nadal, J.R. Modelling environmental attitudes toward tourism. Tour. Manag. 2007, 28, 688–695. [Google Scholar] [CrossRef]
- Besculides, A.; Lee, M.E.; McCormick, P.J. Residents’ perceptions of the cultural benefits of tourism. Ann. Tour. Res. 2002, 29, 303–319. [Google Scholar] [CrossRef]
- King, B.; Pizam, A.; Milman, A. Social impacts of tourism: Host perceptions. Ann. Tour. Res. 1993, 20, 650–665. [Google Scholar] [CrossRef]
- Long, T.P.; Perdue, R.R.; Allen, L. Rural resident tourism perceptions and attitudes by community level of tourism. J. Travel Res. 1990, 28, 3–9. [Google Scholar] [CrossRef]
- Cavus, S.M.; Tanrisevdi, A. Residents’ attitudes toward tourism development: A case study in Kusadasi, Turkey. Tour. Anal. 2003, 7, 259–269. [Google Scholar] [CrossRef]
- Andriotis, K.; Vaughan, D.R. Urban residents’ attitudes towards tourism development: The case of Crete. J. Travel Res. 2003, 42, 172–185. [Google Scholar] [CrossRef] [Green Version]
- Belisle, F.J.; Hoy, D.R. The perceived impact of tourism by residents: A case study in Santa Marta, Colombia. Ann. Tour. Res. 1980, 7, 83–101. [Google Scholar] [CrossRef]
- Andereck, K.L.; Vogt, C.A. The relationship between resident’s attitudes toward tourism and tourism development options. J. Travel Res. 2000, 39, 27–36. [Google Scholar] [CrossRef]
- Liu, J.C.; Var, T. Resident’s attitudes toward tourism impacts In Hawaii. Ann. Tour. Res. 1986, 13, 193–214. [Google Scholar] [CrossRef]
- Saveriades, A. Establishing the social tourism carrying capacity for the tourist resorts of the east coast of the Republic of Cyprus. Tour. Manag. 2000, 21, 147–156. [Google Scholar] [CrossRef]
- Madrigal, R. A tale of tourism in two cities. Ann. Tour. Res. 1993, 22, 336–353. [Google Scholar] [CrossRef]
- Var, T.; Kendall, K.W.; Tarakcioglu, E. Resident attitudes towards tourists in a Turkish resort town. Ann. Tour. Res. 1985, 12, 652–658. [Google Scholar] [CrossRef]
- Ap, J.; Crompton, J.L. Developing and testing a tourism impact scale. J. Travel Res. 1998, 37, 120–131. [Google Scholar] [CrossRef]
- Nunkoo, R.; Ramkissoon, H. Small island urban tourism: A residents’ perspective. Curr. Issues Tour. 2010, 13, 37–60. [Google Scholar] [CrossRef]
- Harrill, R. “Residents’ Attitudes Toward tourism Development: A Literature Review with Implications for Tourism Planning”. J. Plan. Lit. 2004, 18, 251–266. [Google Scholar] [CrossRef]
- Brida, J.G.; Osti, L.; Barquet, A. Segmenting resident perceptions towards tourism a cluster analysis with a multinomial logit model of a mountain community. Int. J. Tour. Res. 2010, 12, 591–602. [Google Scholar] [CrossRef]
- Cui, X.; Ryan, C. Perceptions of place, modernity and the impacts of tourism—Differences among rural and urban residents of Ankang, China: A likelihood ratio analysis. Tour. Manag. 2011, 32, 604–615. [Google Scholar] [CrossRef]
- Nyaupane, G.P.; Thapa, B. Perceptions of environmental impacts of tourism: A case study at ACAP, Nepal. Int. J. Sustain. Dev. World Ecol. 2006, 13, 51–61. [Google Scholar] [CrossRef]
- Teye, V.; Sirakaya, E.; Sonmez, S. Residents’ attitudes toward tourism development. Ann. Tour. Res. 2002, 29, 668–688. [Google Scholar] [CrossRef]
- Tosun, C. Host perceptions of impacts: A comparative tourism study. Ann. Tour. Res. 2002, 29, 231–253. [Google Scholar] [CrossRef]
- Pearce, P.L.; Moscardo, G.; Ross, G.F. Tourism Community Relationships; Pergamon: New York, NY, USA, 1996. [Google Scholar]
- Haley, A.J.; Snaith, T.; Miller, G. The social impacts of tourism: A case study of Bath, UK. Ann. Tour. Res. 2005, 32, 647–668. [Google Scholar] [CrossRef] [Green Version]
- Sheldon, P.; Var, T. Resident attitudes to tourism in North Wales. Tour. Manag. 1984, 5, 40–48. [Google Scholar] [CrossRef]
- Kuvan, Y.; Akan, P. Residents’ attitudes toward general and forest-related impacts of tourism: The case of Belek, Antalya. Tour. Manag. 2005, 26, 691–706. [Google Scholar] [CrossRef]
- Wan, Y.K.P.; Li, X. Sustainability of Tourism Development in Macao, China. Int. J. Tour. Res. 2013, 15, 52–65. [Google Scholar] [CrossRef]
- Sheldon, P.J.; Abenoja, T. Resident attitudes in a mature destination: The case of Waikiki. Tour. Manag. 2001, 22, 435–443. [Google Scholar] [CrossRef]
- Hernández, S.; Cohen, J.; García, H. Residents’ attitudes towards an instant resort enclave. Ann. Tour. Res. 1996, 23, 755–779. [Google Scholar] [CrossRef]
- Alrwajfah, M.M.; Almeida-García, F.; Cortés-Macías, R. Residents’ perceptions and satisfaction toward tourism development: A case study of Petra Region, Jordan. Sustainability 2019, 11, 1907. [Google Scholar] [CrossRef] [Green Version]
- Latkova, P.; Vogt, C.A. Residents’ attitudes toward existing and future tourism development in rural communities. J. Travel Res. 2012, 51, 50–67. [Google Scholar] [CrossRef]
- Kinnaird, V.; Hall, D. Understanding tourism processes: A gender-aware framework. Tour. Manag. 1996, 17, 95–102. [Google Scholar] [CrossRef]
- Mason, P.; Cheyne, J. Residents’ attitudes to proposed tourism development. Ann. Tour. Res. 2000, 27, 391–411. [Google Scholar] [CrossRef]
- Harrill, R.; Potts, T. Tourism Planning in Historic Districts: Attitudes toward Tourism Development in Charleston. J. Am. Plan Assoc. 2003, 69, 233–244. [Google Scholar] [CrossRef]
- Pechrida, P.; Weerakaset, S.; Hiroaki, S.; Piphat, S.; Kittipos, P.; Natchaya, S. Monitoring land use changes using remote sensing data and GIS techniques: A case study of Phuket Island after tsunami. In Proceedings of the 8th International Conference on Disaster Management, Building Design, Materials and Civil Engineering (DBMCE-17), Bangkok, Thailand, 25–25 December 2017. [Google Scholar]
- Yamane, T. Statistics, an Introductory Analysis, 2nd ed.; Harper and Row: New York, NY, USA, 1967. [Google Scholar]
- Ko, T.G. Development of a tourism sustainability assessment procedure: A conceptual approach. Tour. Manag. 2005, 26, 431–445. [Google Scholar] [CrossRef]
- McCool, S.F.; Moisey, R.N. Monitoring resident attitudes toward tourism. Tour. Anal. 1996, 1, 29–37. [Google Scholar]
- Upchurch, R.S.; Teivane, U. Resident perceptions of tourism development in Riga, Latvia. Tour. Manag. 2000, 21, 499–507. [Google Scholar] [CrossRef]
- Cottrell, S.; Van Der Duim, R.; Ankersmid, P.; Kelder, L. Measuring the sustainability of tourism in Manuel Antonio and Texel: A tourist perspective. J. Sustain. Tour. 2004, 12, 409–431. [Google Scholar] [CrossRef]
- Andereck, K.L. Environmental Consequences of Tourism: A Review of Recent Research. In Linking Tourism, the Environment, and Sustainability. Annual Meeting of the National Recreation and Park Association; McCool, S.F., Watson, A.E., Eds.; General Technical Report No. INT-GTR-323; US Department of Agriculture, Forest Service, Intermountain Research Station: Ogden, UT, USA, 1995; pp. 77–81. [Google Scholar]
- Mbaiwa, J. The socio-economic and environmental impacts of tourism development on the Okavango Delta, North-Western Botswana. J. Arid Environ. 2003, 54, 447–467. [Google Scholar] [CrossRef]
- Dodds, R.; Kelman, I. How climate change is considered in sustainable tourism policies: A case of the Mediterranean islands of Malta and Mallorca. Tour. Rev. Int. 2008, 12, 57–70. [Google Scholar] [CrossRef]
- Williams, A.T.; Micallef, A. Beach Management: Principles and Practice; Earthscan Publishers: London, UK, 2009. [Google Scholar]
- Zielinski, S.; Botero, C.M.; Yanes, A. To clean or not to clean? A critical review of beach cleaning methods and impacts. Mar. Pollut. Bull. 2019, 139, 390–401. [Google Scholar] [CrossRef]
- Dumont, E.; Ruelle, C.; Teller, J. Proactive Management of the Impact of Cultural Tourism upon Urban Resources and Economics, European Commission Project Report. 2005. Available online: https://cordis.europa.eu/project/id/502491/reporting (accessed on 25 July 2017).
- Law, C.M. Urban Tourism: The Visitor Economy and the Growth of Large Cities, 2nd ed.; Continuum: London, UK, 2002. [Google Scholar]
- Judd, D.R.; Fainstein, S.S. The Tourist City; Yale University Press: New Haven, CT, USA, 1999. [Google Scholar]
- Khadaroo, J.; Seetanah, B. Transport infrastructure and tourism development. Ann. Tour. Res. 2007, 34, 1021–1032. [Google Scholar] [CrossRef]
- Masson, S.; Petiot, R. Can the high speed rail reinforce tourism attractiveness? The case of the high speed rail between Perpignan (France) and Barcelona (Spain). Technovation 2009, 29, 611–617. [Google Scholar] [CrossRef]
- Medina, A.L. Possible effects of residential development on streamflow, riparian plant communities, and fisheries on small mountain streams in central Arizona. Forest Ecol. Manag. 1990, 33, 351–361. [Google Scholar] [CrossRef]
- Gössling, S.; Peeters, P.; Hall, C.; Ceron, J.; Dubois, G.; Lehmann, L.; Scott, D. Tourism and water use: Supply, demand, and security. An international review. Tour. Manag. 2012, 33, 1–15. [Google Scholar] [CrossRef]
- Bohdanowicz, P.; Martinac, I. Determinants and benchmarking of resource consumption in hotels a case study of Hilton International and Scandic in Europe. Energy Build. 2007, 39, 82–95. [Google Scholar] [CrossRef]
- Rico-Amoros, A.M.; Olcina-Cantos, J.; Sauri, D. Tourist land use patterns and water demand: Evidence from the western Mediterranean. Land Use Policy. 2009, 26, 493–501. [Google Scholar] [CrossRef]
- Virkar, A.; Mallya, P. A review of dimensions of tourism transport affecting tourism satisfaction. Indian J. Commer. Manag. Studies 2018, 9, 72–80. [Google Scholar] [CrossRef]
- Thailand Road Safety Collaboration Online Statistic Report. 2018. Available online: http://www.thairsc.com/ (accessed on 1 January 2018).
- Dredge, D. Networks, conflict and collaborative communities. J. Sustain. Tour. 2006, 14, 562–581. [Google Scholar] [CrossRef]
- Okazaki, E. A community-based tourism model: Its conception and use. J. Sustain. Tour. 2008, 16, 511–529. [Google Scholar] [CrossRef]
- Gascón, J. The limitations of community-based tourism as an instrument of development cooperation: The value of the social vocation of the territory concept. J. Sustain. Tour. 2012, 21, 1–16. [Google Scholar] [CrossRef]
- McGehee, N.G.; Andereck, K.L.; Vogt, C.A. An examination of factors influencing resident attitudes toward tourism in twelve Arizona communities. In Proceedings of the 33rd Annual Travel and Tourism Research Association Conference, Arlington, VA, USA, 23 June 2002. [Google Scholar]
- Bello, F.G.; Lovelock, B.; Carr, N. Constraints of community participation in protected area-based tourism planning: The case of Malawi. J. Ecotour. 2016, 1, 131–151. [Google Scholar] [CrossRef]
- Li, W. Community decision-making participation in development. Ann. Tour. Res. 2006, 33, 132–143. [Google Scholar] [CrossRef]
- Pasape, L.; Anderson, W.; Lindi, G. Towards sustainable ecotourism through stakeholder collaborations in Tanzania. J. Hosp. Tour. 2013, 2, 1–14. [Google Scholar] [CrossRef]
- Ramchander, P. Towards the Responsible Management of the Socio-Cultural Impact of Township Tourism. In Tourism and Politics: Global Frameworks and Local Realities; Elsevier: Amsterdam, The Netherlands, 2003; pp. 149–173. [Google Scholar]
- Tosun, C.; Timothy, D.J.; Öztürk, Y. Tourism growth, national development and regional inequality in Turkey. J. Sustain. Tour. 2003, 11, 133–161. [Google Scholar] [CrossRef]
- Soontayatron, S. Socio-Cultural Changes in Thai Beach Resorts: A Case Study of Koh Samui Island, Thailand. Ph.D. Thesis, Bournemouth University, Poole, UK, 2010. [Google Scholar]
- Rasoolimanesh, S.M.; Jaafar, M.; Kock, N.; Ramayah, T. A revised framework of social exchange theory to investigate the factors influencing residents’ perceptions. Tour. Manag. Perspect. 2015, 16, 335–345. [Google Scholar] [CrossRef]
- Choi, H.C.; Sirakaya, E. Sustainability Indicators for Managing Community Tourism. Tour. Manag. 2006, 27, 1274–1289. [Google Scholar] [CrossRef]
- Manyara, G.; Jones, E. Community-based tourism enterprises development in Kenya: An exploration of their potential as avenues of poverty reduction. J. Sustain. Tour. 2007, 15, 628–644. [Google Scholar] [CrossRef]
- Nardo, M.; Saisana, M.; Saltelli, A.; Tarantola, S. Tools for Composite Indicators Building; European Commission, Institute for the Protection and Security of the Citizen, JRC: Ispra, Italy, 2005. [Google Scholar]
- Cronbach, L.J. Coefficient alpha and the internal structure of tests. Psychometrika 1951, 16, 297–334. [Google Scholar] [CrossRef] [Green Version]
- Srivastava, V.K.; Giles, D.E.A. Seemingly Unrelated Regression Equations Models: Estimation and Inference; CRC Press: Cleveland, OH, USA, 2020. [Google Scholar]
- Zellner, A. An efficient method of estimating seemingly unrelated regressions and tests for aggregation bias. J. Am. Stat Assoc. 1962, 57, 348–368. [Google Scholar] [CrossRef]
- Breusch, T.S.; Pagan, A.R. The lagrange multiplier test and its applications to model specification in econometrics. Review of economic studies, Oxf. Univ. Press 1980, 47, 239–253. [Google Scholar] [CrossRef]
- Moon, H.R.; Perron, P. Efficient estimation of SUR cointegration regression model and testing for purchasing power parity. Econom. Rev. 2005, 23, 293–323. [Google Scholar] [CrossRef]
- Agresti, A. Analysis of Ordinal Categorical Data, 2nd ed.; John Wiley & Sons: Hoboken, NJ, USA, 2010. [Google Scholar]
- Harvey, M.J.; Hunt, J.; Harris, C.C. Gender and community tourism dependence level. Ann. Tour. Res. 1995, 22, 349–366. [Google Scholar] [CrossRef]
- Tomljenovic, R.; Faulkner, B. Tourism and older residents in a sunbelt resort. Ann. Tour. Res. 2000, 27, 93–114. [Google Scholar] [CrossRef]
- Thongphon, P.N.S.; Aree, N.; Patarapong, K. Sustainable tourism development and management in the Phuket Province, Thailand. Asian Soc. Sci. 2013, 9, 45–84. [Google Scholar]
- Pollution Control Department (PCD). Annual Report of Cluster Wastewater Treatment. 2019. Available online: https://www.pcd.go.th/publication/4352/ (accessed on 2 January 2020).
- Gossling, S.; Hall, C.M.; Scott, D. The Challenges of Tourism As a Development Strategy in an Era of Global Climate Change. In Rethinking Development in a Carbon-Constrained World: Development Cooperation and Climate Change; Palosou, E., Ed.; Ministry of Foreign Affairs: Helsinki, Finland, 2009; pp. 100–119. [Google Scholar]
- Apostolopoulos, Y.; Gayle, D.J. Island Tourism and Sustainable Development: Caribbean, Pacific, and Mediterranean Experiences; Greenwood Publishing Group Editors: Santa Barbara, CA, USA, 2002. [Google Scholar]
- Hall, M.C. Island destinations: A natural laboratory for tourism: Introduction. Asia Pac. J. Tour. Res. 2010, 15, 245–249. [Google Scholar] [CrossRef] [Green Version]
- Innerhofer, E.; Erschbamer, G.; Pechlaner, H. Overtourism: 3The Challenge of Managing the Limits; Routledge: Oxfordshire, UK, 2019; pp. 3–13. [Google Scholar]
- Gonzalez, V.M.; Coromina, L.; Galí, N. Overtourism: Residents’ perceptions of tourism impact as an indicator of resident social carrying capacity-case study of a Spanish heritage town. Tour. Rev. 2018, 73, 277–296. [Google Scholar] [CrossRef]
- Mihalic, T. Conceptualising overtourism: A sustainability approach. Ann. Tour. Res. 2020, 84, 03025. [Google Scholar] [CrossRef]
- Fox, H. Republic of Mauritius: Integrated National Transport Strategy Study—Integrated Transport Strategy Report (Final); MDS Transmodal: Chester, UK, 2001. [Google Scholar]
- Phuket Provincial Police. Statistical Record Security in Life, Mind and Property. 2016. Available online: http://phuket.nso.go.th/images/new/mindmap_statEX/data/datay3.pdf (accessed on 2 January 2020).
- Nobuto, K. Community Reconstruction Through Cultural Identity Regeneration Tourism and Creativity in Phuket, Thailand; Department of Asian Culture and Urbanism, Osaka City University: Osaka, Japan, 2016. [Google Scholar]
- Krasae-in, A.; Rodjanathum, N. Tourism experience through food design: Case of the city of Phuket. In Experiencing Food, Designing Dialogues, Proceedings of the 1st International Conference on Food Design and Food Studies (EFOOD 2017), Lisbon, Portugal, 19–21 October 2017; CRC Press: Boca Raton, FL, USA, 2018; p. 77. [Google Scholar]
- Gössling, S. Tourism and Development in Tropical Islands: Political Ecology Perspectives; Edward Elgar Publishing Ltd.: Cheltenham, UK, 2003. [Google Scholar]
- Stylidis, D.; Terzidou, M.; Terzidis, K. Island tourism and its socio-economic impacts. MIBES 2007, 2007, 954–967. [Google Scholar]
- Briguglio, L.; Briguglio, M.; Sustainable Tourism in Small Islands. The Case of Malta. 1996. Available online: https://sustainabledevelopment.gov.mt/en/Documents/National-Strategy/Sustainable-Tourism-in-Small-Islands.pdf (accessed on 2 January 2020).
- Phuket Provincial Statistic Office. Phuket Tourism Strategic Plan Report. 2020. Available online: http://phuket.nso.go.th/index.php?option=com_content&view=article&id=438&Itemid=641 (accessed on 2 September 2020).
- Maitland, R. Culture, City Users and the Creation of New Tourism Areas in Cities. In Tourism, Culture and Regeneration; CABI: Wallingford, UK, 2007; pp. 25–34. [Google Scholar]
- Mordue, T. Tourism, urban governance and public space. Leis. Stud. 2007, 26, 447–462. [Google Scholar] [CrossRef]
- OMS Andaman. Southern Andaman Cluster Strategic Planning 2019–2022. Available online: http://www.osmsouth-w.moi.go.th/main/post/3192g (accessed on 20 July 2020).
- Valentine, G. Women’s fear and the design of public space. Built Environ. 1990, 16, 288–303. [Google Scholar]
- Garcia-Ramon, M.D.; Ortiz, A.; Prats, M. Urban planning, gender and the use of public space in a peripheral neighborhood of Barcelona. Cities 2004, 21, 215–223. [Google Scholar] [CrossRef]
- World Travel and Tourism Council. Travel and Tourism Economic Impact 2015 World. Available online: https://caribbeanhotelandtourism.com/wp-content/uploads/data_center/global/WTTC-WorldEconomicReport2015.pdf (accessed on 20 July 2020).
- Daldeniz, B.; Hampton, M.P. Dive tourism and local communities: Active participation or subject to impacts? Case studies from Malaysia. Int. J. Tour. Res. 2012, 15, 507–520. [Google Scholar] [CrossRef] [Green Version]
- Lee, D.; Hampton, M.; Jeyacheya, J. The political economy of precarious work in the tourism industry in small island developing states. Rev. Int. Polit. Econ. 2014, 22, 194–223. [Google Scholar] [CrossRef] [Green Version]
- Mbaiwa, J.E. Poverty or riches: Who benefits from the booming tourism industry in Botswana? J. Contemp. Afr. Stud. 2017, 35, 93–112. [Google Scholar] [CrossRef]
- Achadthaya, C. Bangkokpost. Sailing into the Future in Phuket. 2019. Available online: https://www.bangkokpost.com/business/1732031/sailing-into-the-future-in-phuket (accessed on 20 July 2020).
- Tanutam, T. Phuket’s Ao Kung Residents Oppose Marina Project. Thethaiger. 2018. Available online: https://thethaiger.com/news/phukets-ao-kung-residents-oppose-marina-project (accessed on 20 July 2020).
- Legacy Phuket Gazette. CPN Invests B20bn into New Central Phuket. Thethaiger. 2016. Available online: https://thethaiger.com/news/phuket/phuket-lands-b20bn-slice-mall-group-b80bn-shopping-center-mega-projects (accessed on 20 July 2020).
- McCool, S.; Martin, S. Community Attachment and Attitudes toward Tourism Development. J. Travel Res. 1994, 32, 29–34. [Google Scholar] [CrossRef]
- Hao, H.; Long, P.; Kleckley, J. Factors Predicting Homeowners’ Attitudes toward Tourism: A Case of a Coastal Resort Community. J. Travel Res. 2010, 50, 627–640. [Google Scholar] [CrossRef]
- Korça, P. Resident perceptions of tourism in a resort town. Leis. Sci. 1998, 20, 193–212. [Google Scholar] [CrossRef]
- Xiaoming, L.; Jun, L. Host Perceptions of Tourism Impact and Stage of Destination Development in a Developing Country. Sustainability 2018, 10, 2300. [Google Scholar] [CrossRef] [Green Version]
- Brougham, J.; Butler, R. A segmentation analysis of resident attitudes to the social impact of tourism. Ann. Tour. Res. 1981, 8, 569–589. [Google Scholar] [CrossRef]
- Weaver, D.B.; Lawton, L.J. Resident perceptions in the urban–rural fringe. Ann. Tour. Res. 2001, 28, 439–458. [Google Scholar] [CrossRef]
- Williams, S. Tourism Geography; Routledge: New York, NY, USA, 1998; p. 150. [Google Scholar]
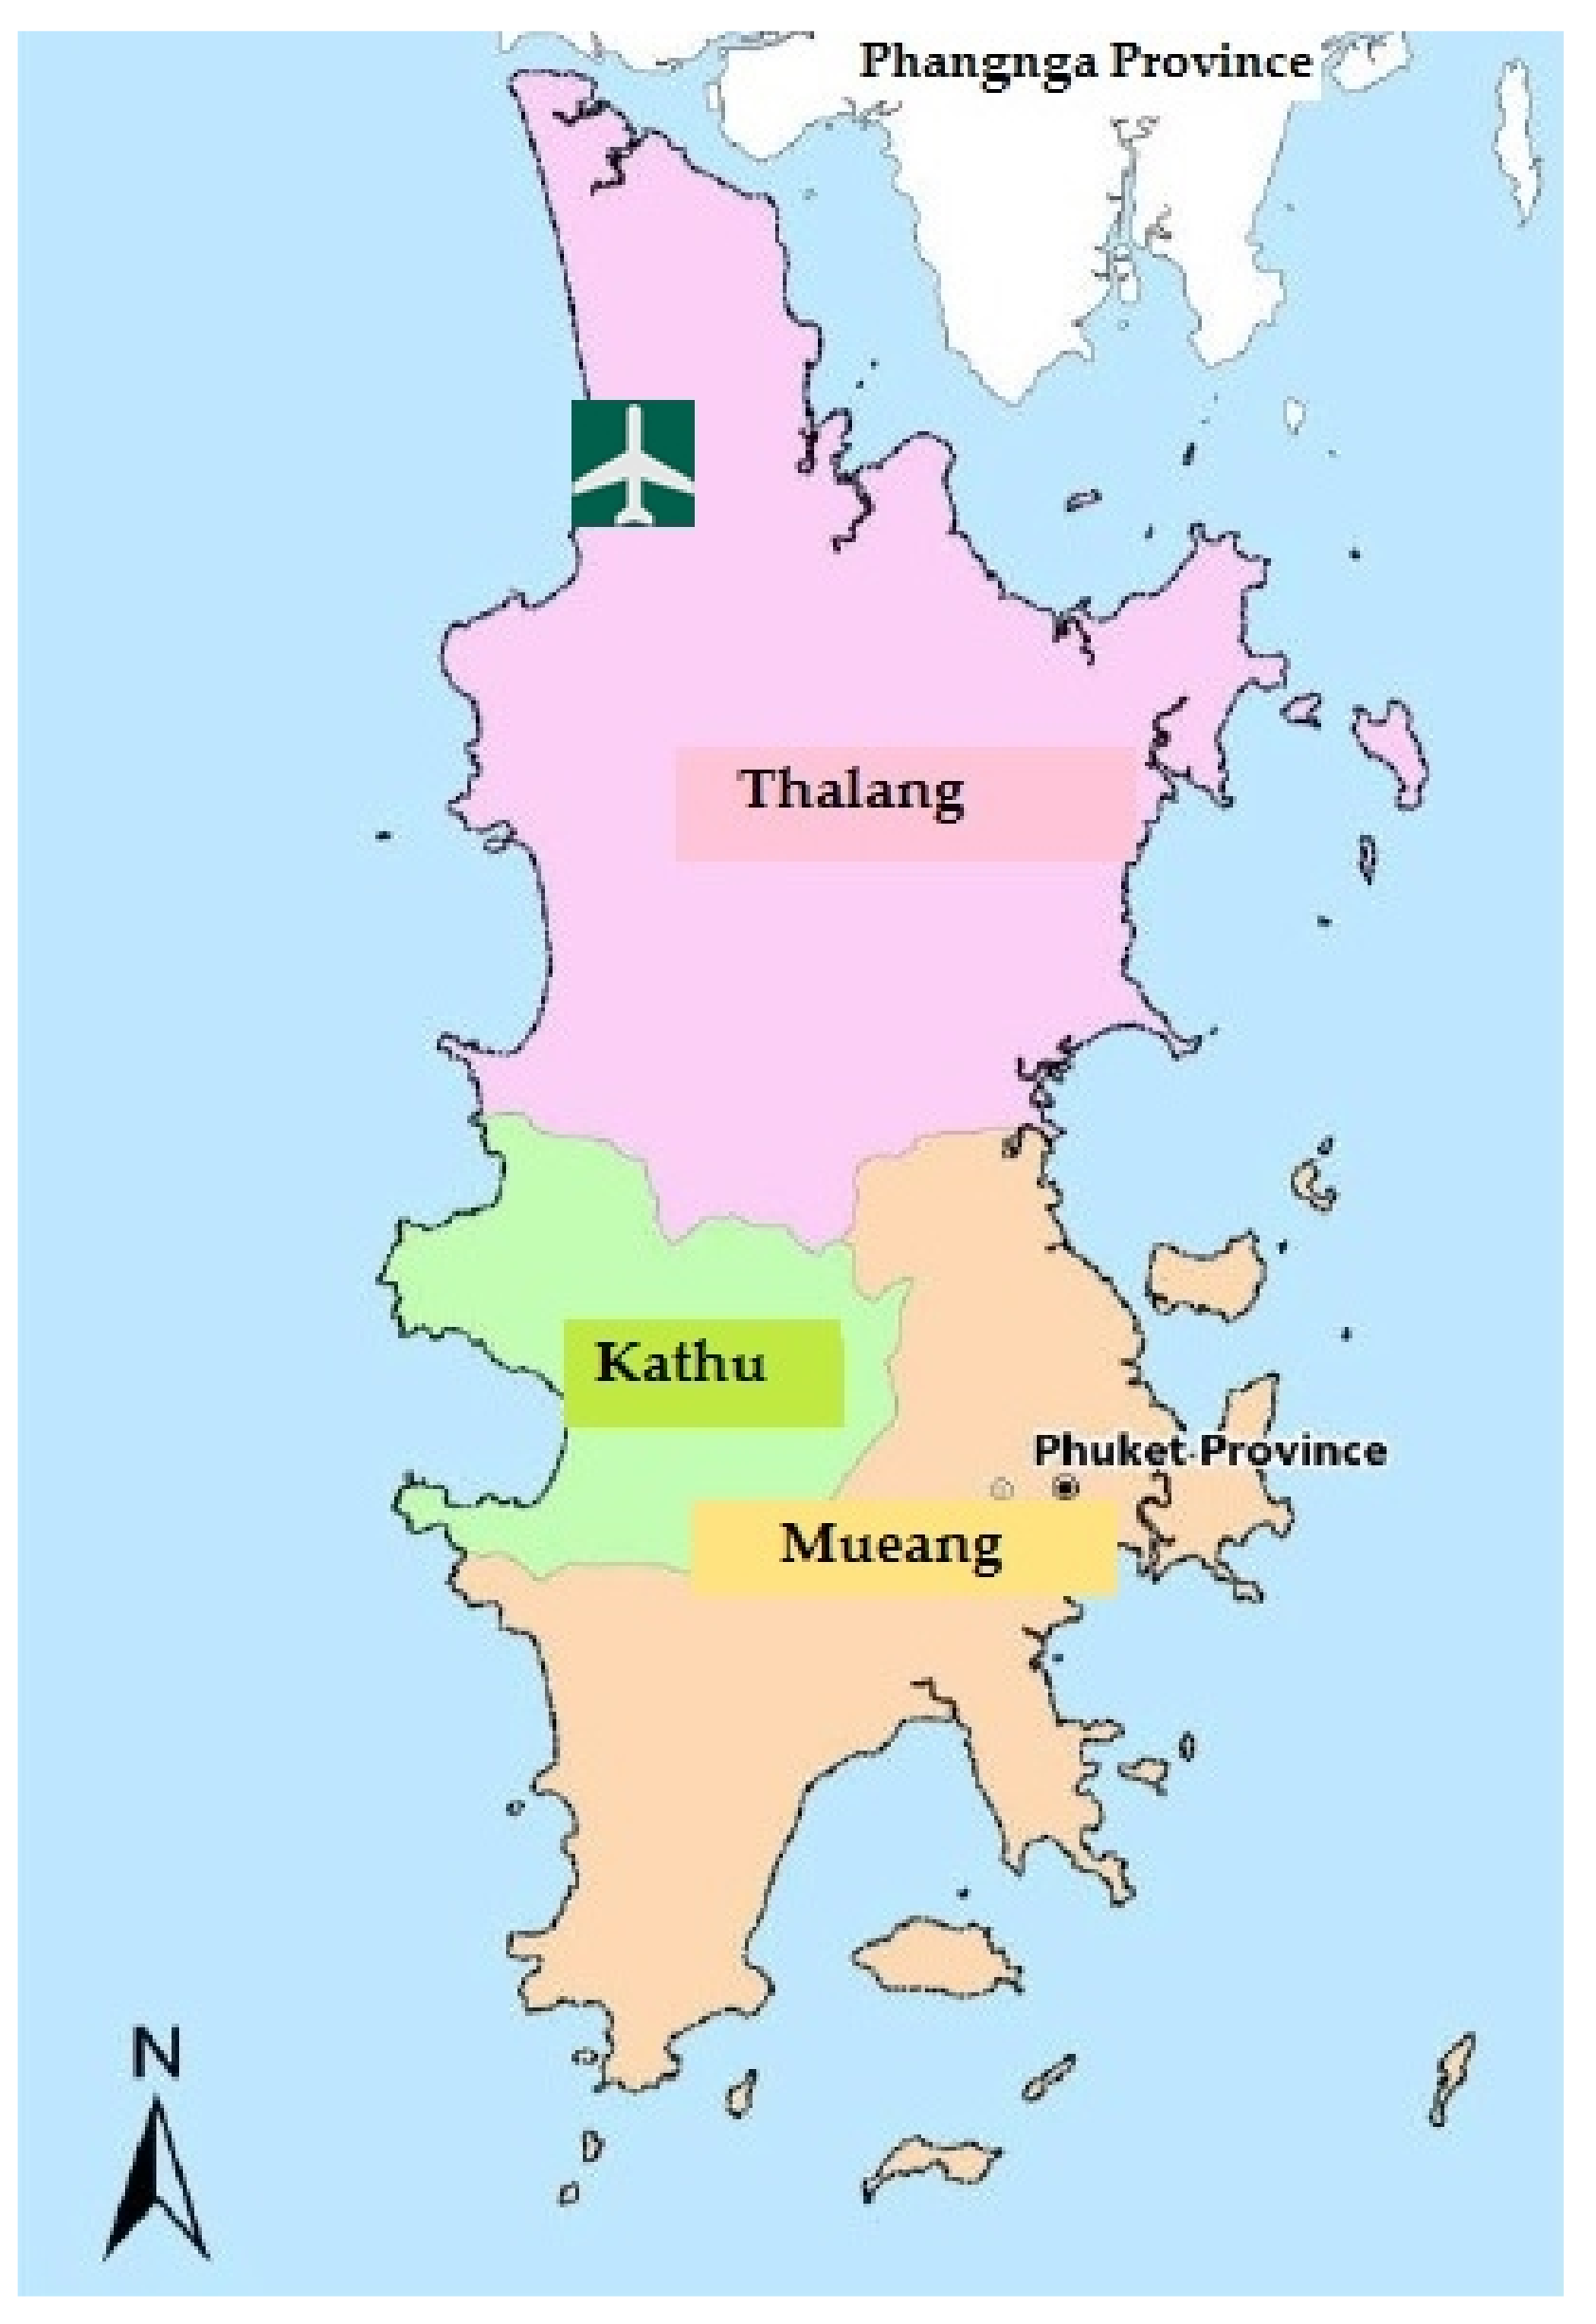
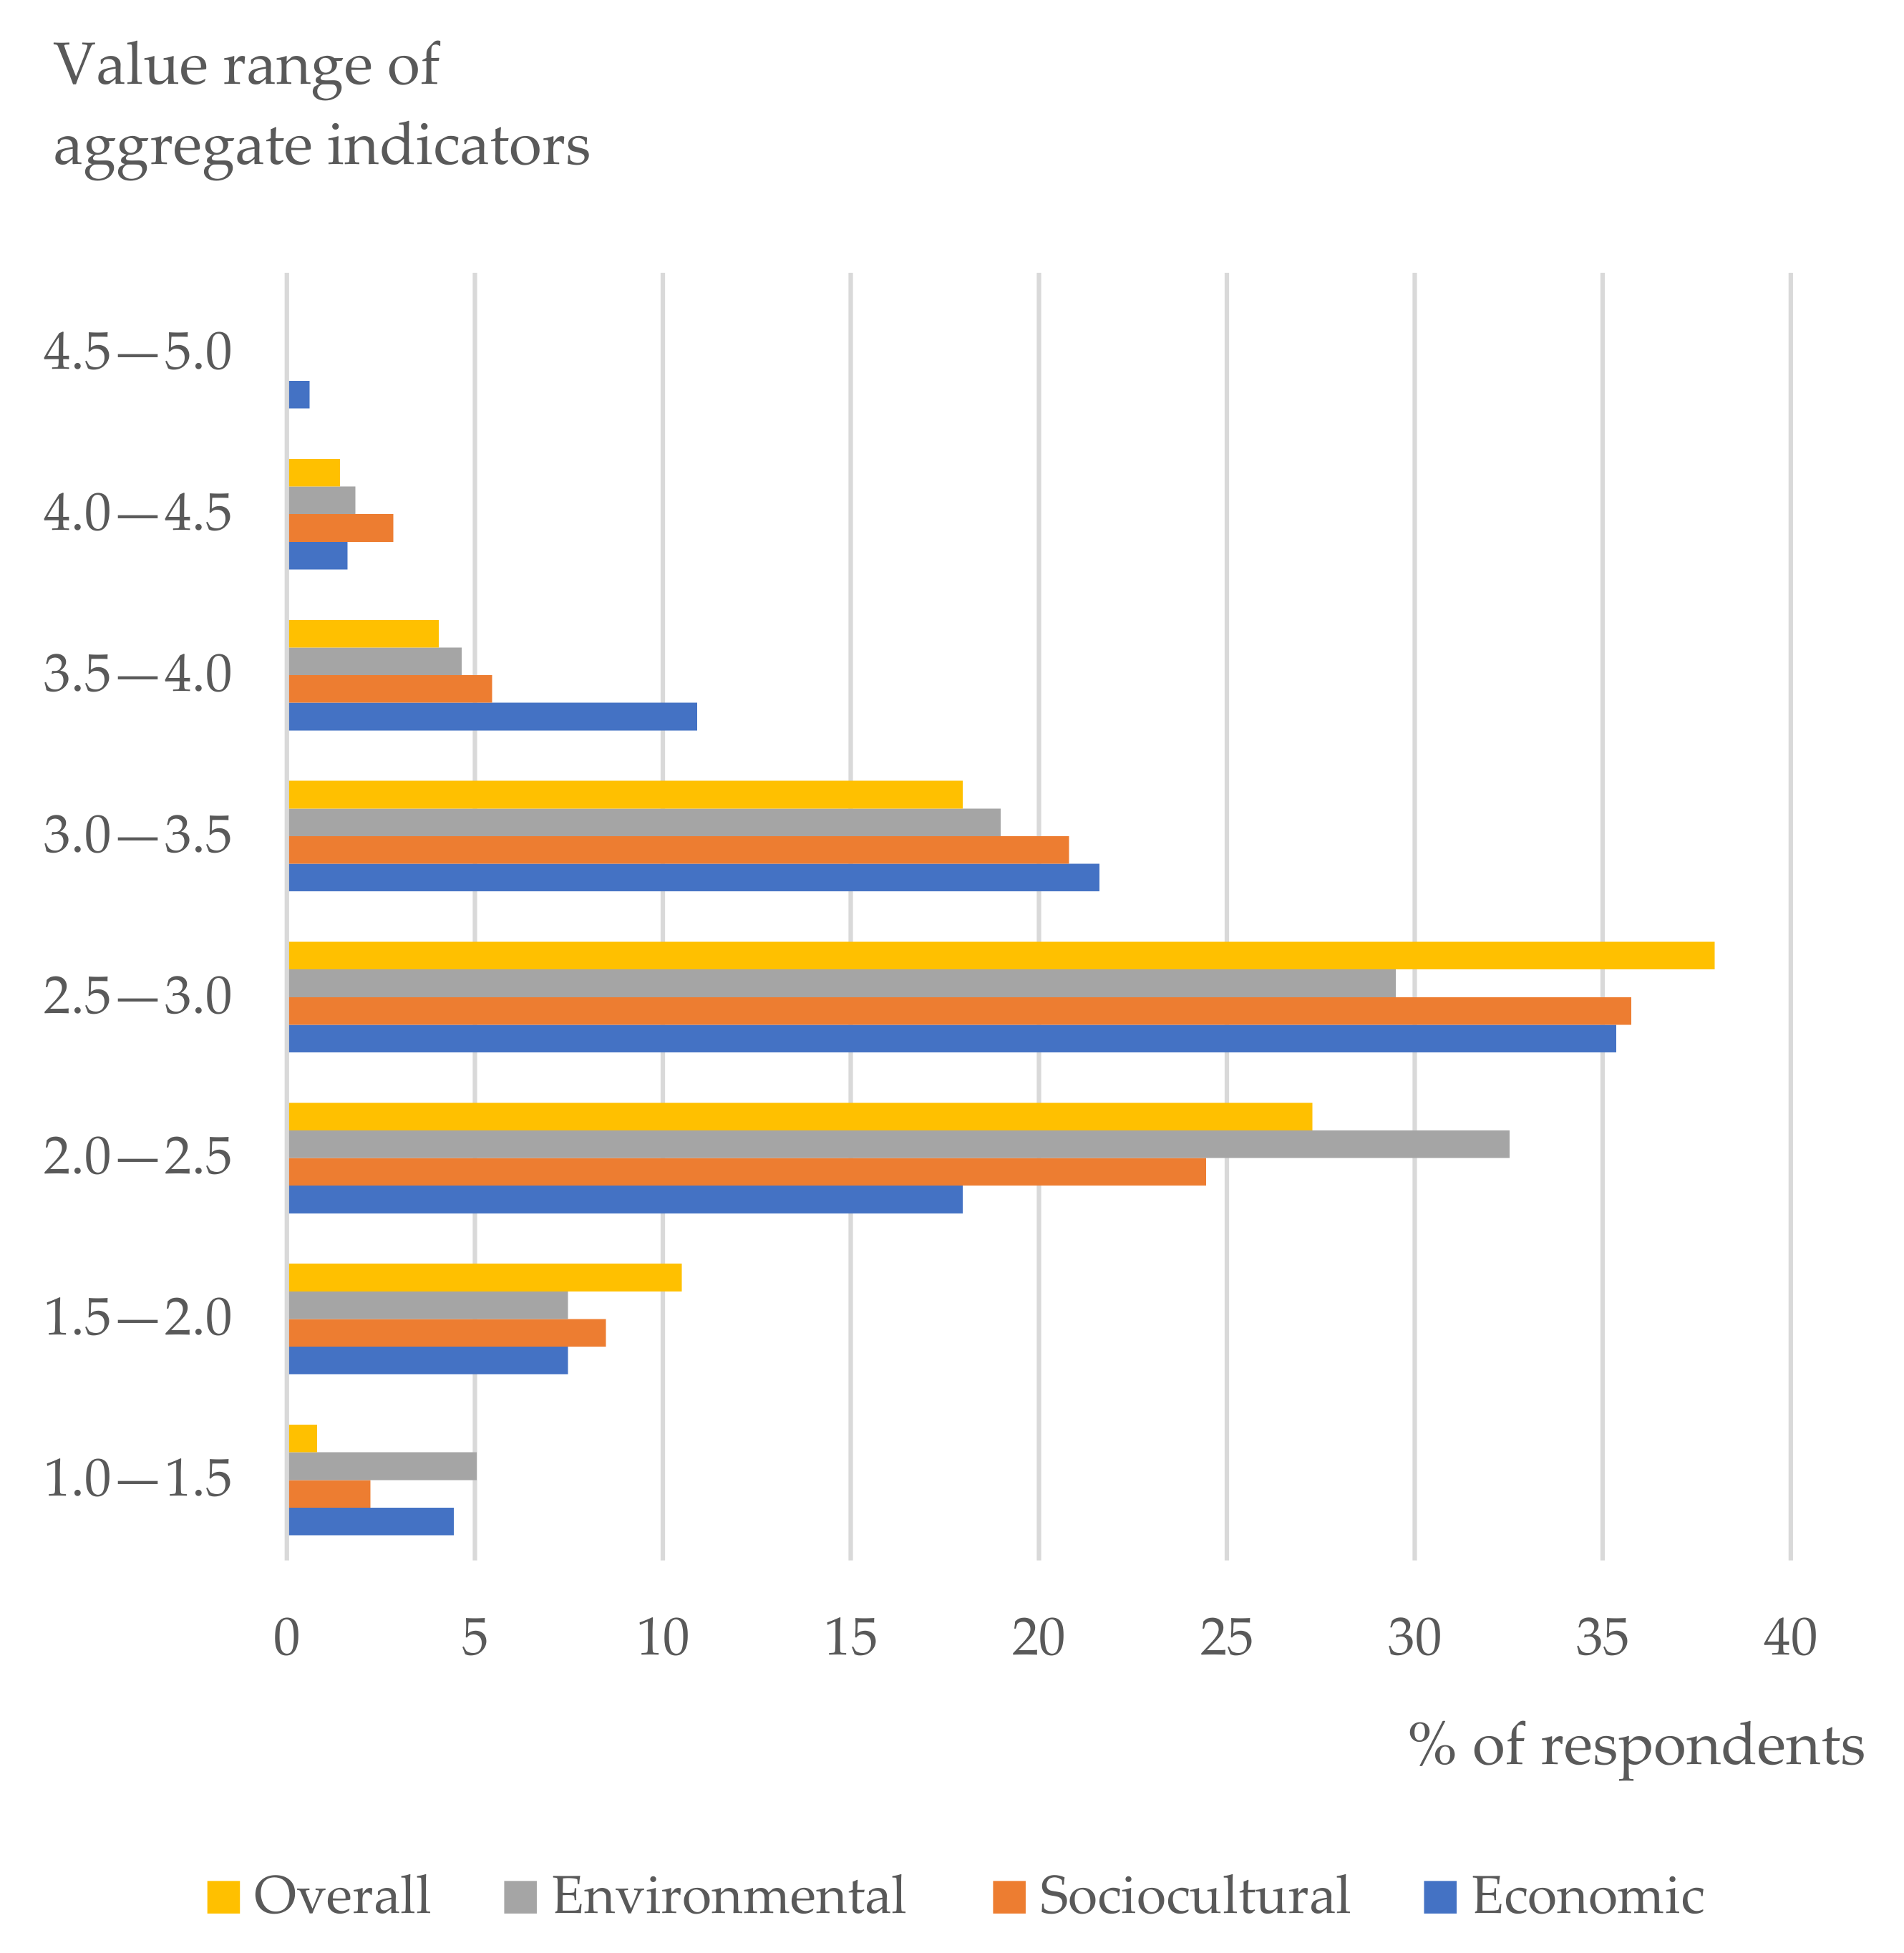
Publisher’s Note: MDPI stays neutral with regard to jurisdictional claims in published maps and institutional affiliations. |
© 2021 by the authors. Licensee MDPI, Basel, Switzerland. This article is an open access article distributed under the terms and conditions of the Creative Commons Attribution (CC BY) license (https://creativecommons.org/licenses/by/4.0/).