1. Introduction
Agriculture performs an important role in providing food and feed, but is associated with negative externalities. The European Union (EU) Common Agricultural Policy (CAP) performs a key role in addressing the challenges of agricultural sustainability [
1]. The agricultural sector is responsible for almost 14% of net global carbon emissions [
2]. Most agricultural emissions come from soil management, enteric fermentation (microbial activity in the digestive system), energy use and manure management [
3].
In this context, environmental policy becomes an important component of agricultural policy in the EU. These trends led researchers to address the environmental and human health consequences of the widespread use of mineral fertilisers and nitrogen. To slow down the environmental, climate and health risks of nitrogen formation, four main areas were created in the Environmental Action Program [
4]. In the Farm to Fork strategy, the Commission is committed to reducing nutrient losses by at least 50%, while ensuring that soil fertility is not compromised. This should reduce fertiliser use by at least 20% by 2030 [
5].
There is a need to consider externalities [
6]. The authors argue that many sectors of the economy produce marketed and non-marketed products, which include positive and negative environmental externalities. These externalities are very often overlooked in efficiency analyses. Färe [
7] proposed a modification of Farrell’s [
8] efficiency measure that allows for asymmetric treatment of inputs, desirable and undesirable outputs.
Many studies are concerned with the analysis of eco-efficiency and environmental efficiency. According to Gancone et al. [
9], there is no specific definition of eco-efficiency in the literature; it can mean the production of products with higher added value and lower impact on the environment. Eco-efficiency means producing more outputs with less agricultural inputs (land, water, energy, labour, nutrients, capital). Eco-efficiency encompasses the ecological and economic dimensions of sustainable agriculture [
10]. Eco-efficiency can be explained as “a tool for sustainability analysis that indicates how efficient economic activity is with respect to nature’s goods and services” [
11]. Eco-efficiency was analysed by Stępień et al. [
12] on small farms in Poland (they have a high share in the total number of farms). The most efficient are farms with a larger area, and for which agriculture is the main source of income and which specialize in permanent and horticultural crops. Farms with higher labour endowments are less eco-efficient [
13].
There are two popular methods for measuring efficiency; stochastic frontier analysis (SFA) and data envelopment analysis (DEA). According to Coelli et al. [
14], SFA is related to the application of econometric methods, while DEA focuses more on the application of linear programming. In many cases, both methods lead to very similar and highly correlated results [
15,
16]. There are also some studies on the evaluation of environmental efficiency in agriculture by using the DEA methods [
17,
18,
19].
Parametric methods require an explicit functional form for the frontier and the distributive assumption of the inefficiency term. Nonparametric methods, on the other hand, require neither an assumption about the functional form of the frontier nor any distributional assumptions about inefficiency. Moreover, the DEA approach does not account for the effect of a random variable on technical efficiency, so the results can be very sensitive. The SFA is more appropriate for agricultural analyses because the data are often influenced by natural factors [
14].
Eco-efficiency was analysed in China through data envelopment analysis (DEA) [
20]. They found agricultural eco-efficiency only in some provinces. Agricultural eco-efficiency is influenced by pure technical efficiency. Highly efficient farms are concentrated in economically developed areas. DEA was also used by Picazo-Tadeo et al. [
21] to analyse eco-efficiency. The results showed that farmers are quite eco-inefficient with few differences between specific environmental pressures related to technical inefficiency. Farmers who benefit from agri-environmental programmes or have higher education are more eco-efficient. DEA was used to model undesirable factors in the efficiency analysis and the eco-efficiency performance analysis in the EU and concluded that old members had higher eco-efficiency scores [
18].
The pressure indicators of sustainable development are used to measure eco-efficiency; for example, CO
2 emissions, consumption of natural resource, environmental impact indicators or greenhouse effect [
19].
Many studies compare the technical and environmental efficiency of different sectors and regions [
11,
22,
23]. However, fewer studies have been conducted for the agricultural sector. Zhang [
11] applied DEA and decomposed the total productivity into an environmental efficiency (
EE) index and a productive efficiency (PE) index in farrow-to-finish pig farming. Piot-Lepetit and Vermersch [
24] focused on DEA and the weak disposability assumption to derive a shadow price of organic nitrogen for the pig industry.
SFA was also used to estimate the environmental and technical efficiency of a sample of dairy farms in the Netherlands. It was found that more intensive farms have higher environmental efficiency, but the trend is rather weak [
25]. Another paper by Reinhard et al. [
26] measured the technical and environmental efficiency of a panel of dairy farms in the Netherlands using both SFA and DEA, with nitrogen surplus, phosphorus surplus, and farm energy consumption as inputs in the environmental efficiency measurement. They compared the results and found that SFA and DEA showed very similar results. The authors found a high correlation between technical efficiency and farm environmental efficiency.
The authors [
24] conducted a DEA of a sample of 210 dairy farms in New Zealand to link measures of farm productivity with their environmental performance based on the estimated farm nitrogen emissions. A life cycle analysis (LCA) study in conjunction with a DEA of 72 dairy farms in Spain to evaluate their operational and eco-efficiencies was performed byReinhard et al. [
25]. Undesirable outputs such as wastewater and air pollutants were included as inputs in the calculations. The agricultural economic-environmental efficiency (eco-efficiency) for European countries was also estimated [
27]. Eco-efficiency is obtained by the DEA and the SFA using a generalized maximum entropy (GME) approach. The authors used the ratio between gross value added and GHG emissions as the definition of eco-efficiency.
Farmers have limited options to reduce their nitrogen surplus at the current level of technological development. They also found a positive effect of government subsidies on the shadow prices for nitrogen surplus [
28].
There are many studies on environmental efficiency that have been performed at the level of the agricultural sector as a whole. However, since the data are aggregated at the level of the whole sector, it is difficult to find the cause of any inefficiency and to observe clear comparisons. Some studies analysed the environmental efficiency of the whole EU agricultural sector, for example, [
17,
19,
27,
29], of farms with arable land [
30] or at the national level [
18]. The results of these studies are discussed in the Discussion section, but the results of the assessment of environmental efficiency may vary depending on the farm specialization.
The aim of this study is to provide an analysis of nitrogen consumption in EU countries at the crop production level and to evaluate the environmental efficiency of the sector in these countries. The dataset contains regional data of EU countries for the type of farming, TF 14−15; specialist cereals, oilseeds, and protein crops. The analysis provided and the calculation of environmental efficiency (EE) have some limitations, namely that the data are aggregated on the level of TF 14−15. These crops have different nitrogen consumptions, so the results depend on the structure of the crop species grown in the different countries. The article contributes to the theoretical and practical knowledge of nitrogen consumption in crop production due to the lack of studies on environmental efficiency in crop production. The results provide an overview of the current situation in crop production. The study can contribute to the current Common Agricultural Policy debates and measures concerning the use of fertilisers (nitrogen) in the EU member states, as the environmental efficiency of each country was calculated.
2. Materials and Methods
The data used to estimate the production function are from the farm accountancy data network public database (FADN) [
31], for the years 2014−2018 for each country at the regional level (NUTS 1). After the cleaning process, the unbalanced panel dataset contains 283 observations form crop farms (type of farming, TF 14−15; specialist cereals, oilseeds, and protein crops) from 23 EU member states. Data from seven states were incomplete and therefore excluded from the analysis. The following variables were used to estimate the production function: output, capital, labour, land, material, and fertilisers (nitrogen). Output is represented by the total output of the farm. Since the output variable is expressed in monetary units (euro), it was deflated by the price index of agricultural production to avoid inflation. Labour input is used in the form of an annual work unit (AWU). Land is the total utilised agricultural area per farm. The capital variable is represented by the total fixed assets and contract work. The material input is the specific crop cost. The capital and material variables were deflated by the industrial sector price index. The nitrogen variable represents nitrogen consumption per ha of utilised agricultural land. The results of the analysis were complemented by data on nitrogen consumption in different EU countries. This information should help to explain the differences between countries on
EE. The data on nitrogen consumption and its evolution over time were taken from the EUROSTAT database [
32,
33]. The data on the structure of crop production in the EU countries and crop yields were taken from the FAOSTAT database [
34].
In this study, the SFA was used to estimate the environmental and technical efficiency of European farms with crop production. The stochastic frontier production function was estimated as follows:
where Yi is the output variable of the production function,
Xi are the input variables of the production function,
β are the estimated parameters of variables,
vi is the error term,
ui is the technical inefficiency term.
Following Färe [
35], to estimate a production function in transcendental logarithmic (translogarithmic) form, we used the production factors land, labour, capital, material, nitrogen, and a time variable. Zhang and Xue [
36] argued that the translogarithmic production function is more suitable for estimating environmental efficiency than, for example, the Cobb–Douglas function because it allows the addition of new variables that represent the bad inputs to the environment. This translog production function can be written as follows:
where
A is the total factor productivity; α and
β are estimated parameters of the production function, their subscripts are according to the variables;
P is the land variable;
K is the capital variable;
L is the labour variable;
M is the material variable;
N is the nitrogen fertiliser consumption (t/ha);
Y is the output variable;
T is the time trend variable representing technical change;
vit is the error term and
uit is the technical inefficiency term.
The production function was estimated using the true random effects model, which allows for a randomly distributed technical inefficiency term with constant mean and variance, and is assumed to be uncorrelated with the regressors and the error term [
37].
The result of the production function estimation is the parameters of the variables (land, labour, capital, material, nitrogen, and time) and calculated technical efficiency.
Based on the estimated parameters and technical efficiency, the efficiency measurement shows the relation between inputs (land, labour, capital, material, fertilisers) and outputs (crop production). A farm is considered to be fully environmentally efficient if it can reduce all bad inputs to an optimal level, while other inputs remain the same, and the amount of output is constant [
38]. The environmental efficiency (
EE) was calculated as follows:
where
EE is environmental efficiency;
αN,
βNN,
βKN, βLN, βMN are the estimated parameters of production function according to the used variables,
L is the labour variable;
K is the capital variable;
M is the material variable;
N is the nitrogen fertiliser consumption;
vit is the error term and
uit is the technical inefficiency term.
This approach allows fertiliser to be treated as one of the inputs to crop production, so the results show whether the farm is efficient compared to other farms in the sample. It is assumed that in the case of a less environmentally efficient farm, the farms in question have the opportunity to improve their efficiency by reducing fertiliser use as a way to address efficiency deficiencies.
4. Discussion
The calculation of environmental efficiency was based on the estimation of the production function. The production function was estimated using the SFA approach. The SFA was shown to be more suitable for agricultural analysis because it can incorporate the stochastic error term, and agricultural data are often influenced by natural factors [
14]. A similar data set (FADN data) for eco-efficiency was also used by Bonfiglio et al. [
30]. The estimation results are consistent with the economic theory. The high importance of the land variable and the lower importance of the labour and capital variables are consistent with expectations since land plays a very important role in crop production. The lower importance of the variables of labour and capital can be explained by the fact that crop production is not a labour- and capital-intensive sector.
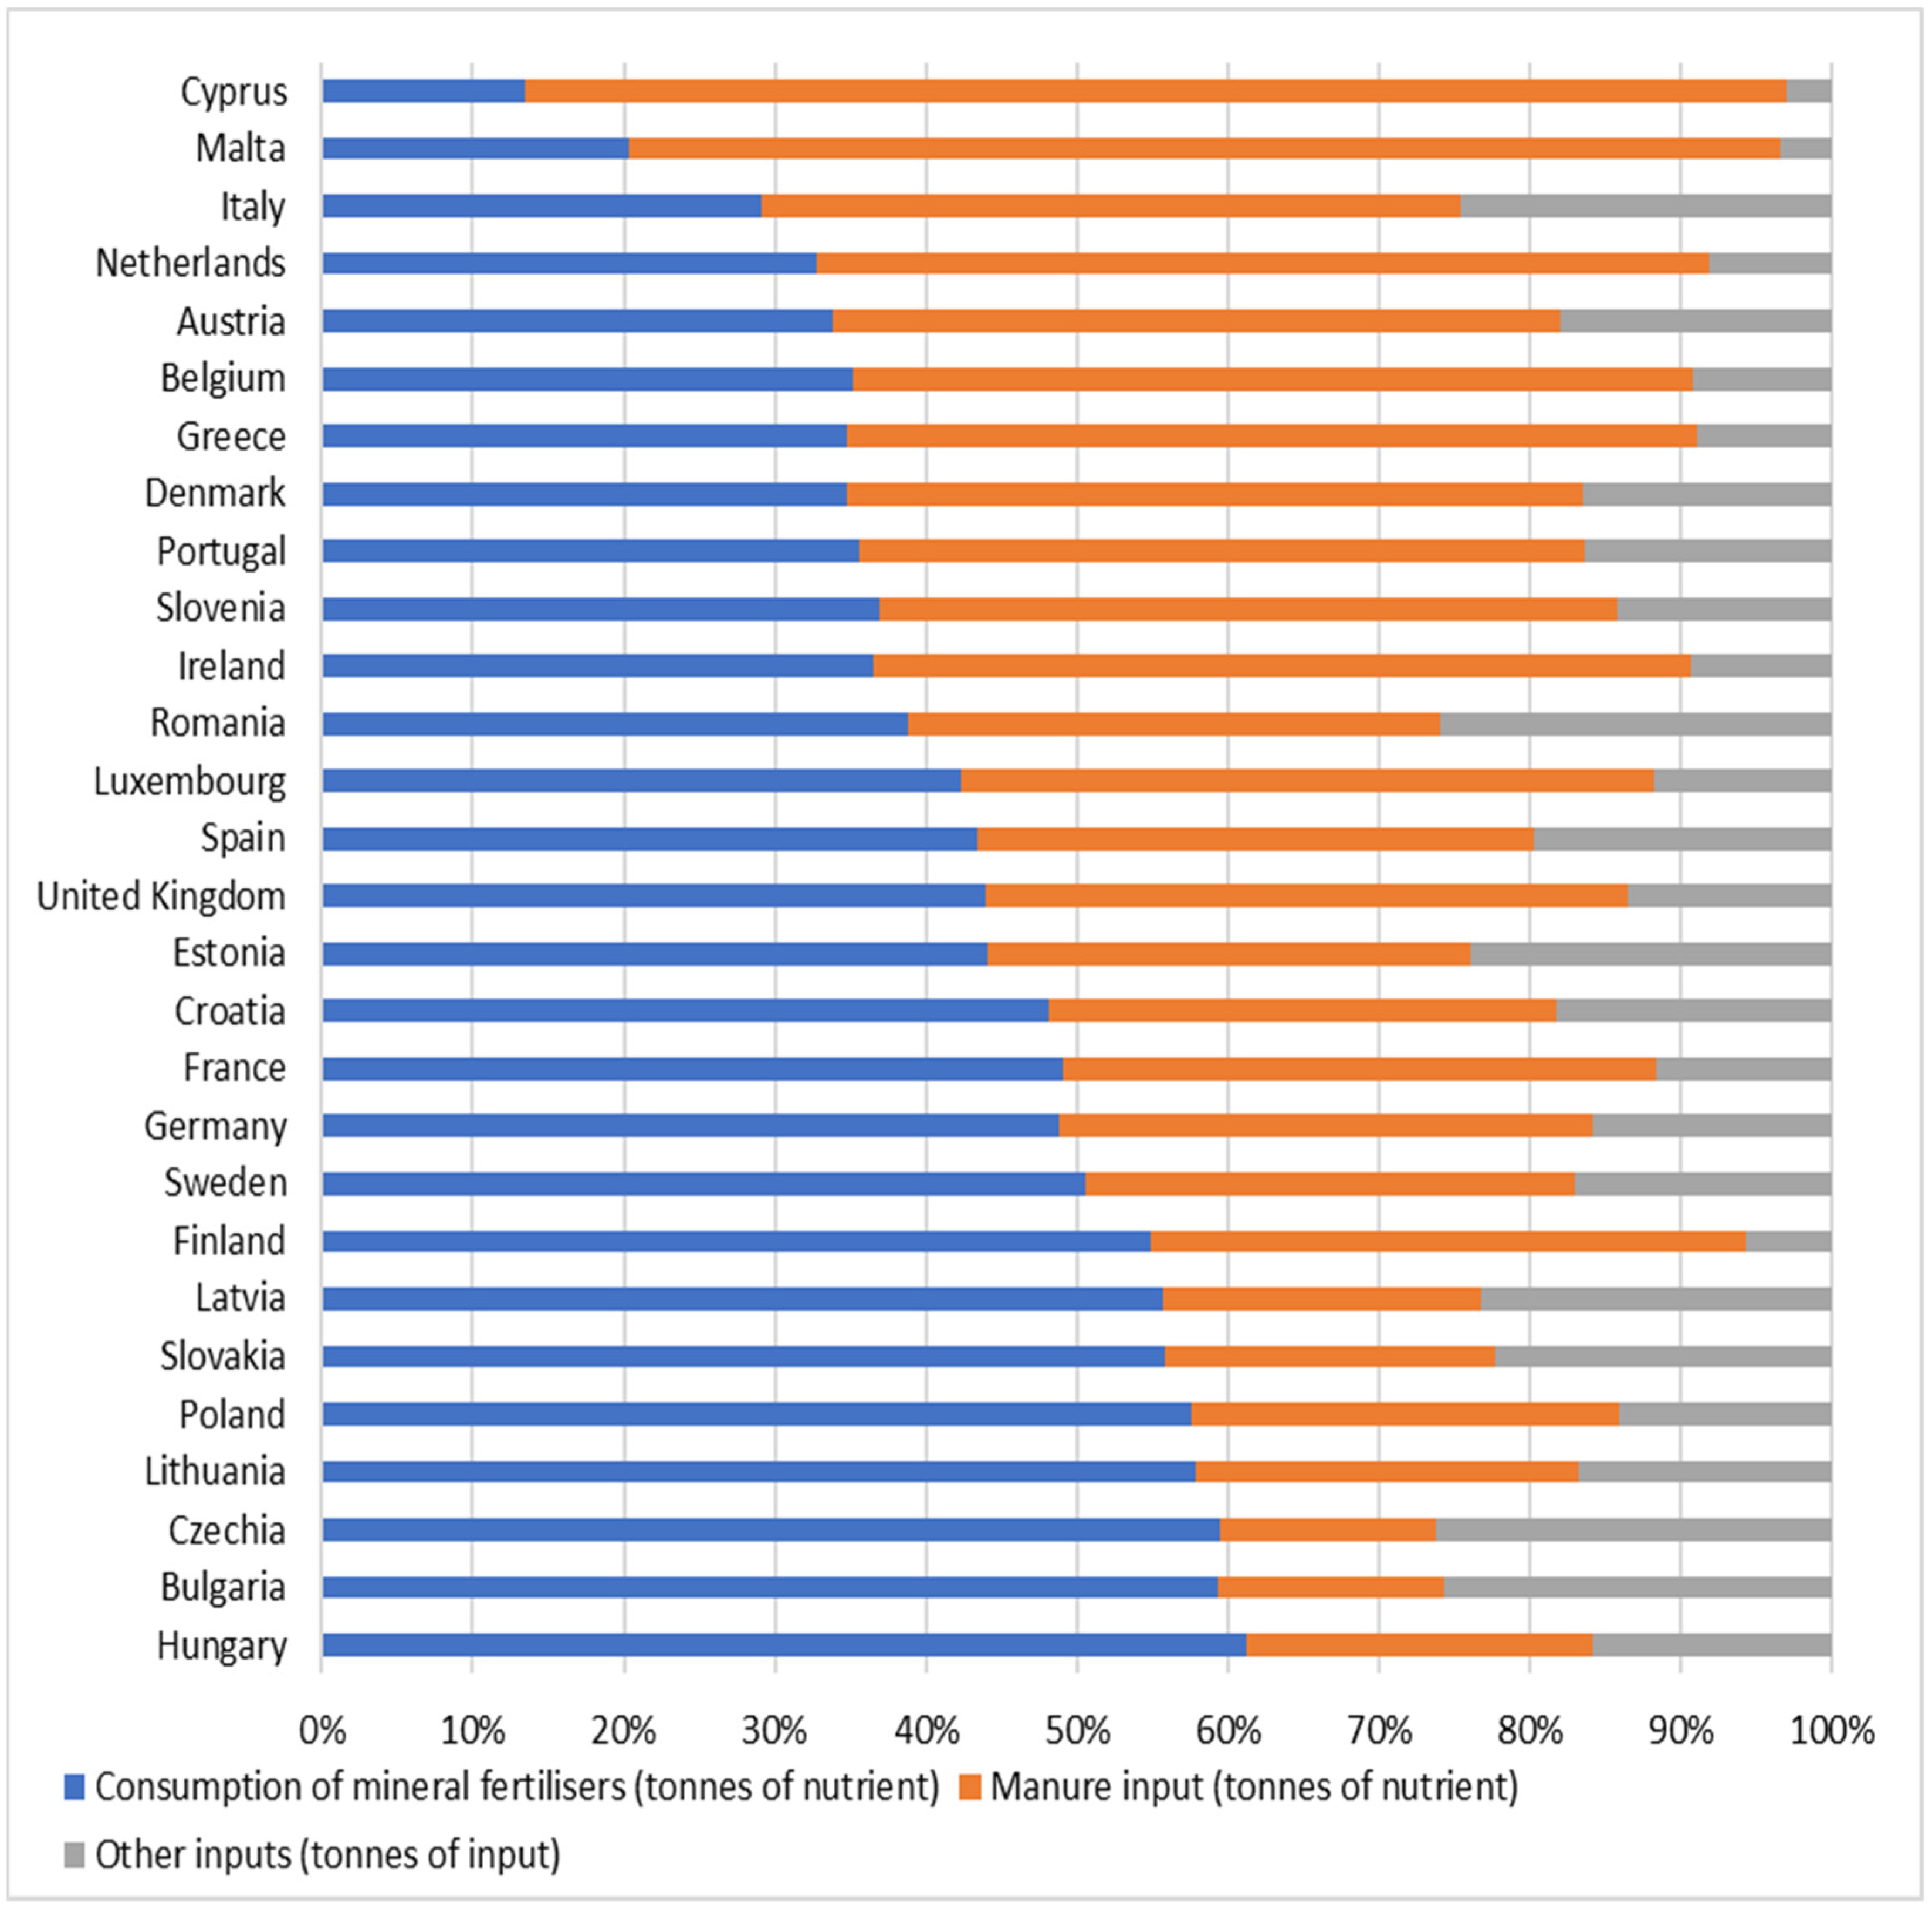
The maximization of crop production and the availability of cheap mineral fertilisers may lead to increased use of nitrogen. Europe benefited from the increase in nitrogen use, both economically and socially [
41]. However, the situation has evolved into excessive use of nitrogen in agriculture as an easy and cheap insurance against low yields [
42].
The difference in environmental efficiency between countries can be explained by several factors. First,
EE was calculated for TF 14−15 (specialist cereals, oilseeds, and protein crops). However, the structure of each species in different EU countries may differ. Some species require more nitrogen fertiliser per ha. It is well-established that the cultivation of maize, oilseed rape, and wheat require a nitrogen fertiliser input. The structure of the species may play a crucial role [
43].
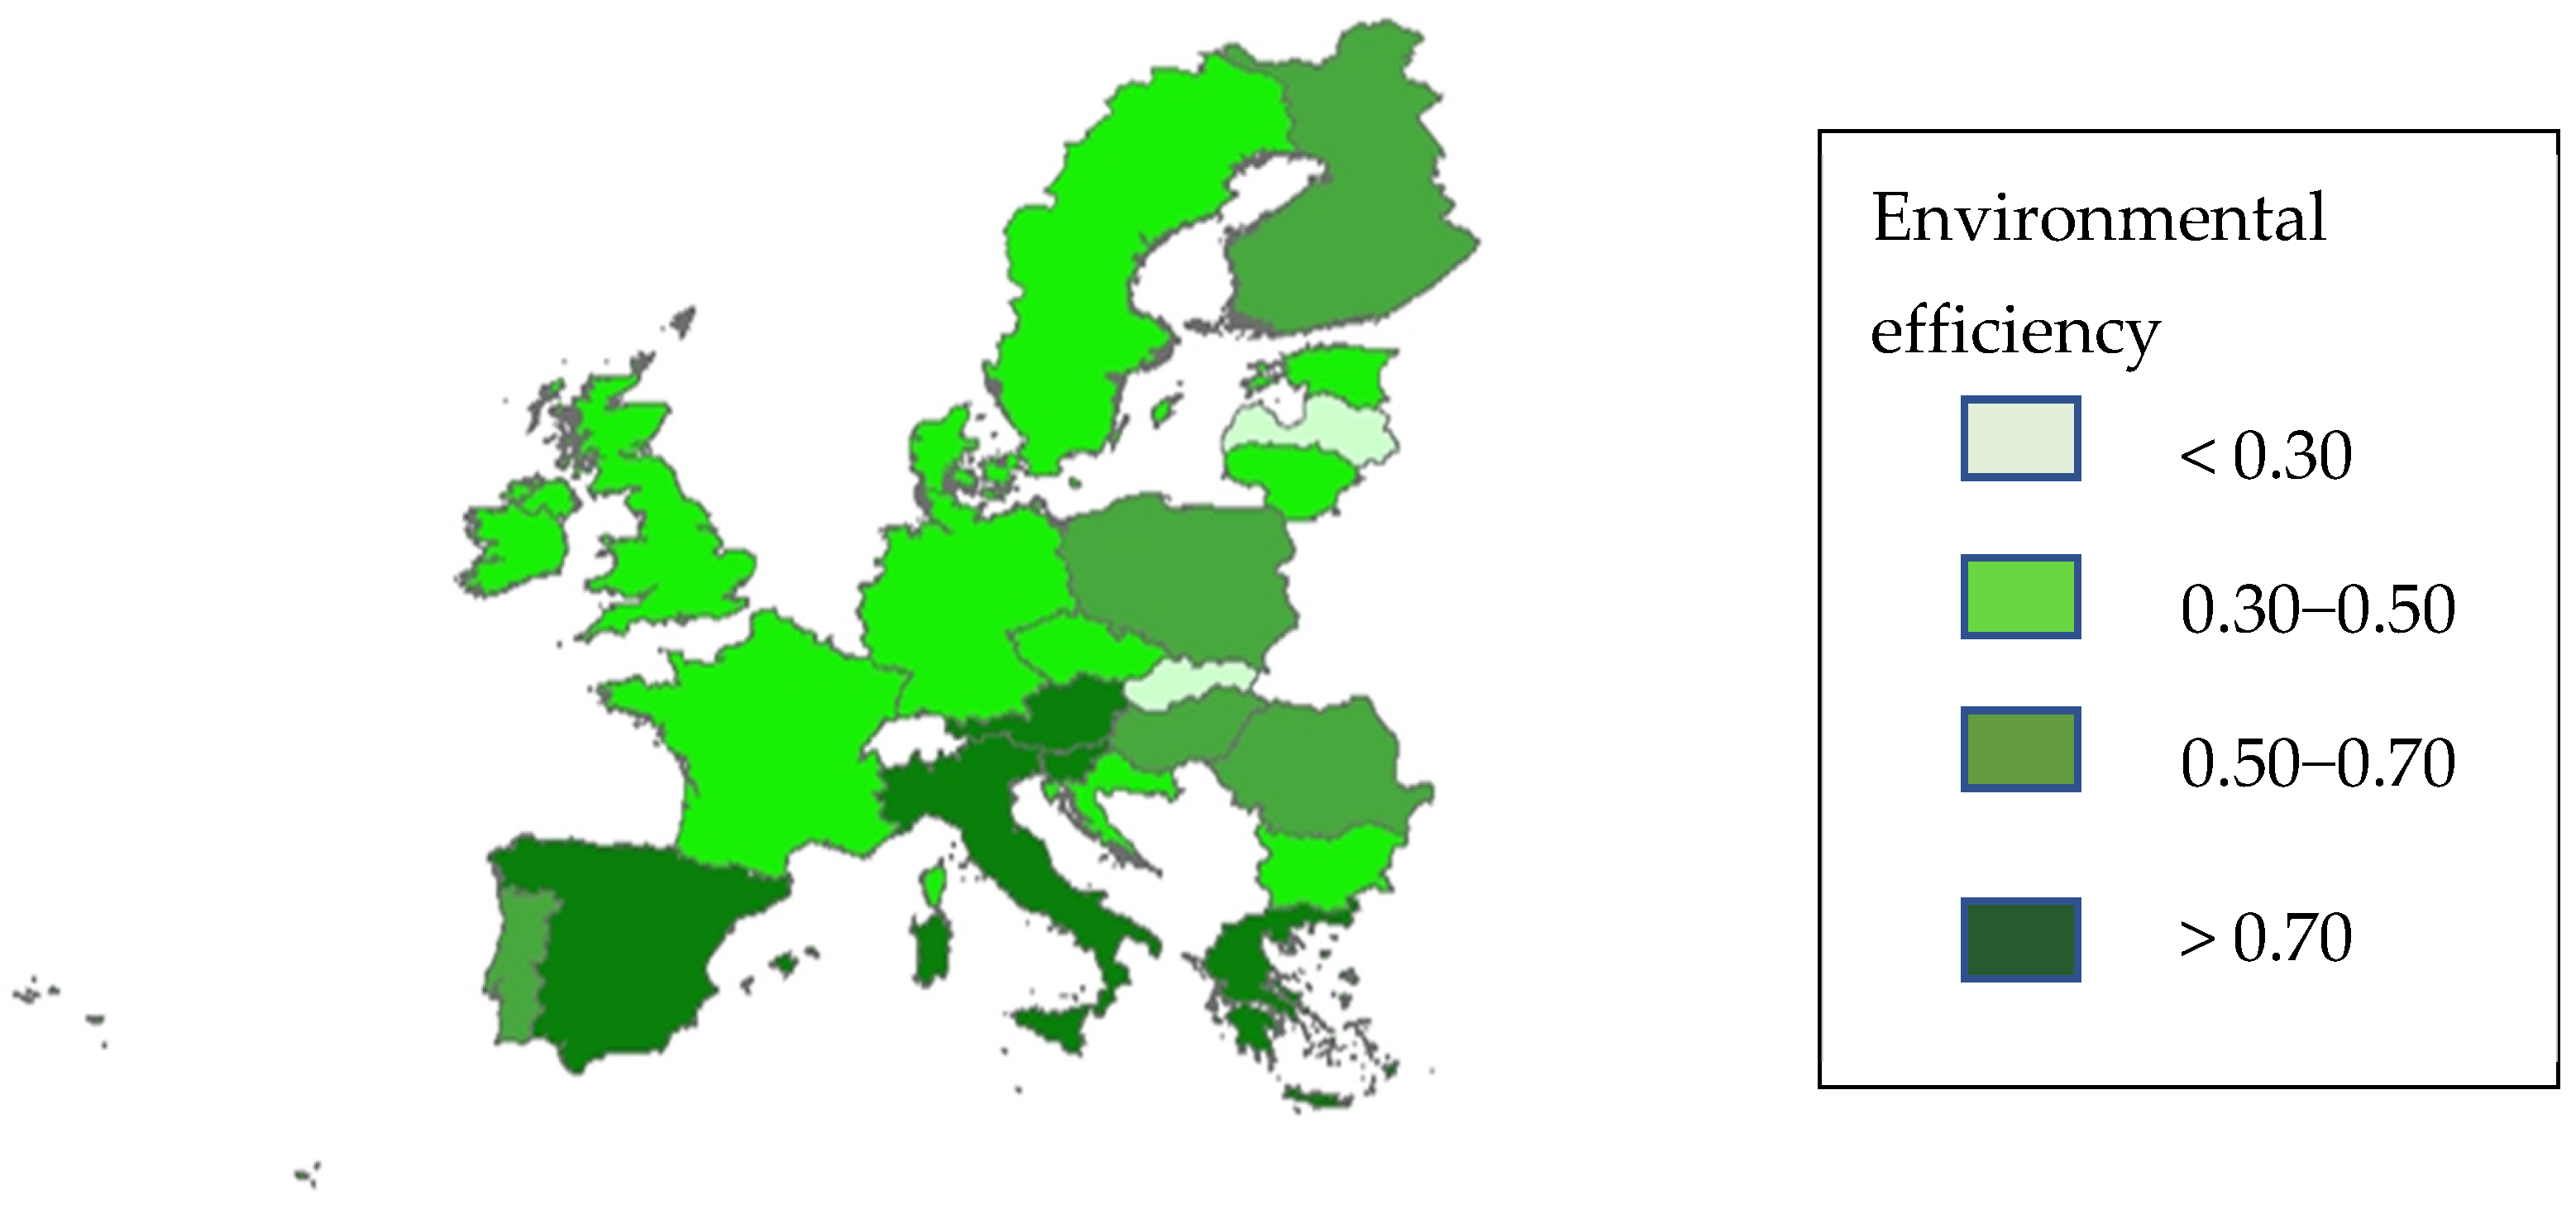
Finland, where oats and barley account for over 70% of total crop production, has a relatively high
EE. Countries, such as Portugal, Greece, Spain, and Italy have a significant share of olives in total crop production and a higher
EE [
34]. Obviously, the southern EU countries are more environmentally efficient in crop production, as can be seen from the map (
Figure 3). Based on Pishgar-Komleh et al. [
29], these countries (Greece, Spain, Italy) were found to be the most eco-efficient in the EU with low variability.
Another important factor affecting
EE is crop yield, as also demonstrated by Masuda [
44], for wheat production. In Slovenia, where the share of maize area in the total cultivated area is more than 30%, the maize yield is relatively high. In 2018, according to FAOSTAT data [
34], the maize yield in Slovenia was 20% higher than the EU average. This may be one of the reasons for the higher
EE in Slovenia. Higher maize yields (by 30% higher than the EU average) are found in Austria, Greece, and Italy. Spain has a 50% higher yield [
34].
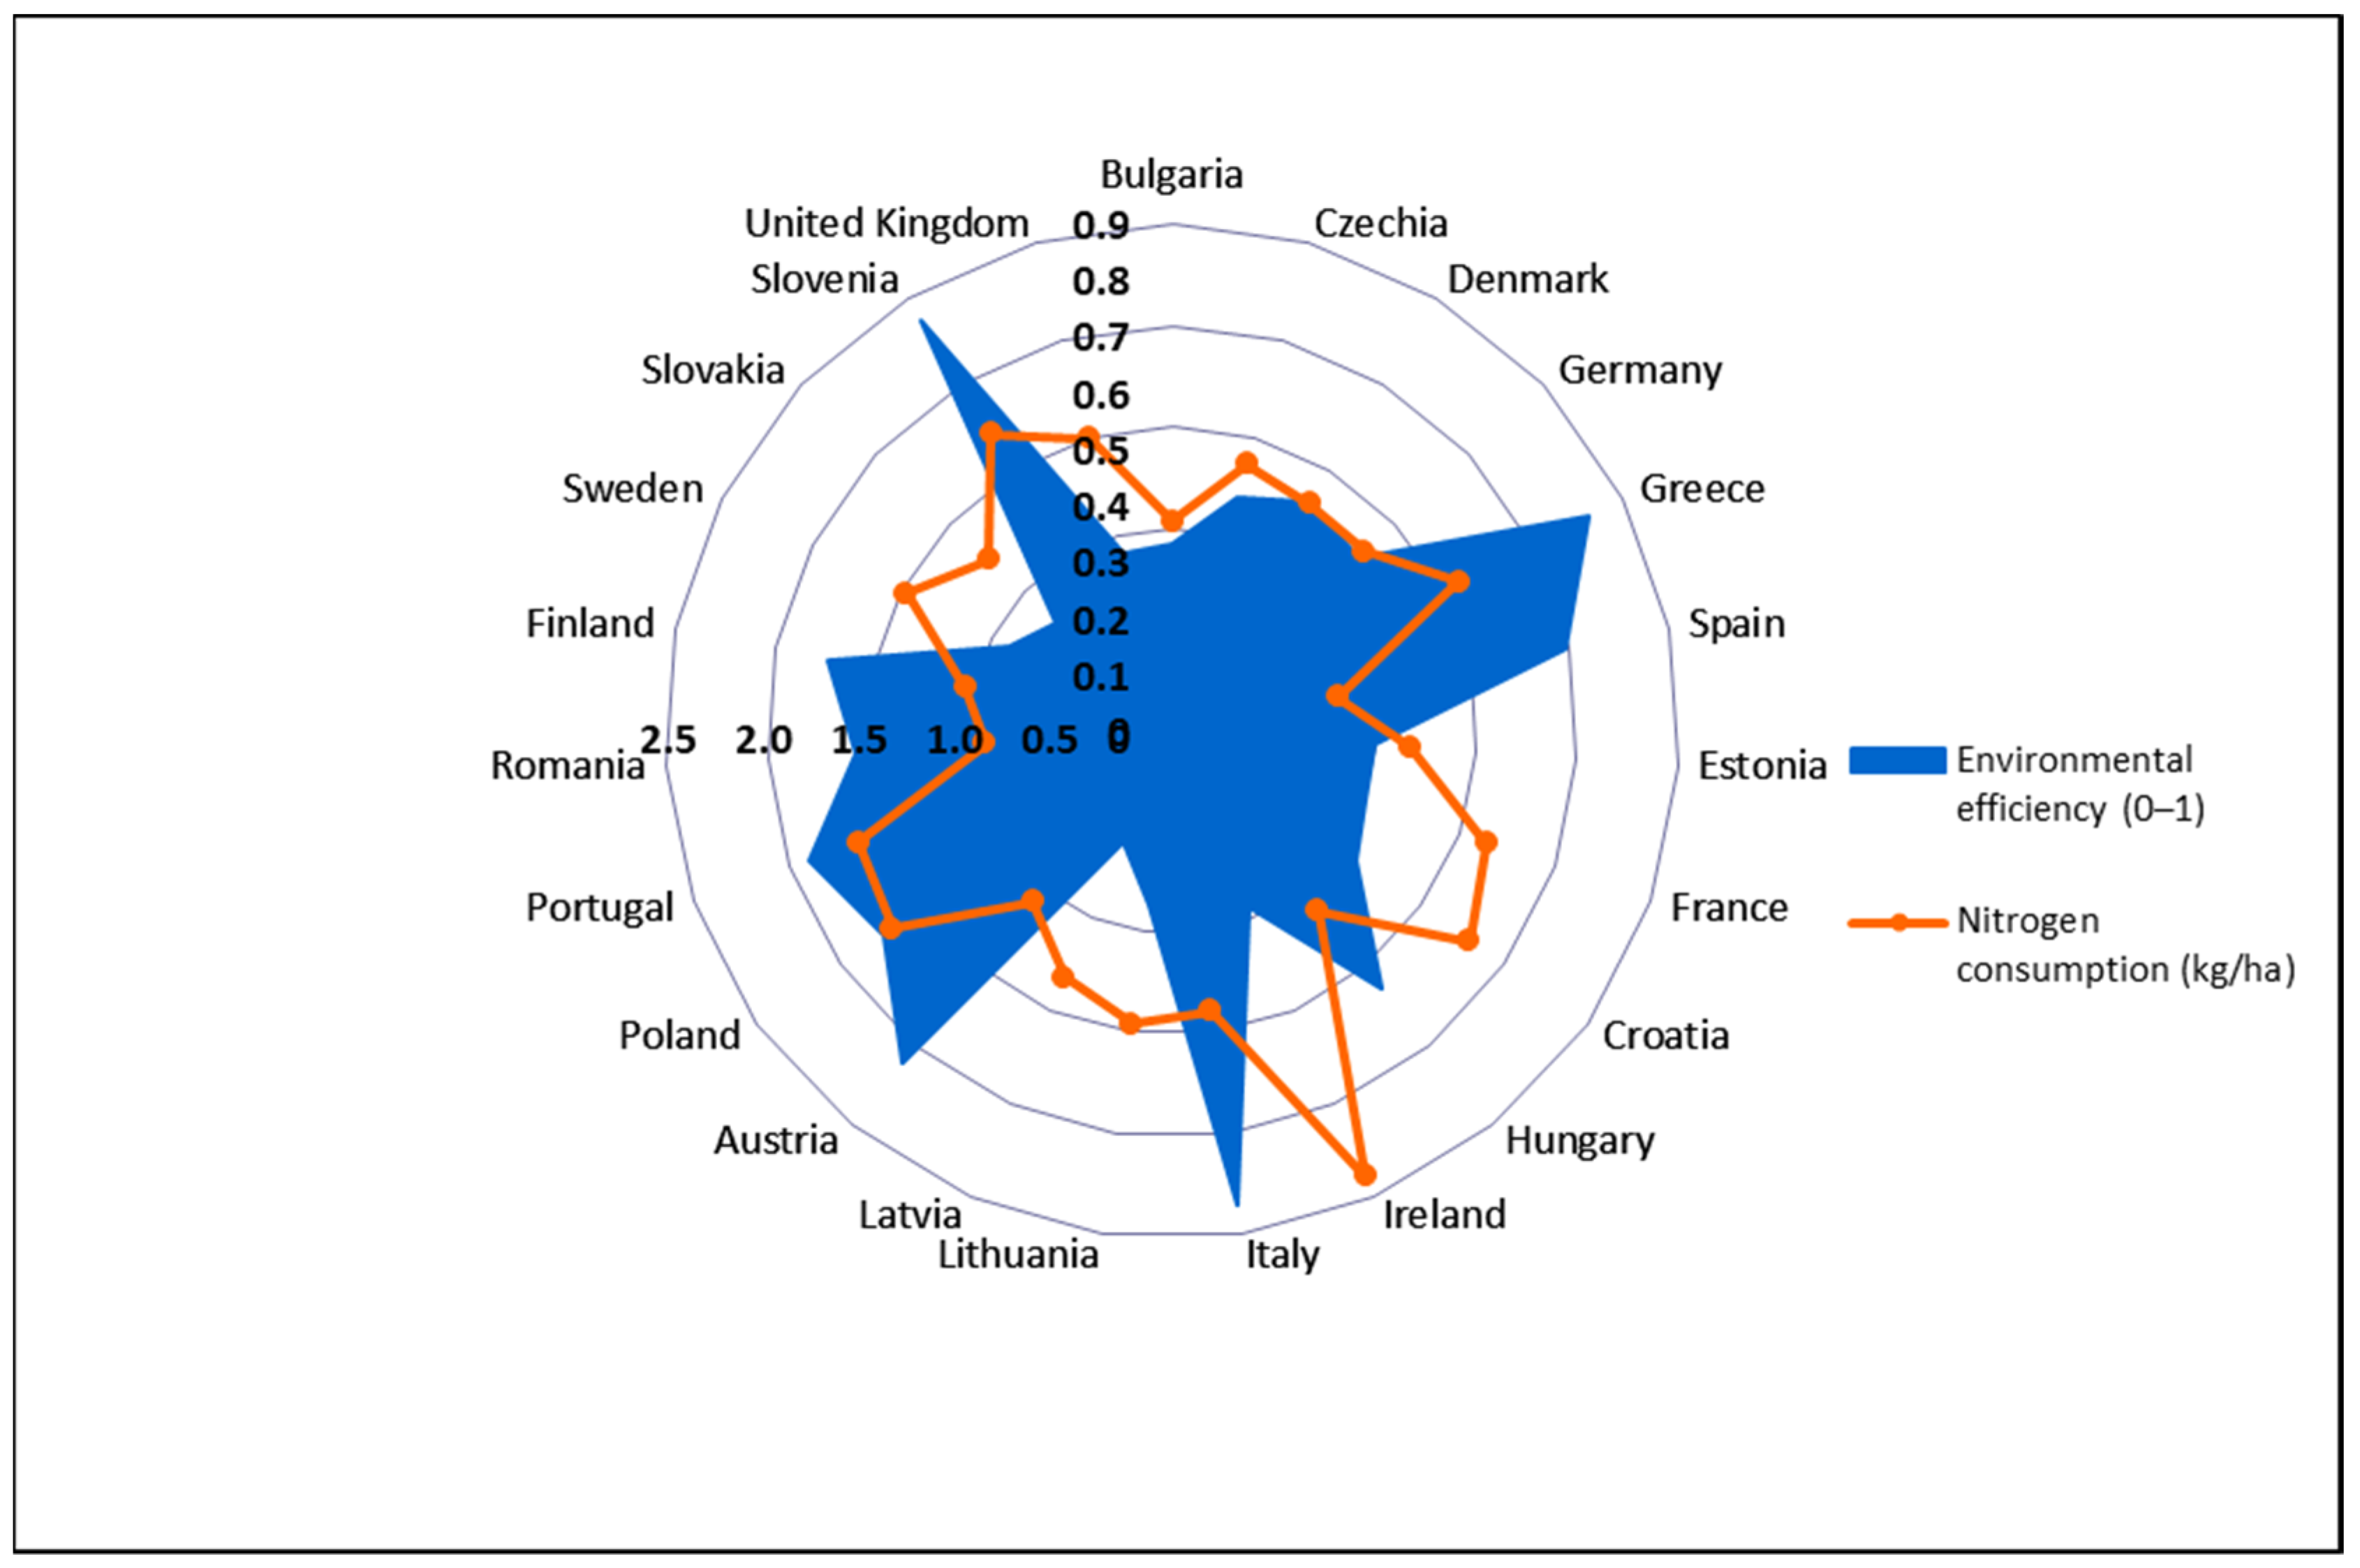
Environmental efficiency represents the relatively efficient use of nitrogen fertilisers compared to the farm’s production. If the farm has a higher consumption with a relatively higher yield, it is considered efficient. On the other hand, a farm with high nitrogen fertiliser losses due to poor management is not very efficient because fertiliser use is not matched to the yield achieved.
Researchers looked at the assessment of environmental efficiency in the EU in the field of agriculture in the period 2001−2008 and found that Germany, Sweden or Austria (countries with strict environmental standards) are less environmentally efficient compared to Denmark, Belgium, Spain, France or Ireland [
17]. Our study confirmed these results for Germany and Sweden. The relatively high value of
EE in Austria can be explained by the high maize yields, with maize accounting for more than 20% of the total cultivated area. Spain was also classified as a country with higher environmental efficiency. It cannot be confirmed that the Eastern EU countries achieved lower environmental efficiency (compared to our study and the results of Vlontzos et al. [
17]). There are also large differences in our sample. A higher
EE was achieved in Slovenia, Poland, and Croatia, and a lower
EE in the Czech Republic, Slovakia, Bulgaria, and Hungary. However, Vlontzos [
17] presented other results, the Eastern EU as countries with low efficiency. The level of technological implementation is very different.
Significant differences were found between the category of the new and old member states. On average, the new member states are less environmentally efficient than the old member states (which is also confirmed by Vlontzos et al. [
17]).
In general, environmental efficiency in crop production in all member states is very low compared to
EE in agriculture, such as evaluated [
17]. Low environmental efficiency was also obtained in this study. The reason and limitation may be that this study investigated a specific part of agriculture, crop production, which uses arable land for production. It is argued that arable farms are important for economic development, but these farms use inputs that are harmful to the environment and there may also be a negative impact on the environment in terms of farm specialization. The authors found also low eco-efficiency. These farms are environmentally inefficient in terms of fertilisers and pesticide use [
30]. According to Bonfiglio et al. [
30], the solution to increase eco-efficiency is more intensive crop rotation and diversification, conversion from conventional to integrated or organic farming, and the introduction of precision farming. These changes also require investment and can be costly. In addition, soil quality plays a crucial role and affects the amount and efficiency of fertiliser use and consumption [
30].
A study by Moutinho et al. [
18] examined the eco-efficiency in the EU between 2001 and 2012, it obtained various results from this study. Ireland, Latvia, Sweden, Hungary and the United Kingdom have the highest environmental efficiency. The Czech Republic, Poland, Bulgaria, and Germany are less efficient.
Eco-efficiency in the EU-28 has also been studied using life cycle assessments and the data envelopment analysis (DEA) in the sector [
45]. The results show that the agricultural sectors of 10 member states of European Union (i.e., Belgium, Bulgaria, Estonia, Finland, Greece, Italy, Malta, the Netherlands, Romania, and Sweden) are relatively eco-efficient. The least efficient countries are Germany, Poland, Ireland and Slovenia.
Other different results are presented [
17]. High environmental efficiency in agriculture was achieved by Hungary, Malta, Luxembourg, and the Netherlands. They used the DEA approach for EU countries in 2008−2012.
Eco-efficiency can change over time, as confirmed by Moutinho et al. [
27] in an agricultural study and the research presented. They presented results for two years (2005 and 2010) with different eco-efficiency results. Moreover, there is a wide range of results in each year. In 2010, the most efficient countries were Bulgaria, Finland, Greece, the Netherlands, and Portugal, and the least efficient were Denmark, Germany, Latvia, Romania, and the United Kingdom.
According to Moutinho et al., Vlontzos et al. [
17,
27] efficiency can be affected by the low level of technology used. Productivity and income differences across countries are associated with differences in government support. Similarly, Moutinho et al. [
27] found there are differences not only at the country level but also at the regional level (also confirmed by Falavigna et al. [
46]).
5. Conclusions
The main objective of this work was to evaluate the environmental efficiency in EU countries. The SFA approach to measuring efficiency was used for the analysis. The measurement of environmental efficiency is an important analysis for the evaluation of sustainability. The article contributes to the theoretical knowledge of field crop production, processes new data and also describes the current situation. The study also provides the results of the analysis of nitrogen fertiliser consumption and environmental efficiency based on SFA.
The results show large differences in the environmental efficiency in crop production between EU countries. Most interesting are the differences between the new and the old member states. The efficiency of the new member states needs improvement to be the same level as that of the old member states. This problem should be taken into account when developing a new CAP for the next programming period. The discussion on environmental efficiency is important because of the sustainable development of the agricultural, or plant sector in the EU. The crop sector of five member states of European Union (i.e., Slovenia, Italy, Greece, Austria, and Spain) is relatively environmentally efficient. The remaining member states have lower efficiency. This means that these countries can reduce fertiliser consumption to achieve the same yield as the more efficient countries. Most EU countries have the ability to reduce nitrogen consumption and contribute to better environmental conditions.
Environmental efficiency in the current policy framework is an important consideration for decision making. Crop management should be considered, it can adopt sustainable practices to improve soil quality. The land factor in measuring efficiency was found to be very significant with high elasticity. It is important to encourage farmers to participate in and support agri-environmental programs. Farmers should continue to be trained in environmental protection.
One of the goals of today´s Common Agricultural Policy is to improve environmental conditions, and much attention is being focused on reducing nitrogen consumption. However, the extent of reduction is not the same for all countries. From the analysis, it is clear that countries have different consumptions, focus different levels of attention on the problem and use different farming methods. Some countries are already more environmentally efficient than others, as is also noted in this study. The Commission must take these differences into account and set different conditions depending on the country’s efficiency.
Smart nitrogen management can help reduce threats to air, water, climate, and health. In addition, the loss of a nitrogen fertiliser can lead to lower yields and higher production costs. One of the ways to reduce fertiliser use is to improve efficiency. To reduce excessive nitrogen use, farmers can use precision technology to find the best time to apply fertiliser. Growing legumes among other crops is one of the natural ways to replace nitrogen fertiliser [
43].
The analysis of environmental efficiency requires a complex approach, as there are many factors that can affect EE. Future research can focus on the environmental efficiency of crop production considering soil quality as the main factor for efficient use of fertilisers. The analysis of environmental efficiency based on the study of the use of different fertilisers (nitrogen, phosphorus, and potash) can be a current research topic.


