Article

Predicting Parameters of Heat Transfer in a Shell and Tube Heat Exchanger Using Aluminum Oxide Nanofluid with Artificial Neural Network (ANN) and Self-Organizing Map (SOM)

by
Amir Zolghadri
1,*,
Heydar Maddah
2,
Mohammad Hossein Ahmadi
3,* and
Mohsen Sharifpur
4,5,*
1
Department of Chemistry, North Tehran Branch, Islamic Azad University, Tehran 1651153311, Iran
2
Department of Chemistry, Payame Noor University (PNU), Tehran 19395-3697, Iran
3
Faculty of Mechanical Engineering, Shahrood University of Technology, Shahrood 3619995161, Iran
4
Department of Mechanical and Aeronautical Engineering, University of Pretoria, Pretoria 0002, South Africa
5
Department of Medical Research, China Medical University Hospital, China Medical University, Taichung 404, Taiwan
*
Authors to whom correspondence should be addressed.
Sustainability 2021, 13(16), 8824; https://doi.org/10.3390/su13168824
Submission received: 6 July 2021 / Revised: 26 July 2021 / Accepted: 27 July 2021 / Published: 6 August 2021

Abstract

:
This study is a model of artificial perceptron neural network including three inputs to predict the Nusselt number and energy consumption in the processing of tomato paste in a shell-and-tube heat exchanger with aluminum oxide nanofluid. The Reynolds number in the range of 150–350, temperature in the range of 70–90 K, and nanoparticle concentration in the range of 2–4% were selected as network input variables, while the corresponding Nusselt number and energy consumption were considered as the network target. The network has 3 inputs, 1 hidden layer with 22 neurons and an output layer. The SOM neural network was also used to determine the number of winner neurons. The advanced optimal artificial neural network model shows a reasonable agreement in predicting experimental data with mean square errors of 0.0023357 and 0.00011465 and correlation coefficients of 0.9994 and 0.9993 for the Nusselt number and energy consumption data set. The obtained values of eMAX for the Nusselt number and energy consumption are 0.1114, and 0.02, respectively. Desirable results obtained for the two factors of correlation coefficient and mean square error indicate the successful prediction by artificial neural network with a topology of 3-22-2.

1. Introduction

Adding nanoparticles to a base fluid affects the thermophysical characteristics of the fluid [1,2,3,4,5]. Several studies are conducted on the effects of adding nanoparticles on the heat transfer of nanofluids [6,7,8,9,10].Wanatasanapan et al. [11] investigated the influence of TiO2-Al2O3 nanoparticle mixing ratio on the thermal conductivity, rheological properties and dynamic viscosity of water-based hybrid nanofluid. Li et al. [12] estimated the stability and thermal performance of Al2O3-ethylene glycol (EG) nanofluids under ultrasonic conditions. Their results showed that Al2O3-EG nanofluids obtained by ultrasonation for 60 min showed the most encouraging properties. Sekhar et al. [13] prepared cobalt oxide-water nanofluid and studied its thermal and physical properties. Based on their results, relative viscosity values decreased with temperature and increased with the volume fraction of nanoparticles. The thermal conductivity ratio of the nanofluid increased, too. Gu et al. [14] evaluated thermal conductivity and viscosity properties of water-based nanofluid containing carbon nanotubes decorated with Ag nanoparticles. Based on their findings, thermal conductivity (k) of the nanofluid increased with the thermal filler loading and the decoration quantity of Ag nanoparticles. Bahmani et al. [15] investigated heat transfer and turbulent flow of water/alumina nanofluid in a double pipe heat exchanger. The results indicated that increasing the nanoparticles volume fraction or Reynolds number caused enhancement of Nusselt number and convection heat transfer coefficient. Maddah et al. [16] presented a factorial experimental design for the thermal performance of a double pipe heat exchanger using Al2O3-TiO2 hybrid nanofluid. They found that using nanocomposites and twisted tapes increased the exergy efficiency compared to utilizing conventional water as a heat transfer fluid. Goodarzi et al. [17] studied heat transfer and pressure drop of a counter flow corrugated plate heat exchanger using MWCNT-based nanofluids. It was shown that performance of the plate heat exchanger can be enhanced using MWCNT/water as the working fluid. Fares et al. [18] analyzed heat transfer of a shell and tube heat exchanger operating with graphene nanofluids. The results indicated that using graphene/water nanofluids enhanced the thermal performance of the shell and tube heat exchanger. Cox et al. [19] used nanofluids in a shell-and-tube heat exchanger. They found both augmentation and deterioration of heat transfer coefficient for nanofluids depending on the flow rate through the heat exchangers. In a study by Shahsavar et al. [20], impact of variable fluid properties on forced convection of Fe3O4/CNT/water hybrid nanofluid in a double-pipe mini-channel heat exchanger was assessed. The results showed that the non-Newtonian hybrid nanofluid always had a higher heat transfer rate, overall heat transfer coefficient and effectiveness than those of the Newtonian hybrid nanofluid. Maddah et al. [21] investigated viscosity and thermal conductivity of hybrid Cu/CNT water-based nanofluids at various concentrations of nanofluid and temperatures. The results demonstrated that although increased concentration resulted in enhancement of the thermal conduction coefficient and viscosity, the increase in temperature followed the expected results of increasing thermal conductivity and decreasing viscosity. Ghasemi et al. [22] predicted and optimized exergetic efficiency of TiO2-Al2O3/water nanofluid at different Reynolds numbers, volume fractions and twisted ratios using artificial neural networks and experimental data. The findings indicated successful prediction by the network. Kahani et al. [23] developed multilayer perceptron artificial neural network (MLP-ANN) and least square support vector machine (LSSVM) models to predict Nusselt number and pressure drop of TiO2/water nanofluid flows through non-straight pathways. Based on the output results of developed models, MLP-ANN model was able to predict both Nusselt number and pressure drop of nanofluid flow more precisely compared to the LSSVM model. The present study is aimed at predicting Nusselt number and energy consumption using artificial neural network in processing and preparing tomato paste based on the laboratory study by Jafari et al. [24]. Ahmadi et al. [25] used artificial neural network to predict thermo-physical properties of TiO2-Al2O3/water nanoparticles. Their results showed that the SOM and BP-LM algorithms can be considered excellent tools for predicting thermal conductivity. Zahir Shah et al. [26] investigated the impact of nanoparticle shape and radiation on the behavior of Al2O3/H2O nanofluid under the Lorentz forces. Based on their results, convective thermal energy transportation enhances with augmenting buoyancy forces, radiation parameter and nanoparticles shape factor.
Esfe [27] designed a neural network for predicting the thermal conductivity of ZnO-MWCNT/EG-water hybrid nanofluid for engineering applications. It was found that the neural network is able to predict the data. Moreover, the data regression coefficients indicated the high accuracy of the applied method. In their research, Zahir Shah et al. [28] studied heat transfer intensification of nanomaterial with involve of swirl flow device concerning entropy generation. The characteristics of thermal energy transfer of hybrid nanofluid were investigated by varying the pitch ratio (P) of the helical turbulator and Reynolds number (Re) of the fluid. The obtained results indicated that making the fluid more turbulent by increasing Re decreases the temperature of the fluid while increasing the fluid velocity. Numerical modeling on hybrid nanofluid (Fe3O4+MWCNT/H2O) migration considering MHD effect over a porous cylinder was examined by Zahir Shah et al. [29]. They concluded that the enhancing medium porosity, buoyancy forces and radiation parameter increased the free convective thermal energy flow. Zahir Shah et al. [30] formulated fractional dynamics of HIV with a source term for the supply of new CD4+ T-cells depending on the viral load via the Caputo–Fabrizio derivative. Their numerical study was focused on the path-tracking damped oscillatory behavior of a model for the HIV infection of CD4+ T-cells. Other studies are shown in Table 1.
First, using a self-organizing map (SOM) neural network, the winner neuron is identified and then this winner neuron will be used in the perceptron artificial neural network to predict the data. Input data include temperature, nanofluid concentration and Reynolds number, and output data are Nusselt number and energy consumption.

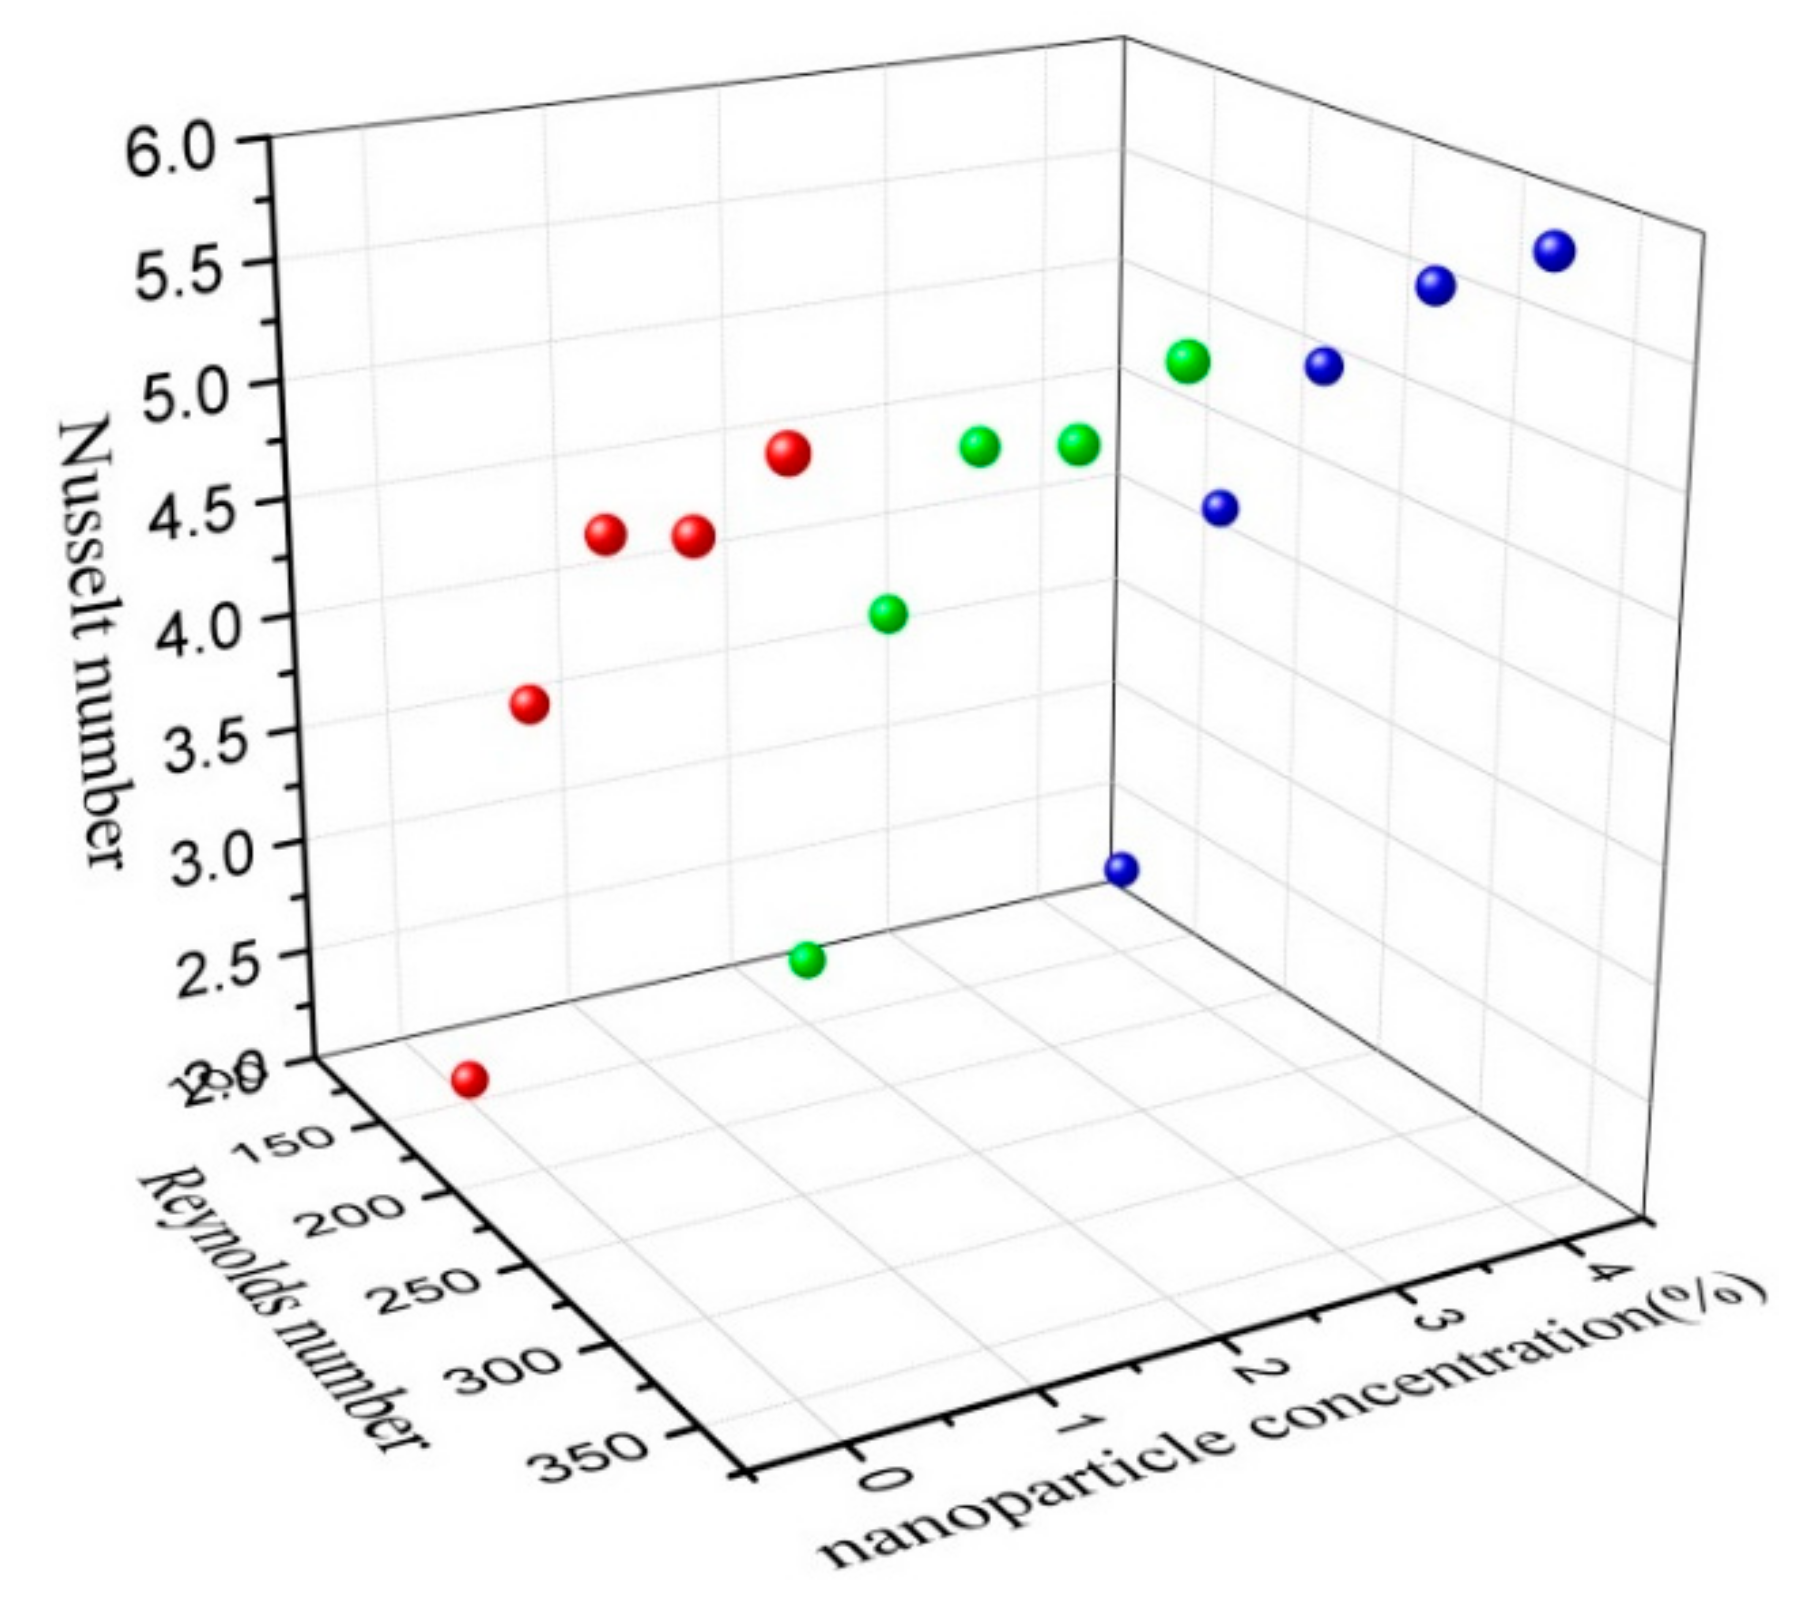
2. Experimental Data

The experimental results obtained by Jafari [24], who reported Aluminum oxide nanoparticles in shell and tube heat exchanger, were used in the temperature range of 70–90 K, Reynolds number range of 150–350, and nanoparticle concentration range of 2–4%. Figure 1 represents the Nusselt number of shell and tube heat exchanger with Al2O3–water nanofluid. Red, green and blue colours represent the Nusselt number changes in terms of Reynolds number at concentration 0, 2, and 4%, respectively. Figure 2 shows energy consumption and processing time for nanofluids and water in thermal processing of tomato juices. Red, and green colours represent energy and time, respectively.

3. Design of Neural Network Structure

3.1. Multilayer Perceptron (MLP) Neural Network

One of the best artificial neural networks for solving complex and nonlinear problems is MLP network with supervised training and error back-propagation algorithm [37]. In general, MLP networks have three layers of input, hidden and output, each layer having a number of processing units called neurons. Each neuron receives a weighted output from the previous neuron and passes it from an activation or threshold function. These functions can be of different types such as sigmoid, Gaussian, linear and binary. The training basis of these networks is to change the weight of the connections in order to achieve the desired output. To this end, first a model is presented to the network and then its output is calculated. Comparing this output with the actual value, the error rate is calculated to correct the network weights. The error is then propagated into the network and the weights are reset. This cycle continues until the sum of square errors is minimized [37]. A network is considered generalized when the amount of prediction error is acceptable using the data already introduced to the network (experimental data). Therefore, in modeling with these networks, from the beginning, the data should be divided into two categories: experimental and training data. The training model should cover the entire data space as much as possible.

3.2. Radial Base Function Model

The design of this network is faster than that of the MLP network, and it learns faster. These networks perform well when many input vectors are available and can approximate any logical function with a sufficient number of neurons. The network consists of three layers including an input layer, a hidden layer with a nonlinear active radius function, and a linear output layer. The most important nature of RBF networks is that the hidden layer neurons in the middle of the base function have reaction only from the location of the input function, and for this reason, when the input space falls in only one area, the primary function can generate a significant non-zero response; otherwise, the output is smaller than the base functions.
y k = j = 1 M w k j j x + w k   0
where M is the number of base functions, X is the input data vector, wkj represents the weight connected between the base function and the output layer, and j is the nonlinear function of unit j, which is typically a Gaussian function as follows:
j x = e x p   | | x μ j 2 | | 2 σ j 2  

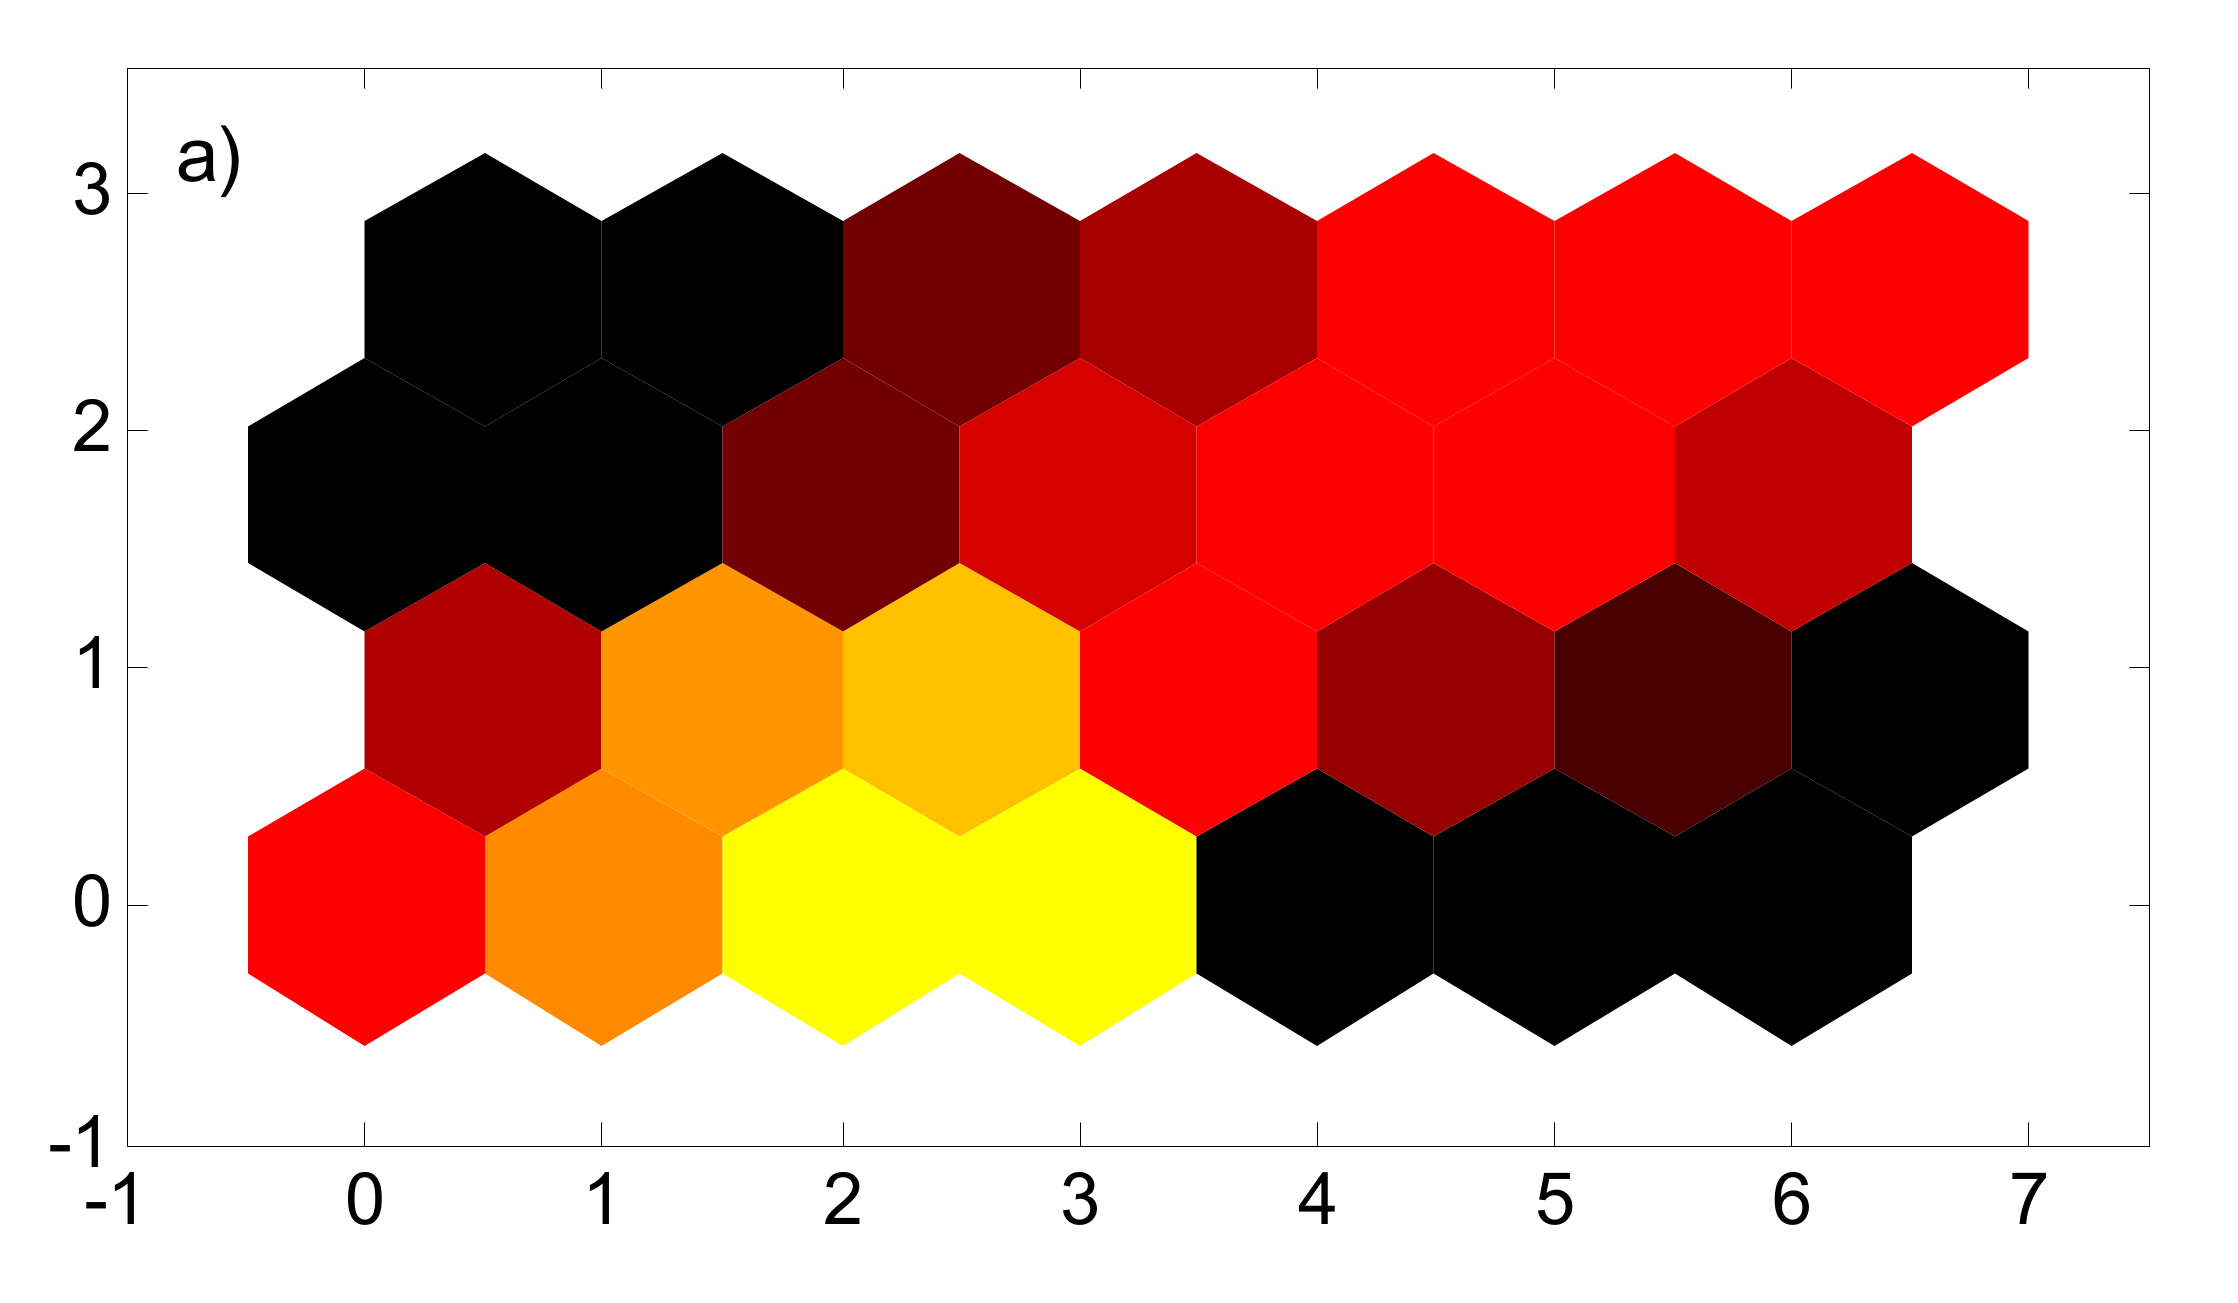
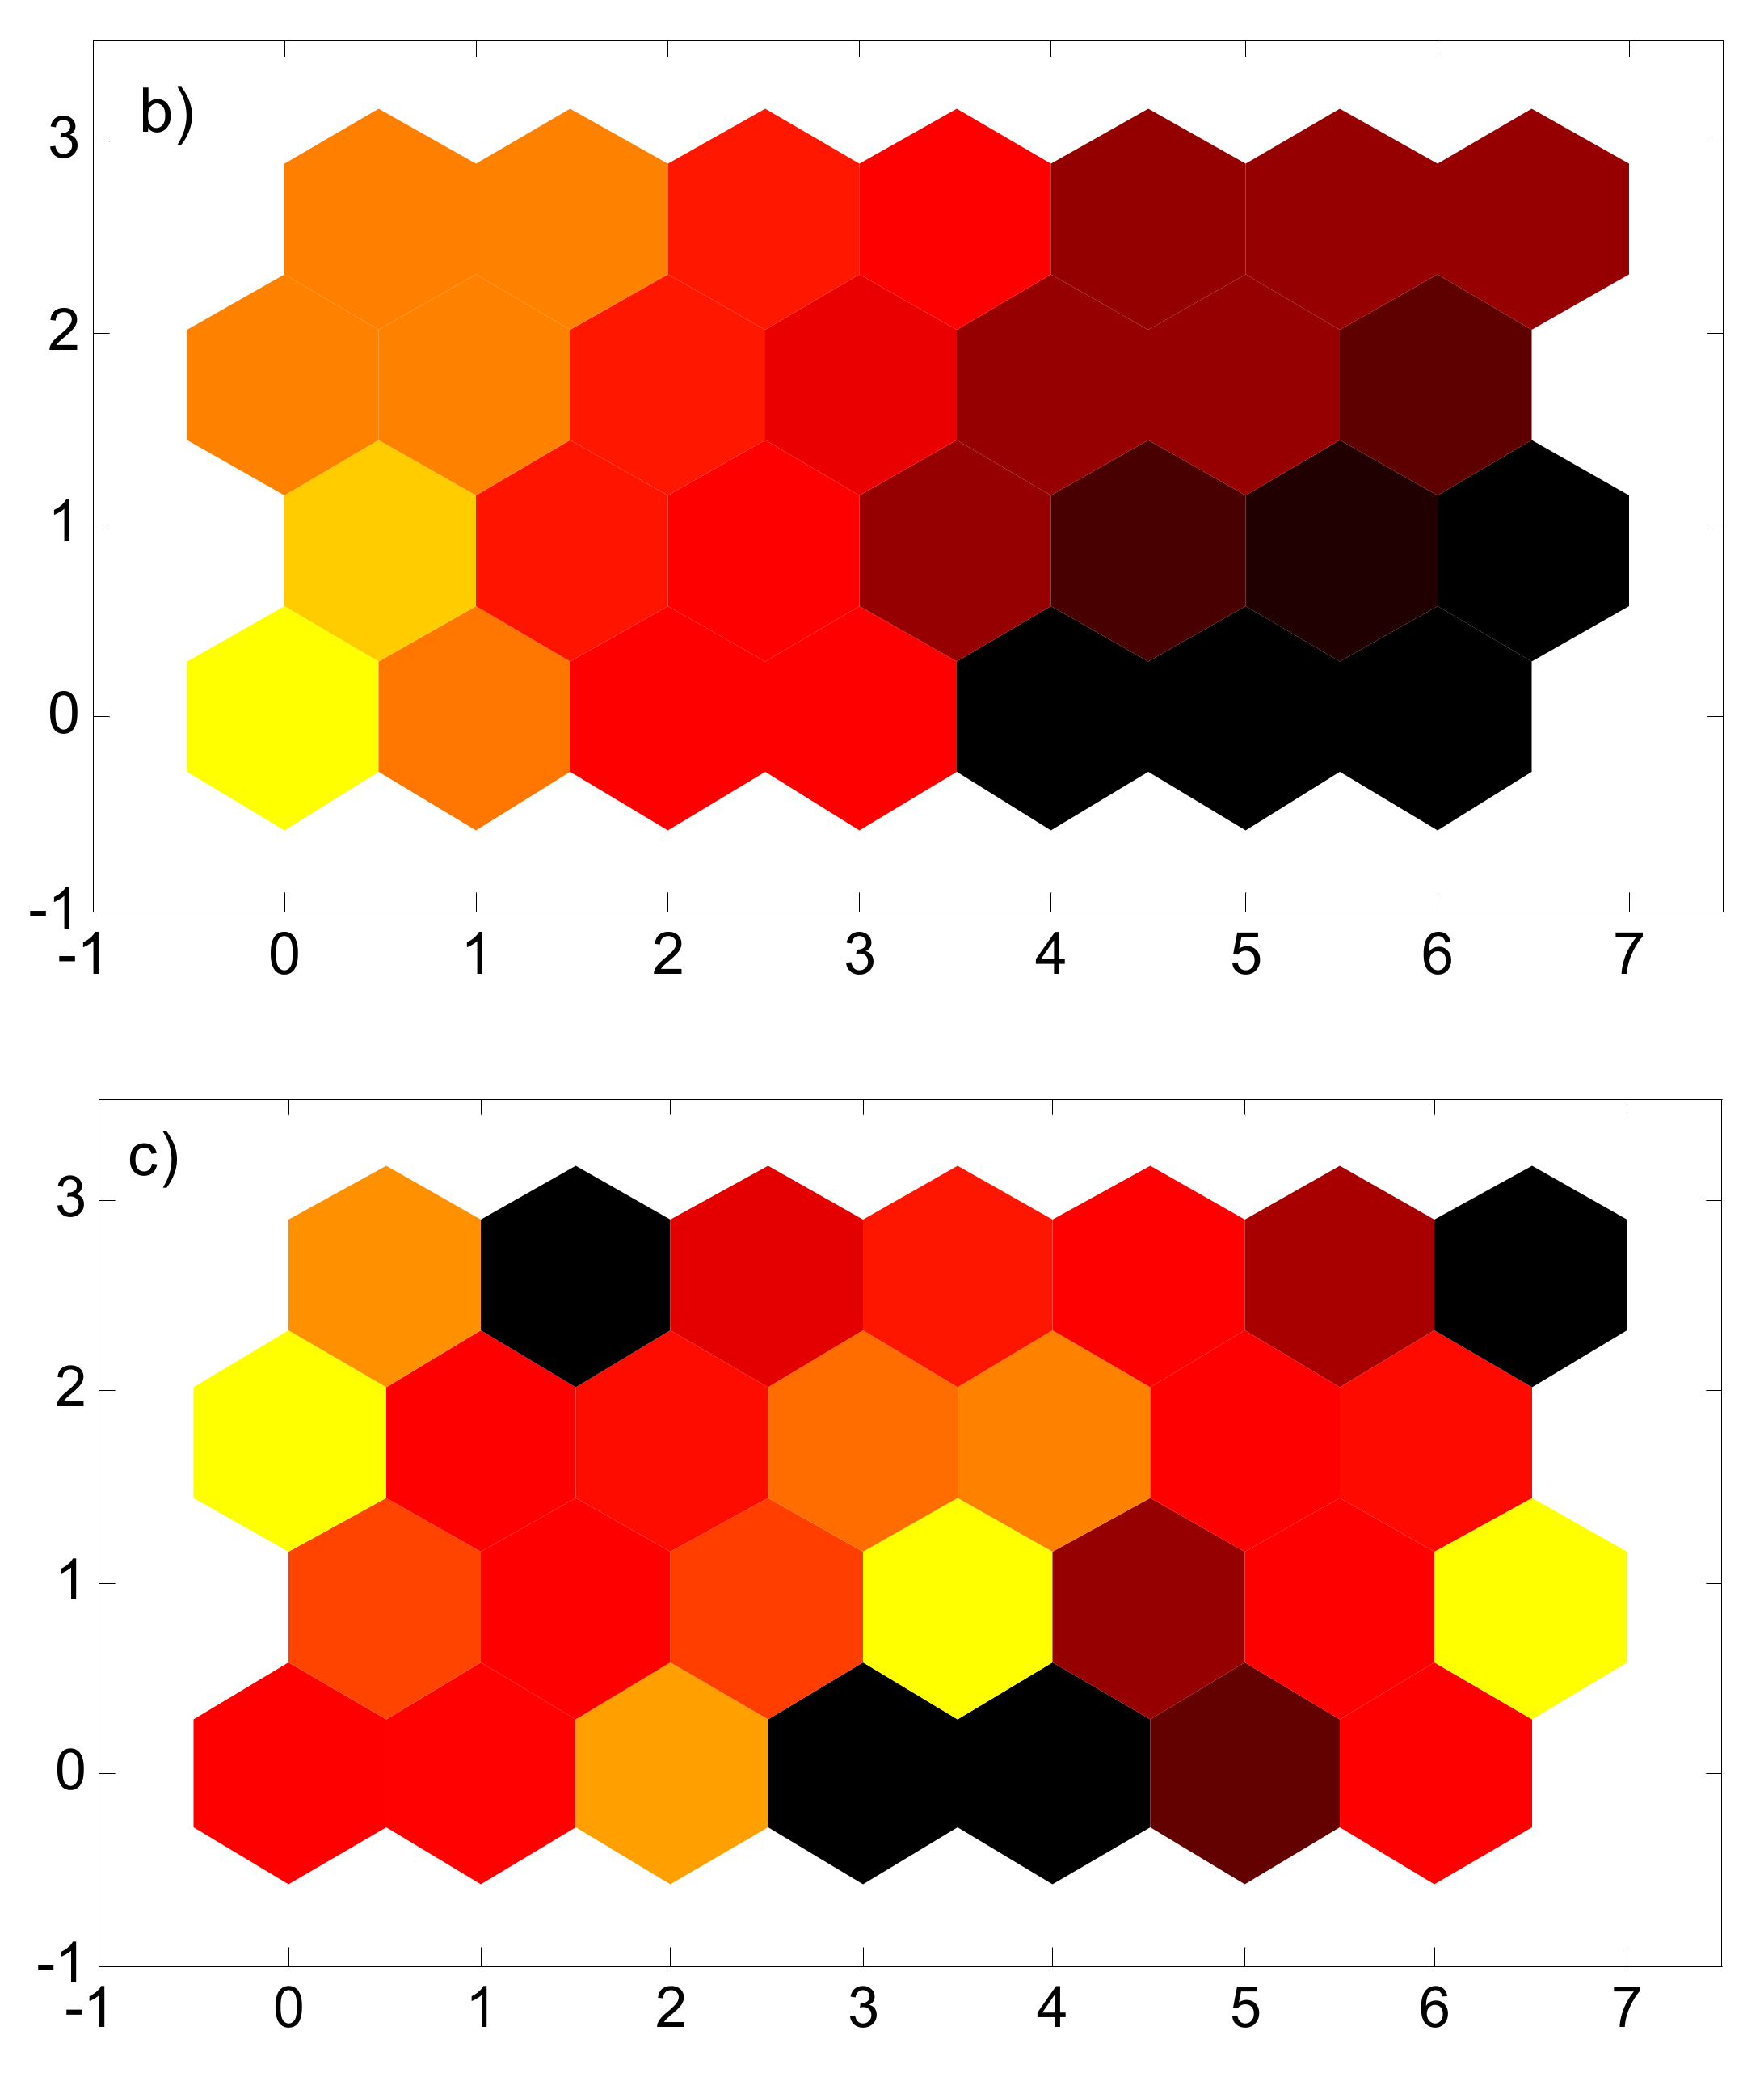
3.3. Self-Organizing Map (SOM) Neural Network

A self-organizing map (SOM) is one of the artificial intelligence methods first developed by Kohonen [38]. This model displays a regular distribution of large dimensions on a small system. Hence, it can reduce complex nonlinear relations in large data sets to a simple display. While the structure of the original topology of data is maintained, SOMs reduce the size of the data and show similar patterns. This method is done using MATLAB software and is considered one of the artificial intelligence methods. Each SOM network usually consists of an input layer and an output layer. Weight vectors (synapses) connect the input layer to the output layer (called the competitive map or layer). In an iterative process, SOM is trained. Each input vector, based on the maximum similarity, activates a node called the winner cell in the output layer. The similarity between the two vectors is usually based on the Euclidean distance according to Equation (3), which is often measured as a difference [38]:
D J =   i = 1 n | | W i j X i | | 2  
where X i is the i th input vector, W i j is the weight vector connecting the input i to the output neuron j , and D J is the sum of the Euclidean distance between the input sample x i and its weight vector connecting to the j th output cell, called the map unit.

4. Levenberg–Marquardt and Momentum Algorithm

4.1. Back Propagation Learning Algorithm

This algorithm is one of the learning algorithms with observer, which basically consists of two main paths:
Forward path: where the input vector is applied to the neural network and its effect is propagated to the output layer through the middle layers. In this path, for each input, a value called output is calculated by the network. Network parameters remain constant in this path.
Backward path: after generating output in the forward path, the difference between the desired output (observed) and output calculated by the network is determined. Error signals on the backward path are redistributed from the output layer throughout the network and the network parameters are reset.
The above dual process is repeated many times to bring the network output closer to the desired output. When the error obtained from the permissible threshold is small, the training process is stopped. Error back propagation method, Levenberg–Marquardt algorithm, due to faster convergence in training medium-sized networks, has been selected for use in the present study. The error back propagation algorithm changes the network weights and bias values in such a way that the performance function decreases more rapidly.

4.2. Momentum Algorithm

In this algorithm, the law of weight change can be considered in such a way that the weight change in the nth iteration is to some extent dependent on the weight change size in the previous repetition.

5. Modeling of Artificial Neural Network

The number of input data to the artificial neural network was 225 data, which included Reynolds number, nanoparticle concentration and temperature. Seventy-five data obtained for Nusselt number and energy consumption were considered as the objective function. The neural network is designed using a multilayer perceptron algorithm. The general modeling process for predicting the Nusselt number and energy consumption is represented in Figure 3. As seen, this network has three inputs, a hidden layer with 22 neurons and two outputs. The transfer function is sigmoid and Purelin transfer function is used in the output layer.
The parameters of temperature, Reynolds number and nanofluid concentration were considered as inputs to the SOM neural network to investigate and select the winner neuron with the most data. As shown in figure below, a network with 3 inputs and 28 neurons is evaluated (Figure 4).
In this study, a two-layered feedforward neural network using error back propagation-Levenberg-Marquardt (BP-LM) and momentum algorithms was employed for modelling the Nusselt number and energy consumption.
Mean square errors (MSE) and coefficient of determination (R) are used to evaluate the results [32].
MSE = 1 N i = 1 N u i E x p u i A N N 2
R 2 = i = 1 N u i E x p u ¯ 2 i = 1 N u u i A N N 2 u u ¯ 2
where N is the number of experimental data, U i E x p is the experimental data assigned to Nusselt number or energy consumption and U i A N N is the Nusselt number or energy consumption predicted by neural network. Moreover, U ¯ is the mean value of Nusselt number or energy consumption and e ¯ is the mean value of error.

6. Results and Discussion

Figure 5 represents the output of the SOM artificial neural network with primary neurons and the number of their members. Yellow colour represents successful neuron assigning 15 data to itself and blue colour represents unsuccessful neurons. Each neuron contains a number of data. Each neuron having the most data is the winner neuron [25]. In Figure 5, it can be said that the winner neuron is neuron 22 with 22 data. This neuron can be used in the perceptron neural network. The distance between the center of each neuron relative to the neighboring neuron is shown in Figure 6. The longer the distance between the neurons, the darker their neighborhood line is, and the shorter the distance, the more similar they are to each other and the brighter the lines are. The neurons 25 and 26 are farther apart, but the neurons 5 and 6 are closer to each other and more similar (Figure 6).
In Figure 7a, the range of input temperature data is 70, 80 and 90 K and contains 75 data. As seen, black neurons 1, 2, 8, 9, 21, 26, 27 and 28 have the least excitability, and the neurons 24 and 25, which are yellow, have a higher excitability. The same analysis can be done for Figure 7b,c. The target and simulated data in the program can be plotted and matched so that the simulation error can be clearly seen. This is shown in Figure 8a,b. In these diagrams, the horizontal axis is the number of data and the vertical axis is the network output values (modeling results) and the target input data (the experimental results for Nusselt number and energy consumption). As seen, the network prediction is very close to the experimental data, indicating the high accuracy and success of the program with the topology of 3-22-2. The discrepancy between the model data and the actual data may be due to measurement error or other errors during testing.
Figure 9a,b present the values obtained from the execution of the program for the correlation coefficient and the mean square error for the whole data. The experimental values obtained for the Nusselt number and energy consumption are shown against the values predicted by the artificial neural network with 22 neurons. The values of correlation coefficient, mean square error and maximum error (emax) for Nusselt number and energy consumption are 0.9994, 0.0023357, 0.11114, 0.9993, 0.00011465 and 0.02, respectively. One of the major problems related to artificial neural network instruction is over-fitting or over-training, in which the generated artificial neural network system can only produce a good forecast for a known data set and is unable to provide a reasonable forecast for the new data set. To avoid over-fitting and improve the generalization capacity of the network, the early-stopping technique is used. In this method, all data is randomly divided into three sub-sections, namely instruction, validation and test. The instruction or training is for network training, and the validation or evaluation set is used to ensure the accuracy and generalization of the network developed during the training process. The network training process stops when the evaluation or validation set error increases, even if training continues until the training set error is minimized. When network training is stopped, the test phase is used to check the final performance of the network.
Figure 10 and Figure 11 represent the obtained values of correlation coefficient and mean square error for Nusselt number and energy consumption data. These values are shown for the training, validation, testing and total data. As seen, running a network with 22 neurons, the values of the correlation coefficient obtained for the Nusselt number and the energy consumption for the training, validation, testing and total data are equal to 0.99938, 0.99876, 0.99971, 0.99935–0.99928, 0.999, 0.99903 and 0.99918.
Using the same procedure, the mean square errors are also 0.002335, 0.00338548, 0.0014088, 0.0024226–0.00011405, 0.00021978, 0.00015764 and 0.0001363. The closer the correlations are to 1 and the mean square errors to 0, the better the results of predicting the Nusselt number and energy consumption are.
Figure 12a,b show the effect of the number of training cycles on neural network performance. As seen in this figures, the mean square error of the network starts from a large value and gradually decreases [34]. This means that the network learning process is progressive. The evaluation set is used to maintain the network. The network training process continues until the network error about the evaluation network is reduced. According to Figure 12a,b, with increasing the number of cycles to about 2 and 3 cycles, the amount of network training and test error decreases. After that, as the number of cycles increases, the error rate does not change much and remains almost constant. Therefore, in this study, the number of 2 and 3 cycles is considered as the desired number of cycles for the Nusselt number and energy consumption, respectively. According to Figure 12a,b, the values of the best performance for the network with the mean square error for the Nusselt number and energy consumption are 0.0038548 and 0.00021976, respectively.
Validation data indicate the ability to predict and generalize the neural network appropriately, in such a way that the output data of the algorithm are completely consistent with the actual output data. Validation against new data increases network error and stops the training process.
Just as a small number of neurons in the middle layer can produce undesirable results, an increase in the number of neurons in the middle layer also leads to an increase in error. Because the high number of neurons in this layer causes the network to become too complex and trained, and the small number of neurons will cause the neural network not to be trained and the data to be stored. As shown, the values of R and MSE are only presented for the overall data. It is seen that a structure with 22 neurons in each hidden layer is the best structure to model the mixture conduction (Table 2 and Table 3).The radial and perceptron artificial neural network with the algorithms mentioned in Table 2 and Table 3, by learning a number of recorded data, has been able to predict the Nusselt number and the amount of energy consumed in the whole training range. The reason for the good performance of the neural network of the present study can be attributed to the intelligent data analysis process, appropriate measurements, use of scattered data, generalizability, having the features of the ability to learn, parallel processing, robustness and selection of effective characteristics in the shell-tube heat exchanger (so that the neural network during the training process, by creating logical relationships between input and output mappings, uses it to calculate data not used in network training). The results of the Levenberg–Marquat algorithm for the radial and perceptron neural network are also much more successful than the momentum algorithm.
Figure 13a,b represent the error distribution for the Nusselt number and energy consumption in terms of the number of samples. As shown, the uniform distribution is observed around zero, with the highest error values for the Nusselt number data in the range of ±0.1 and for the energy consumption data in the range of ±0.02.
Examining the performance diagrams for the Nusselt number and energy consumption, the results are desirable for the following reasons:
1. The mean square error values are low.
2. The mean square errors of the training, validation and testing set have similar behavior and characteristics.

7. Conclusions

In this study, predicting the parameters of Nusselt number and energy consumption in the processing of tomato paste using perceptron artificial neural network was evaluated. The input parameters included Reynolds number, temperature and concentration of aluminum oxide nanofluid, and Nusselt number and energy consumption were output or target data. The hidden layer had 22 neurons with sigmoid transfer function and output layer had Purelin function. According to the results, the neural network with a topology of 3-22-2 had high accuracy, so that the network evaluation indicators such as correlation coefficient and mean square error indicated desirable values and the predicted values for Nusselt number and energy consumption were in good agreement with the experimental results.
Statistical analysis of regression through correlation coefficients and mean squared error showed that the multilayer perceptron network with Levenberg–Marquardt algorithm had better conditions for Nusselt number and energy consumption modeling than the neural network with radial function and momentum algorithm.
The smaller the discrepancy between the output data from the modeling and the laboratory data, the higher the efficiency of the algorithm used in predicting the output.
Validation data show the ability to appropriately and favorably predict and generalize the neural network.
Validation against new data causing increased network error resists and stops the training process.

Author Contributions

A.Z.: Conceptualization, Supervision, Writing—Reviewing and Editing. H.M.: Writing, Visualization, Investigation, M.H.A.: Methodology, Reviewing, original draft preparation, collecting data, writing. M.S.: Reviewing, editing, methodology. All authors have read and agreed to the published version of the manuscript.

Funding

This research received no external funding.

Institutional Review Board Statement

Not applicable.

Informed Consent Statement

Not applicable.

Data Availability Statement

All necessary data are provided in the manuscript.

Conflicts of Interest

There is no conflict of interest.

Abbreviations

SOMself-organizing map
ANNartificial neural network
MLPmulti-layer perceptron
BPback propagation
MSEmean square error
Rcorrelation coefficients
eMAXmaximum error
LMLevenberg-Marquardt

References

  1. Elsaid, K.; Abdelkareem, M.A.; Maghrabie, H.M.; Sayed, E.T.; Wilberforce, T.; Baroutaji, A.; Olabi, A.G. Thermophysical properties of graphene-based nanofluids. Int. J. Thermofluids 2021, 10, 100073. [Google Scholar] [CrossRef]
  2. Ma, M.; Zhai, Y.; Yao, P.; Li, Y.; Wang, H. Effect of surfactant on the rheological behavior and thermophysical properties of hybrid nanofluids. Powder Technol. 2021, 379, 373–383. [Google Scholar] [CrossRef]
  3. Kumar, A.; Subudhi, S. Experimental investigation on the thermophysical properties of low concentration magnetic colloidal suspensions (nanofluids) with the variations in temperature & magnetic field. J. Magn. Magn. Mater. 2021, 526, 167723. [Google Scholar]
  4. Hozien, O.; El-Maghlany, W.M.; Sorour, M.M.; Mohamed, Y.S. Experimental study on thermophysical properties of TiO2, ZnO and Ag water base nanofluids. J. Mol. Liq. 2021, 334, 116128. [Google Scholar] [CrossRef]
  5. Urmi, W.; Rahman, M.M.; Hamzah, W.A.W. An experimental investigation on the thermophysical properties of 40% ethylene glycol based TiO2-Al2O3 hybrid nanofluids. Int. Commun. Heat Mass Transf. 2020, 116, 104663. [Google Scholar] [CrossRef]
  6. Narankhishig, Z.; Ham, J.; Lee, H.; Cho, H. Convective heat transfer characteristics of nanofluids including the magnetic effect on heat transfer enhancement—A review. Appl. Therm. Eng. 2021, 193, 116987. [Google Scholar] [CrossRef]
  7. Saleh, B.; Sundar, L.S. Experimental study on heat transfer, friction factor, entropy and exergy efficiency analyses of a corrugated plate heat exchanger using Ni/water nanofluids. Int. J. Therm. Sci. 2021, 165, 106935. [Google Scholar] [CrossRef]
  8. Singh, K.; Sharma, S.K.; Gupta, S.M. An experimental investigation of hydrodynamic and heat transfer characteristics of surfactant-water solution and CNT nanofluid in a helical coil-based heat exchanger. Mater. Today Proc. 2021, 43, 3896–3903. [Google Scholar]
  9. Fazeli, I.; Emami MR, S.; Rashidi, A. Investigation and optimization of the behavior of heat transfer and flow of MWCNT-CuO hybrid nanofluid in a brazed plate heat exchanger using response surface methodology. Int. Commun. Heat Mass Transf. 2021, 122, 105175. [Google Scholar] [CrossRef]
  10. Akbari, O.A.; Toghraie, D.; Karimipour, A.; Safaei, M.R.; Goodarzi, M.; Alipour, H.; Dahari, M. Investigation of rib's height effect on heat transfer and flow parameters of laminar water–Al2O3 nanofluid in a rib-microchannel. Appl. Math. Comput. 2016, 290, 135–153. [Google Scholar]
  11. Wanatasanapan, V.V.; Abdullah, M.Z.; Gunnasegaran, P. Effect of TiO2-Al2O3 nanoparticle mixing ratio on the thermal conductivity, rheological properties, and dynamic viscosity of water-based hybrid nanofluid. J. Mater. Res. Technol. 2020, 9, 13781–13792. [Google Scholar] [CrossRef]
  12. Li, L.; Zhai, Y.; Jin, Y.; Wang, J.; Wang, H.; Ma, M. Stability, thermal performance and artificial neural network modeling of viscosity and thermal conductivity of Al2O3-ethylene glycol nanofluids. Powder Technol. 2020, 363, 360–368. [Google Scholar] [CrossRef]
  13. Sekhar, T.V.R.; Nandan, G.; Prakash, R.; Muthuraman, M. Investigations on viscosity and thermal conductivity of cobalt oxide-water nano fluid. Mater. Today Proc. 2018, 5, 6176–6182. [Google Scholar] [CrossRef]
  14. Gu, Y.; Xu, S.; Wu, X. Thermal conductivity enhancements and viscosity properties of water based Nanofluid containing carbon nanotubes decorated with ag nanoparticles. Heat Mass Transf. 2018, 54, 1847–1852. [Google Scholar] [CrossRef]
  15. Bahmani, M.H.; Sheikhzadeh, G.; Zarringhalam, M.; Akbari, O.A.; Alrashed, A.A.; Shabani GA, S.; Goodarzi, M. Investigation of turbulent heat transfer and nanofluid flow in a double pipe heat exchanger. Adv. Powder Technol. 2018, 29, 273–282. [Google Scholar] [CrossRef]
  16. Maddah, H.; Aghayari, R.; Mirzaee, M.; Ahmadi, M.H.; Sadeghzadeh, M.; Chamkha, A.J. Factorial experimental design for the thermal performance of a double pipe heat exchanger using Al2O3-TiO2 hybrid nanofluid. Int. Commun. Heat Mass Transf. 2018, 97, 92–102. [Google Scholar] [CrossRef]
  17. Goodarzi, M.; Amiri, A.; Goodarzi, M.S.; Safaei, M.R.; Karimipour, A.; Languri, E.M.; Dahari, M. Investigation of heat transfer and pressure drop of a counter flow corrugated plate heat exchanger using MWCNT based nanofluids. Int. Commun. Heat Mass Transf. 2015, 66, 172–179. [Google Scholar] [CrossRef]
  18. Fares, M.; Mohammad, A.M.; Mohammed, A.S. Heat transfer analysis of a shell and tube heat exchanger operated with graphene nanofluids. Case Stud. Therm. Eng. 2020, 18, 100584. [Google Scholar] [CrossRef]
  19. Cox, J.; Kanjirakat, A.; Sadr, R. Application of Nanofluids in a Shell-and-Tube Heat Exchanger. In Proceedings of the International Conference on Nanochannels, Microchannels, and Minichannels, Sapporo, Japan, 10–16 June 2013; American Society of Mechanical Engineers: New York, NY, USA, 2013; V001T02A003. [Google Scholar]
  20. Shahsavar, A.; Godini, A.; Sardari, P.T.; Toghraie, D.; Salehipour, H. Impact of variable fluid properties on forced convection of Fe3O4/CNT/water hybrid nanofluid in a double-pipe mini-channel heat exchanger. J. Therm. Anal. Calorim. 2019, 137, 1031–1043. [Google Scholar] [CrossRef]
  21. Maddah, H.; Ghazvini, M.; Ahmadi, M.H.; Bui, D.T.; Bandarr Filho, E.P. Performance evaluation of a U-shaped heat exchanger containing hybrid Cu/CNTs nanofluids: Experimental data and modeling using regression and artificial neural network. J. Therm. Anal. Calorim. 2021, 143, 1503–1521. [Google Scholar] [CrossRef]
  22. Ghasemi, N.; Aghayari, R.; Maddah, H. Designing an artificial neural network using radial basis function to model exergetic efficiency of nanofluids in mini double pipe heat exchanger. Heat Mass Transf. 2018, 54, 1707–1719. [Google Scholar] [CrossRef]
  23. Kahani, M.; Ahmadi, M.H.; Tatar, A.; Sadeghzadeh, M. Development of multilayer perceptron artificial neural network (MLP-ANN) and least square support vector machine (LSSVM) models to predict Nusselt number and pressure drop of TiO2/water nanofluid flows through non-straight pathways. Numer. Heat Transf. Part A Appl. 2018, 74, 1190–1206. [Google Scholar] [CrossRef]
  24. Jafari, S.M.; Jabari, S.S.; Dehnad, D.; Shahidi, S.A. Heat transfer enhancement in thermal processing of tomato juice 333 by application of nanofluids. Food Bioprocess Technol. 2017, 10, 307–316. [Google Scholar] [CrossRef]
  25. Sadeghzadeh, M.; Maddah, H.; Ahmadi, M.H.; Khadang, A.; Ghazvini, M.; Mosavi, A.; Nabipour, N. Prediction of thermo-physical properties of TiO2-Al2O3/water nanoparticles by using artificial neural network. Nanomaterials 2020, 10, 697. [Google Scholar] [CrossRef] [PubMed] [Green Version]
  26. Shah, Z.; Kumam, P.; Selim, M.M.; Alshehri, A. Impact of nanoparticles shape and radiation on the behavior of nanofluid under the Lorentz forces. Case Stud. Therm. Eng. 2021, 26, 101161. [Google Scholar] [CrossRef]
  27. Esfe, M.H.; Esfandeh, S.; Saedodin, S.; Rostamian, H. Experimental evaluation, sensitivity analyzation and ANN modeling of thermal conductivity of ZnO-MWCNT/EG-water hybrid nanofluid for engineering applications. Appl. Therm. Eng. 2017, 125, 673–685. [Google Scholar] [CrossRef]
  28. Shah, Z.; Jafaryar, M.; Sheikholeslami, M.; Kumam, P. Heat transfer intensification of nanomaterial with involve of swirl flow device concerning entropy generation. Sci. Rep. 2021, 11, 1–15. [Google Scholar] [CrossRef]
  29. Shah, Z.; Saeed, A.; Khan, I.; MSelim, M.; Kumam, P. Numerical modeling on hybrid nanofluid (Fe3O4+ MWCNT/H2O) migration considering MHD effect over a porous cylinder. PLoS ONE 2021, 16, e0251744. [Google Scholar] [CrossRef]
  30. Shah, Z.; Jan, R.; Kumam, P.; Deebani, W.; Shutaywi, M. Fractional Dynamics of HIV with Source Term for the Supply of New CD4+ T-Cells Depending on the Viral Load via Caputo–Fabrizio Derivative. Molecules 2021, 26, 1806. [Google Scholar] [CrossRef]
  31. Ghasemi, N.; Maddah, H.; Mohebbi, M.; Aghayari, R.; Rohani, S. Proposing a method for combining monitored multilayered perceptron (MLP) and self-organizing map (SOM) neural networks in prediction of heat transfer parameters in a double pipe heat exchanger with nanofluid. Heat Mass Transf. 2019, 55, 2261–2276. [Google Scholar] [CrossRef]
  32. Maddah, H.; Aghayari, R.; Ahmadi, M.H.; Rahimzadeh, M.; Ghasemi, N. Prediction and modeling of MWCNT/Carbon (60/40)/SAE 10 W 40/SAE 85 W 90 (50/50) nanofluid viscosity using artificial neural network (ANN) and self-organizing map (SOM). J. Therm. Anal. Calorim. 2018, 134, 2275–2286. [Google Scholar] [CrossRef]
  33. Hojjat, M. Nanofluids as coolant in a shell and tube heat exchanger: ANN modeling and multi-objective optimization. Appl. Math. Comput. 2020, 365, 124710. [Google Scholar] [CrossRef]
  34. Aghayari, R.; Rohani, S.; Ghasemi, N.; Heiran EN, K.; Mazaheri, H. Numerical investigation of heat transfer in a helically coiled tube using copper/water nano-fluid under constant heat flux and prediction of the results using perceptron and radial basis function networks. Heat Mass Transf. 2020, 56, 1051–1075. [Google Scholar] [CrossRef]
  35. Esfe, M.H. Designing a neural network for predicting the heat transfer and pressure drop characteristics of Ag/water nanofluids in a heat exchanger. Appl. Therm. Eng. 2017, 126, 559–565. [Google Scholar] [CrossRef]
  36. Aghayari, R.; Maddah, H.; Pourkiaei, S.M.; Ahmadi, M.H.; Chen, L.; Ghazvini, M. Theoretical and experimental studies of heat transfer in a double-pipe heat exchanger equipped with twisted tape and nanofluid. Eur. Phys. J. Plus 2020, 135, 1–26. [Google Scholar] [CrossRef]
  37. Ellis, G.W.; Yao, C.; Zhao, R.; Penumadu, D. Stress-strain modeling of sands using artificial neural networks. J. Geotech. Eng. 1995, 121, 429–435. [Google Scholar] [CrossRef]
  38. Kohonen, T. Self-Organizing Maps; Springer: Berlin/Heidelberg, Germany, 1997. [Google Scholar]
Figure 1. The Nusselt number of shell and tube heat exchanger with Al2O3–water nanofluid.
Sustainability 13 08824 g001
Figure 2. Energy consumption and processing time for nanofluids and water in thermal processing of tomato juices.
Sustainability 13 08824 g002
Figure 3. General program execution algorithm.
Sustainability 13 08824 g003
Figure 4. The schematic of (SOM) neural network used.
Sustainability 13 08824 g004
Figure 5. Statistical chart of winner neurons of SOM neural network.
Sustainability 13 08824 g005
Figure 6. SOM neighbor weight distances.
Sustainability 13 08824 g006
Figure 7. Influence of the input. (a) temperature, (b) Reynolds number, and (c) nanofluid concentration variable weights on neural network neurons for clustering definition. Different colours represent different neurons.
Sustainability 13 08824 g007aSustainability 13 08824 g007b
Figure 8. The results of the predicted (a) Nusselt number, and (b) energy consumption versus experimental data with number of samples.
Sustainability 13 08824 g008aSustainability 13 08824 g008b
Figure 9. The obtained values of the correlation coefficient (R) and mean square errors (MSE) for (a) Nusselt number and (b) energy consumption using the artificial neural network.
Sustainability 13 08824 g009
Figure 10. Optimal values of (a) mean square error and (b) correlation coefficient (linear regression) for the training, validation, test and total data for Nusselt number.
Sustainability 13 08824 g010
Figure 11. Optimal values of (a) mean square error and (b) correlation coefficient (linear regression) for the training, validation, test and total data for energy consumption.
Sustainability 13 08824 g011
Figure 12. Mean square error (MSE) variations during training steps for training, validation and testing for a neural network: (a) Nusselt number, (b) energy consumption.
Sustainability 13 08824 g012
Figure 13. The values obtained for error rate with the number of samples: (a) Nusselt number, (b) energy consumption.
Sustainability 13 08824 g013
Table 1. Several reported experimental works for heat transfer of the various nanofluids in heat exchanger.
AuthorsNanoparticlesHeat ExchangerResponseMethod
Ghasemi et al. [31]magnesium oxidedouble pipe heat exchangerNusselt number, overall heat transfer coefficient and pressure dropANN-SOM
Maddah et al. [32]multiwall carbon nanotube/carbon (60/40)double pipe heat exchangerrelative viscosityANN-SOM
Hojjat et al. [33]Aluminum oxidea shell and tube heat exchangerNusselt number, pressure dropANN
Aghayari et al. [34]copper oxidehelical coilNusselt number, entropy generationANN-SOM
Hemmat Esfe et al. [35]Agdouble tube heat exchangeNusselt number, pressure dropRBF-ANN
Aghayari et al. [36]iron oxidedouble tube heat exchangeNusselt numberANN
Table 2. Obtained values for the MSE and R-squared various structures (MLP).
Levenberg-Marquardt AlgorithmMomentum Algorithm
Nusselt NumberConsumption EnergyNusselt Number Consumption Energy
Number of Hidden LayersNumber of Neurons in Each Hidden LayerRMSERMSERMSERMSE
120.979350.014020.988680.002650.98320.0083650.97520.000131
140.998750.0084750.999250.0011650.98380.0094720.97810.000153
160.999120.0055410.999450.0008410.97580.0060470.97450.000159
180.999510.0074600.998690.0001950.98060.0068140.98140.000137
1100.989120.0055110.998650.0065120.98240.0037640.97360.000146
1120.999660.0032980.99540.0055140.98400.0053810.97460.000137
1140.99760.0041570.998750.0006350.98470.0043750.98400.000148
1160.998650.0026390.998680.0003510.98530.0055920.98240.000129
1180.99840.0035540.99250.00015150.98580.0052410.97790.000136
1200.99690.00602390.98990.0004120.98600.0039300.98040.000154
1220.99940.00233570.99930.000114650.98690.0032540.98740.000123
1240.99890.0027140.99230.000123650.98610.0047250.97960.000134
1260.99910.0030460.99650.00063150.98550.0056950.98130.000147
1280.99810.0023980.99940.00019360.98590.0036280.98570.000149
Table 3. Obtained values for the MSE and R-squared various structures (RBF).
Levenberg-Marquardt AlgorithmMomentum Algorithm
Nusselt NumberConsumption EnergyNusselt NumberConsumption Energy
Number of Hidden LayersNumber of Neurons in Each Hidden LayerRMSERMSERMSERMSE
120.98360.06540.97250.0074610.96140.0042560.97560.007112
140.99400.00840.99340.0046290.96870.0048750.97320.006148
160.98940.007490.96540.0033240.97540.0052980.97850.008322
180.97740.002540.98700.0017820.98010.0064890.98210.008156
1100.95680.006120.98130.0065140.97360.0062340.97130.008417
1120.97400.005320.97650.0014870.98010.0061280.97240.006612
1140.99000.0035410.98410.0036210.97330.0047360.97760.006954
1160.98110.004230.97700.0021400.97580.0065120.96370.007532
1180.96380.0069880.98550.0055410.97630.0051270.96350.007713
1200.98910.055470.98940.0023420.98040.0059140.96460.003849
1220.98980.0031540.99020.0014110.98110.0039410.98780.003745
1240.97680.0031800.98760.0025140.97880.0048240.97440.004185
1260.97350.004250.97250.0041560.97680.0067180.97850.004732
1280.98880.006480.97410.0074160.97250.0062840.979600003924
Publisher’s Note: MDPI stays neutral with regard to jurisdictional claims in published maps and institutional affiliations.

