Article

Estimation of Urban Land-Use Efficiency for Sustainable Development by Integrating over 30-Year Landsat Imagery with Population Data: A Case Study of Ha Long, Vietnam

1
Land and Water, Commonwealth Scientific and Industrial Research Organisation (CSIRO), Canberra 2601, Australia
2
Vietnam National Space Center (VNSC), Vietnam Academy of Science and Technology (VAST), 18 Hoang Quoc Viet, Hanoi 100000, Vietnam
*
Authors to whom correspondence should be addressed.
Sustainability 2021, 13(16), 8848; https://doi.org/10.3390/su13168848
Submission received: 21 June 2021 / Revised: 29 July 2021 / Accepted: 4 August 2021 / Published: 7 August 2021

Abstract

:
Humans are moving into urban areas at an accelerated pace. An increasing urban population fuels urban expansion and reduces nearby agricultural lands and natural environments such as forests, swamps, other water-pervious areas. Unsustainable development creates a disproportion between the growth of urban areas and the growth in urban population. The UN SDG indicator 11.3.1 specifically addresses the issue of the measurement of land-use efficiency. While the metric and methodology to estimate the indicator are straightforward, it faces problems of data unavailability and inconsistency. Vietnam has a record of tremendous economic growth that has translated into more urban settlements of size. Consequently, rural population movement into urban areas has led to many urban sustainable planning and development challenges. In the absence of previous work on estimating land-use efficiency in Vietnamese cities, this study makes the first attempt to examine land-use efficiency in Ha Long, one of the country’s fast-growing cities in recent decades. We mapped land use from high-resolution Landsat imagery (30 m) spanning multi-decadal observations from 1986 to 2020. An advanced machine learning approach, the Support Vector Machine algorithm, was applied to estimate the built-up area, which, by integration with census data, is essential for calculating SDG indicator 11.3.1. This study shows that the land-use efficiency metric was positive but small at the beginning of the considered period but increased in 2000–2020. These results suggest that before 2000, the urban land consumption rate in Ha Long was lower than the population growth rate, implying denser urban land use. The situation changed to the opposite when the urban land consumption rate exceeded the population growth rate in the past two decades. The study’s approach is applicable to regional and district levels to provide comparative analyses between cities or parts of a region or districts of the city. These analyses are valuable tools for assessing the impact of local urban and municipal planning policies on urban development.

1. Introduction

1.1. Urban Land-Use Efficiency and SDG Indicator 11.3.1

In 2008, the world reached a significant milestone—the majority of its population lived in urban settings. According to [1], approximately 70% of the global population will be living in cities by 2050. This is a drastic change from 45 years ago (1975) when city dwellers made up 38% of the world population [2], and less than 30% of the world’s population lived in cities in the middle of the last century [3]. Such a rapid increase in urban population and settlements and the subsequent reduction in agricultural lands and natural environments, such as forests, swamps, and other water-pervious areas, is now recognised as an important issue and has raised questions about sustainable urban development in many parts of the world [4,5,6]. Furthermore, the disparity between urban areas and urban population growth has directed attention to urban land-use efficiency (ULUE) [3] within urban agglomerations. This ULUE metric effectively measures the overall sustainable development of a city and shows whether a given territory is being effectively used in terms of socioeconomic and environmental perspectives.
Spatial expansion of urban agglomerations and their population growth generate both benefits and disadvantages. Most people live in or move to cities because urban life creates certain conveniences in their lives, such as proximity to hospitals, amenities, entertainment, developed transport and other infrastructure, more employment and investment opportunities. Such convenience comes, however, at a cost—unplanned urban growth and transformation creates environmental issues such as air, water, and noise pollution, traffic congestion, crowded living spaces, change in land use, and impacts on local living habitat and climate. In addition, uncontrolled population growth could result in intensive traffic, declining living conditions, growing unemployment and crime rates, and resource shortages [7]. Furthermore, uncontrolled construction, use of man-made materials, and growing anthropogenic heat production can cause urban heat islands that have significant consequences for the health of city dwellers [8].
Furthermore, rapid urban expansion can encroach on nearby arable agricultural and environmental lands. In the absence of comprehensive policies and information, it is a challenge for governments to manage and plan quality human living space effectively. There is often a mismatch between the physical expansion of cities and their population growth. When the provision of urban resources (houses, transport, hospitals, amenities, etc.) cannot meet the overwhelming increase in urban population (e.g., rural people moving to cities), this becomes a starting point to the establishment of lower socioeconomic urban slums [7], potentially at the expense of valuable agricultural and environmental lands.
Therefore, it becomes critical to monitor and measure the process of urban space development, understand its drivers and plans, and how rural land consumption balances with urban population growth. Such monitoring helps to measure ULUE and assists in designing appropriate land-use policies for sustainable city development [3,9]. To address this challenge, in 2015, the United Nations (UN) developed the Sustainable Development Goals (SDGs), an important agenda for today’s global scientific communities. Specifically, SDG 11.3 aims to “enhance inclusive and sustainable urbanisation and capacity for participatory, integrated and sustainable human settlement planning and management in all countries” [10].
There are several methods that could potentially measure ULUE, such as localised urban sustainability measurement factors [11,12], urban densification [13], rate of urban boundary expansion [14], and the proportion of idle land [15]. The UN has sought to unify these approaches and proposed indicator 11.3.1 to measure land-use efficiency, defined as “land consumption rate to population growth rate” (LCRPGR), expressed as the ratio between two variables—land consumption rate (LCR) and population growth rate (PGR). LCR measures the rate at which an urban space expands, i.e., city consumes land for its purposes (supposedly for its growing population and needs). PGR reflects demographic changes—increases in urban population due to births, decreases due to deaths, and migration in and out of the city. Ideally, both these variables should be synchronised [7] and measured in a comparable timeframe, preferably at regular intervals of at least every five years [16]. The indicator assesses the sustainability of urban development in terms of whether urban expansion keeps pace with population growth. This indicator is called a “tier 2 indicator” with a methodology for calculation, but data sources for estimation are still limited, particularly in developing countries with data-poor capacities. More precisely, it is defined as an indicator that “is conceptually clear, has an internationally established methodology and standards are available, but data are not regularly produced by countries” [17].
Due to the difficulty of obtaining reliable and regular data, the research on SDG indicator 11.3.1 is in the early stages of development. Most literature focusing on the LCRPGR indicator investigate cities in developed countries [7]. As stressed by [3], the existing literature often measures LCRPGR from a global or national perspective by employing available open data that may have uncertainty problems at local or regional scales. The Global Human Settlement Layer (GHSL) dataset [18] provides accessible open spatial distribution data on built-up areas, population, and settlement typologies for the years 1975, 1990, 2000, and 2015 (https://sedac.ciesin.columbia.edu, accessed on 2 June 2021). The UN SDG report (2016) has estimated LCRPGR across 194 regions and cities globally and found that the LCRPGR equalled 1.68 in 1990–2000 and increased to 1.74 in 2000–2015 [19]. China’s LCRPGR value increased from 1.69 in 1990–2000 to 1.78 in 2000–2010, and the land consumption rate was 1.8 times higher than the population growth rate from 1990 to 2010 [7]. Another international study has estimated LCRPGR for more than 300 cities in Eurasia using global impervious surface data to extract information on urban built-up areas and combining population data to calculate and analyse SDG indicator 11.3.1 [3].

1.2. Remote Sensing Approaches in Land-Use

Satellite remote sensing (RS) has provided an effective means to detect and monitor how, when, and where the Earth’s surface is changing across space and time at various scales. The accuracy of remotely sensed land-use mapping depends on the data source and image classification [20]. Landsat imagery is the longest and most informative temporal Earth observation data with a high spatial resolution (30 m) spanning over the last 40 years [21,22]. Land-use mapping using Landsat sensors dating back to the 1970s is one of the earliest applications of RS technology [23,24]. The Landsat TM/ETM+/OLI sensors for environmental and terrestrial monitoring have multispectral bands, 30 m spatial resolution, 16-day revisit temporal resolution, and cost-free open accessibility. Landsat images are well suited to mapping and monitoring land-use change dynamics, such as deforestation, desertification, and urbanisation at multiple scales [25,26]. With advances in computer science and GIS technologies, recent studies have generated long time-series land-use maps from Landsat data using machine learning algorithms (MLAs) [27]. The most well-known MLAs include support vector machine (SVM) [28,29], k-nearest neighbour (KNN) [30], artificial neural networks (ANN) [31], classification and regression trees (CART) [32], and random forest (RF) [33,34,35,36]. These are non-parametric classification methods that are generally more robust and reliable than parametric algorithms, such as maximum likelihood, minimum distance, and Bayesian classifiers [37]. The increasing popularity of these MLAs is due to their efficiency in processing big data without relying on a normality assumption or statistical parameters [38], especially for data that have different statistical distributions [34]. Some MLAs are complicated, however, due to the numerous parameters that need to be adjusted and their tendency to over-fit the data [39]. Therefore, selecting an optimal/suitable algorithm is crucial for the accuracy of land-use classification. This selection is becoming one of the focal points for remotely sensed land-use mapping.

1.3. Objectives of the Study

Vietnam’s economic growth has been rapid in recent decades, leading to sustainable planning and development challenges. The World Bank stressed that to continue at this pace towards becoming an upper-middle-income country, Vietnam needs to consider the spatial transformation and urbanisation processes [40]. These processes have been compromised, however, by rising congestion costs and reductions in returns from agglomeration economies in the main cities in recent years. To evaluate the changing nexus between land availability and urban population growth, we analyse the LCRPGR indicator of Ha Long city to illustrate the trends in land consumption and population growth. By integrating land-use maps derived from Landsat imagery through machine learning with Vietnam census data, the analysis calculates the LCRPGR value and examines land-use efficiencies in 1986–2020 (34 years) in 5-year steps. The paper’s structure is as follows: Section 2 describes the study area, introduces data sources and data processing techniques, and the methods to calculate SDG indicator 11.3.1; Section 3 presents and discusses results of the analysis; and Section 4 provides concluding remarks.

2. Materials and Methods
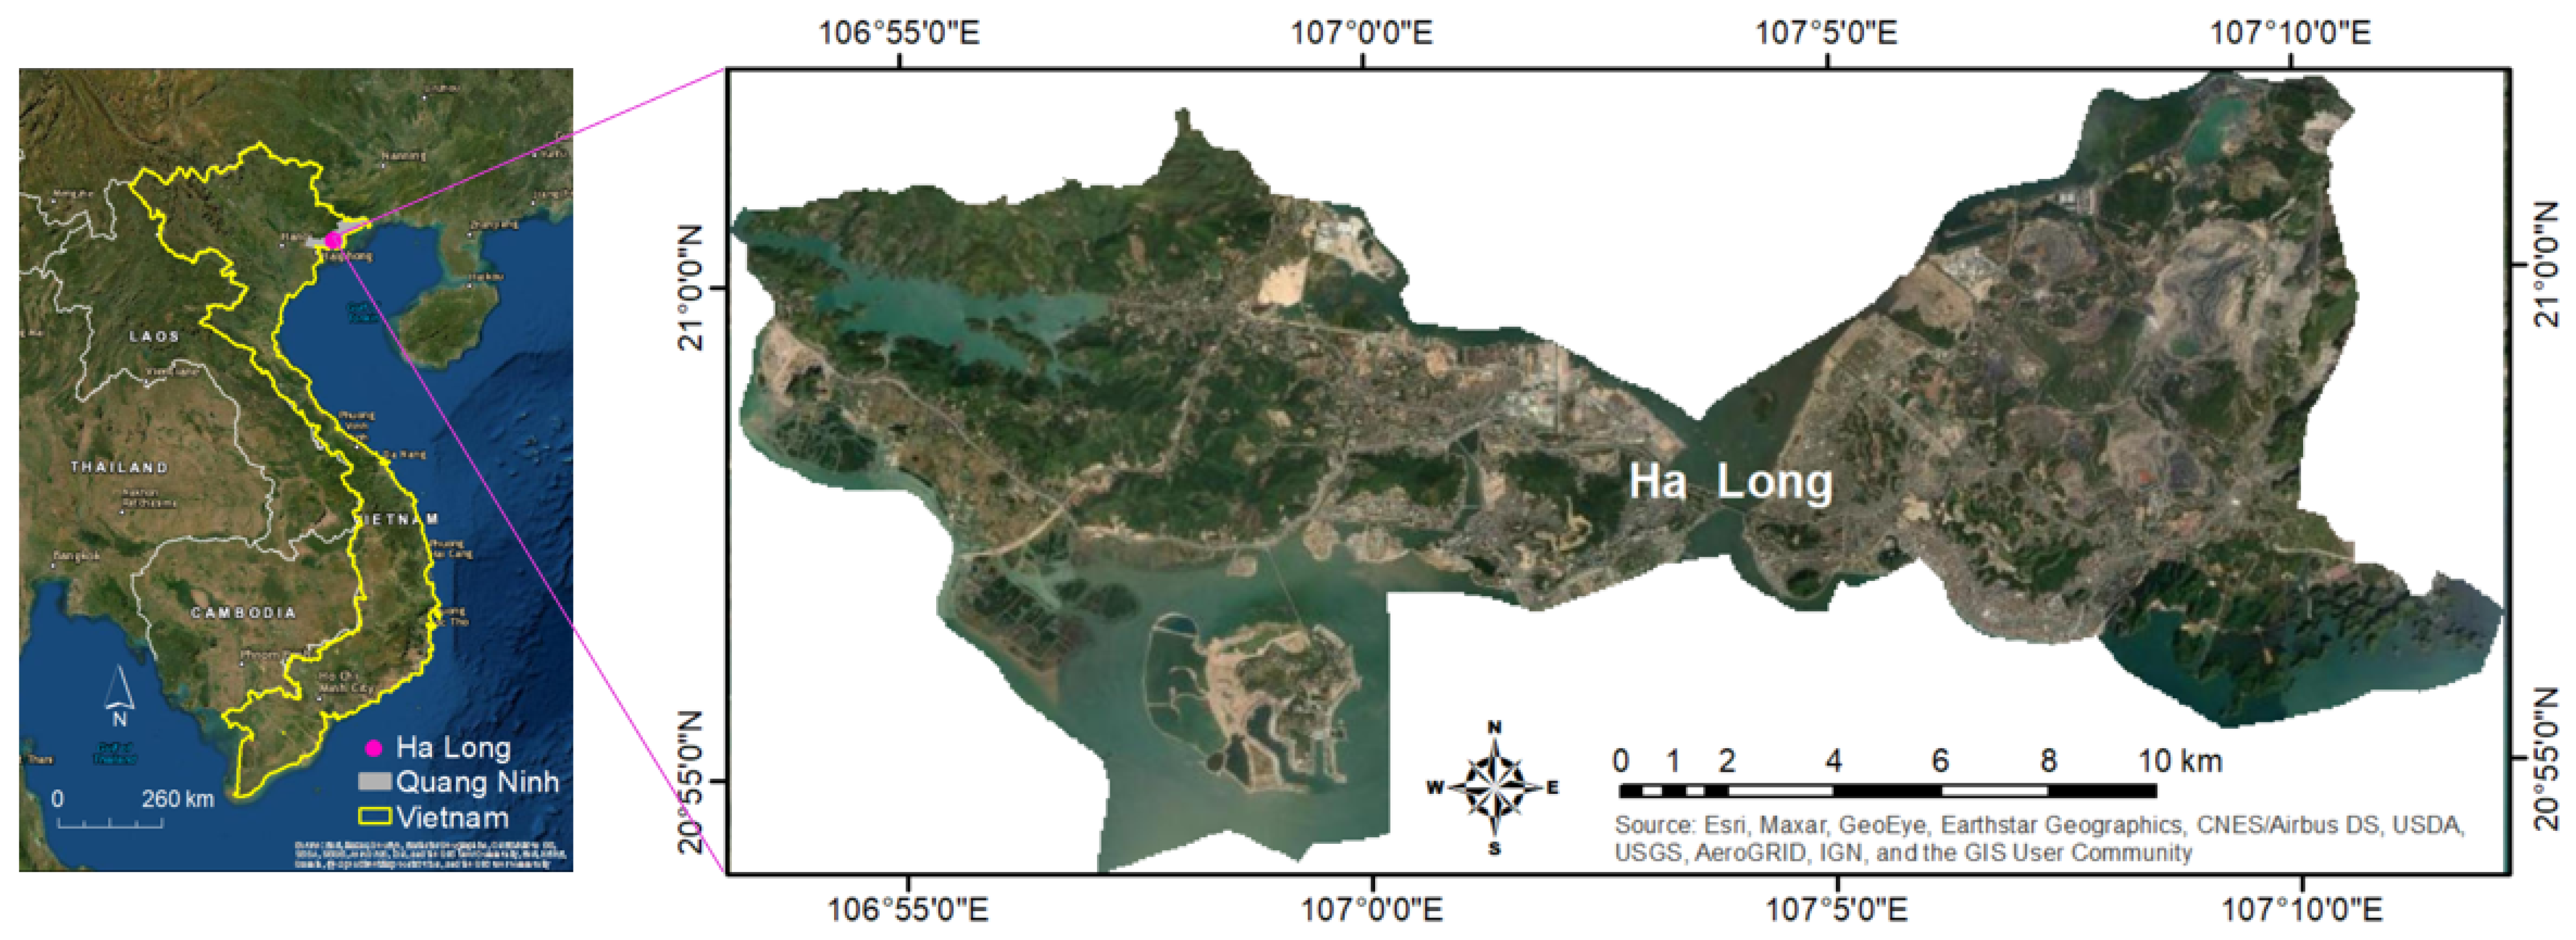
2.1. Study Area

Economic reforms initiated in Vietnam in 1986 (Đổi Mới—economic renovation) have resulted in the continuous successful transformation of the country, improvement of people’s living standards, and poverty reduction. Gross domestic product (GDP) has increased by 8.6 times over 1985–2019 (measured in constant 2010 USD), and the annual GDP growth rate has never been lower than 5% per year since the 2000s. Even during the 2008 global financial crisis, Vietnam recorded a 5.7% GDP growth rate [2]. This growth improved the economic condition for ordinary people significantly: the GDP per capita has quintupled from USD 383 in 1985 to USD 2082 in 2019 [2].
Such rapid economic development was accompanied by the explosive urban population growth from 20% in the early 1990s to 37% in 2019, meaning that one in three Vietnamese now live in a city. While the nation’s total population increased by 1.6 times in 34 years (1985–2019), from 61 million to 97 million people, its urban population has almost tripled, rising from 12 million to 35 million. Population density increased from 187 people/km2 in 1985 to 308 people/km2 in 2019, with the highest density in the Red River Delta and the lowest in the northwest part of the country. More recently, however, the population growth rate has fallen (dropped from 2% pre-1990s to 1% in the 2000s). The rural population growth rate dropped to zero in 2014 for the first time and became negative in 2017 [2]. The urbanisation process has been associated with the movement of workers and their households from rural areas to urban areas and workers from the agriculture sector to the industrial and service sectors in urban centres [40]. Such rapid population growth, migration, and urbanisation in Vietnam have placed pressure on the environment, particularly land-use change, deforestation, and water resource depletion.
Ha Long city is the cultural, economic, and political centre of Quang Ninh province. It is a coastal city in the northern region. Ha Long has an important strategic position in the Northeast of Vietnam, close to two major cities, Hanoi capital and Hai Phong city, and is relatively close to the Vietnam–China border. The city, established on 27 December 1993, is based on Hon Gai town. Administratively, the city is divided into 20 wards with nearly 250,000 people living on 272 km2 (27,153 ha) in 2018 (http://halongcity.gov.vn, accessed on 26 May 2021).
The average population growth rate was 5.8% per year between 1995 and 2000 and 1.9% per year from 2000 to 2005. The natural growth rate decreased from 1.1% in 2000 to 0.96% in 2005. The city has a high but unevenly distributed population density. The average density is 873 persons/km2, but Tran Hung Dao ward has the highest population of 15,188 persons/km2, while Dai Yen ward has the lowest population of 180 persons/km2 [41].
Two major sectors, tourism and services, dominate the economy of Ha Long city (about 54% of the city’s GDP), along with industry and construction, including mining and coal processing (about 44% of the city’s GDP). Ha Long Bay is the most famous tourist centre in Vietnam, attracting both domestic and international visitors. In 1994, it was recognised as a World Heritage Site by UNESCO (http://whc.unesco.org/en/list/672, accessed on 26 May 2021). In addition, the province of Quang Ninh produces approximately 95% of the total hard coal of Vietnam [42]. As a result, GDP per capita was USD 3718 in 2011—almost three times higher than the nation’s average income per capita.
Adequate land reserved for the city development has become a big challenge. With its complex mountainous and hilly topography, most land designated for urban development is mainly concentrated in the strips of land in the coastal area. The current land for city development is primarily agricultural, forest land, and reclaimed sea (Figure 1). In 2000–2003, the city acquired 1384 ha of land from the sea and alluvial grounds. During 2001–2005, land area for urban development increased from 3400 ha to 5600 ha [41]. Most of the new land was used for residential and industrial development (coal mines, tourism). In contrast, land provision for social sector development such as schools, healthcare, and markets met only 50% of the demand [41].

2.2. Data and Methodology

2.2.1. Census Data

A population and housing census in Vietnam is conducted every ten years and starts in April. Since 1975, the country has undertaken five population and housing censuses in 1979, 1989, 1999, 2009, and 2019. According to the 2019 census, the population growth rate was declining and dropped to as low as 1.0% in 2019 (compared to 2.2% in 1980). On the other hand, population density steadily increased and reached 311 people/km2 in 2019 (compared to 166.8 in 1980). We obtained the population of Ha Long city from these censuses [43].
To match the census data with the selected Landsat images used for land-use classification (Table 1), we estimated the population in Ha Long as follows. First, we calculated the population growth rate in the 10-year periods from 1979 to 1989, from 1989 to 1999, from 1999 to 2009, and from 2009 to 2019. Second, using the population growth rates for the respective periods, we estimated the population in 1986, 1990, 1995, 2000, 2005, 2010, 2015, and 2020 to match the selected Landsat imagery. For instance, the growth rate calculated for 1979–1989 was used to estimate the population in 1986. Similarly, the growth rate of 1989–1999 was used to estimate the population in 1990 and 1995 respectively, and so on. An exception is 2020, when the previous period’s growth rate (2009–2019) was used.

2.2.2. Landsat Imagery

Landsat satellite data provide a continuous series of Earth with a high spatial resolution (30 m) spanning over 30 years. From the Vietnam National Space Centre’s time series of Landsat imagery (made available by USGS and https://earthexplorer.usgs.gov, accessed on 4 January 2021), one best cloud-free image (path/row = 126/45), usually in the dry season, was selected to represent the annual land-use status in 1986 and every five years from 1990 to 2020. The key features of these images are summarised in Table 1. All images were georeferenced to the UTM coordinate system.

2.2.3. Land-Use Classification from Landsat Imagery Using Machine Learning

All the Landsat imagery were pre-processed to the land surface reflectance using the FLASSH tool with choosing relevant of sensor types (Landsat 5 of TM and Landsat 8 of OLI), date, time of image acquisition, and atmospheric (tropical) and aerosol (urban) models. Nine major land-use classes—agriculture, bare land, coal mine, deep water, forest, lake, mangrove, residence, and shallow water—were classified for each selected Landsat image. The built-up area used for this study was extracted by the aggregation of residence and bare land. The Support Vector Machine (SVM) [44] algorithm was employed for land-use classification. SVM is a kernel-based non-parametric supervised machine learning algorithm. It has been widely used as a reliable method for satellite image classification [28,45]. In contrast to deep learning approaches that demand large training samples [36], SVM requires a small amount of training data, making it appropriate for classifying historical time series of imagery when the training data were not always available. SVM is also recommended for urban area classification and object detection as it generates comparable accuracy relative to other machine learning methods [46,47]. In addition, it provides a robust technique to learn from complex and noisy data by separating classes with a decision surface, maximising the margin between the classes. The surface and data points closest to the hyperplane are called the “optimal hyperplane” and “support vectors” [48], respectively.
For the study area of Ha Long city with highly heterogeneous land-use types, SVM provides a hierarchical process to shorten the processing time without significantly degrading the results [49]. We consistently set the SVM options of the Kernel type of basic radial function, Gamma in a Kernel function of 0.27 and the penalty parameter of 100, and the pyramid levels and classification probability threshold at 0 for each Landsat image classification. An average of 120 training polygons and 30 test polygons were extracted for each image classification (calibration) and result evaluation (validation). Corresponding sampling datasets for training and validating were derived from various sources: (1) geodatabases generated from aerial photos and verified with in situ investigations for 2005 and 2010, (2) topographic maps provided by the Ministry of Natural Resources and Environment (MONRE) for 2015 and 2020, and (3) expert-based extraction from the cloud-free Google historical images for other years.
The accuracy of the land-use classification was evaluated. One of the most common methods in accuracy assessment is to use an error matrix, also referred to as a confusion matrix. It produces statistical measures of accuracy on a sample of pixels of known value (ground truth) compared to classifications of the derived land-use maps. These include overall accuracy (OA) of classification, percentage of omission and commission error (OE and CE), and the kappa (K) coefficient [50,51]. Overall accuracy is the simplest and one of the most frequently used accuracy measures. Commission errors represent the probability that a given pixel will appear on the ground as classified. In contrast, omission errors represent the percentage of a given class incorrectly identified on the map [52]. Kappa is an index that estimates the agreement between two rasters [53,54]. It is generally thought to be a more robust measure than a simple per cent agreement calculation since Kappa considers the agreement occurring by chance. However, Kappa is also considered to be an overly conservative measure of agreement and is defined as:
K = ( P 0 P c ) ( 1 P c ) = s n P c ( 1 P c )
where P0 is the overall accuracy which is the ratio of matched pixels and the total number of compared pixels (n); Pc is the probability of random agreement, expressed as:
P c = ( a 1     b 1 + a 0     b 0 ) ( n n )
where a1 and b1 are the pixels of built-up area on classified images and ground-truth data, respectively, and a0 and b0 are the pixels of other classes on classified images and ground-truth data, respectively. K > 0.80 represents a strong agreement, 0.60 < K ≤ 0.80 represents a substantial agreement, 0.40 < K ≤ 0.60 represents a moderate agreement, and a value K ≤ 0.40 represents a poor agreement [53,54].
Finally, the land-use categories and associated area statistics for every five years from 1980 until 2020 for Ha Long city (except for 1986) were refined to remove rough-classified errors, mapped, and derived using ArcGIS (version 10.8.1).

2.3. Methods for Estimating SDG Indicator for Land-Use Efficiency

To calculate the LCRPGR indicator, two components are needed, LCR and PGR, that quantitatively measure the spatial expansion and demographic change intensities in urban settlements, respectively. Each of these values can be positive or negative. The larger the positive values of these parameters, the larger the newly built-up area and higher the population growth, respectively. For instance, LCR > 0 suggests that a built-up area expanded compared to the previous period, whereas LCR < 0 suggests that the built-up area decreased. Likewise, PGR > 0 shows a population increase and PGR < 0 means a population decrease compared to the previous period. While the interpretation of both LCR and PGR is straightforward, it is a little trickier for LCRPGR. For example, LCRPGR < 0 illustrates that either LCR or PGR is negative, but it is unclear whether land or population grows faster [7]. Cases when both numerator (LCR) and denominator (PGR) are positive are further subdivided into (1) the LCRPGR > 1 and (2) 0 < LCRPGR < 1. In the latter case, the signs of LCR and PGR need to be used to define land growth type. Table 2 illustrates the ranges of LCRPGR and their meaning, according to [3].
The method for calculating SDG indicator 11.3.1 is presented in the SDG indicators Metadata Repository managed by UNDESA (https://unstats.un.org/sdgs/metadata, accessed on 28 May 2021). The estimation method of the indicator is relatively simple, subject to data availability. For example, the formula developed by UN-Habitat [55] consists of three steps.
Population growth rate (PGR) is the gain in population in the area of interest, usually for one year, expressed as a percentage. It presents observations of the number of births and deaths and the migration to and from the area:
PGR = Ln ( Pop ( t + n ) Pop t ) y
where,
  • Ln—Natural logarithm;
  • Popt—Total population of the area in the past/initial year;
  • Popt+n—Total population of the area in the current/final year;
  • y—Number of years between the two measurement periods.
Land consumption rate (LCR) includes (a) the measured expansion of built-up area; (b) the absolute extent of land that is subject to exploitation by agriculture, forestry, or other economic activities; and (c) the over-intensive exploitation of land that used for agriculture and forestry:
LCR = Ln ( Urb ( t + n ) Urb t ) y
where,
  • Ln—Natural logarithm;
  • Urbt—Total urban built-in area in square km in the past/initial year;
  • Urbt+n—Total urban area in square km in the current/final year;
  • y—Number of years between the two measurement periods.
The ratio of land consumption rate to population growth rate (LCRPGR):
LCRPGR = LCR PGR
Both metrics, LCR and PGR, represent the average yearly growth rate. As SDG 11 stresses, the time scales of both population and urban area growth rates should be comparable [7,16].

3. Results and Discussions

3.1. Verification of Land-Use Classification (or Build-Up Land Area Only) Using Kappa Statistics

Table 3 shows the goodness of fit between the SVM-classified land-use images and the randomly sampled verification polygons (ranging from 71 to 144 for different years). It presents the overall accuracy (OA), omission errors (OE), commission error (CE), and the Kappa (K) statistics for built-up area responding to the land-use classification images of each year from 1986 to 2020. All classifications were reasonable, with OA and K mostly above 86% and 0.80, respectively. The classification for 2015 gave the best performance (OA of 98.91% and K of 0.99), in contrast with the quality of the classification for the year 1990 (OA of 83.41% and K of 0.80). The OE and CE are lower than 18% and 23% for all years, respectively. The land-use mapping uncertainties caused by OE and CE mainly resulted from mixed pixels (more than one class potentially represented in a pixel from visual inspection), limited ground-truthing and independent validation data, and limited availability of cloud-free images (clear days coinciding with the 16-revisit cycle for Landsat).

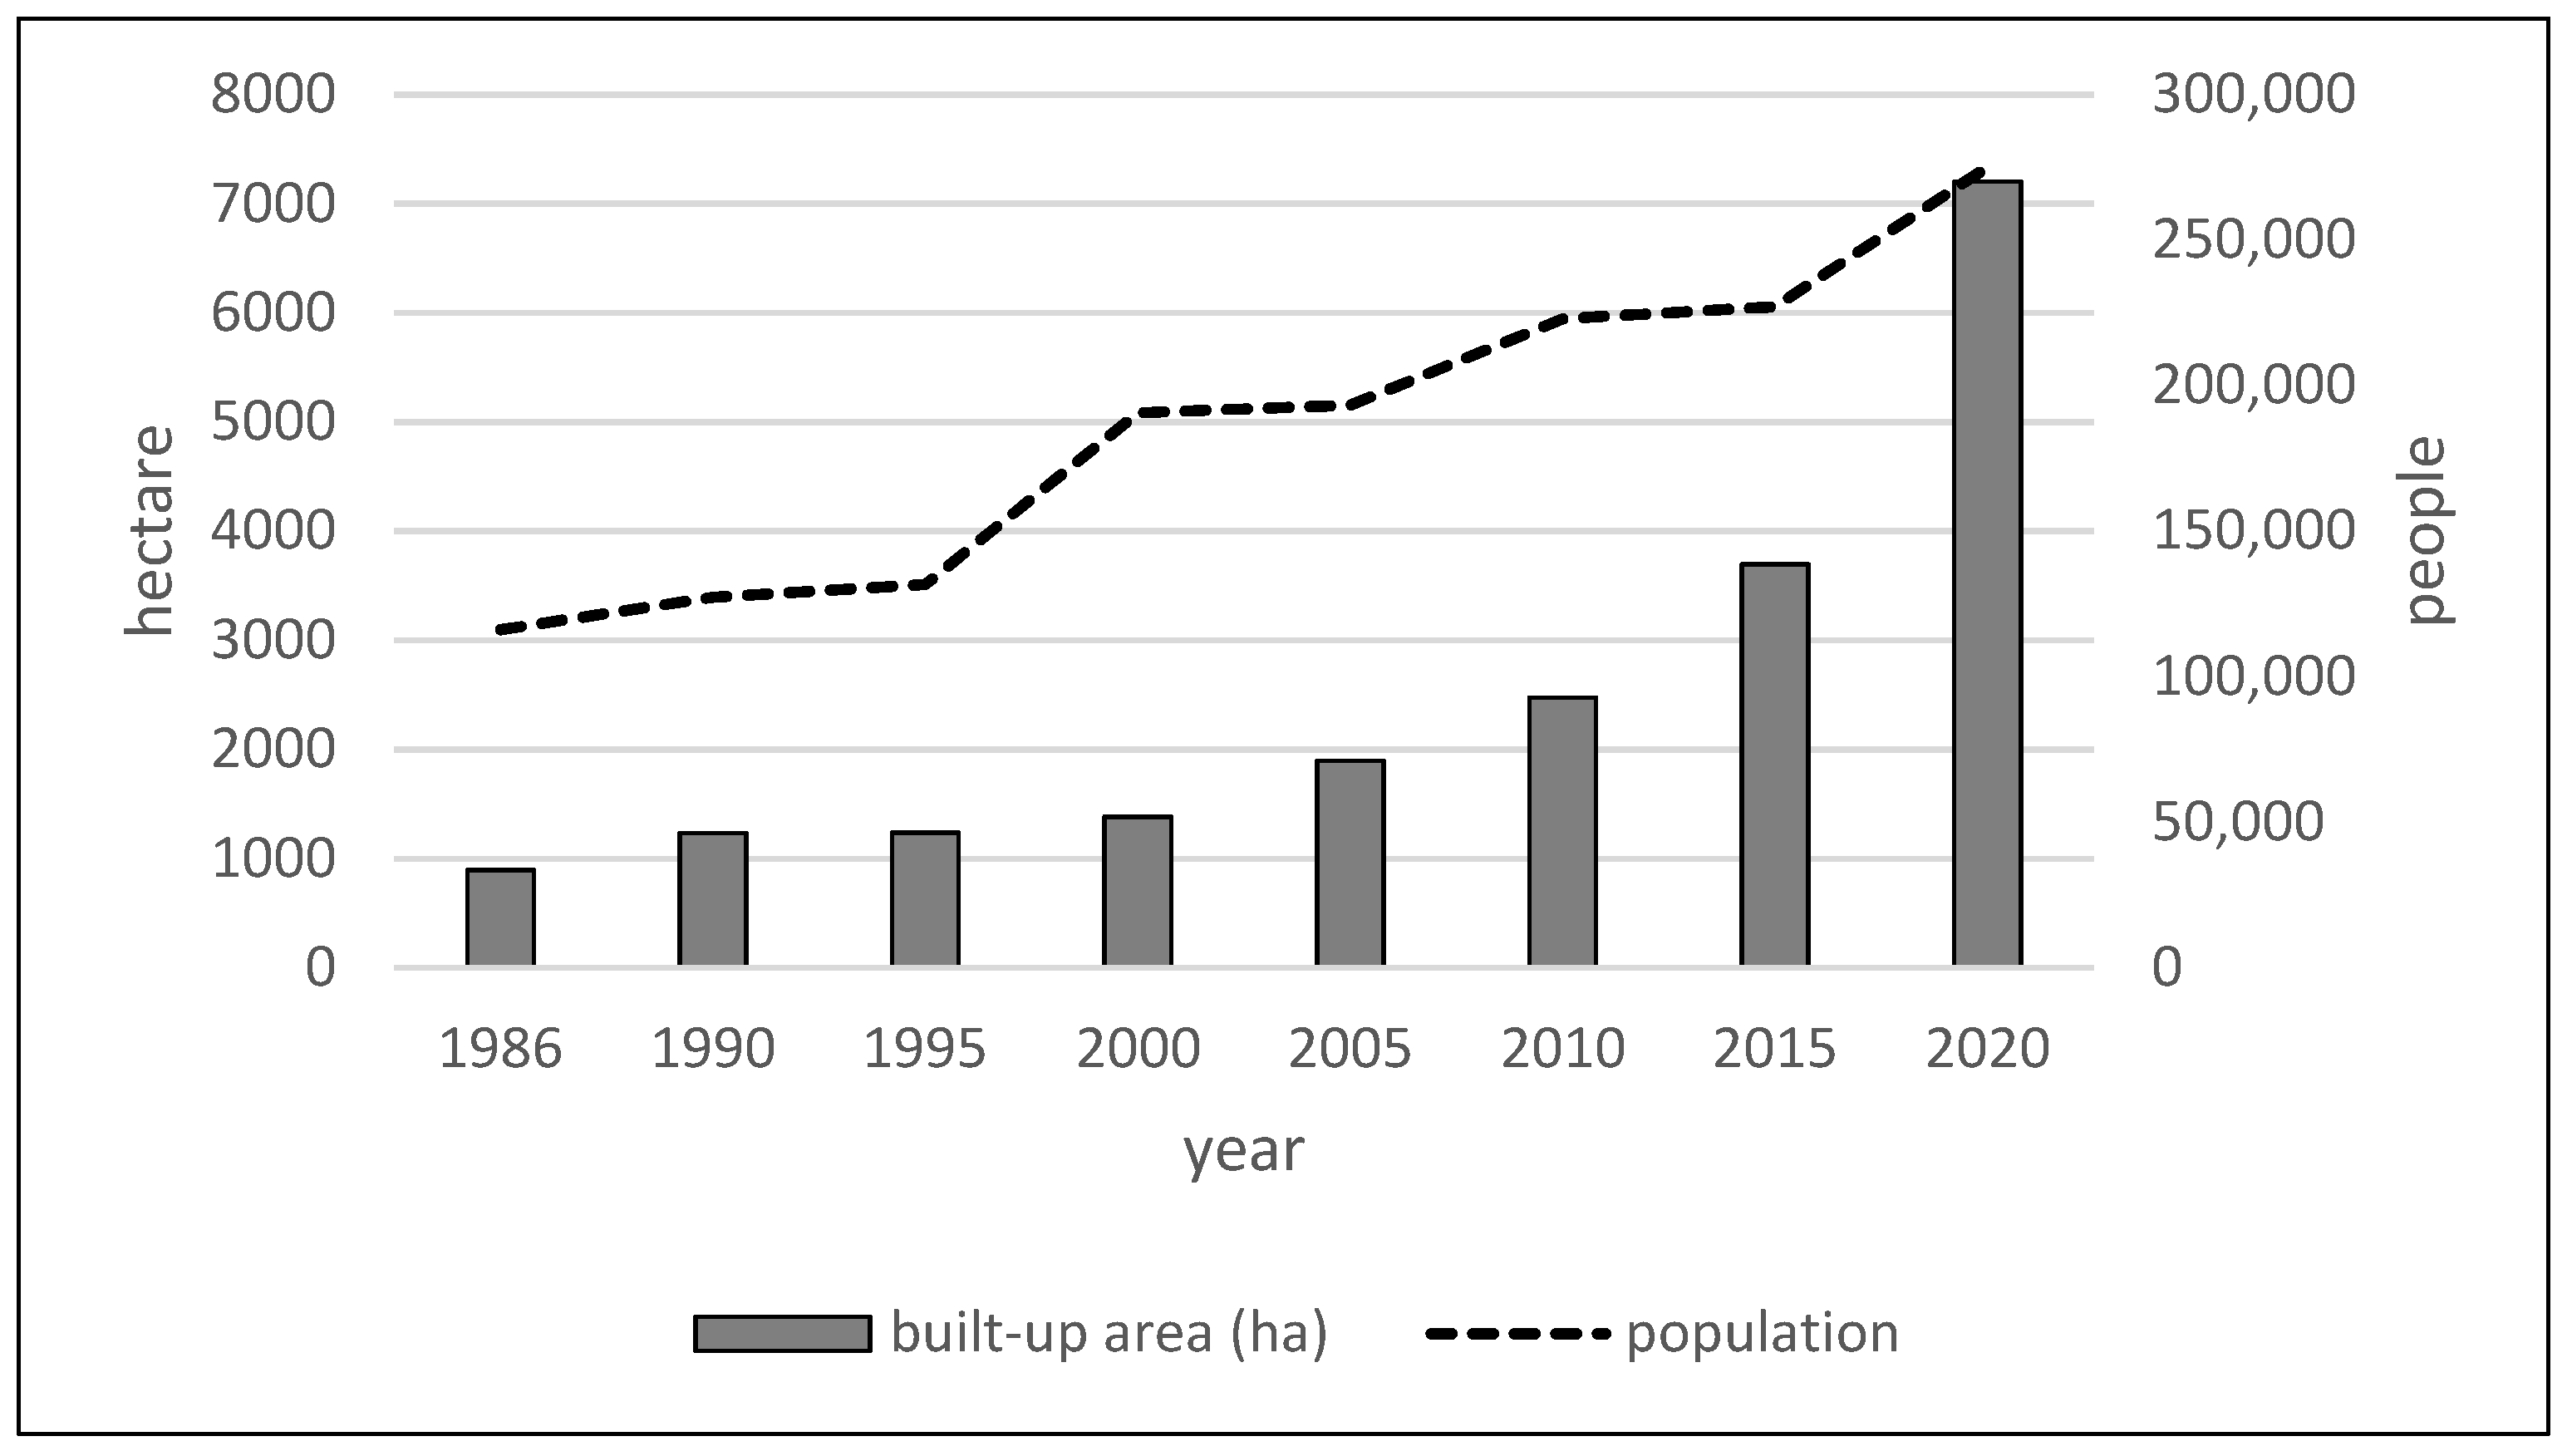
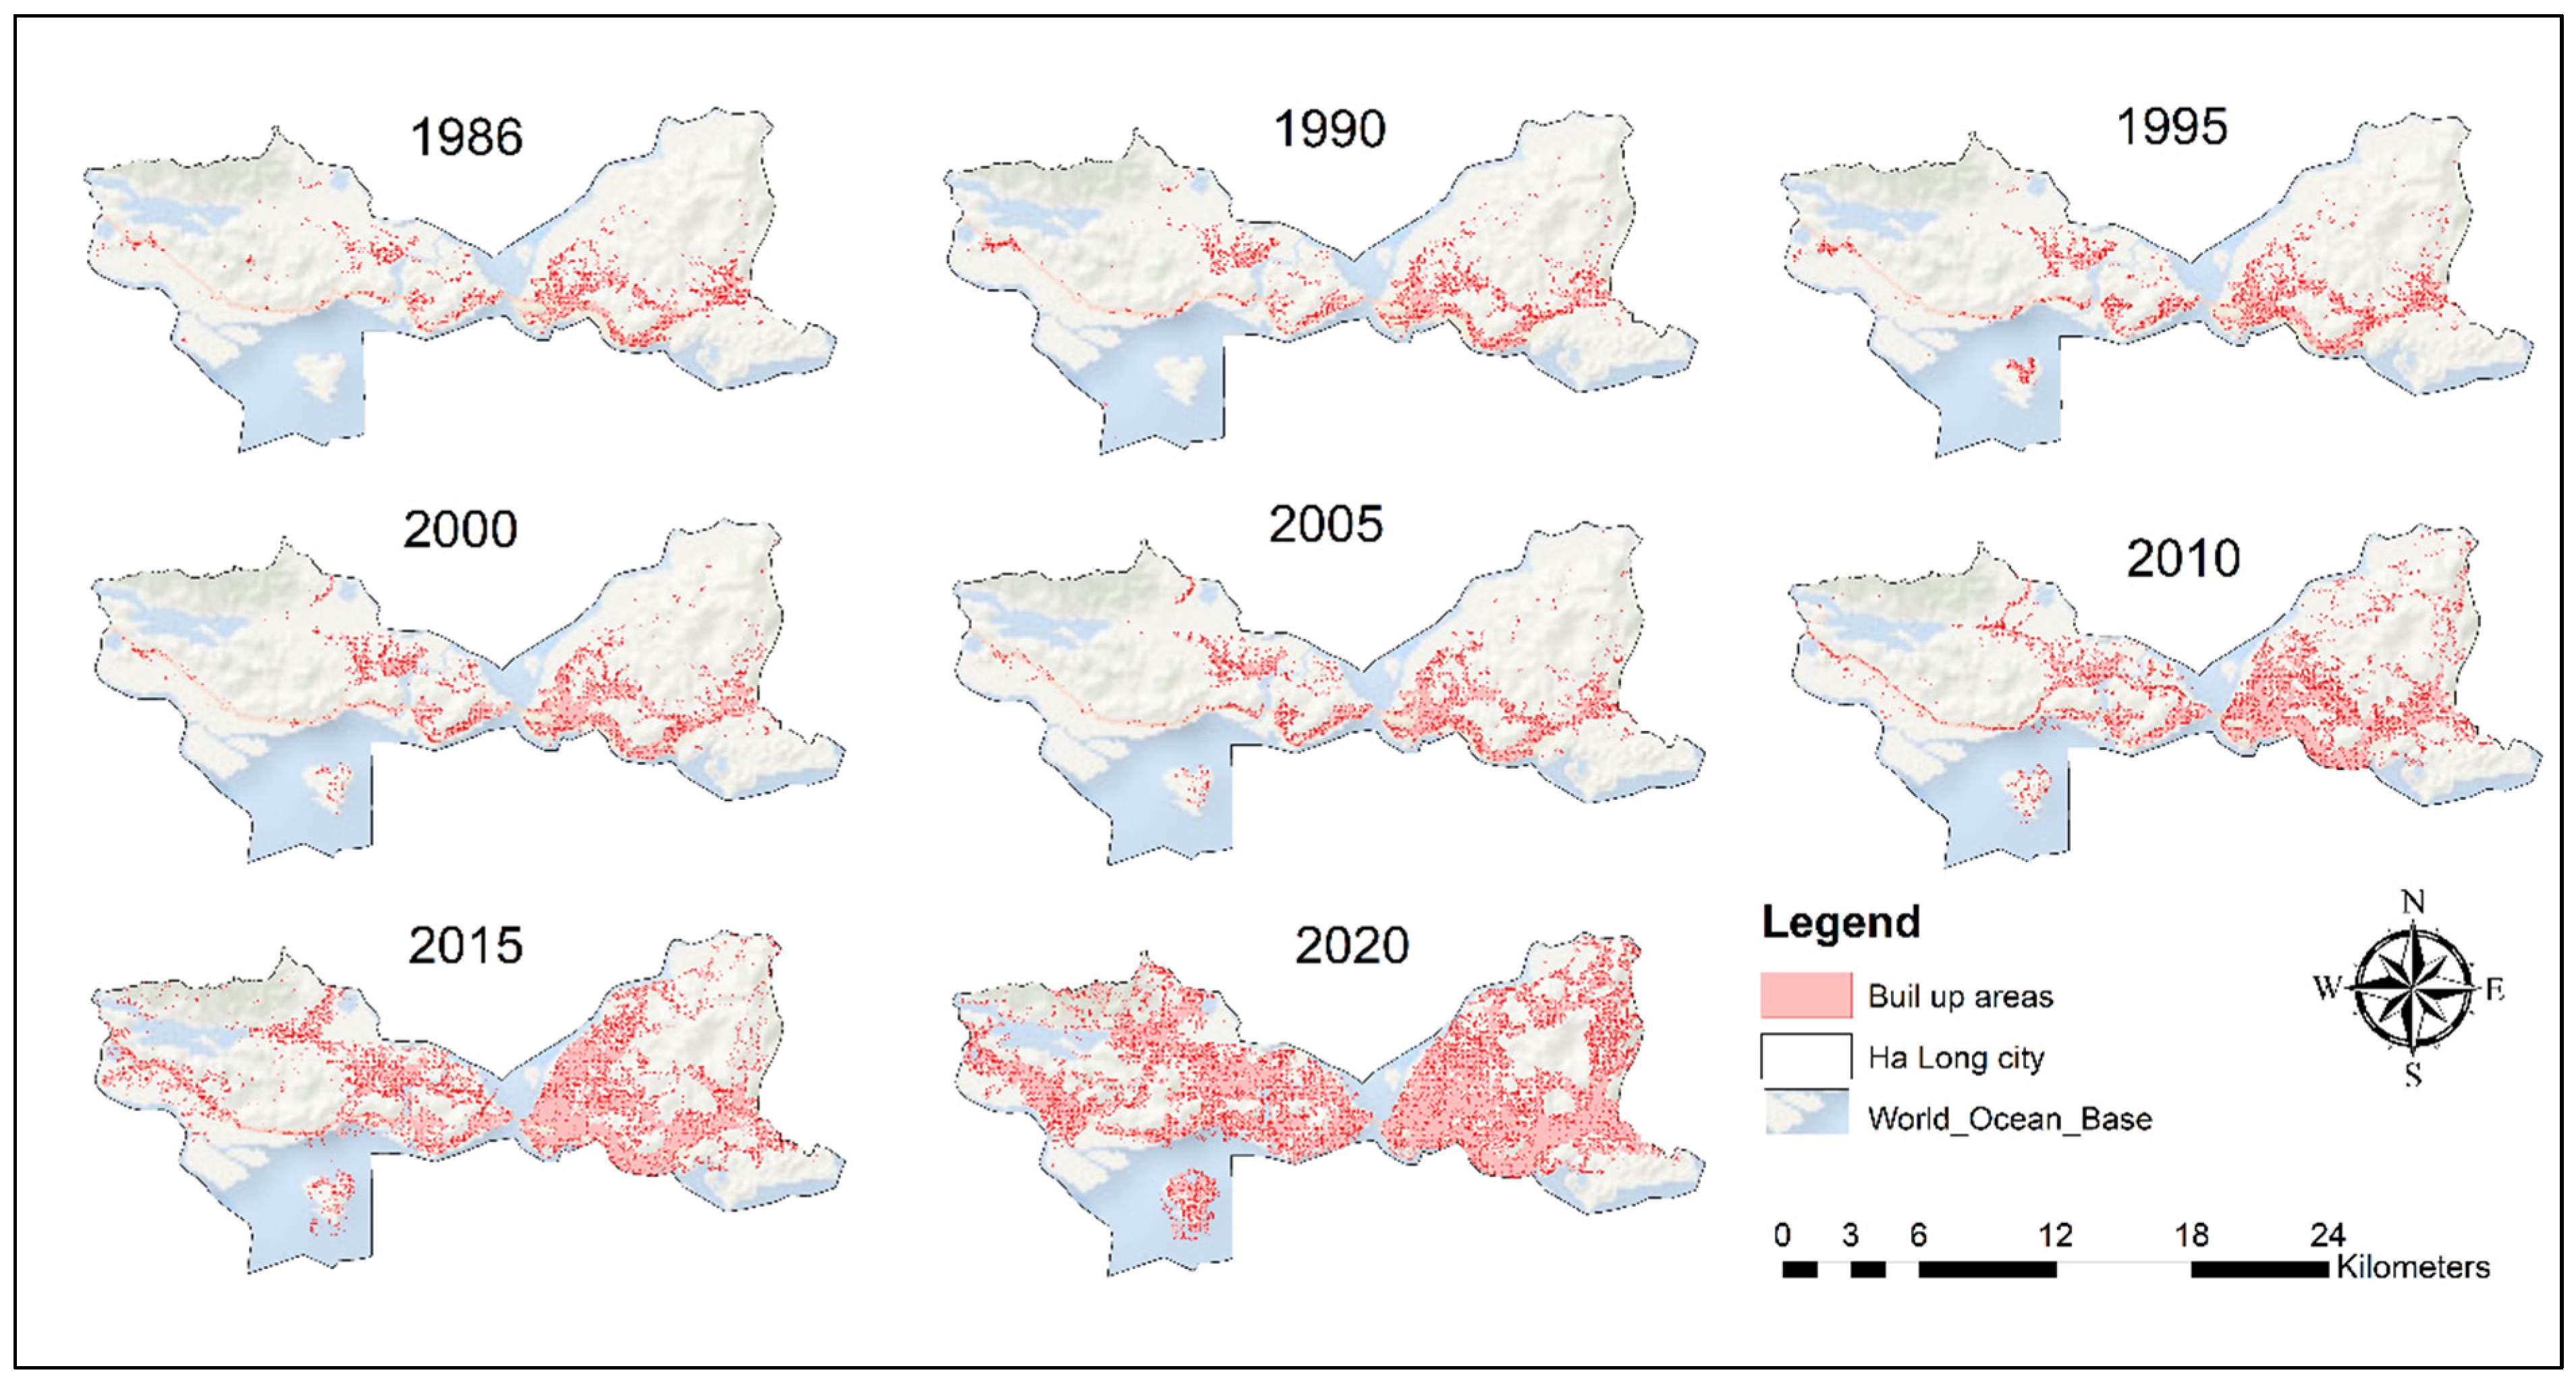
3.2. Land Expansion and Population Growth in Ha Long

According to the census data (General Statistics Office of Vietnam), the population of Ha Long was about 115,000 people in 1979. Since then, it has grown continuously, albeit at various rates (Figure 2). Overall, the city’s population doubled from 116,000 to 275,000 people in the 1986–2020 timeframe. It grew slowly before the 1990s, with the average growth rate less than 1%. However, in the following decade (1990–2000), the city’s population growth had accelerated to 3.5% per annum, increasing city dwellers from 127,000 to 191,000. Since then, the population growth rate has been steady at around 1–2% annually.
At the same time, the built-up area increased by eight times from 896 ha to 7204 ha (Figure 2). The built-up area expansion was stable in the decade 1990–2000 and experienced rapid growth since then. City area expanded at an average rate of 5% a year in each 5-year period before 2015, but the rate almost doubled in 2015–2020 (9.7%). The rapid expansion of the city area caused the built-up area per capita to double from 0.01 ha/capita before 2010 to 0.02 ha/capita in 2015. A further 50% increase to 0.03 ha/capita was recorded in 2020.
The non-uniform expansion of the built-up area of Ha Long is apparent in the Landsat-derived data (Figure 3). Before the 1990s, the city’s built-up area was sparse, presumably consisting of linearly connected communities along defined arterial routes. In the 1990s, moderate densification and the initial results of industrialisation became apparent. Since 2000, more areas within and on the outer parts of the city have been developed. In the last two periods (2010–2015 and 2015–2020), reclaimed coastal seas augmented the Ha Long built-up area.
The land-use change dynamics of Ha Long at five-yearly intervals from 1986 to 2020 are mapped in Figure 4. First, coal mine expansion replaced predominately forested areas. Second, while coal mines were expanding in the eastern part of Ha Long, there was a gradual expansion of residential areas in the western part of the city until 2010. The growth of the residential areas then stabilised, partly attributed to topography and more costly construction in the surrounding mountainous and hilly areas of the city. Later, residential land expanded towards the coastal zone or onto land areas reclaimed from the sea.
The rapid development of coal mining and tourism industries fuelled an influx of people to the city. The main distinctive feature in land-use change throughout 34 years is how coal mining has changed the city area. Its area was a little over 1000 ha in 1986 but rapidly increased to reach its maximum of 4000 ha in 2005–2010. The coal mining area then began to decline due to the Vietnamese government’s commitments towards renewable energy sources. Another factor in the decline in coal mine expansion and associated impacts on tourism and other sectors was the historic flood in Quang Ninh province and broadly in north eastern Vietnam in 2015. The flood inundated many city areas and residential properties and led to human casualties [56]. Highly polluted floodwaters also reached popular tourist sites in Ha Long Bay (a UNESCO World Heritage site), forcing the local government to rescue tourists [57]. The flood was possibly one of the reasons that the central government announced plans to start shutting down coal mines due to health and environmental hazards for the city population and Ha Long Bay. At its peak, coal was mined close to the city and the coastal zone, creating a clash of interests between tourism and coal industries through water and air pollution, diminishing the attractiveness and quality of the tourist destinations.

3.3. LCR, PGR and LCRPGR Values

The calculated parameters LCR, PGR, and LCRPGR for Ha Long (Table 4) show three main features: all are positive values, LCR and PGR are small values (close to zero), and LCRPGR contains extreme values for the two time periods 2000–2005 and 2010–2015.
Across all periods, both LCR and PGR are positive but small, indicating that population growth and land consumption trends throughout the 34 years have continuously increased. The values differ between the different 5-year timeframes. LCR value decreased in both 1990–1995 and 1995–2000 compared with 1986–1990, suggesting that the rate of urban expansion had been reduced somewhat in the later period. LCR started to increase in the early 2000s and reached the maximum of 0.1335 in 2015–2020 (Table 4). PGR was low at the beginning of the study period. It then jumped in 1995–2000, stayed flat in 2000–2005, and then had another two increases in 2005–2010 and 2015–2020. In five out of the seven 5-year periods, the land consumption rate was higher than the population growth rate, suggesting rapid urban population growth in Ha Long. The opposite trend was observed only in 1990–1995 and 1995–2000.
LCRPGR illustrates well the status of urban land provision when urban population growth increases during the urbanisation process. Compared to changes in either LCR or PGR alone, which have ups and downs, LCRPGR better captures the changing land/population relative dynamics. For example, in the 1990s, the urban population growth rate exceeded the land consumption rate in Ha Long, but from 2000 onwards, this situation changed, with the urban land consumption rate exceeding the population growth rate (Table 2).
Regarding the two extreme values of LCRPGR (Table 4) for the 2000–2005 and 2010–2015 periods, [3] also reported abnormal values for LCRPGR for some cities in Eurasia. Such abnormal values occur because of a minimal population change rate. UN-Habitat stresses that for some unplanned cities, the PGR value could be 3–5 times smaller than the LCR [55].
The indicators before and after the year 2000, i.e., 15 years of the last century and 19 years of the current century, were calculated also (Table 4, lower four rows). This use of larger timeframes confirms the trends of land-use efficiency found above. LCRPGR is positive in both periods, but the values showed opposite trends. Based on LCRPGR in Table 2, it seems that by the end of the last century, the urban land provision in Ha Long was lower than its population growth (LGRPGR < 1), indicating an increasingly intense urban land use. This situation changed in the two decades of the current century to the opposite (LCRPGR > 1) when urban land consumption began to exceed population growth. This suggests a sufficient supply of urban land.

4. Conclusions, Limitations, and Future Research

The study provides insights into the efficient use of land in one of the fastest-developing cities of Vietnam based on land consumption rate and population growth rate. It has limitations, however, related both to the data and the approach. The census data in Vietnam account for residents who have an official residence registration. These data do not account for non-official labour that mainly comprises people from rural areas of the province or other provinces. For instance, [41] indicated that the city’s inhabitants without residence registration accounted for at least 15% of the population of extensive urban areas. Ha Long’s official population in 2005 was about 193,000. Therefore, the unaccounted population could be as much as 29,000 and has probably grown significantly since then. There is no updated information on this issue or how it is handled in the official statistics.
One of the main limitations of the LCRPGR approach relates to its inability to include the vertical dimension of constructions. There are two reasons for this omission: (1) currently, the input data are available only at the 2D-level of information of the built surface and population, and (2) the indicator does not take into account information on the volume of cities because of the difficulties in obtaining this information at a global scale [58]. Another considerable uncertainty in the indicator relates to the concept of built-up area in the land-use classification. The critical difference lies in the definition of public space (including parks, gardens, and roads) that impacts the estimation of the built-up area. Unfortunately, as [7] concluded, no available tool can precisely estimate the built-up area due to inconsistent definitions and limited technology.
Despite the above constraints, the study calculated land-use efficiency for Ha Long city in Vietnam. It conducted detailed five-year land-use mapping at a spatial resolution of 30 m and quantified the dynamics of built-up areas for Ha Long city during 1986–2020 by classifying time-series of Landsat images through machine learning. We analysed the land-use efficiency based on SDG indicator 11.3.1 for the region to understand processes related to urban land expansion and urban population growth in the city. The main findings are that the LCRPGR indicator is positive, less than 1.0 before 2000 and larger than 1.0 after 2000. It suggests that the urban land provision rate was lower at the end of the last century and was not enough for the growing population rate. This conclusion is consistent with the geographic limitations to Ha Long expansion outlined earlier. However, in recent decades, LCRPGR has increased to more than 1, showing that urban land provision now exceeds the population growth rate, indicating that urban land supply is sufficient now. As the city’s planning document stated, Ha Long urbanisation has accelerated in recent years [41]. However, it still faces increasing construction scale problems. Small-scale urban buildings have been replaced by modern high-rise hotels, multi-level apartment buildings, and multi-storey private houses through expansion from 1–2 floors to 4–5 floors [41].
The approach for generating the land-use efficiency indicator employed by this study is relatively simple and effective. It applies to any geographic location, provided that similar data on built-up area and population are available. Moreover, it can be extended to regional and district levels to provide comparative analyses in time and space, not only between cities or regions but among parts of a region or districts in a single city. These analyses are essential and valuable for assessing the impact of local urban and municipal planning policies on urban or regional development.
Our results also provide valuable insights for understanding the urban land-use dynamics and the impacts of policies and environmental factors on the entire Ha Long city for nearly four decades. With escalating climate change and human activities in the future, regional sustainable development, together with ecology and food security, the region will face an increasing set of challenges. Our study offered a simple and effective approach using easily obtained datasets to provide helpful, sustainable urban development planning information.

Author Contributions

Conceptualisation, Y.C. and S.-M.J.; methodology, Y.C. and S.-M.J.; validation, Y.C. and N.H.Q.; formal analysis, S.-M.J., Y.C., M.N.N., M.P. and B.L.; resources, N.L.; writing—original draft preparation, S.-M.J. and Y.C.; writing—review and editing, M.N.N. and M.P.; project administration, M.N.N. and M.P.; funding acquisition, N.L. and M.N.N. All authors have read and agreed to the published version of the manuscript.

Funding

This research was funded by the Department of Foreign Affairs and Trade (DFAT), Australia, and the Ministry of Science and Technology (MOST), Vietnam, through the project “Supporting rapid assessment of landscape change to improve planning and decision-making in Vietnam” (DFAT Agreement No. 75452, MOST grant No. NĐT/AU/21/15).

Data Availability Statement

The data are available from the authors upon request.

Acknowledgments

The authors sincerely acknowledge manuscript editing by Phillip Ford (Honorary Fellow, CSIRO).

Conflicts of Interest

The authors declare no conflict of interest.

References

  1. Birch, E.L.; Wachter, S.M. World Urbanization: The Critical Issue of the Twenty-First Century. In Global Urbanisation; Birch, E.L., Wachter, S.M., Eds.; University of Pennsylvania Press: Philadelphia, PA, USA, 2011; p. 376. [Google Scholar]
  2. Word Development Indicators (WDI). The World Bank DataBank. 2021. Available online: https://databank.worldbank.org/source/world-development-indicators (accessed on 21 April 2021).
  3. Li, C.; Cai, G.; Du, M. Big Data Supported the Identification of Urban Land Efficiency in Eurasia by Indicator SDG 11.3.1. ISPRS Int. J. Geo-Inf. 2021, 10, 64. [Google Scholar] [CrossRef]
  4. Zoomers, A.; van Noorloos, F.; Otsuki, K.; Steel, G.; van Westen, G. The rush for land in an urbanising world: From land grabbing toward developing safe, resilient, and sustainable cities and landscapes. World Dev. 2017, 92, 242–252. [Google Scholar] [CrossRef]
  5. Constantin, C.; Luminita, C.; Vasile, A.J. Land grabbing: A review of extent and possible consequences in Romania. Land Use Policy 2017, 62, 143–150. [Google Scholar] [CrossRef]
  6. Pribadi, D.O.; Pauleit, S. The dynamics of peri-urban agriculture during rapid urbanisation of Jabodetabek metropolitan area. Land Use Policy 2015, 48, 13–24. [Google Scholar] [CrossRef]
  7. Wang, Y.; Huang, C.; Feng, Y.; Zhao, M.; Gu, J. Using Earth Observation for Monitoring SDG 11.3.1-Ratio of Land Consumption Rate to Population Growth Rate in Mainland China. Remote Sens. 2020, 12, 357. [Google Scholar] [CrossRef] [Green Version]
  8. Mohajerani, A.; Bakaric, J.; Jeffrey-Bailey, T. The urban heat island effect, its causes, and mitigation, with reference to the thermal properties of asphalt concrete. J. Environ. Manag. 2017, 197, 522–538. [Google Scholar] [CrossRef]
  9. Zitti, M.; Ferrara, C.; Perini, L.; Carlucci, M.; Salvati, L. Long-term urban growth and land use efficiency in Southern Europe: Implications for sustainable land management. Sustainability 2015, 7, 3359–3385. [Google Scholar] [CrossRef] [Green Version]
  10. Sustainable Development Goals (SDG) Indicators. Metadata Repository. 2021. Available online: https://unstats.un.org/sdgs/metadata/?Text=&Goal=&Target=11.3 (accessed on 3 June 2021).
  11. Steiniger, S.; Wagemann, E.; Barrera, F.; Molinos-Senante, M.; Villegas, R.; Fuente, H.; Vives, A.; Arce, G.; Herrera, J.-C.; Carrasco, J.A.; et al. Localising urban sustainability indicators: The GEDEUS indicator set, and lessons from an expert-driven process. Cities 2020, 101, 102683. [Google Scholar] [CrossRef]
  12. Merino-Saum, A.; Halla, P.; Superti, V.; Boesch, A.; Binder, C.R. Indicators for urban sustainability: Key lessons from a systematic analysis of 67 measurement initiatives. Ecol. Indic. 2020, 119, 106879. [Google Scholar] [CrossRef]
  13. Koroso, N.K.; Zevenbegen, J.A.; Lengoiboni, M. Urban land use efficiency in Ethiopia: An assessment of urban land use sustainability in Addis Ababa. Land Use Policy 2020, 99, 105081. [Google Scholar] [CrossRef]
  14. Zhu, X.; Li, Y.; Zhang, P.; Wei, Y.; Zheng, X.; Xie, L. Temporal-spatial characteristics of urban land use efficiency of China’s 35 mega cities based on DEA: Decomposing technology and scale efficiency. Land Use Policy 2019, 88, 104083. [Google Scholar] [CrossRef]
  15. Shen, X.; Wang, X.; Zhang, Z.; Lu, Z.; Lv, T. Evaluating the effectiveness of land use plans in containing urban expansion: An integrated view. Land Use Policy 2019, 80, 205–213. [Google Scholar] [CrossRef]
  16. Mwaniki, D. Module 3. Indicator 11.3.1 Land Consumption Rate to Population Growth Rate. Presented at the Regional Training Workshop on Human Settlement Indicators, Bangkok, Thailand, 26–29 March 2018. [Google Scholar]
  17. Tier Classification for Global SDG Indicators. 2018. Available online: https://unstats.un.org/sdgs/files/Tier%20Classification%20of%20SDG%20Indicators_11%20May%202018_web.pdf (accessed on 26 July 2021).
  18. Melchiorri, M.; Pesaresi, M.; Florczyk, J.A.; Corbane, C.; Kemper, T. Principles and Applications of the Global Human Settlement Layer as Baseline for the Land Use Efficiency Indicator—SDG 11.3.1. ISPRS Int. J. Geo-Inf. 2019, 8, 96. [Google Scholar] [CrossRef] [Green Version]
  19. United Nations. The Sustainable Development Goals Report; United Nations: New York, NY, USA, 2016; Available online: https://www.un.org/development/desa/publications/sustainable-development-goals-.report-2016.html (accessed on 2 March 2021).
  20. Chen, Y.; Guerschman, J.; Shendryk, Y.; Henry, D.; Harrison, M.T. Estimating pasture biomass using Sentinel-2 imagery and deep learning. Remote Sens. 2021, 13, 603. [Google Scholar] [CrossRef]
  21. Woodcock, C.E.; Allen, R.; Anderson, M.; Belward, A.; Bindschadler, R.; Cohen, W.; Gao, F.; Goward, S.N.; Helder, D.; Helmer, E.; et al. Free Access to Landsat Imagery. Science 2008, 320, 1011. [Google Scholar] [CrossRef] [PubMed]
  22. Huang, C.; Chen, Y.; Zhang, S.; Wu, J. Detecting, extracting, and monitoring surface water from space using optical sensors: A review. Rev. Geophys. 2018, 56, 333–360. [Google Scholar] [CrossRef]
  23. Cihlar, J. Land cover mapping of large areas from satellites: Status and research priorities. Int. J. Remote Sens. 2000, 21, 1093–1114. [Google Scholar] [CrossRef]
  24. Chen, Y.; Gillieson, D. Evaluation of Landsat TM vegetation indices for estimating vegetation cover on semi-arid rangelands a case study from Australia. Can. J. Remote Sens. 2009, 35, 435–446. [Google Scholar] [CrossRef]
  25. Gong, P.; Wang, J.; Yu, L.; Zhao, Y.; Zhao, Y.; Liang, L.; Niu, Z.; Huang, X.; Fu, H.; Liu, S.; et al. Finer resolution observation and monitoring of global land cover: First mapping results with Landsat TM and ETM+ data. Int. J. Remote Sens. 2013, 34, 2607–2654. [Google Scholar] [CrossRef] [Green Version]
  26. Tuan, V.Q.; Trung, N.H.; Nguyen, M. An Assessment of Green Space, Blue Space and Green Infrastructure Using Remote Sensing Approach, Research Report No. DMI-0111/2019; DRAGON—Mekong Institute of Climate Change Research, Can Tho University: Cần Thơ, Vietnam, 2019; p. 38. [Google Scholar]
  27. Abid, A.M. Land cover and land use classification performance of machine learning algorithms in a boreal landscape using sentinel-2 data. GISci. Remote Sens. 2019, 57, 1–20. [Google Scholar] [CrossRef] [Green Version]
  28. Mountrakis, G.; Im, J.; Ogole, C. Support vector machines in remote sensing: A review. ISPRS J. Photogramm. Remote Sens. 2011, 66, 247–259. [Google Scholar] [CrossRef]
  29. Pal, M.; Foody, G.M. Feature selection for classification of hyperspectral data by SVM. IEEE Trans. Geosci. Remote Sens. 2010, 48, 2297–2307. [Google Scholar] [CrossRef] [Green Version]
  30. Heikkonen, J.; Varfis, A. Land cover/land use classification of urban areas: A remote sensing approach. Int. J. Pattern Recognit. Artif. Intell. 1998, 12, 475–489. [Google Scholar] [CrossRef]
  31. Kotsiantis, S.B.; Zaharakis, I.; Pintelas, P. Supervised Machine Learning: A Review of Classification Techniques. In Emerging Artificial Intelligence Applications in Computer Engineering; IOS Press: Amsterdam, The Netherlands, 2007; Volume 160, pp. 3–24. [Google Scholar]
  32. Shao, Y.; Lunetta, R.S. Comparison of support vector machine, neural network, and CART algorithms for the land-cover classification using limited training data points. ISPRS J. Photogramm. Remote Sens. 2012, 70, 78–87. [Google Scholar] [CrossRef]
  33. Breiman, L. Random forests. Mach. Learn. 2001, 45, 5–32. [Google Scholar] [CrossRef] [Green Version]
  34. Na, X.; Zhang, S.; Li, X.; Yu, H.; Liu, C. Improved land cover mapping using random forests combined with Landsat Thematic Mapper imagery and ancillary geographic data. Photogramm. Eng. Remote Sens. 2010, 76, 833–840. [Google Scholar] [CrossRef]
  35. Thanh Noi, P.; Kappas, M. Comparison of random forest, k-nearest neighbor, and support vector machine classifiers for land cover classification using sentinel-2 imagery. Sensors 2018, 18, 18. [Google Scholar] [CrossRef] [PubMed] [Green Version]
  36. Zafari, A.; Zurita-Milla, R.; Izquierdo-Verdiguier, E. Evaluating the performance of a random forest kernel for land cover classification. Remote Sens. 2019, 11, 575. [Google Scholar] [CrossRef] [Green Version]
  37. Phiri, D.; Morgenroth, J. Developments in Landsat cover classification methods: A review. Remote Sens. 2017, 9, 967. [Google Scholar] [CrossRef] [Green Version]
  38. Srivastava, P.K.; Han, D.; Rico-Ramirez, M.A.; Bray, M.; Islam, T. Selection of classification techniques for landuse/landcover change investigation. Adv. Space Res. 2012, 50, 1250–1265. [Google Scholar] [CrossRef]
  39. Ge, G.; Shi, Z.; Zhu, Y.; Yang, X. Land use/cover classification in an arid desert-oasis mosaic landscape of China using remote sensed imagery: Performance assessment of four machine learning algorithms. Glob. Ecol. Conserv. 2020, 22, e00971. [Google Scholar] [CrossRef]
  40. World Bank (WB). Vietnam’s Urbanisation at a Crossroads: Embarking on an Efficient, Inclusive, and Resilient Pathway. License: CC BY 3.0 IGO. 2020. Available online: https://openknowledge.worldbank.org/handle/10986/34761 (accessed on 26 May 2021).
  41. National Institute for Urban and Rural Planning (NIURP). City Development Strategy for Halong; Final Report; National Institute for Urban and Rural Planning: Hanoi, Vietnam, 2012; p. 205. [Google Scholar]
  42. Broemme, K.; Stolpe, H. Developing Environmental Concepts for Vietnamese Coal Mines. Presented at International Workshop Geoecology and Environmental Technology, Hanoi, Vietnam, 25–27 October 2007. [Google Scholar]
  43. General Statistics Office of Vietnam. Population and Employment Statistics. 2021. Available online: https://www.gso.gov.vn/en/population/ (accessed on 5 April 2021).
  44. Ben-hur, A.; Horn, D.; Siegelmann, H.T.; Vapnik, V. Support vector clustering. J. Mach. Learn. Res. 2001, 2, 125–137. [Google Scholar] [CrossRef]
  45. Sheykhmousa, M.; Mahdianpari, M.; Ghanbari, H.; Mohammadimanesh, F.; Ghamisi, P.; Homayouni, S. Support Vector Machine vs. Random Forest for Remote Sensing Image Classification: A Meta-analysis and systematic review. IEEE J. Sel. Top. Appl. Earth Obs. Remote Sens. 2020, 13, 6308–6325. [Google Scholar] [CrossRef]
  46. Mboga, N.; Persello, C.; Bergado, J.R.; Stein, A. Detection of informal settlements from VHR images using convolutional neural networks. Remote Sens. 2017, 9, 1106. [Google Scholar] [CrossRef] [Green Version]
  47. Turker, M.; Koc-San, D. Building extraction from high-resolution optical spaceborne images using the integration of support vector machine (SVM) classification, Hough transformation and perceptual grouping. Int. J. Appl. Earth Obs. Geoinf. 2015, 34, 58–69. [Google Scholar] [CrossRef]
  48. Hsu, C.-W.; Chang, C.-C.; Lin, C.-J. A Practical Guide to Support Vector Classification; National Taiwan University: Taipei, Taiwan, 2003; pp. 1396–1400. [Google Scholar]
  49. Quang, N.H.; Quinn, C.H.; Stringer, L.C.; Carrie, R.; Hackney, C.R.; Van Hue, L.T.; Van Tan, D.; Nga, P.T.T. Multi-Decadal Changes in Mangrove Extent, Age and Species in the Red River Estuaries of Viet Nam. Remote Sens. 2020, 12, 2289. [Google Scholar] [CrossRef]
  50. Congalton, R.G. A review of assessing the accuracy of classifications of remotely sensed data. Remote Sens. Environ. 1991, 37, 35–46. [Google Scholar] [CrossRef]
  51. Congalton, R.G.; Green, K. Assessing the Accuracy of Remotely Sensed Data: Principles and Practices; CRC Press: Boca Raton, FL, USA, 1999. [Google Scholar]
  52. Chen, Y.; Huang, C.; Ticehurst, C.; Merrin, L.; Thew, P. An evaluation of MODIS daily and 8-day composite products for floodplain and wetland inundation mapping. Wetlands 2013, 33, 823–835. [Google Scholar] [CrossRef]
  53. Landis, J.R.; Koch, G.G. The measurement of observer agreement for categorical data. Biometrics 1977, 33, 159–174. [Google Scholar] [CrossRef] [Green Version]
  54. Jensen, J.R. An Introductory Digital Image Processing: A Remote Sensing Perspective; Prentice Hall: New Jersey, NJ, USA, 2005. [Google Scholar]
  55. UN-Habitat. A Guide to Assist National and Local Governments to Monitor and Report on SDG Goal 11+ Indicators; UN-Habitat: New York, NY, USA, 2018. [Google Scholar]
  56. EcoWatch. Toxic Floods from Coal Mines and Power Plants Hit Vietnam’s Ha Long Bay World Heritage Site. 2015. Available online: https://www.ecowatch.com/toxic-floods-from-coal-mines-and-power-plants-hit-vietnams-ha-long-bay-1882080179.html (accessed on 1 June 2021).
  57. New York Times. Vietnam Floods Kill 17 an Threaten to Pollute Ha Long Bay. 2015. Available online: https://www.nytimes.com/2015/07/31/world/asia/vietnam-floods.html (accessed on 1 June 2021).
  58. Corbane, C.; Politis, P.; Siragusa, A.; Kemper, T.; Pesaresi, M. LUE User Guide: A tool to calculate the Land Use Efficiency and the SDG 11.3 Indicator with the Global Human Settlement Layer; Publications Office of the European Union: Luxembourg, 2017. [Google Scholar]
Figure 1. Location of Ha Long city. (Sources: World Imagery in ArcGIS from Esri, Maxar, GeoEye, Earthstar Geographics, CNES/Airbus DS, USDA, USGS, AeroGRID, IGN, and the GIS User Community; and World Boundaries and Places from Esri, HERE, Garmin, © OpenStreetMap contributors, and the GIS user community.)
Sustainability 13 08848 g001
Figure 2. Population and built-up area trends in Ha Long over 1986–2020.
Sustainability 13 08848 g002
Figure 3. Landsat-derived maps showing the built-up area of Ha Long city over 1986–2020.
Sustainability 13 08848 g003
Figure 4. Landsat-derived land-use maps of Ha Long city over 1986–2020.
Sustainability 13 08848 g004
Table 1. Landsat data used in study areas.
SensorBandAcquisition Date
Landsat 5B1–B730 October 1986
Landsat 5B1–B726 November 1990
Landsat 5B1–B724 November 1995
Landsat 5B1–B721 November 2000
Landsat 5B1–B72 October 2005
Landsat 5B1–B73 December 2010
Landsat 8B1–B1115 January 2015
Landsat 8B1–B1112 November 2020
Table 2. Urban expansion types based on LCRPGR values.
Urban Expansion TypeLCRPGR Data RangeMeaning
Rapid urban land growth(1–5)Urban land consumption exceeds population growth
Rapid urban population growth(0–1)Urban population growth exceeds land consumption
Urban shrinking(−5–0)Urban population declining or urban land shrinking
Source: [3].
Table 3. Accuracy evaluation of land-use classification (OE and CE averaged across all land-use classes).
Ha LongSamplesOverall Accuracy (%)Omission Error (%)Commission Error (%)Kappa
198611592.258.5011.600.91
199012083.419.2120.200.80
199510184.2113.1619.520.82
200012588.2416.6420.240.86
200512386.0317.0922.610.84
201012486.4017.6021.040.84
201512498.911.913.030.99
202014495.179.164.360.94
Table 4. LCR, PGR, and LCRPGR values for Ha Long.
IndexTime Periods
1986–19901990–19951995–20002000–20052005–20102010–20152015–2020
LCR0.08050.00020.02250.06290.05340.08010.1335
PGR0.02300.00680.07390.00280.02850.00380.0383
LCRPGR3.500.020.3022.501.8721.323.48
1986–20002000–2020
LCR0.03110.0825
PGR0.03540.0183
LCRPGR0.884.50
Publisher’s Note: MDPI stays neutral with regard to jurisdictional claims in published maps and institutional affiliations.

