Article

Assessing Five Major Exploited Tuna Species in India (Eastern and Western Indian Ocean) Using the Monte Carlo Method (CMSY) and the Bayesian Schaefer Model (BSM)

1
Key Laboratory of Mariculture (Ministry of Education), Fisheries College, Ocean University of China, No. 5 Yushan Road, Qingdao 266003, China
2
School of Management, Qingdao Agricultural University, Qingdao 266109, China
*
Authors to whom correspondence should be addressed.
U.N. and R.A. contributed equally to this work.
Sustainability 2021, 13(16), 8868; https://doi.org/10.3390/su13168868
Submission received: 26 June 2021 / Revised: 27 July 2021 / Accepted: 6 August 2021 / Published: 8 August 2021

Abstract

:
The status of data-limited tuna fishery stocks in India has been tested using the latest and most advanced computerized methods, CMSY and BSM. Five tuna fish stocks from both the Eastern and Western Indian Ocean were assessed using both catch and catch per unit effort (CPUE) details available from 1990 to 2015. Both methods help to calculate the maximum sustainable yield (MSY) and exploitation of MSY relative to biomass (B/BMSY). The results of maximum intrinsic rate (r) and carrying capacity are also estimated. The results revealed that all tuna stocks in both the regions were overfished, with one, the longtail tuna (Thunnus tonggol) in the Western Indian Ocean strongly overfished (B/BMSY = 0.44). Such observations, although still preliminary since the techniques used to produce them are relatively new, often associated with the situation and exploitation of all the stock in question, making the CMSY and BSM methods promising for stock assessment in data-deficit situations. The study concludes that in order to restore the status of these five tuna stocks in both regions, it would be necessary to reduce the fishing pressure.

1. Introduction

The data of fisheries obtained from the Food and Agriculture Organization (FAO) revealed that global fish landings have been declining steadily since 1996 [1], with catches declining by 1.2 million tons annually since then due to illegal, unreported fishing and undocumented (IUU) fishing [2,3]. The proportion of fish stocks within biologically sustainable levels, which was 90% in 1990 and 65.8% in 2017, can be used to understand the overfishing status of global fisheries [4]. For Asian fisheries, the situation is even worse [5] due to high fishing pressure on the stock [6]. The highest depletion has been seen for predatory fishes with only 10 percent biomass available of its actual population [7]. Now, in order to reduce the fishing pressure of a particular fish stock, total allowable catch (TAC) should be reduced [8].
Different species of tuna are distributed widely all around the globe but are specifically found from temperate to tropical waters around the equator between 45 degrees North and South. The species are widely divided into neritic, coastal and marine tunas. Taxonomically tuna’s are grouped into the Scrombridae family, approximately consisting of fifty species, constitute the third-largest international seafood trade commodity and accounting for almost 10% of total value trade [9]. Tuna catches continued to rise, hitting their highest level at about 7.9 million tons in 2018, which was possibly due to catches from the Central and Western Pacific [9]. Within the species group, the highest catch was dominated by yellowfin tuna and skipjack tuna (58%) [4]. Globally, there are many species of tuna that are under continuous threat, as the World Conservation Union (IUCN) has declared the Atlantic bluefin tuna and southern bluefin tuna as critically threatened [10]. The recent stock status of tuna as per IOTC revealed that for albacore, the longline-susceptible biomass has decreased to about 50 percent of its 1980–1982 levels [11]. There were 20 years of moderate fishing prior to 1980, after which total albacore tssuna catches in the Indian Ocean more than doubled in subsequent years. Some fleet catches have also increased significantly since 2007, despite significant ambiguity about the accuracy of the catch estimates (e.g., Indonesian and Taiwanese longline fisheries in China) [11]. For the Indian Ocean’s bigeye tuna, there has been steep decline in longline efforts, particularly from the Japanese, Taiwanese and Republic of Korea longline fleets, which lowered the pressure on the bigeye stock since 2007 [12]. However, a recent increase in catch from purse seine fleets has intensified this pressure, and the stock is now considered overfished. Similarly, for skipjack tuna, total catches in 2018 were 30% higher than the resulting skipjack catch limit for the period 2018–2020 (470,029 t), raising concerns [11]. It is worth noting that achieving the management goals outlined in Resolution 16/02 necessitates the successful implementation of the skipjack HCR’s capture limitations [11]. Skipjack can adjust rapidly to ambient foraging conditions driven by ocean productivity, which appears to have been favorable in recent years due to its unique life history characteristics. In order to restore the overfished stocks, effective management and regulations of harvest control should be maintained at sustainable levels. Tuna fishery is fully established in the Indian Ocean, with many coastal countries involved in the fishery sector. Out of the five major tuna species caught in the Indian Ocean from 2010–2015, kawakawa constituted about 31% of the total catch, yellowfin 25%, skipjack 22% and longtail and frigate constituted 11% each (Figure 1). However, declines have occurred in most of these fishing resources due to heavy fishing pressure [13]. These declines are putting the supply of fishery products at risk [14,15], despite restrictions on some fishing activities, which include regulations on nets used, seasons and fishing areas, limitations on mesh size, etc. [16,17]. Ludwig [18] stated that the major hurdles in effective fisheries management are the negligence of scientific procedures and the actual known status of the stock under exploitation.
The previous tuna stock assessments by IOTC have been completed using the Stock Synthesis 3 (SS3) methodology. The evaluation incorporates many sources of fisheries and biological data into a geographically aggregated and seasonally organized model. The model utilizes standardized CPUE series as a relative abundance measure of accessible biomass and a newly available index based on acoustic data from echosounder buoys. The model also employs an index based on tuna associative dynamics with floating elements. The RTTP-IO program’s tag release and recovery data are also incorporated into the model to determine abundance and fishing mortality rates [11]. The model uses four types of data: catch, size frequency, tagging and joint longline CPUE indices. In this study, the CMSY and BSM model have been employed as typical production models, such as Schaefer’s [19] estimated productivity using time series of catch and abundance. Instead, the CMSY approach described in this work estimates biomass based on catch and productivity, which is a significant improvement over Martell and Froese’s [20]. The Catch-MSY method focuses on estimating maximum sustainable yield (MSY); CMSY uses catch data and species resilience to determine biomass, exploitation rate and MSY. Probable ranges for the maximum intrinsic rate of population increase (r) and for unexploited population size or carrying capacity (k) are filtered with a Monte Carlo approach to detect ‘viable’ r–K pairs. Additionally, several methods for assessing data-limited stocks have been developed [21,22,23], and recent reviews of these methods [18,24] have found Martell and Froese’s [20] Catch-MSY method to be a promising approach.
CMSY and BSM computerized methods were used and compared for five major tuna species in India, from the Eastern Indian Ocean and Western Indian Ocean regions. The exploitation status of the stocks from the Eastern Indian Ocean included the regions of Andaman Islands, Lakshadweep Islands, Nicobar Islands, Pamban Islands and St. Mary’s Islands. Western Indian Ocean’s stock assessment comprised of Vypin Islands, Vallarpadam and Willingdon Islands. The focus of this research is to determine the MSY, CMSY estimated biomass, exploitation rate and other BRPs of five major tuna species in the Indian Ocean using CMSY and BSM models, and provide baseline stock information to the fishery administrator for sustainable tuna management. The significance of this research is that unlike complex stock assessment methods that require fisheries-independent data sets such as research surveys and catch-at-age data, the recently proposed CMSY method quantifies biomass, exploitation rate, Maximum Sustainable Yield (MSY) and related fisheries reference points for a given population using only a time series of catches and ancillary qualitative information.

2. Materials and Methods

The study is based on assessment of five major tuna fishery stocks from India in the Eastern Indian Ocean and Western Indian Ocean (1990–2015). The catch and effort data for the study were accessed from FAO statistical database and Indian Ocean Tuna Commission (IOTC), respectively. The data source and basic information of the five tuna stocks covered here are given in Table 1. Each the five tuna stocks with catch and catch per unit effort (CPUE) data series of the above-mentioned period was analyzed using the CMSY and BSM methods.
It is possible to see the CMSY approach as an accounting practice, where annual catches are removed from stock biomass by an annual biological product that is included in it and is usually initiated at the expected biomass. This leads to a biomass pathway that is defined by the stock and the growth rate of the stock, as determined by the estimated population growth (r; ‘resilience’) and the extend of similarity between the biomass and carrying capacity (k). A feature of the Monte Carlo method is then used to produce thousands of such trajectories, each with different values of r and k, and to separate trails with usable solutions, i.e., trajectories can ‘crash’ the stock and follow different (‘priors’) methods
To determine status of the fishery, the CMSY method was applied to stocks in the Northwest Pacific [25]. Additionally, part of the Bayesian Schaefer State-Space Surplus Production Model (BSM) code for CMSY R was used to respond to a variety of stock assessment (process error) measurements [25]. JAGS program with the Markov chain Monte Carlo process sampled the probability distributions of the parameters [26,27]
CMSY and BSM methods measure parameters that include MSY, biomass that enables a fish stock to deliver the maximum sustainable yield (BMSY) and the maximum rate of fishing mortality (FMSY) based on r–k pairs that may be screened for Monte Carlo tests [25].
By using the catch and abundance data, r, k and MSY can be predicted by using the BSM model and are represented by Equation (1).
Bt+1 = Bt + r (1 − Bt/k) BtCt
where Bt+1 is the biomass used next year t + 1, Bt is the present biomass and Ct is the actual catch in year t, r is intrinsic population rate and k is the carrying capacity.
In order to understand the reduced recruitment of the highly declining stock, surplus production (linear decline) [28] that is a function of somatic growth, natural mortality and recruitments is applied if biomass declines beyond 0.25 k, as shown in Equation (2).
Bt+1 = Bt + 4rBt/k Σ(1 − Bt/k) BtCt Bt/k < 0.25
where the term 4rBt/k assumes that r declines linearly with half of biomass that is actually capable of producing MSY.
Table 2 represents the resilience information (FishBase [29] and SeaLifeBase [30] that is translated into prior r ranges. The ratio of higher and lower r and maximum catch (C) were used to enlighten the upper and lower k bounds.
klow = max (C)/rhigh; khigh = 4 max (C)/rlow
Equation (3) represented stock, which at the end accounted for lower initial biomass, which was later modified for higher biomass.
Fklow = 2 max (C)/rhigh; khigh = 12 max (C)/rlow
Values of k are predicted to have a normal log distribution, a standard deviation that was thought to be ¼ of the distance between the median value and the lower range of k [31].
Data-scarce stocks might have CPUE (number/hour) as an estimate of stock abundance for some years. The catchability coefficient (q) relates this abundance index to the stock biomass, as shown in Equation (5).
CPUEt = qBt
where CPUEt represents the average catch per unit effort, Bt is biomass in year t and q represents the catchability coefficient.
Catch per unit effort’s dynamic abundance is expressed in Equation (6).
CPUEt+1 = CPUEt + r(1 − CPUEt/qk) CPUEtqCt
Equations (1) and (5) represent the variables and parameters, and the prior catchability coefficient is obtained from Equation (7).
Y = rB (1 − B/k)
By using the simulations, the multipliers for prior r ranges and high and low biomass are derived. Now, by using Equations (8) and (9), prior catchability coefficient (q) can be derived for fish stocks with high B.
qlow = 0.25 rpgm CPUEmean/Cmean
qhigh = 0.5 rhigh CPUEmean/Cmean
where qlow is the lower prior catchability coefficient and qhigh is the upper catchability coefficient, both for the stocks with higher present biomass. The geometric mean of r is represented by rpgm, CPUEmean represents the average CPUE of the last half-decade or full decade and Cmean represents the average catch.
Pauly [32] suggested changing the multiplier values of qlow and qhigh to 0.5 and 1.0, respectively, for the actual stocks that presently have low biomass. For the species with medium and high resilience, the mean catch and CPUE were applied over last 5 years. For the species with low to very low r values, the same were applied, but for recent decadal years [33].
Froese [25], in his work, depicted that the initial and terminal priors of the relative biomass were represented by Bstart/k and Bend/k of individual time series, and the assumed depletion levels were responsible for estimating their ranges [34]. For every tuna stock under assessment in this study, Table 3 presented the Bstart/k ranges (suggested). In order to evaluate the actual status of the stock and exploitation level of the species under study, the previous year’s biomass (B/BMSY) was used and further estimated using the CMSY and BSM methods [35]. The results are presented in Table 4.

Stock Assessment by IOTC Using CMSY and BSM Models

CMSY is a data-limited Monte Carlo method of assessing fisheries reference points and relative stock size using catch data. The Schaefer model is run multiple times in CMSY to generate annual biomasses for r–K pairs drawn at random from previous distributions. The model decides whether r–K pairs are valid, for example, those that produce a biomass time series that does not (1) result in a stock collapse or (2) allows the stock to exceed carrying capacity. Additionally, r–K pairs that result in a final relative biomass estimate between the values specified in the inputs (the final depletion range) are accepted and used to calculate MSY (rK/4) and biomass over time. The most probable values are the geometric means of the resulting density distributions of r, K and MSY. These values are then used to establish managerial reference points. The CMSY method performs an enhanced Bayesian state-space implementation of the Schaefer surplus production model (BSM) when abundance indices are known. The BSM has the advantage of focusing on informative priors and allowing short (minimum 3 years) and fragmented abundance data [36]. The key difference between our evaluation and the IOTC’s stock assessment for neritic tuna is that IOTC assessed tuna stocks across the Indian Ocean, whereas, in our analysis, we distinguished comparative stock assessments in the Eastern (Andaman Islands, Lakshadweep Islands, Nicobar Islands, Pamban Islands and St. Mary’s Islands) and Western Indian Oceans (Vypin Islands, Vallarpadam and Willingdon Islands).

3. Results

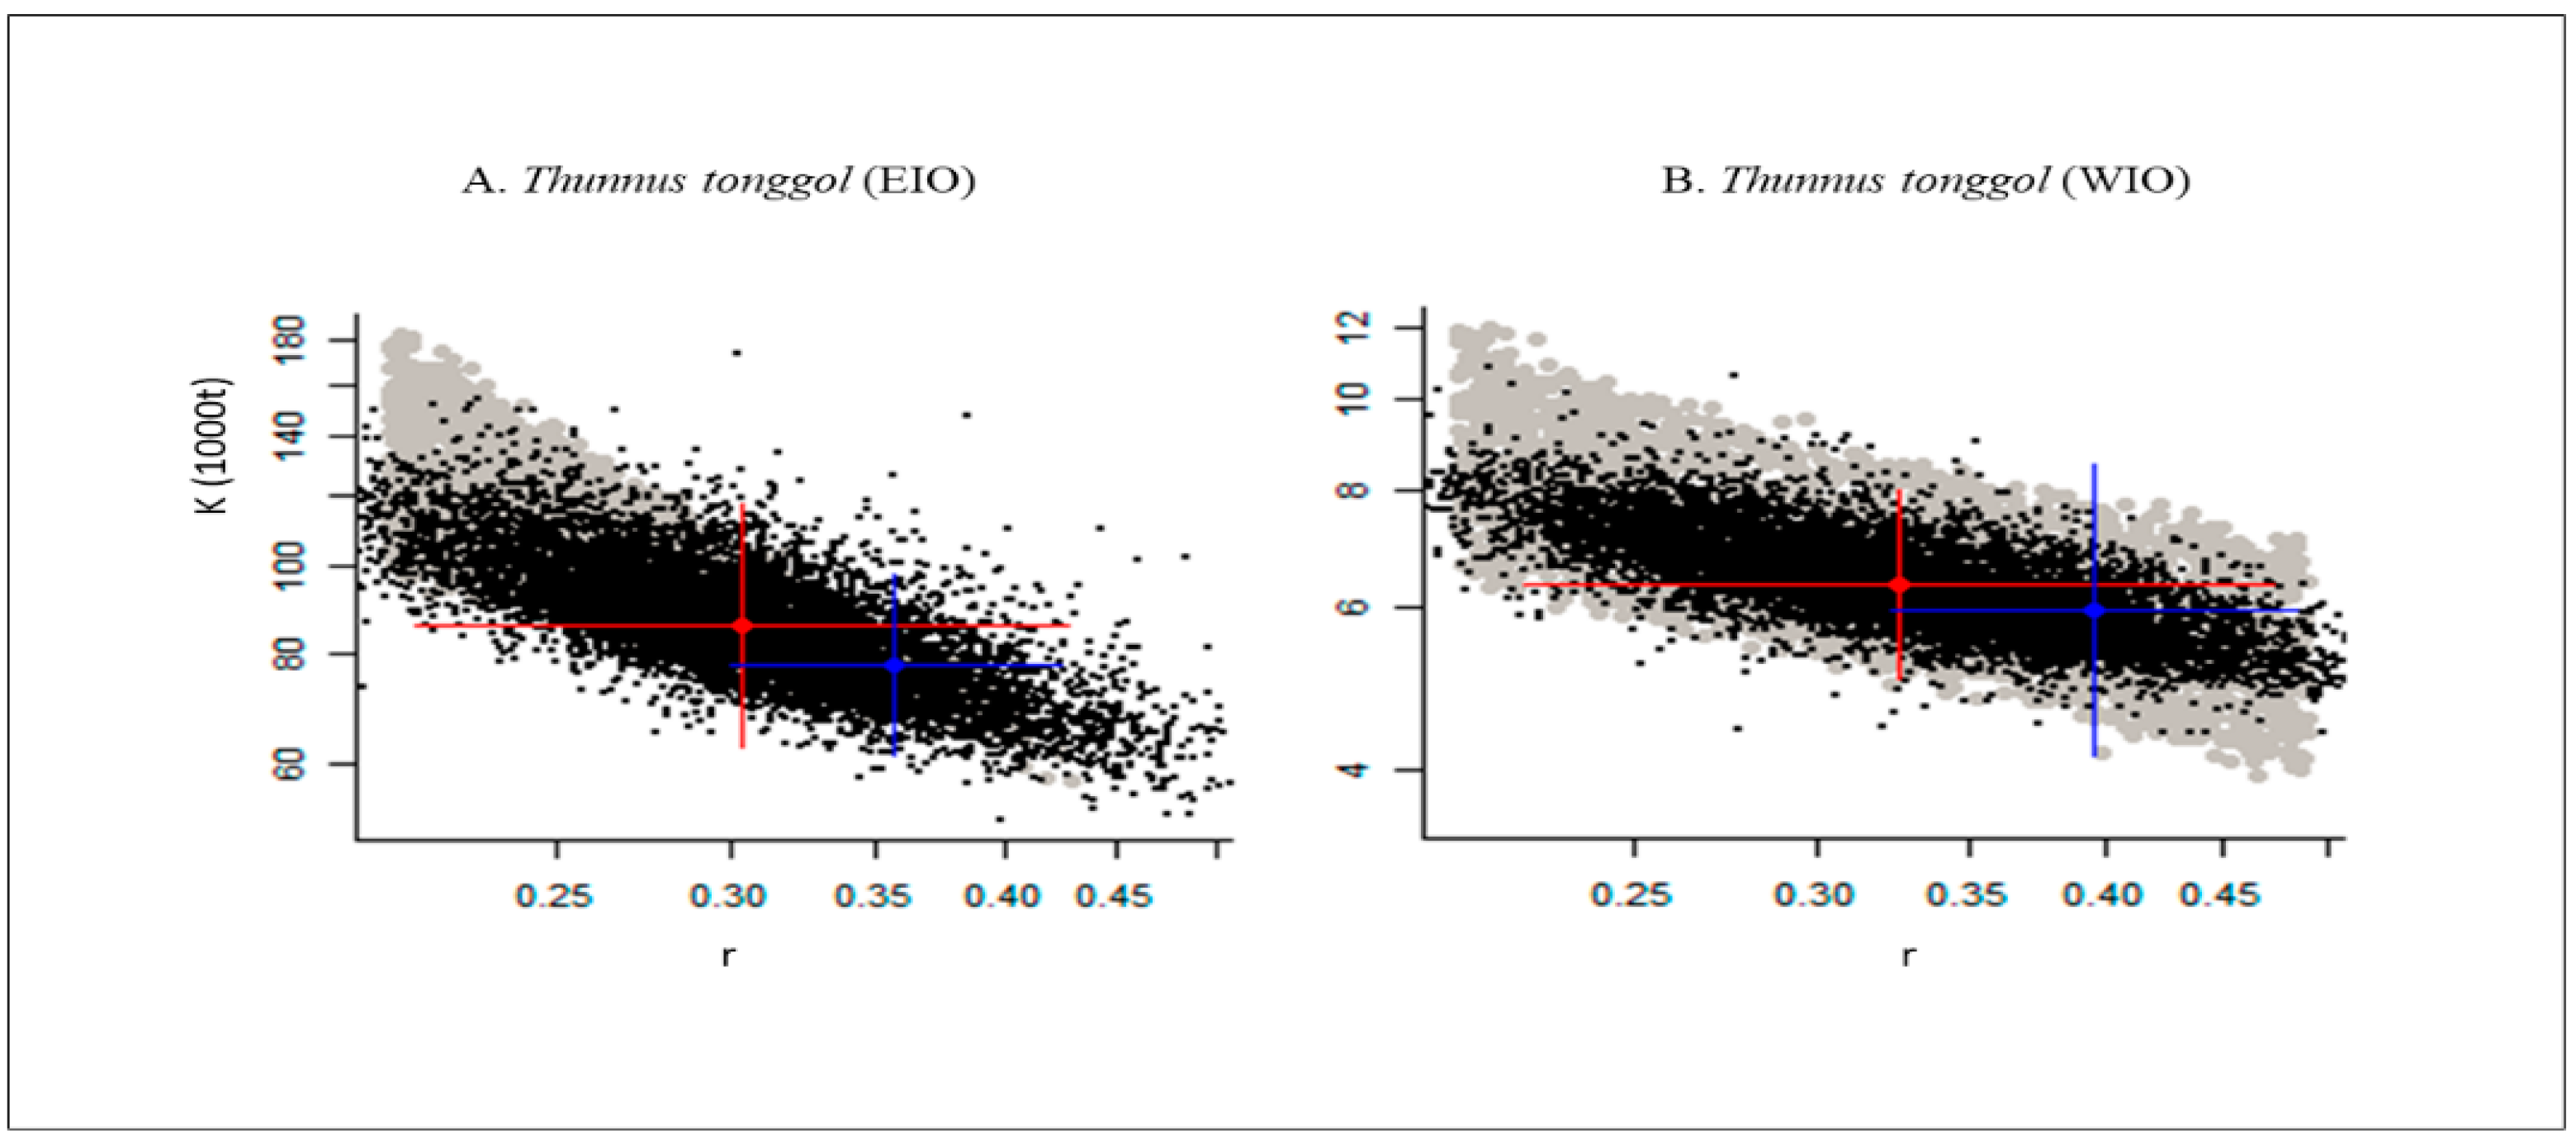
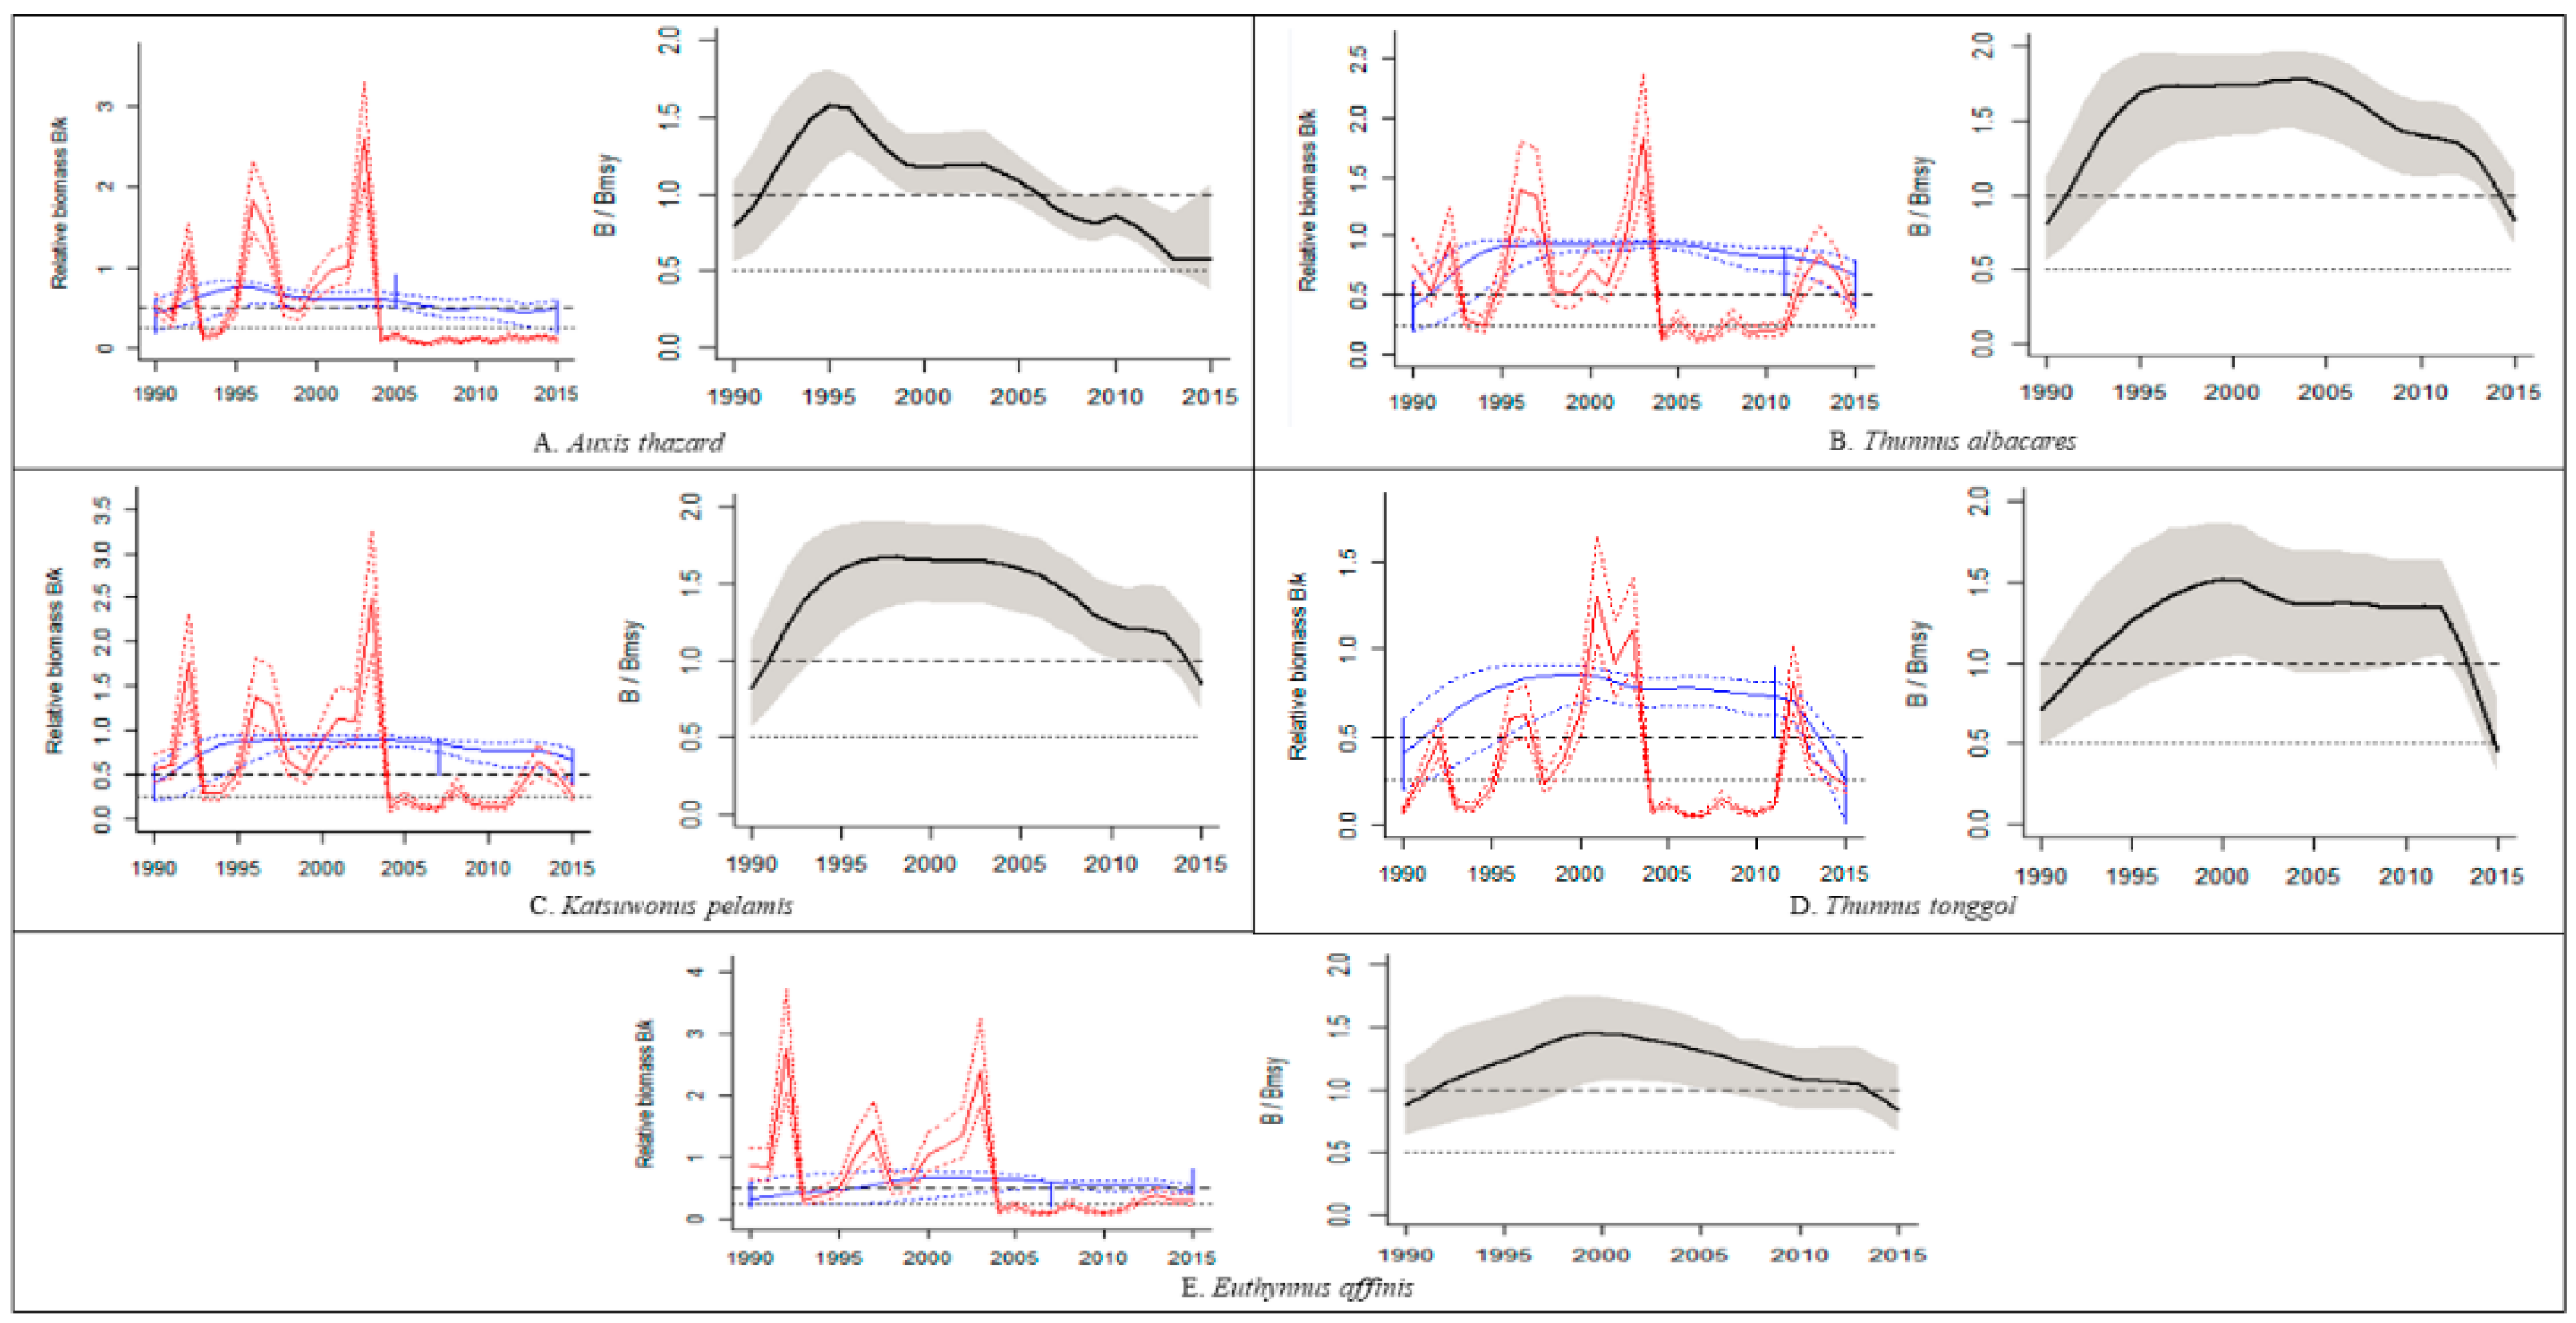
The B/BMSY values for all 10 tuna fishery stocks assessed in India from the Eastern Indian Ocean and Western Indian Ocean were less than one, which clearly indicates that all the stocks are overfished (Table 5; Table 6). Active r–K pairs analyzed by CMSY and BSM methods produce triangular-shaped clouds in the plot’s space, where the r–K pair most likely (and its 95% confidence intervals) is located at the top of the triangle (Figure 2). The pattern revealed that all the stocks were depleting, although the trends were different for each stock in both the Eastern part of the Indian Ocean (EIO) and the Western part of the Indian Ocean (WIO) (Figure 3 and Figure 4).
The estimated biomass of five tuna species for the Eastern Indian Ocean has been depicted in Figure 3. As shown in Figure 3A–E, all the fish stocks were subjected to continuous overfishing. Yellowfin tuna and skipjack tuna showed a similar pattern in their biomass estimation (Figure 3B,C). It is revealed that the actual relative biomass (B/BMSY) observed for yellowfin tuna was 0.82 and for skipjack tuna was 0.63. Similarly, longtail tuna and kawakawa (Figure 3D,E) had related patterns in biomass estimation with better relative biomass reaching up to 0.81–0.83, respectively (Table 5). Of all the stocks, frigate tuna (Figure 3A) had the least B/BMSY of 0.55 and was overfished, with a substantial decrease in the stock since 1995.
Amongst the studied tuna stocks in the Western Indian Ocean (WIO) (Figure 4), the longtail tuna was highly exploited and overfished with relative biomass (B/BMSY) of 0.44 (Table 6). The stocks started depleting from the year 2000, and later, after 2012, the unsustainable exploitation of the species led to a sudden decline. In WIO, the biomass trajectories were also similar for yellowfin tuna and skipjack tuna, with B/BMSY of 0.82 and 0.84, respectively (Table 6).
The findings of CMSY could be replicated with the BSM method for tuna stock in EIO (Table 7) and WIO (Table 8). For EIO, the fifth–ninety-fifth percentile ranges for MSY, B/BMSY, k and r were thinner for BSM than CMSY (Table 7). Only the estimate r of Auxis thazard (frigate tuna) and k of Katsuwonus pelamis (skipjack tuna), Thunnus tonggol (longtail tuna) and Euthynnus affinis (kawakawa) had broader ranges in Bayesian Model. Similarly, for the tuna stocks in WIO, fifth–ninety-fifth percentile ranges for MSY and B/BMSY were thinner for BSM than CMSY except for r estimate of Auxis thazard (frigate tuna) and k of Thunnus tonggol (longtail tuna) (Table 8).

4. Discussion

Sustainable fisheries management is primarily based on stock assessment results, which provide useful information for successful policy formulation of fisheries resources. Many models of stock assessment require a lot of data [37] which ultimately makes their implementation limited to only valuable species and stocks [38,39]; however, other species are less considered [40,41]. Maximum Sustainable Yield is frequently used as a reference point for fish stocks assessment [41], and B/BMSY is used as a context for determining the status of fisheries [19]. Scientists and managers representing fisheries recognize principles of MSY, q, r and k for attaining sustainability in their respective fisheries [25,42,43]. In order to suggest biological reference points (BRPs) estimated by various statistical methods, scientists assess fishery stock status [44,45]. In this study, the biological reference points of five major tuna species have been estimated by two newly developed computerized methods: Monte Carlo Catch-MSY (CMSY) and the Bayesian Schaefer Model (BSM) for estimating the level of exploitation of five major tuna fishery stocks in the Eastern and Western Indian Ocean. An important benefit of using these sophisticated approaches is that they operate in data-scarce circumstances and develop outcomes that can assist national and regional policy and can support key decisions in management. Moreover, overfishing in marine water can disturb the equilibrium of fish species and other marine organisms, and overfishing of specific species may lead to extinction [46,47]. Thus, management strategies for controlling the overfishing status of tuna fisheries should therefore be stringent in order to ensure the sustainability of the species in the Indian Ocean.
The k and r were the necessary prior information for the CMSY and BSM [20] that can be obtained from resilience data obtained from the Fishbase [36]. CMSY shows some inefficiencies when used for very-low-resilience or less-captured fisheries, as per [48] simulation studies. The resilience value for all the five tuna fishery stocks in both the Eastern and Western Indian Ocean was in the range of low to medium. To determine the status of fishery stocks, catch, efforts and CPUE are key indicators. Catchability coefficient (q) is also important to study the fish population dynamics and usually denotes the ratio between fishing mortality and fishing efforts. Hoggarth [49] suggested that q positively affects the spatial distribution of fish stocks and fishing zones.
The ratio of B/BMSY less than 1.0 produced by both CMSY and BSM models determines the over-fished condition and unhealthy biomass of the tuna fishery in both the Eastern and Western Indian oceans. In the EIO, the least relative biomass (B/BMSY) was observed in frigate tuna (0.55) (Table 5), and in WIO, the least (B/BMSY) was for the longtail tuna (0.44) (Table 6), with both having an F/FMSY value > 1, which depicts that both fisheries are overfished but are still sustainable. The r values for the longtail tuna in the entire Indian Ocean assessed by IOTC [50] ranged from 0.96 to 1.48 (mean of 1.19), whereas in our study, the r values for longtail tuna in the Eastern Indian Ocean ranged from 0.216 to 0.428 (mean of 0.304) and for Western Indian Ocean, ranged from 0.224 to 0.473 (mean of 0.326). Similarly, another study of IOTC for assessment of kawakawa (Euthynnus affinis) in the Indian Ocean using data-limited methods revealed the status of fish as overfished with BMSY of 0.97 but is not subject to overfishing (FMSY of 1.16) [51]. In addition, the catches in the last 5 years have exceeded the MSY estimate.
The strong assumptions imposed on population dynamics and stock productivity, particularly the intrinsic growth rate and carrying capacity parameters, are largely responsible for the consistent estimates among CMSY simulations. The terminal depletion level assumption is subjective, yet it has a significant impact on stock status assessments. Because the model relied on standardized CPUE indices to offer information on abundance trends, it is less reliant on subjective assumptions (particularly those relating to depletion levels, which are critical in stock reduction assessment). The BSM also includes a more robust statistical prediction framework, which allows for an even more precise estimation of key parameters and management quantities. However, the availability of the standardized CPUE as a potential abundance index and its inclusion in the assessment constitutes a significant step forward in the development of more reliable methodologies to assess five major tuna species in both EIO and WIO in the context of data scarcity. Future studies should look towards developing more accurate population models, such as age-structured models that take into account more biological and fisheries data rather than catch series.

5. Conclusions

This contribution assessed five major exploited tuna stocks of India in the Eastern and Western Indian oceans using CMSY and BSM computer-intensive methods. The results revealed that all the tuna stocks in both the regions were overfished, with specifically the longtail tuna (Thunnus tonggol) fishery strongly overfished in the Western Indian Ocean Region.
The methods of stock assessment are based primarily on catch and catch per unit effort data (such as the CMSY and BSM methods) and are highly precise when stocks are lightly fished, while for over-exploited fisheries, catch variations typically represent differences in the underlying biomass. If the applications of CMSY and BSM methods are to be increased and made more efficient, it is compulsory to have time series catch data of many years, and it should be reliable

Author Contributions

U.N. and R.A.: conceptualization, methodology, software and writing—original draft preparation and editing. Y.M. and Y.S.: visualization, investigation and supervision. All authors have read and agreed to the published version of the manuscript.

Funding

The authors also acknowledge the financial support from the China Agriculture Research System of MOF and MARA and programs of development of trading company performance appraisal system based on big data platform (6602421707), Rizhao Donggang Hongqi Phase II Modern Fishery Industrial Park (6602420717) and the high-level talent research startup fund of Qingdao Agricultural University (663/1116710).

Institutional Review Board Statement

Not applicable.

Informed Consent Statement

Not applicable.

Data Availability Statement

Data are not publicly available, though the data may be made available on request from the corresponding author.

Acknowledgments

The first author of this article would like to thank the Chinese Scholarship Council (CSC) for the support of his doctoral degree.

Conflicts of Interest

The authors declare no conflict of interest.

References

  1. FAO. The State of World Fisheries and Aquaculture (SOFIA) 2018: Meeting the Sustainable Development Goals. Available online: https://www.fao.org/state-of-fisheries-aquaculture/2018/en (accessed on 10 January 2021).
  2. Pauly, D.; Zeller, D. Catch reconstructions reveal that global marine fisheries catches are higher than reported and declining. Nat. Commun. 2016, 7, 10244. [Google Scholar] [CrossRef]
  3. Pauly, D.; Zeller, D. Agreeing with FAO: Comments on SOFIA 2018. Mar. Policy 2019, 100, 332–333. [Google Scholar] [CrossRef]
  4. FAO. The State of World Fisheries and Aquaculture (SOFIA) 2020. Available online: http://www.fao.org/publications/sofia/2020/en/ (accessed on 10 January 2021).
  5. Lam, V.W.Y.; Pauly, D. Status of fisheries in 13 Asian large marine ecosystems. Deep Sea Res. Part II Top. Stud. Oceanogr. 2019, 163, 57–64. [Google Scholar] [CrossRef]
  6. Watson, R.A.; William, W.L.C.; Anticamara, J.A.; Sumaila, R.U.; Zeller, D.; Pauly, D. Global marine yield halved as fishing intensity redoubles. Fish Fish. 2013, 14, 493–503. [Google Scholar] [CrossRef]
  7. Myers, R.A.; Worm, B. Rapid worldwide depletion of predatory fish communities. Nature 2003, 423, 280–283. [Google Scholar] [CrossRef]
  8. Arkhipkin, A.I.; Rodhouse, P.G.; Pierce, G.J.; Sauer, W.; Sakai, M.; Allcock, L.; Arguelles, J.; Bower, J.R.; Castillo, G.; Ceriola, L.; et al. World squid fisheries. Rev. Fish. Sci. Aquac. 2015, 23, 92–252. [Google Scholar] [CrossRef] [Green Version]
  9. Southeast Asian State of Fisheries and Aquaculture (SEASOFIA) 2017. Available online: http://www.seafdec.org/documents/2017/03/49cm (accessed on 8 March 2021).
  10. IUCN Red List of Threatened Species. 2011. Version 2011.1. Available online: http://www.iucnredlist.org (accessed on 15 April 2021).
  11. FAO. Indian Ocean Tuna Commission (IOTC). 2020. Available online: https://www.iotc.org/science (accessed on 3 March 2021).
  12. Brunel, T.; Coelho, R.; Merino, G.; Ortiz de Urbina, J.; Rosa, D.; Santos, C.; Macias, D. A Preliminary Stock Assessment for the Shortfin Mako Shark in the Indian Ocean Using Data Limited Approaches. 2018. Available online: http://www.iotc.org (accessed on 28 December 2020).
  13. Kang, J.S. Analysis on the development trends of capture fisheries in North-East Asia and the policy and management implications for regional cooperation. Ocean Coast. Manag. 2006, 49, 42–67. [Google Scholar] [CrossRef]
  14. Asada, Y. License limitation regulations: The Japanese system. J. Fish. Board Can. 1973, 30, 2085–2095. [Google Scholar] [CrossRef]
  15. Lee, K.N.; Gates, J.M.; Lee, J.B. Recent developments in Korean fisheries management. Ocean Coast. Manag. 2006, 49, 355–366. [Google Scholar]
  16. Shen, G.; Heino, M. An overview of marine fisheries management in China. Mar. Policy 2014, 44, 265–272. [Google Scholar] [CrossRef] [Green Version]
  17. Melnychuk, M.C.; Peterson, E.; Elliott, M.; Hilborn, R. Fisheries management impacts on target species status. Proc. Natl. Acad. Sci. USA 2017, 114, 178–183. [Google Scholar] [CrossRef] [PubMed] [Green Version]
  18. Ludwig, D.; Hilborn, R.; Walters, C. Uncertainty, resource exploitation, and conservation: Lessons from history. Ecol. Appl. 1993, 3, 548–549. [Google Scholar] [CrossRef]
  19. Schaefer, M.B. Some aspects of the dynamics of populations important to the management of the commercial marine fisheries. Int. Am. Trop. Tuna Comm. Bull. 1954, 1, 23–56. [Google Scholar]
  20. Martell, S.; Froese, R. A simple method for estimating MSY from catch and resilience. Fish Fish. 2013, 14, 505–514. [Google Scholar] [CrossRef]
  21. Cope, J.; Punt, A.E. Length-based reference points for data-limited situations: Applications and restrictions. Mar. Coast. Fish. 2009, 1, 169–186. [Google Scholar] [CrossRef]
  22. MacCall, A.D. Depletion-corrected average catch: A simple formula for estimating sustainable yields in data-poor situations. ICES J. Mar. Sci. 2009, 66, 2267–2271. [Google Scholar] [CrossRef]
  23. Dick, E.J.; MacCall, A.D. Depletion-based stock reduction analysis: A catch-based method for determining sustainable yields for data-poor fish stocks. Fish. Res. 2011, 110, 331–341. [Google Scholar] [CrossRef]
  24. Rosenberg, A.A.; Fogarty, M.J.; Cooper, A.B.; Dickey-Collas, M.; Fulton, E.A.; Gutiérrez, N.L.; Hyde, K.J.; Kleisner, K.M.; Kristiansen, T.; Longo, C.; et al. Developing New Approaches to Global Stock Status Assessment and Fishery Production Potential of the Seas; FAO Fisheries and Aquaculture Circular No. 1086 FIRF/C1086; FAO: Rome, Italy, 2014. [Google Scholar]
  25. Froese, R.; Demirel, N.; Coro, G.; Kleisner, K.M.; Winker, H. Estimating fisheries reference points from catch and resilience. Fish Fish. 2017, 18, 506–526. [Google Scholar] [CrossRef] [Green Version]
  26. Thorson, J.T.; Ono, K.; Munch, S.B. A Bayesian approach to identifying and compensating for model misspecification in population models. Ecology 2014, 95, 329–341. [Google Scholar] [CrossRef] [Green Version]
  27. Plummer, M. JAGS: A program for analysis of Bayesian graphical models using Gibbs sampling. In Proceedings of the 3rd International Workshop on Distributed Statistical Computing (DSC 2003), Vienna, Austria, 20–22 March 2003; Vienna Technical University: Vienna, Austria, 2003. [Google Scholar]
  28. Beverton, R.J.H.; Holt, S.J. On the Dynamics of Exploited Fish Populations; Great Britain Ministry of Agriculture, Fisheries and Food: London, UK, 1957.
  29. Fishbase. Available online: http://www.fishbase.org (accessed on 5 January 2021).
  30. SeaLifeBase. Available online: http://www.sealifebase.org (accessed on 17 January 2021).
  31. McAllister, M.K.; Pikitch, E.K.; Babcock, E.A. Using demographic methods to construct Bayesian priors for the intrinsic rate of increase in the Schaefer model and implications for stock rebuilding. Can. J. Fish. Aquat. Sci. 2001, 58, 1871–1890. [Google Scholar] [CrossRef]
  32. Pauly, D.; Christensen, V.; Guénette, S.; Pitcher, T.J.; Sumaila, U.R.; Walters, C.J.; Watson, R.; Zeller, D. Towards sustainability in world fisheries. Nature 2002, 418, 689–695. [Google Scholar] [CrossRef] [PubMed]
  33. Tian, Y. Interannual–interdecadal variations of spear squid Loligo bleekeri abundance in the southwestern Japan Sea during 1975–2006: Impact of the trawl fishing and recommendations for management under the different climate regimes. Fish. Res. 2009, 100, 78–85. [Google Scholar] [CrossRef]
  34. FAO. The State of World Fisheries and Aquaculture (SOFIA) 2016. Available online: http://www.fao.org/documents/card/en/c/2c8bcf47-2214-4aeb-95b0-62ddef8a982a/7 (accessed on 17 February 2021).
  35. Palomares, M.L.D.; Froese, R.; Derrick, B.; Nöel, S.-L.; Tsui, G.; Woroniak, J.; Pauly, D. A preliminary global assessment of the status of exploited marine fish and invertebrate populations. In A Report Prepared by the Sea around Us for OCEANA; OCEANA: Washington, DC, USA, 2018; p. 60. [Google Scholar]
  36. Froese, R.; Pauly, D. Fishbase. Wide Web Electronic Publication. 2015. Available online: http://www.fishbase.org (accessed on 18 January 2021).
  37. Pauly, D. Major trends in small-scale marine fisheries, with emphasis on developing countries, and some implications for the social sciences. Mar. Stud. 2006, 4, 7–22. [Google Scholar]
  38. Harley, S.; Nick, D.; Hampton, J.; McKechnie, S. Stock Assessment of Bigeye Tuna in the Western and Central Pacific Ocean. In Proceedings of the Scientific Committee Tenth Regular Session, Majuro, Marshall Islands, 6–14 August 2014. WCPFC-SC10-2014/SAWP-01. [Google Scholar]
  39. Harley, S.; Williams, P.; Nicol, S.; Hampton, J. The Western and Central Pacific Tuna fishery: 2010 Overview and Status of stocks; Tuna Fisheries Assessment Report No. 11; Secretariat of the Pacific Community: Noumea, New Caledonia, 2011; Volume 37. [Google Scholar]
  40. Costello, C.; Ovando, D.; Hilborn, R.; Gaines, S.D.; Deschenes, O.; Lester, S.E. Status and solutions for the world’s unassessed fisheries. Science 2012, 338, 517–520. [Google Scholar] [CrossRef] [PubMed] [Green Version]
  41. Costello, C.; Ovando, D. Status, institutions, and prospects for global capture fisheries. Ann. Rev. Environ. Resour. 2019, 44, 177–200. [Google Scholar] [CrossRef]
  42. Hilborn, R.; Walters, C.J. Quantitative fisheries stock assessment: Choice, dynamics and uncertainty. Rev. Fish Biol. Fish. 1992, 2, 177–178. [Google Scholar]
  43. Baset, A.; Liu, Q.; Hanif, M.T.; Liao, B.; Mahmood, A.M.; Mohsin, M. Estimation of Maximum Sustainable Yield Using Production Modeling: A Stock Appraisal of Indian Oil Sardine (Sardinella longiceps) from Pakistani Waters. Pak. J. Zool. 2017, 49, 485–492. [Google Scholar] [CrossRef]
  44. Ji, Y.; Liu, Q.; Liao, B.; Zhang, Q.; Han, Y.N. Estimating biological reference points for Large head hairtail (Trichiurus lepturus) fishery in theYellow Sea and Bohai Sea. Acta Oceanol. Sin. 2019, 38, 20–26. [Google Scholar] [CrossRef]
  45. Khatun, M.H.; Lupa, S.T.; Rahman, M.F.; Barman, P.P.; Liu, Q. Evaluation of Labeo calbasu Fishery Status Using Surplus Production Models in Kaptai Reservoir, Bangladesh. Appl. Ecol. Environ. Res. 2019, 17, 2519–2532. [Google Scholar] [CrossRef]
  46. Gattuso, J.P.; Magnan, A.K.; Bopp, L.; Cheung, W.W.; Duarte, C.M.; Hinkel, J.; Mcleod, E.; Micheli, F.; Oschlies, A.; Williamson, P.; et al. Ocean solutions to address climate change and its effects on marine ecosystems. Front. Mar. Sci. 2018, 5, 337. [Google Scholar] [CrossRef] [Green Version]
  47. Sumaila, U.R.; Tai, T.C. End Overfishing and Increase the Resilience of the Ocean to Climate Change. Front. Mar. Sci. 2020, 7, 523. [Google Scholar] [CrossRef]
  48. ICES. Report of the fifth workshop on the development of quantitative assessment methodologies based on life-history traits. In Exploitation Characteristics and Other Relevant Parameters for Data-limited Stocks (WKLIFE V); International Council for the Exploration of the Sea: Lisbon, Portugal, 2015; Volume 56, p. 157. [Google Scholar]
  49. Hoggarth, D.D.; Abeyasekera, S.; Arthur, R.I.; Beddington, J.R.; Burn, R.W.; Halls, A.S.; Kirkwood, G.P.; McAllister, M.; Medley, P.; Mees, C.C.; et al. Stock Assessment for Fishery Management—A Framework Guide to the Stock Assessment Tools of the Fisheries Management Science Programme; FAO Fisheries Technical Paper 487; FAO: Rome, Italy, 2006. [Google Scholar]
  50. Dan, F. Assessment of Indian Ocean Longtail Tuna (Thunnus tonggol) Using Data-Limited Methods. 2020. Available online: http://www.iotc.org/longtailtuna.en (accessed on 27 July 2021).
  51. Dan, F. Assessment of Indian Ocean Kawakawa (Euthynnus affinis) Using Data-Limited Methods. 2020. Available online: http://www.iotc.org/kawakawa.en (accessed on 27 July 2021).
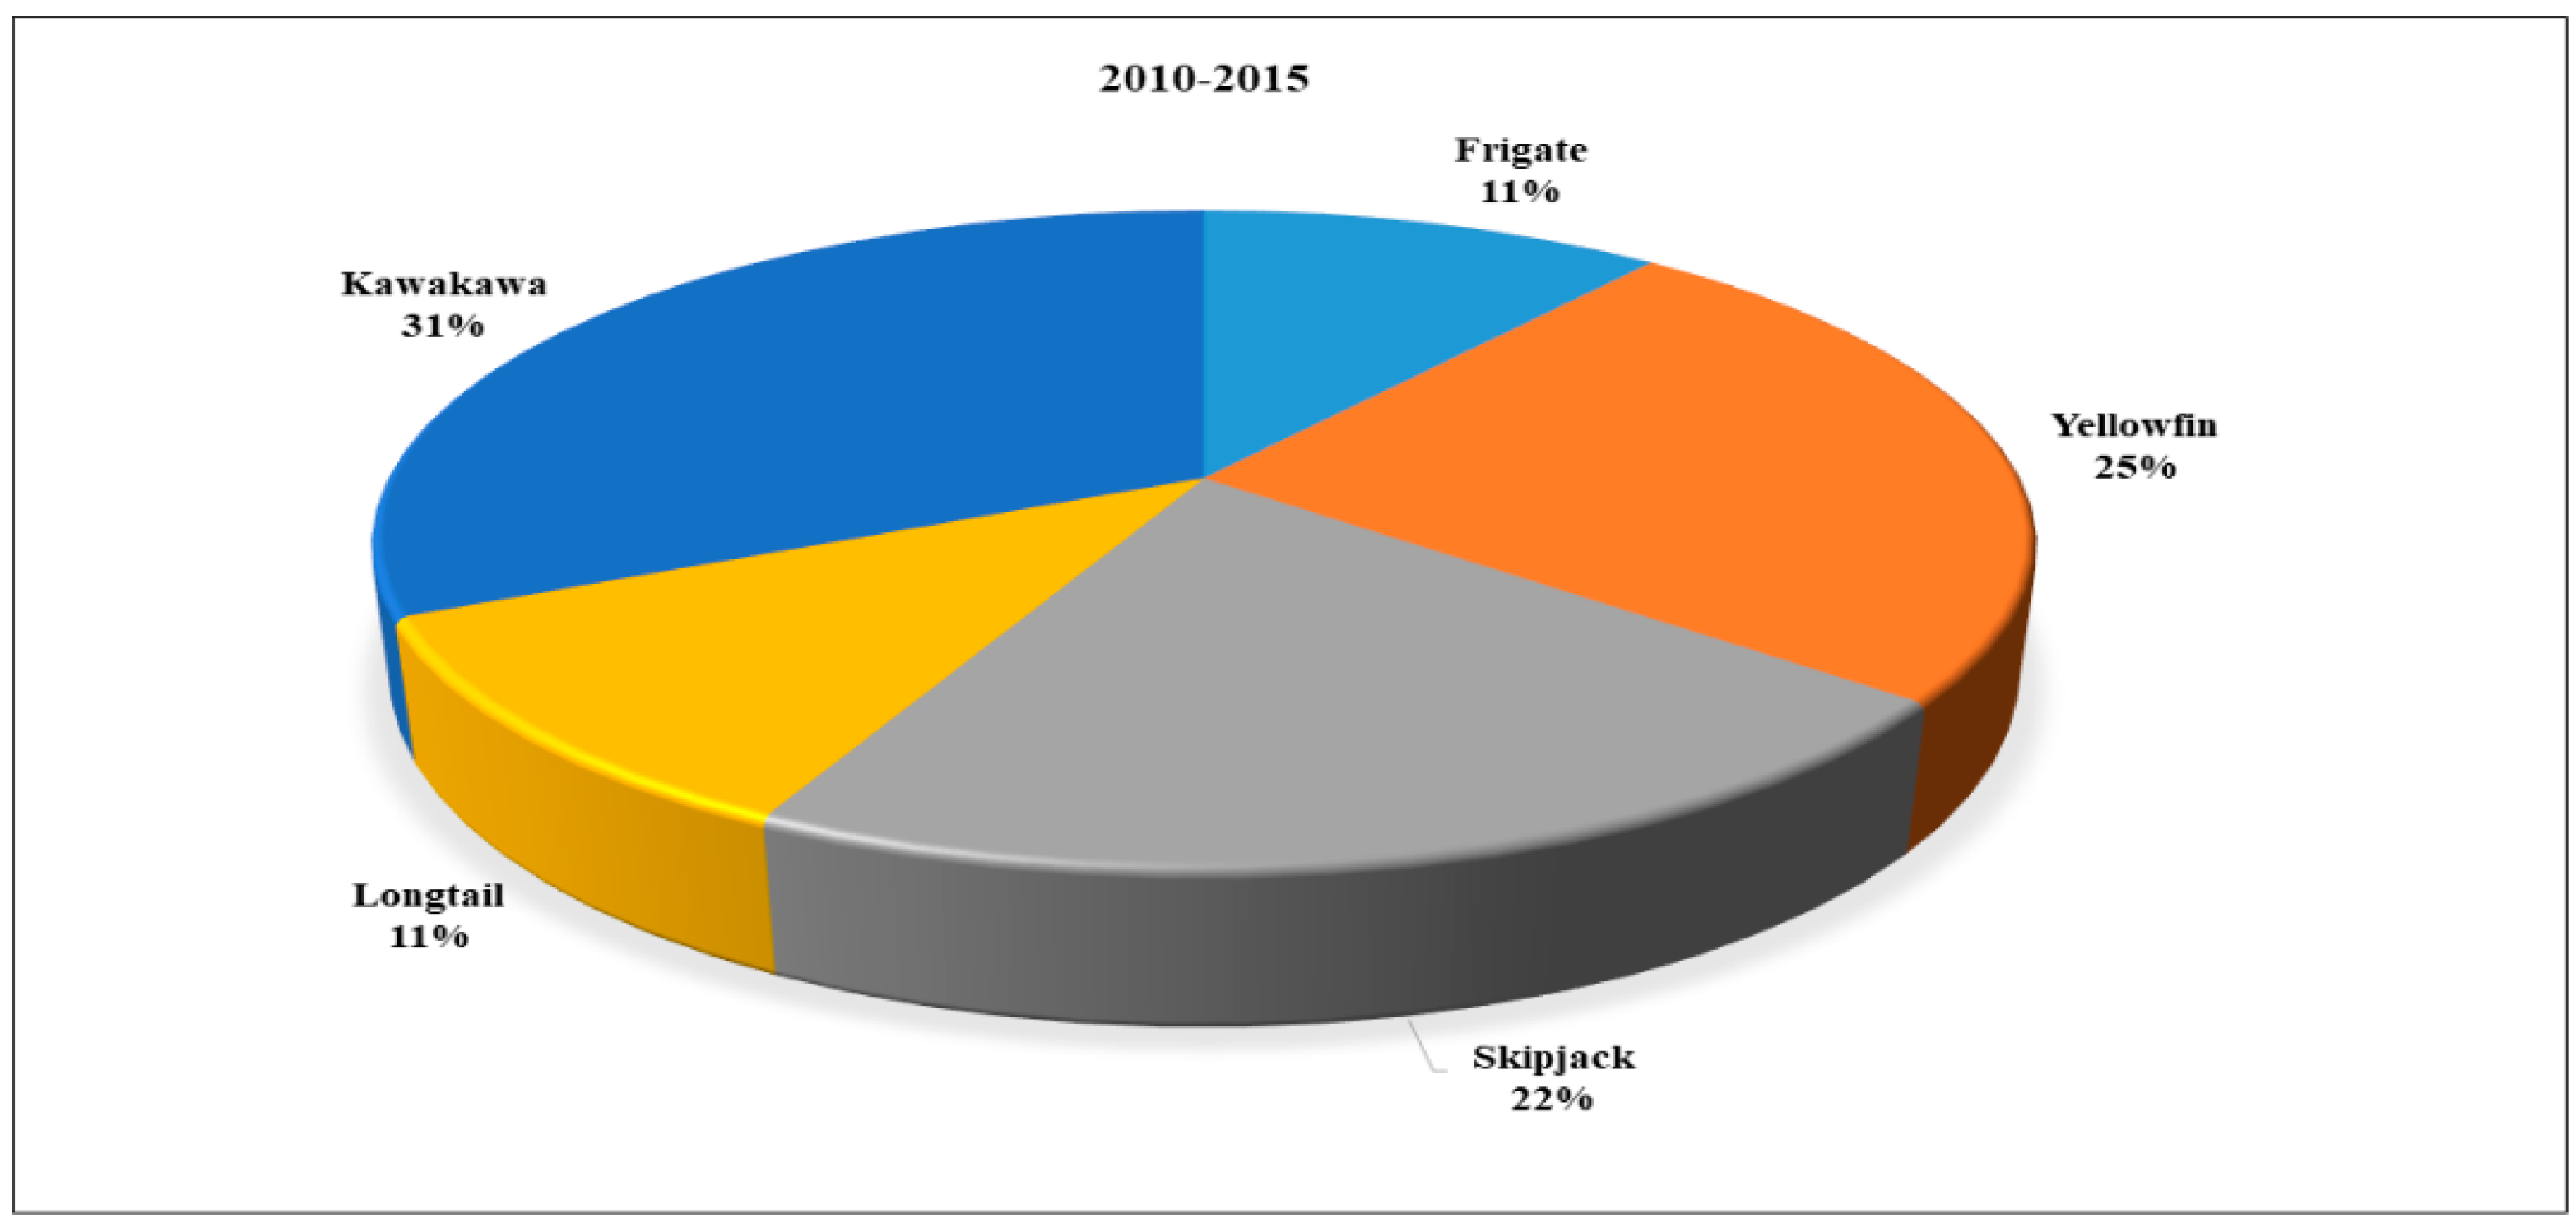
Figure 1. Species-wise contribution of tuna catch in Indian Ocean from 2010 to 2015.
Sustainability 13 08868 g001
Figure 2. Viable r–K pairs of longtail tuna (Thunnus tonggol) in Eastern Indian Ocean (EIO) (A) and longtail tuna (Thunnus tonggol) in Western Indian Ocean (WIO) (B) obtained from the CMSY (gray) and the BSM (black) methods. The most reliable r–K pair and its approximate 95% confidence limits are indicated by a black cross for the CMSY method (A,B); for the BSM method, the corresponding cross is gray (B).
Sustainability 13 08868 g002
Figure 3. Estimated biomass and the development of relative biomass of 5 stocks assessed in Eastern Indian Ocean (AE in BSM and CMSY). Estimated biomass trajectories (left panels) (bold dashed line) and catch (bold solid line), with the 95% confidence limits (dashed lines) and vertical lines representing the prior biomass ranges. The trajectories of relative total biomass (B/BMSY) are shown (right panel), with the gray areas indicating uncertainty.
Sustainability 13 08868 g003
Figure 4. Estimated biomass and the development of relative biomass of 5 stocks assessed in Western Indian Ocean (AE in BSM and CMSY). Estimated biomass trajectories (left panels) (bold dashed line) and catch (bold solid line), with the 95% confidence limits (dashed lines) and vertical lines representing the prior biomass ranges. The trajectories of relative total biomass (B/BMSY) are shown (right panel), with the gray areas indicating uncertainty.
Sustainability 13 08868 g004
Table 1. Summary of catch and effort data of 5 major tuna stocks in the Indian Ocean region under assessment.
SpeciesRegionHabitatExploited CountryData YearReference
CatchEffort
Auxis thazard
(Frigate tuna)
Eastern Indian OceanPelagic-neriticIndia1990–20151990–2015Catch on FishstatJ [1] Effort on [12]
Western Indian OceanPelagic-neriticIndia1990–20151990–2015Catch on FishstatJ [1] Effort on [12]
Thunnus albacares
(Yellowfin tuna)
Eastern Indian OceanPelagic-ceanicIndia1990–20151990–2015Catch on FishstatJ [1] Effort on [12]
Western Indian OceanPelagic-ceanicIndia1990–20151990–2015Catch on FishstatJ [1] Effort on [12]
Katsuwonus pelamis
(Skipjack tuna)
Eastern Indian OceanPelagic-ceanicIndia1990–20151990–2015Catch on FishstatJ [1] Effort on [12]
Western Indian OceanPelagic-ceanicIndia1990–20151990–2015Catch on FishstatJ [1] Effort on [12]
Thunnus tonggol
(Longtail tuna)
Eastern Indian OceanPelagic-neriticIndia1990–20151990–2015Catch on FishstatJ [1] Effort on [12]
Western Indian OceanPelagic-neriticIndia1990–20151990–2015Catch on FishstatJ [1] Effort on [12]
Euthynnus affinis
(Kawakawa)
Eastern Indian OceanPelagic-neriticIndia1990–20151990–2015Catch on FishstatJ [1] Effort on [12]
Western Indian OceanPelagic-neriticIndia1990–20151990–2015Catch on FishstatJ [1] Effort on [12]
Table 2. Suggested resilience categories translated into range of rate of population increase (r) as provided in FishBase [29] and SeaLifeBase [30] of stocks under assessment.
Resilience Categoryr RangeStock
High 0.6–1.5None
Medium 0.2–0.8A. thazard, T. albacares, K. pelamis, E. affinis
Low 0.05–0.5T. tonggol
Very low 0.015–0.1None
Table 3. Default range of biomass relative to k at the start (B start/k) and the end (B end/k) of the time series of stocks under assessment.
Prior BiomassB/kStockStock
Eastern Indian OceanWestern Indian Ocean
Bstart/k Bend/k Bstart/k Bend/k
Low 0.01–0.4NoneA. thazard, K. pelamisNoneT. tonggol
0.01–0.2NoneNoneNoneNone
Medium 0.2–0.6A. thazard, T. albacares, K. pelamis, T. tonggol, E. affinisNoneA. thazard, T. albacares, K. pelamis, T. tonggol, E. affinisA. thazard
High 0.5–0.9NoneT. albacares, T. tonggol, E. affinisNoneT. albacares, K. pelamis, E. affinis
0.8–1.0NoneNoneNoneNone
Very high 0.9–1.0NoneNoneNoneNone
Table 4. Stock status categories corresponding to the range of B/BMSY of stocks under assessment.
Stock StatusB/BMSY
Healthy ≥1.0
Overfished 0.5–1.0
Strongly overfished 0.2–0.5
Collapsed 0.0–0.2
Table 5. Summary of r, k, MSY, Bend/k and B/BMSY, with confidence limits (in brackets) estimated by the CMSY and the BSM methods for the 5 stocks of tuna species in the Eastern Indian Ocean.
STOCKrk (103 t)MSY (103 YEAR−1)B/BMSY
A. thazard0.872 (0.656–1.16)19.2 (14.9–24.6)4.17 (3.88–4.48)0.557 (0.362–0.879)
T. albacares0.644 (0.445–0.932)42.8 (33.1–55.3)6.89 (5.49–8.65)0.822 (0.659–1.15)
K. pelamis0.563 (0.399–0.793)14 (11.8–16.6)1.97 (1.57–2.48)0.634 (0.532–0.741)
T. tonggol0.304 (0.216–0.428)86.2 (63–118)6.56 (5.21–8.25)0.814 (0.649–1.16)
E. affinis0.592 (0.421–0.833)46.1 (34.5–61.5)6.82 (5.79–8.03)0.83 (0.665–1.18)
Table 6. Summary of r, k, MSY, Bend/k and B/BMSY, with confidence limits (in brackets) estimated by the CMSY and the BSM methods for the 5 stocks of tuna species in the western Indian Ocean.
STOCK rk (103 t)MSY (103 YEAR−1)B/BMSY
A. thazard0.886 (0.676–1.16)35.1 (27.6–44.6)7.77 (7.24–8.34)0.572 (0.377–1.07)
T. albacares0.634 (0.434–0.928)79 (60.9–102)12.5 (9.88–15.9)0.823 (0.66–1.16)
K. pelamis0.639 (0.45–0.907)97.4 (74.1–128)15.6 (12.7–19)0.843 (0.667–1.2)
T. tonggol0.326 (0.224–0.473)6.35 (5.02–8.03)0.517 (0.402–0.665)0.448 (0.307–0.781)
E. affinis0.611 (0.436–0.855)133 (99.1–178)20.3 (17.5–23.5)0.836 (0.662–1.19)
Table 7. Results of CMSY and BSM analyses of 5 stocks with catch time series and CPUE available (confidence limits in brackets) in the Eastern Indian Ocean.
StockResult of CMSY AnalysisResult of BSM Analysis
rk (103 t)MSY (103 year−1)rk (103 t)MSY (103 year−1)
A. thazard0.689
(0.566–0.839)
23.7
(18.5–30.2)
4.07
(3.7–4.48)
0.872
(0.656–1.16)
19.2
(14.9–24.6)
4.17
(3.88–4.48)
T. albacares0.689
(0.566–0.839)
63.4
(38.6–104)
10.9
(6.07–19.6)
0.644
(0.445–0.932)
42.8
(33.1–55.3)
6.89
(5.49–8.65)
K. pelami0.689
(0.566–0.839)
11.4
(8.24–15.9)
1.97
(1.52–2.55)
0.563
(0.399–0.793)
14
(11.8–16.6)
1.97
(1.57–2.48)
T. tonggol0.356
(0.275–0.462)
77.5
(61.4–97.9)
6.9
(6.08–7.84)
0.304
(0.216–0.428)
86.2
(63–118)
6.56
(5.21–8.25)
E. affinis0.689
(0.566–0.839)
40.6
(31.2–52.8)
6.99
(6.14–7.97)
0.592
(0.421–0.833)
46.1
(34.5–61.5)
6.82
(5.79–8.03)
Table 8. Results of CMSY and BSM analyses of 5 stocks with catch time series and CPUE available (confidence limits in brackets) in the Western Indian Ocean.
StockResult of CMSY AnalysisResult of BSM Analysis
rk (103 t)MSY (103 year−1)rk (103 t)MSY (103 year−1)
A. thazard0.689
(0.566–0.839)
46.4
(35.4–60.9)
8
(6.91–9.25)
0.886
(0.676–1.16)
35.1
(27.6–44.6)
7.77
(7.24–8.34)
T. albacares0.689
(0.566–0.839)
115
(69.4–190)
19.8
(10.8–36.1)
0.634
(0.434–928)
79
(60.9–102)
12.5
(9.88–15.9)
K. pelamis0.689
(0.566–0.839)
132
(82.5–212)
22.8
(13.3–39.1)
0.639
(0.45–0.907)
97.4
(74.1–128)
15.6
(12.7–19)
T. tonggol0.396
(0.323–0.484)
5.95
(4.14–8.55)
0.588
(0.429–806)
0.326
(0.224–0.473)
6.35
(5.02–8.03)
0.517
(0.402–0.665)
E. affinis0.689
(0.566–0.839)
122
(89.8–165)
21
(17–25.9)
0.611
(0.436–0.855)
133
(99.1–178)
20.3
(17.5–23.5)
Publisher’s Note: MDPI stays neutral with regard to jurisdictional claims in published maps and institutional affiliations.