Article

An Intelligent and Autonomous Sight Distance Evaluation Framework for Sustainable Transportation

1
Independent Researcher, Meerut 250002, India
2
Department of Computer Science and Engineering, Lovely Professional University, Phagwara 144411, India
3
Faculty of Computing and Information Technology, King Abdulaziz University, Jeddah 37848, Saudi Arabia
4
Chitkara University Institute of Engineering and Technology, Chitkara University, Rajpura 144411, India
5
Faculty of Applied Computing and Technology, Noroff University College, 4608 Kristiansand, Norway
*
Authors to whom correspondence should be addressed.
Sustainability 2021, 13(16), 8885; https://doi.org/10.3390/su13168885
Submission received: 11 June 2021 / Revised: 25 July 2021 / Accepted: 27 July 2021 / Published: 9 August 2021

Abstract

:
Railways are facing a serious problem of road vehicle–train collisions at unmanned railway level crossings. The purpose of the study is the development of a safe stopping sight distance and sight distance from road to rail track model with appropriate computation and analysis. The scope of the study lies in avoiding road vehicle–train collisions at unmanned railway level crossings. An intelligent and autonomous framework is being developed using supervised machine learning regression algorithms. Further, a sight distance from road to rail track model is being developed for road vehicles of 0.5 to 10 m length using the observed geometric characteristics of the route. The model prediction accuracy obtained better results in the development of a stopping sight distance model in comparison to other intelligent algorithms. The developed model suggested an increment of approximately 23% in the current safe stopping sight distance on all unmanned railway level crossings. Further, the feature analysis indicates the ‘approach road gradient’ to be the major contributing parameter for safe stopping sight distance determination. The accident prediction study finally indicates that, as the safe stopping sight distance is increased by following the developed model, it is predicted to decrease road vehicle–train collisions.

1. Introduction

Railways are the biggest platform for the transportation of goods and people to different places. With sensors/actuators application under European Telecommunications Standards Institute (ETSI) standards of Intelligent Transportation System (ITS) hierarchical architecture [1,2], vehicle safety may become an easy task across the world. In the coming years, the railways may have the ability to predict maintenance and planning automatically [3]. A major component of the railway travel scenario is the approach of level crossings, where the railway line and road driver intersect each other at the same level. According to [4], “The compensation given to the families of the persons who were killed at unmanned railway was Rs 10.88 lakh, Rs 2.22 lakh and Rs 17.41 lakhs in years 2012-13, 2011-12 and 2010-11, respectively”. When the road user approaches an unmanned railway level crossing, road vehicles must be able to realize that there is an unmanned level crossing in the vicinity. At these crossings, there is an unavailability of any gatekeeper, which tends to increase the chances of accidents [5]. Road vehicle accidents occur majorly due to incorrect defensive driving action. The road driver tries to reduce the speed of the vehicle and it is needed to be stopped at a particular threshold distance, known as the stopping sight distance [6]; further, when there is no train available within a particular distance, i.e., sight distance from road to track. In this condition, road users stopped near the crossing easily traverse the unmanned railway level crossing. The Present Serviceability Rating (PSR), as per the American Association of State Highway and Transportation Officials (AASHTO), is a rating of pavement defect visual inspection on a scale of 0–5, or Very Poor, Poor, Fair, Good, and Very Good. At unmanned railway level crossings, the road drivers approaching the unmanned railway level crossing face different situations, which lie in three different zones. Firstly, the area in which a road driver, when approaching the unmanned railway level crossing, observes that there is an unmanned railway level crossing ahead. The road driver scans the unmanned railway level crossing to determine whether or not there is a train ahead at the crossing. Thereafter, the road driver decides upon the action to continue ahead or not. In another situation in which the road vehicle approaches the unmanned railway level crossing, the road vehicle must be able to realize that there is a crossing in the vicinity. The road vehicle needs to be stopped at a particular safe distance known as the stopping sight distance (SSD) to avoid hitting an unidentified road object [7]. The particular spot where the road driver decides to halt before the crossing is called the non-recovery zone. Finally, in the highest risk zone, where the road driver is over the rail tracks, there is a risk of the train approaching the unmanned railway level crossing, i.e., uncertain risky crossings [8,9]. The road driver tries to cross the hazard zone very quickly to get into the right of way [10], avoiding road vehicle–train collisions at unmanned railway level crossings [11,12,13,14].
The study makes a major contribution to the study of the development of new road vehicle–train sight distances assessment framework for unmanned railway level crossings using machine learning algorithms. The communication has two major characteristics of low delay and high reliability of communication [15]. Therefore, new developing systems focus on better measures of efficiency [16]. The main contributions of this manuscript are summarized below:
  • We collected the data viz. unmanned level crossing location, pavement condition, traffic volume, road width, visibility, speed of road vehicles, perception and reaction time, approach road gradient, distance of speed breaker distance from crossing, friction, number of lanes, environment, construction, width of rail gauge, length of the road vehicle, and accident statistics from unmanned railway level crossings.
  • We determined a safe stopping sight distance model for unmanned railway level crossings in the study area using supervised machine learning regression algorithms in the Python programming language.
  • A sight distance equation was developed from a road to rail track model for unmanned railway level crossings, and prediction accuracy analysis of different machine learning algorithms was performed for the development of the SSD model.
  • Analysis of relevant features for judging the major contributing parameter for safe stopping sight distance was carried out.
  • We also performed the sensitivity analysis of the SSD model for parameters such as road width, visibility, speed of road vehicles, perception and reaction time, approach road gradient, and speed breaker distance from crossing to perform accident prediction analysis of the new SSD model.
The paper is organized into five sections. Section 2 reviews the studies carried out in the past related to the work. Section 3 talks about the materials and methods, and is organized into three subsections—data collection, modeling, and validation. Section 4 presents the results and discussion of the proposed work. The last section discusses the conclusions regarding future work for the proposed study.

2. Related Work

This section discusses the existing studies of road vehicle–train sight distances assessment techniques for unmanned railway level crossings, developed over the world. The study conducted by Schoppert and Hoyt [17] developed an associative connection between lateral sight distance and collision history using the risk homeostasis technique. The disadvantage of the relationship developed is that it does not correctly explain the logically agreed situation. Wigglesworth [18] studied unprotected railway level crossings. The approaching road had a lesser stopping sight distance and road visibility. The road vehicle speeds were observed to be the same as of the trains on days with or without trains. Indian Roads Congress (IRC) manuals, i.e., IRC-73-1980 [19] and IRC-39-1986 [20], suggested the statistical computation of SSD for road vehicles approaching unmanned railway level crossings. The SSD at the unmanned railway level crossings was calculated using the speed of approaching road vehicles, coefficient of longitudinal friction, and perception and breaking reaction time.
SSD = V 2 254 * f + 0.278 * V * t
where, V = speed of approaching road vehicles (km/hr), f = coefficient of longitudinal friction, and t = perception and brake reaction time (secs).
King [21] studied and compared road driver behavior with restricted and unrestricted lateral visibility at dissimilar railway level crossings. The study resulted in more safety with an unrestricted SSD of road drivers. Ward and Wilde [22] studied the effect of increasing lateral sight distance requirements at unprotected railway level crossings. The results prove that increasing the lateral sight distance helped in reducing the risk of accidents. The disadvantage of the method was the increase in search time for the crossing. Johtaja [23] developed a sight distance from the road to track requirement model for American railway level crossings. The sight distance from the road to track was defined as the direct association between the centerline distances of the farthest tracks at level crossings. Gou et al. [24] suggested the required sight distance from the road to track for Canadian railway level crossings. The sight distance from the road to track was defined as the approaching train speed and time needed to cross the railway level crossing. Nizam and MacDonald [25] discussed the Washington State Department of Transportation (WSDOT) design manual about the types of sight distances videlicet (viz.) ahead to the crossing, down the tracks approaching the crossing, the sight triangle, and down the tracks at the crossing. The study defined the sight triangle for the road driver to stop 15” before the railway level crossings as the train approaches the crossings, and described the SSD for the road vehicles by providing crosses called “St. Andrew’s Crosses”. The crosses were provided at sufficient stopping sight distance, which enabled the road vehicle users to see the approaching train easily. Mornell [26] defined the required sight distance from the road to the track for Swedish railway level crossings. The proposed sight distance from track to road was observed to be three times the approaching train speed. The New Zealand Transport Agency [27] proposed the required stopping sight distance from the road to track for New Zealand railway level crossings. The sight distance was based on the geometric design of the New Zealand railway level crossings. A study conducted by Kallberg [28] determined the sight distance requirements for Finnish railway level crossings [29]. The study proposed a safe stopping sight distance as the minimum distance at which a road vehicle user approaching the level crossing must be able to view the rail track at a height of 1.1 m (approx.). The results reveal that the required detection distance at railway level crossings was directly related to the road vehicle speed approaching the unmanned railway level crossing. The study was carried out only for non-skewed crossings. Sever [30] proposed an approach for determining the road visibility length on passively protected level railroad crossings. The study focused on roads with worse conditions and weather conditions near the crossings. The study also suggested that the visibility length at lower speeds of the road vehicles had a comfortable reaction time and shorter visibility. Kumar and Panday [31] studied the road driver sight distance requirements and problems in the detection of approaching trains at railway level crossings. Further, the study investigated the hindrances in the vision of road drivers, i.e., sight distance led to obstructions in visualizing the approaching train at railway level crossings.
Moayedfar [32] studied and calculated the sight triangle dimensions in an unobstructed area of Iranian railway level crossings. Three zones were considered in the study: approach zone, non-recovery zone, and hazard zone. The study suggests that the visibility of the road driver should be clear enough, i.e., it should be free from obstructions such as trees, buildings, fixed or mobile equipment, etc. The various factors used in the sight distance requirements for safety at the railway level crossings involved in the study were length of road vehicle (considered equal to 2 m), stop line distance to side rail (considered equal to 4.5 m), train speed in km/h, road vehicle speed in m/sec, the maximum speed of road vehicle in km/hr (considered equal to 2.7 m/s), the absolute value of the slope based on the percentage, the road friction coefficient of wet pavement, acceleration of road vehicle speed (considered equal to 0.45 m/s2), the sum of observation and reaction time (considered equal to 2 s), the distance at which the road vehicle has maximum speed (considered equal to 8.1 m), and the distance between the road driver’s eyes and front bumper of road vehicle (considered equal to 2.4 m). The study finally suggested that, with a train speed of 120 km/h and a 784 m distance from the crossing, the train driver needs to decrease their speed by 95 km/hr. They determined the stopping sight distance requirements for Iranian railroad crossings by calculating the vehicle stop sight distance. When a road driver entered at a distance of 250 m from an unmanned railway level crossing, the train driver was recommended to lower the train speed to 95 km/h (approx.). The study suggested that both railway track and road should not have horizontal and vertical curves to provide good stopping sight distance. Further, there should be no obstacle in between the railway track and road, so that there is a hindrance in the road vehicle and train drivers’ visibility. The proper sight distance helped in avoiding collisions between the road vehicle and train railway level crossings. Rudin-Brown [33] extended the road approach zone distance to improve the stopping sight distance requirements at Canadian unmanned railway level crossings. The approach distance on unmanned railway level crossings, having cross bucks as the only protection system, was extended to allow the road vehicle driver easy scanning for the train approaching the railway level crossing. The human problems include road driver obstruction in viewing the train, road driver retinal image remaining unchanged, train horn being less audible, road driver tendency to react slowly, late detection of the hazard, distraction due to fatigue, and hazard perception effect in the train detection. Therefore, the road driver approach zone was extended to at least 10 m and hence, the train was easily detected. Thus, the road driver could stop at a comfortable sight distance on unmanned railway level crossings.

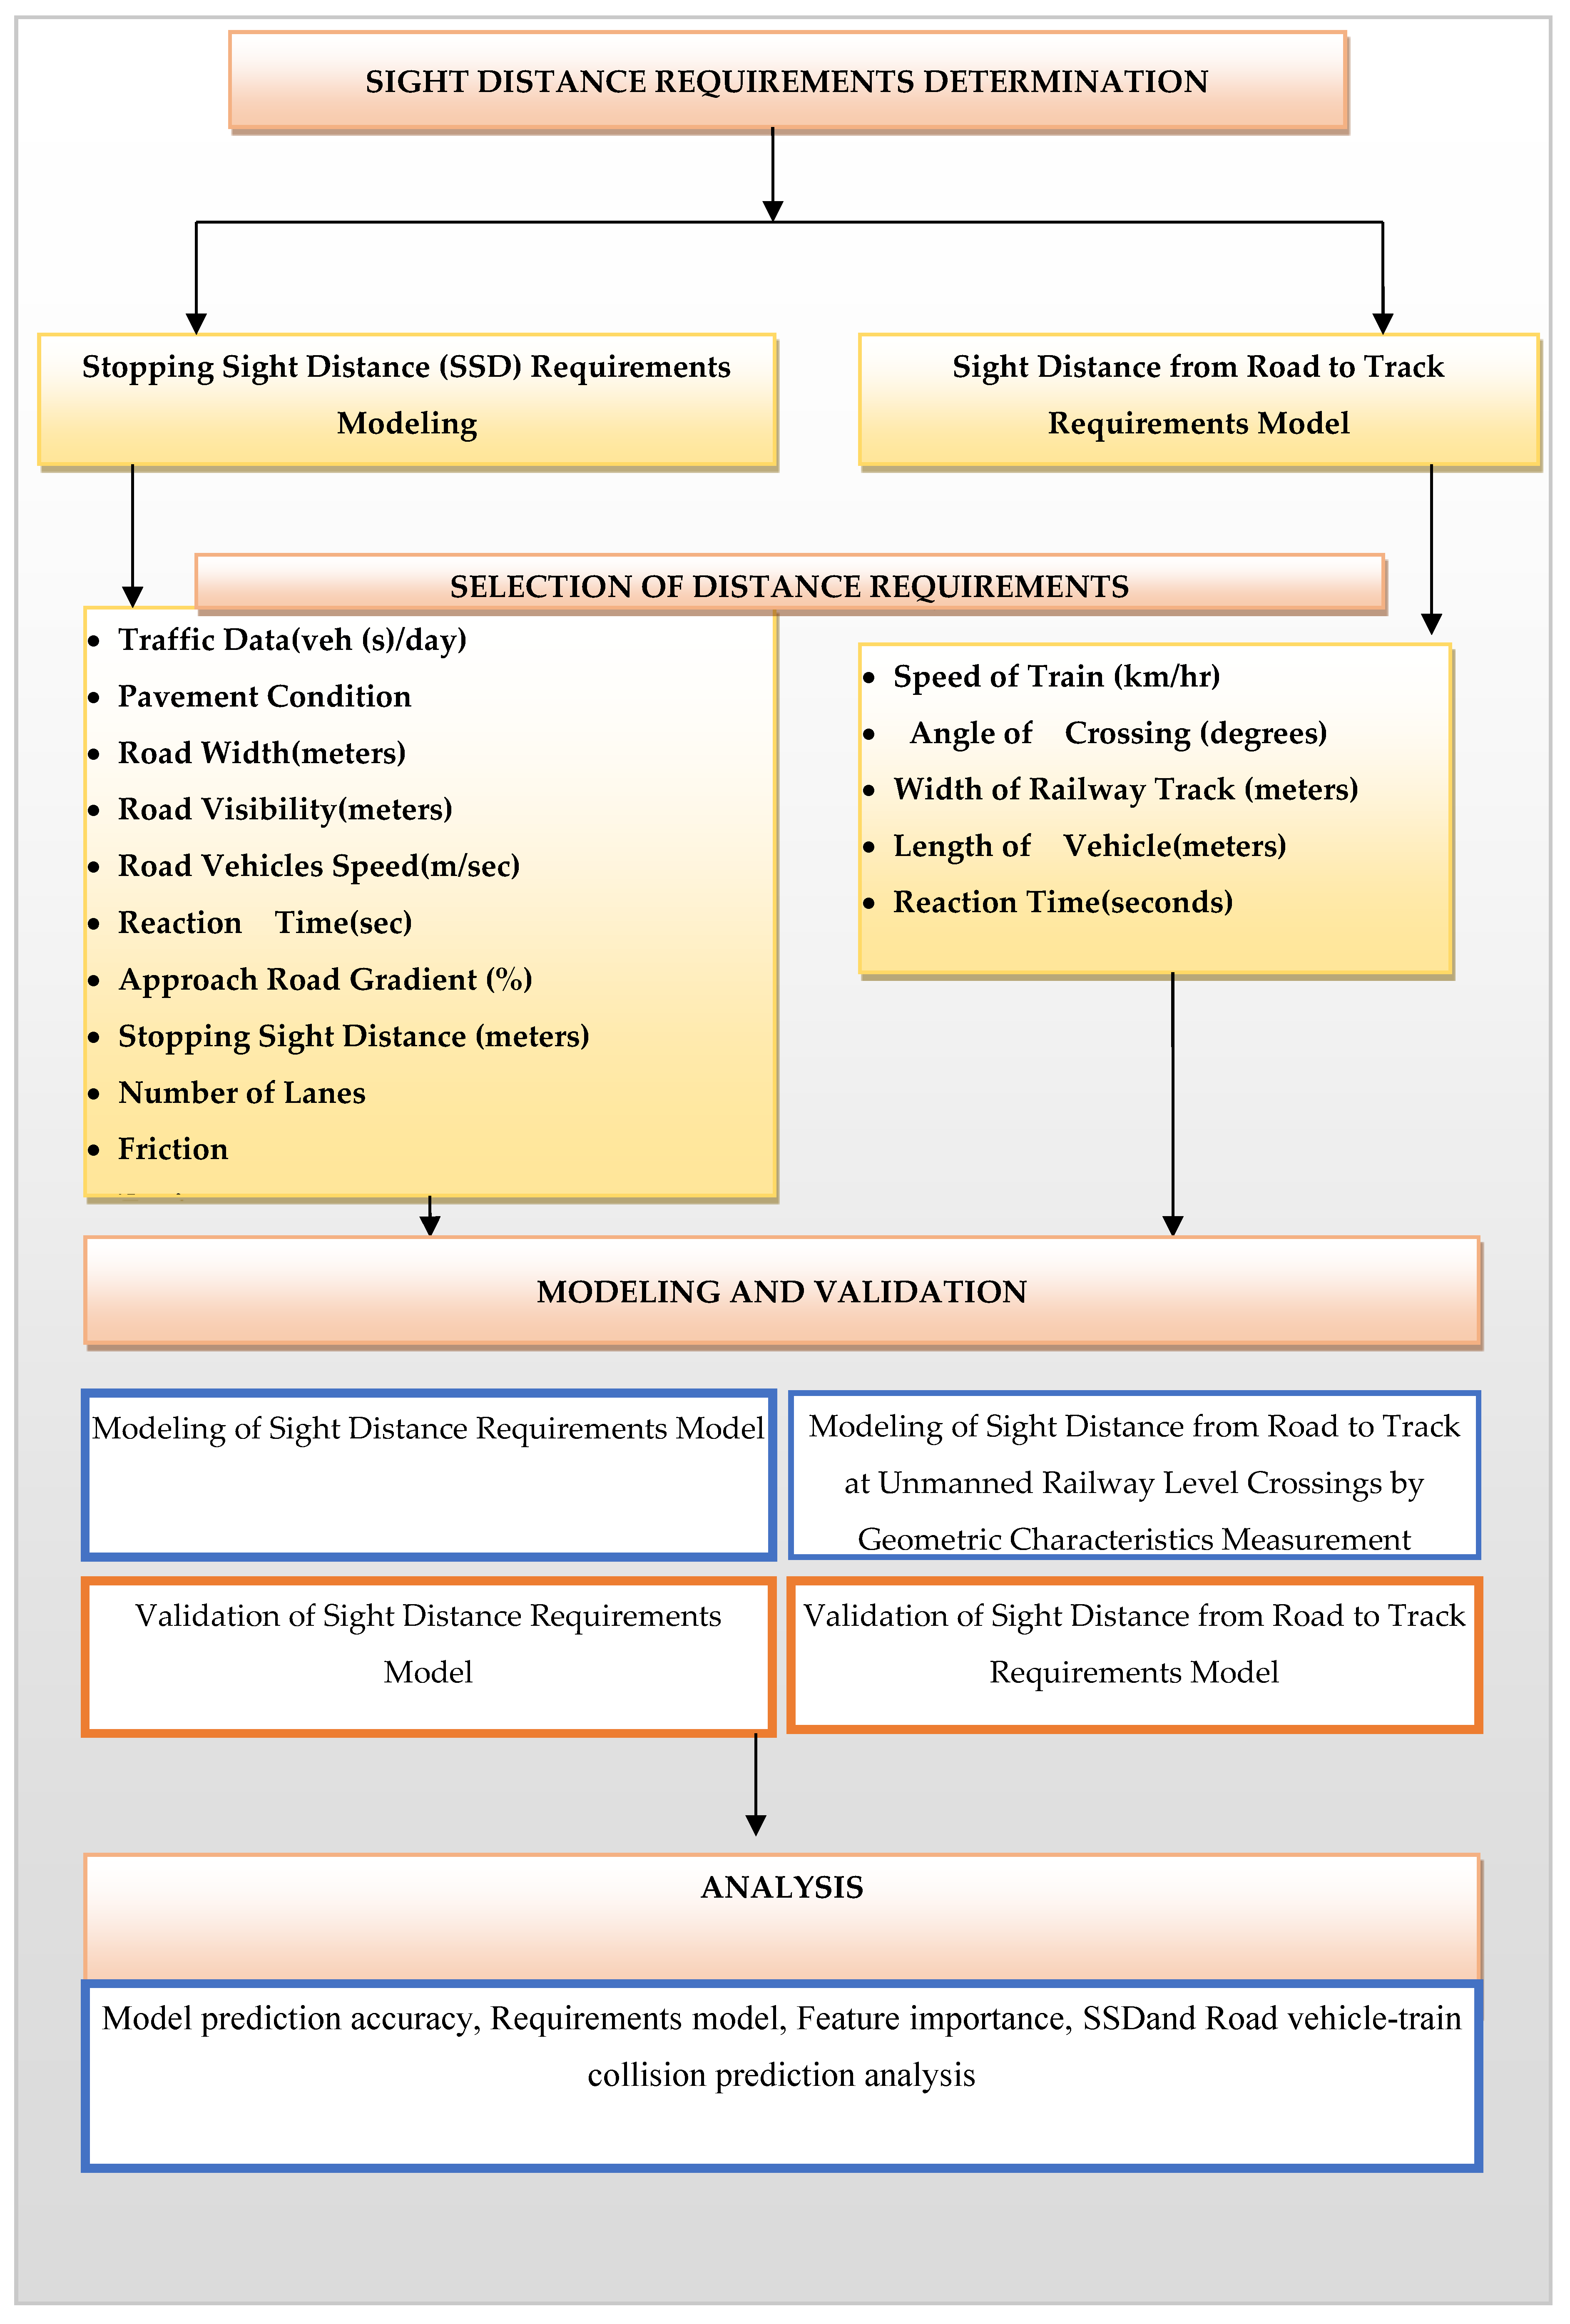
3. Materials and Methods

When the road user approaches the unmanned railway level crossing, it must be able to realize that there is a crossing in the vicinity. The road vehicle needs to be stopped at a particular safe distance from the crossing [5] known as the stopping sight distance. The methodology consists of data collection, modeling, and validation, as shown in Figure 1.

3.1. Data Collection

To achieve the objectives proposed in this study, it was first necessary to select a sufficient number of unmanned railway level crossings for the study. Therefore, 19 unmanned railway level crossings on the Shahdra–Shamli–Tapri (DSA–SMQL–TPZ) railway route were selected as the study route. The criteria for selecting unmanned railway level crossings for study was the total number of accidents from the year 2008 to 2013. The railway route has a chainage of 0 to 150 km, 15 block sections, and 68 unmanned railway level crossings. The locations’ latitude and longitude data characteristics were captured by GPS [34], traffic flow control systems such as traffic volume [35] were captured by a video camera, and speed of road vehicles was captured through a speed radar gun. Other manually collected parameters were approach road gradient, perception and reaction time, width of rail gauge (WT), length of road vehicle (l) and pavement condition, distance of speed breaker from crossing, road width, visibility, number of lanes, construction work, and environment.

3.2. Data Preprocessing

The objective of preprocessing is to create an input feature matrix and observed responses vector. The data feature rescaling was performed using normalization and standardization techniques. The normalization rescaled the real-value data attributes in the range of 0 to 1. Further, data attributes were standardized using the distribution shift of each attribute to zero mean and unit variance. The selection of input features is a major step in building a good model. Therefore, 9 input features were selected, as listed in Table 1. Further, to evaluate the strength of the relationship between two features, correlation analysis was performed. Highly correlated attributes should have a correlation value very close to +1 and less correlated attributes should have a value closer to -1; it is evident from Table 1 that no data parameter is very close to 1. Therefore, all attributes are important and need to be considered for building the SSD model.

3.3. Data Splitting

The data was split for training and testing purposes. In this study, approximately 75% (approx.) of the data were used for training, and the remaining 25% (approx.) were used for validation of the model. The model accuracy may change according to the data split performance.

3.4. Modeling

3.4.1. Safe Stopping Sight Distance Model

The study route was observed to have both rural and undivided roads. At all 19 selected unmanned railway level crossings, speed of road vehicles in km/hr was observed to be approximately less than 29 km/hr. Therefore, by IRC-73-1980 the friction was set as 0.4. The statistical computation was performed by using linear regression analysis [36] with SSD as the dependent variable calculated using Equation (1). The prediction modeling was performed using linear regression analysis with the features traffic data, pavement condition, road width in meters, road vehicles speed in m/sec, reaction time in seconds, approach road gradient (%), number of lanes, friction, environment, and construction. Therefore, the model was developed using twelve independent variables viz. pavement condition rating, average daily traffic in PCU/day, road width in meters, road visibility in meters, speed of road vehicles in km/hr, t in seconds, approach road gradient (%), speed breaker distance from crossing in meters, friction, number of lanes, construction, and environment-dependent variable ‘SSD’ using a regression modeling algorithm in Python, as shown in Table 2. The t-test was conducted for all twelve parameters with ‘SSD’ unmanned railway crossings and checked for p-value < 0.05 and also for standard error (S.E.) closeness to 0. The statistical analysis shows that the six independent variables viz. road width in meters, road visibility in meters, V in km/hr, approach road gradient, t in seconds, and PSR in meters, are significant.
Therefore, a new model was developed for ‘SSD’ using six significant parameters, as shown in Equation (2):
  SSD new = 0.174   PSR   0.558   RW 0.009   RV + 0.931   V + 4.967   t 45.460   ARG  
where PSR = present serviceability rating (0 to 5), RV = road visibility (meters), V = speed of road vehicles (km/h), and ARG = approach road gradient (%).
The SSD new model concludes that SSD values are incremented by 0.35% from the standard IRC SSD Equation (1). Table 3 shows the unmanned railway level crossing categorization ‘i’ = (1,2,3,4) based on ARG and average SSD observed values at 19 unmanned crossings on the Shahdra–Shamli–Tapri railway route. The minimum observed ARG was 0.0% and the maximum ARG observed was 3.33%. The minimum observed ti was 1.3 s and the maximum observed ti was 4.2 s. Table 3 also shows the SSD calculated as per IRC and the new SSD calculated. S.E. must be close to zero and R2 must be closer to 1, and in Equation (2), S.E. = 1.509, and R2 is 0.990 (closer to 1).

3.4.2. Sight Distance from Road to Track Modeling

To develop the sight distance from road to track model, the parameters viz. speed of the train in km/hr, angle of crossing in degrees, track width in meters, length of the vehicle in meters, and reaction time in seconds, were selected. In accordance with the unmanned railway level crossing category ‘i’ of Table 3, S L based on the geometric characteristics of the crossings is shown in Equation (3):
  S L ( i ) = 0.01   V t * ( l + SSD + W T 2 * sin Z Vi + t i )
where S L ( i ) = required sight distances from road to track at unmanned level crossing category ‘i’ in meters, V t = speed of train in km/hr, Z = angle of crossing in degrees, and W T = track width in meters.
Therefore, S L ( i ) , as calculated from Equation (3) and presented in Figure 2 with Z = 45 ° to 90 ° for l = 0.5 to 10 m, is shown in Table 4. It shows S L ( i ) calculated from Equation (3) for an unmanned level crossing with Z = 45 ° and 90 ° .

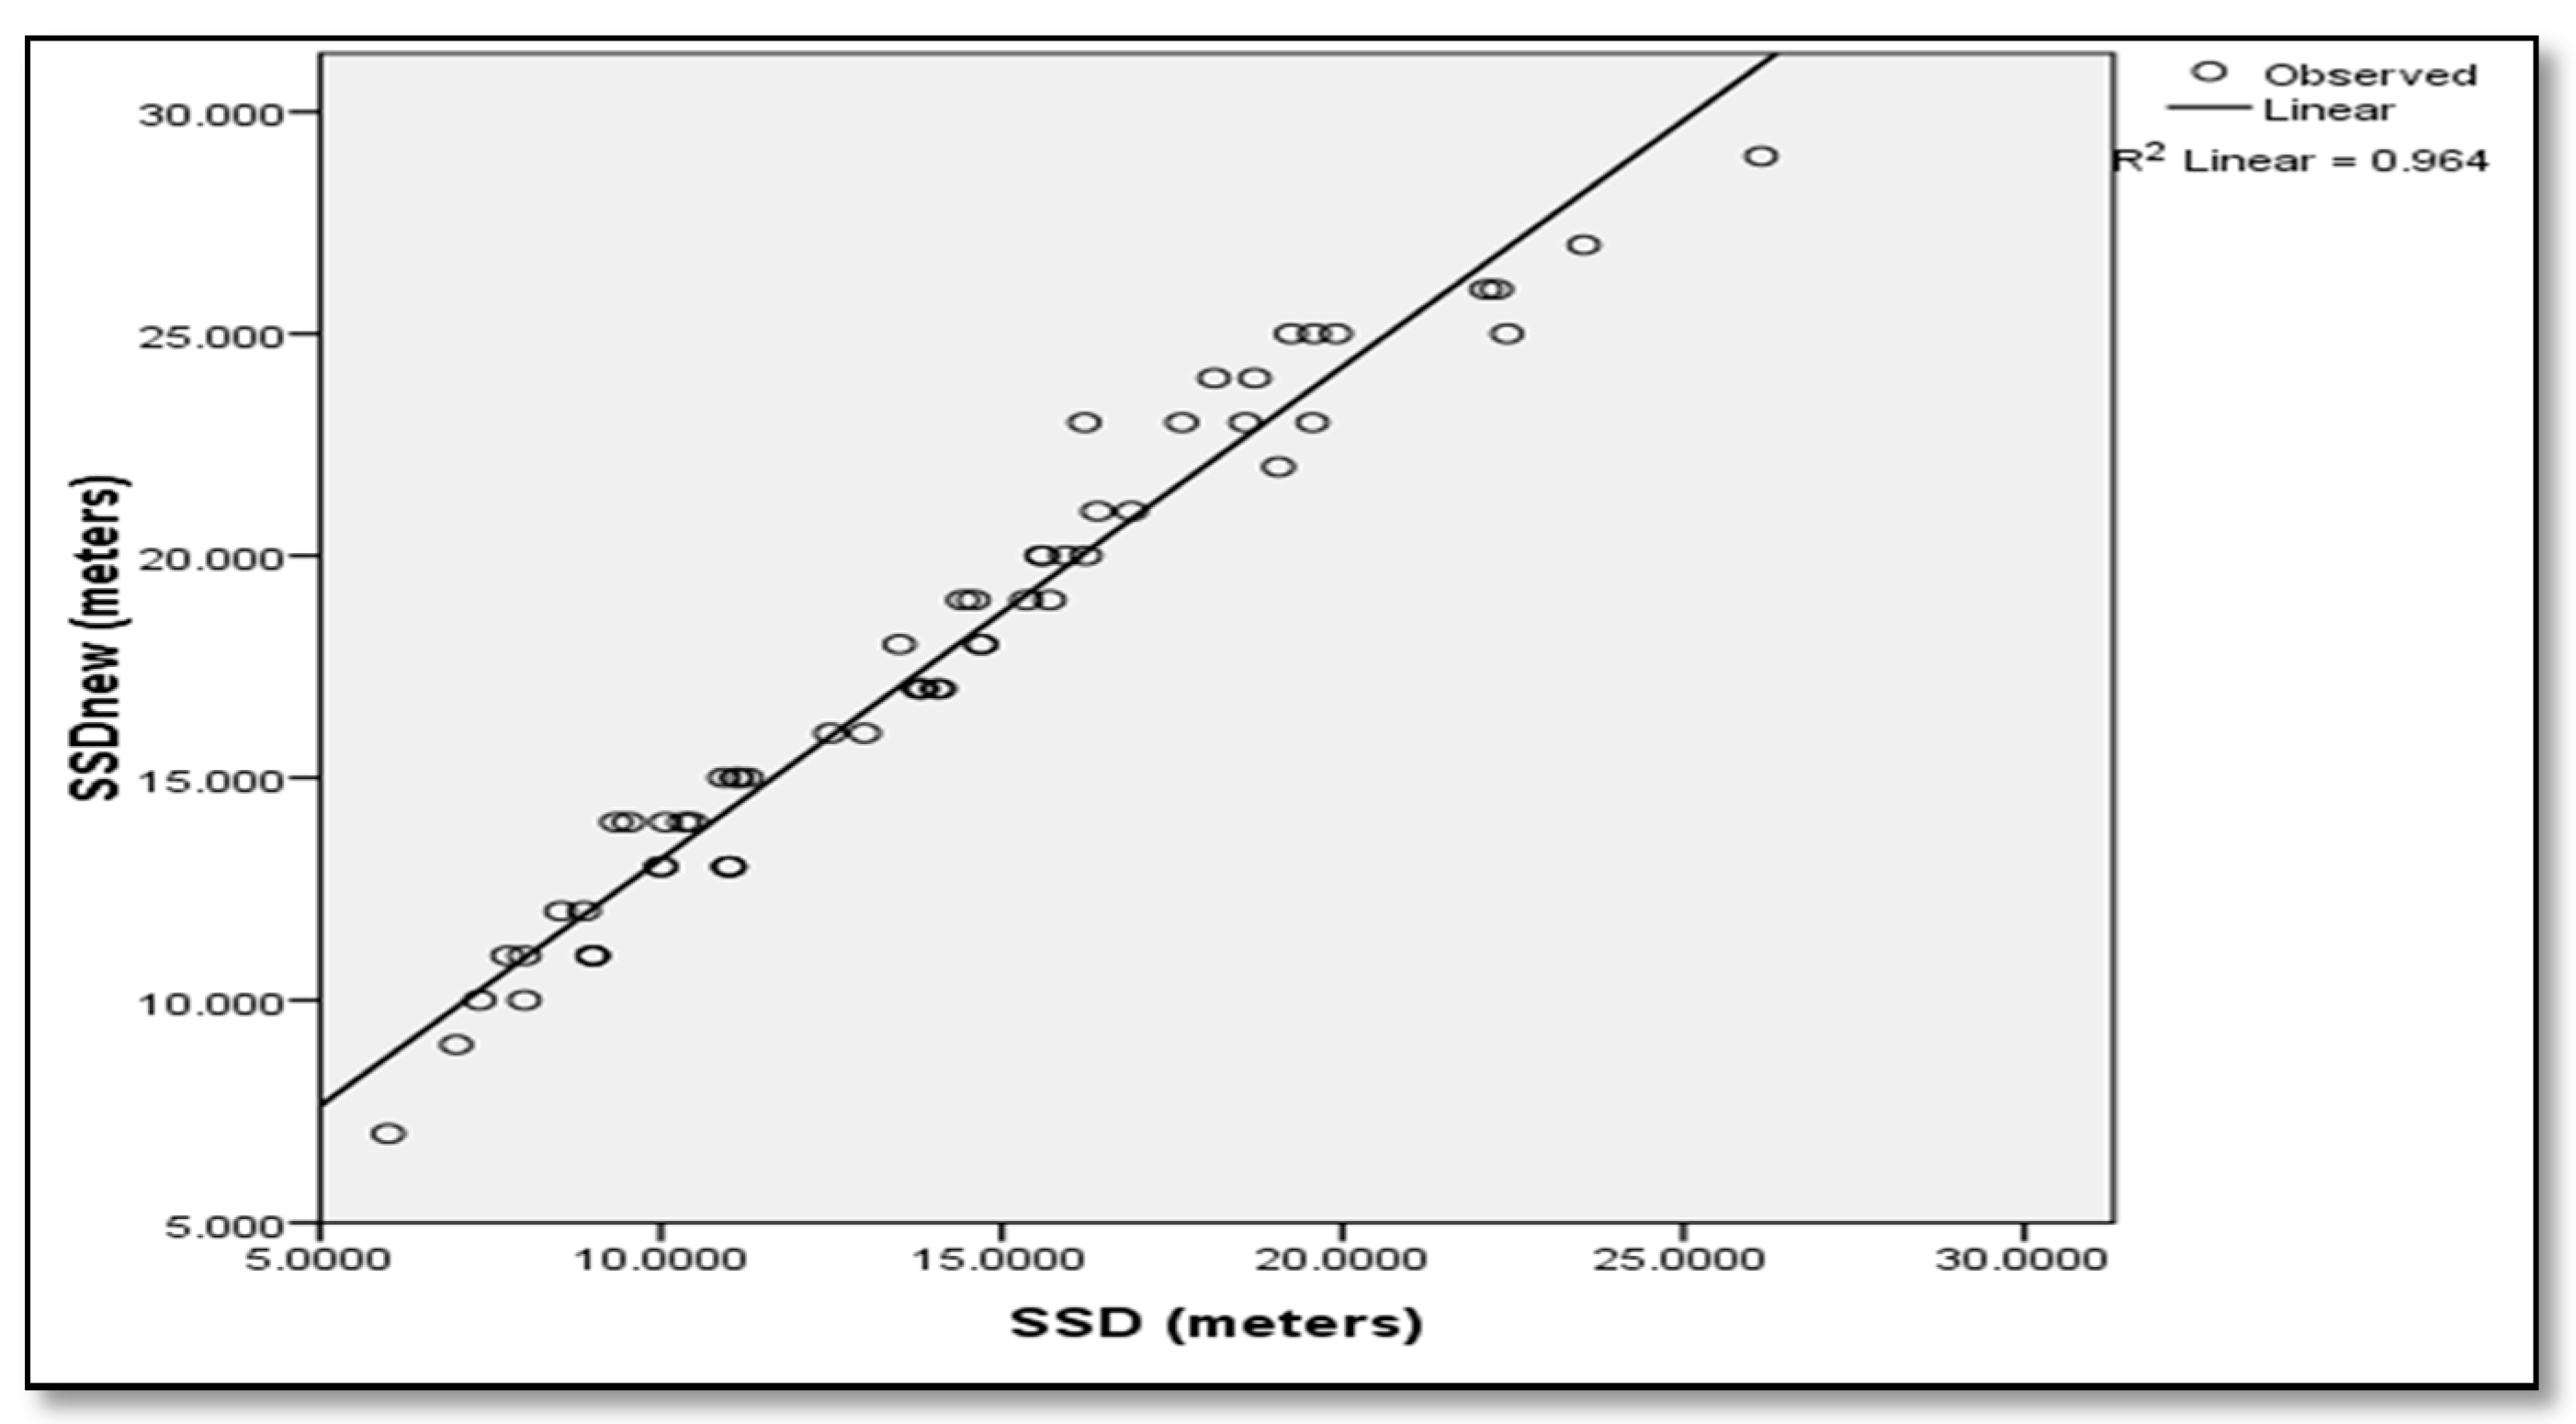
3.5. Model Validation

Evaluation Metrics

The model validation encompasses the different metrics for checking the newly developed SSD model performance, which are defined as:
  • Coefficient of Determination (R2)
The coefficient of determination, R2 [37], for the regression models is another validation parameter for determining the validity of the statistical models, as shown in Equation (4).
r = n (   xy ) (   x ) (   y ) [ n   x 2 (   x ) 2 ] [ n   y 2 (   y ) 2 ]                            
  • p-value Statistics
The probability of the hypothesis is the probability of discarding the null hypothesis of a problem, if the hypothesis is true. The p-value [37] helps in testing the significance of variables. At confidence interval 95%, if the p–value of the parameters and model is equal to or less than 0.05, the parameters and model are proved to be significant.
  • Mean Absolute Error (MAE)
MAE [37] is an estimator of the average misprediction of the model, and is expressed as:
MAE = 1 n i = 1 n | y i y |
where y i = observed value, y = predicted value, and n = sample size.
  • Mean Squared Error (MSE)
MSE [37] is used to measure the error associated with a validation or external dataset. It is measured as:
MSE = 1 n i = 1 n ( y i y ) 2
where y i = observed value, y = predicted value, and n = sample size
  • Root Mean Squared Error (RMSE)
RMSE [37] is defined as the difference between the predicted and actual value.
RMSE = 1 n i = 1 n ( y 1 y 0 ) 2
where y1 is the predicted value, y0 are the actual values, and n is the number of data points.
  • Mean Averaged Percentage Error (MAPE)
MAPE is defined as the average difference between the predicted and actual value.
MAPE = 1 n i = 1 n |   y 1 y 0 y 0   | × 100   %  
S.E. must be close to zero and R2 must be closer to 1. In Equation (5) and Equation (8), S.E. = 1.509, and R2 is 0.990 (closer to 1). Figure 3 shows the validation of a developed relationship SSD based on PCR, road width, V, t, ARG, and road visibility. The validation of the statistical parameters of the new SSD model are given in Table 5. As R2 is 0.964 (closer to significance level of 1) and MAE, MSE, RMSE, and MAPE of the SSD model have lower values, the new model is found to be suitable for SSD determination.

4. Results and Discussion

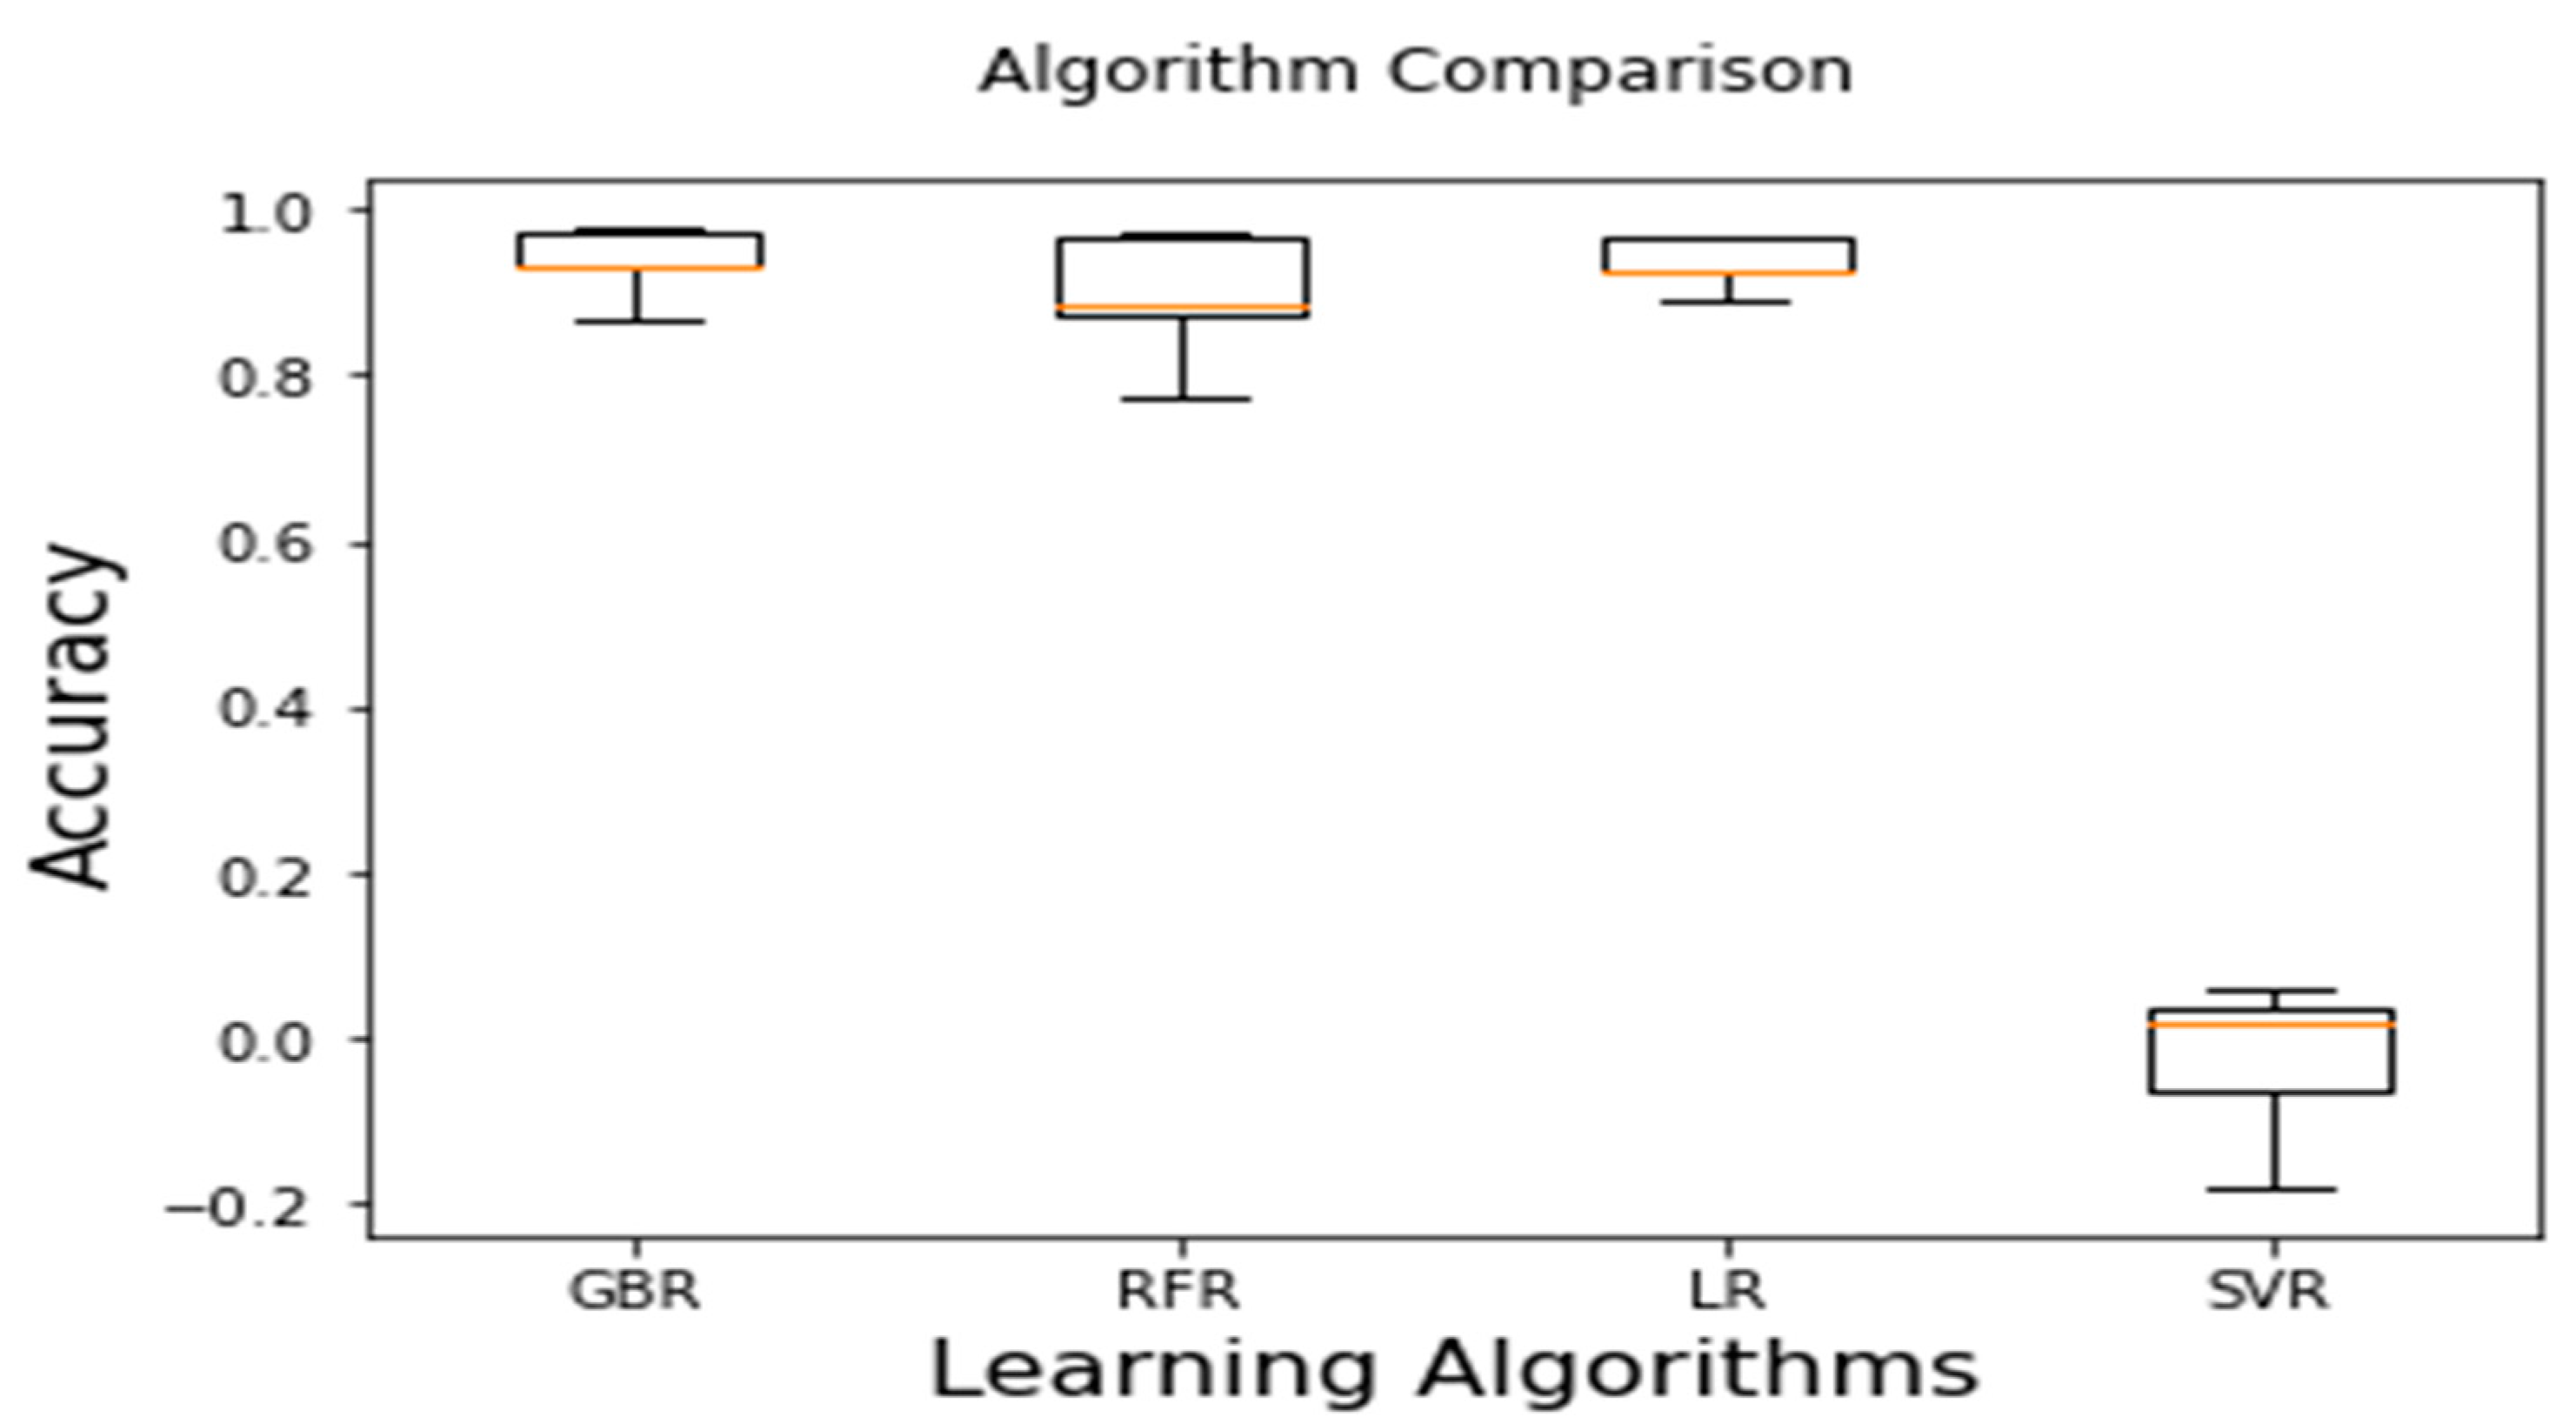
4.1. Model Prediction Accuracy

As explained in the data splitting section, the algorithm was run on four learners, i.e., Gradient Boost Regression, Random Forest Regression, Linear Regression by randomly splitting 75% of the dataset for the development of the model, and using the remaining 25% to assess its accuracy. In the study, 2175 samples out of a total of 2900 were used for training. The accuracy was evaluated through mean and standard deviation. Figure 4 shows that linear regression had better accuracy than the other three algorithms.

4.2. Feature Importance

The feature importance technique is used to evaluate the selected features to predict the output. The features reaching the highest score contributed the most to developing the SSD model. It is evident from Table 6 that approach road gradient seemed to be the most important parameter for determining the SSD. Among all learning algorithms, linear regression was found to be the most significant for determining the feature importance, as it gave accurate results for the tested datasets.

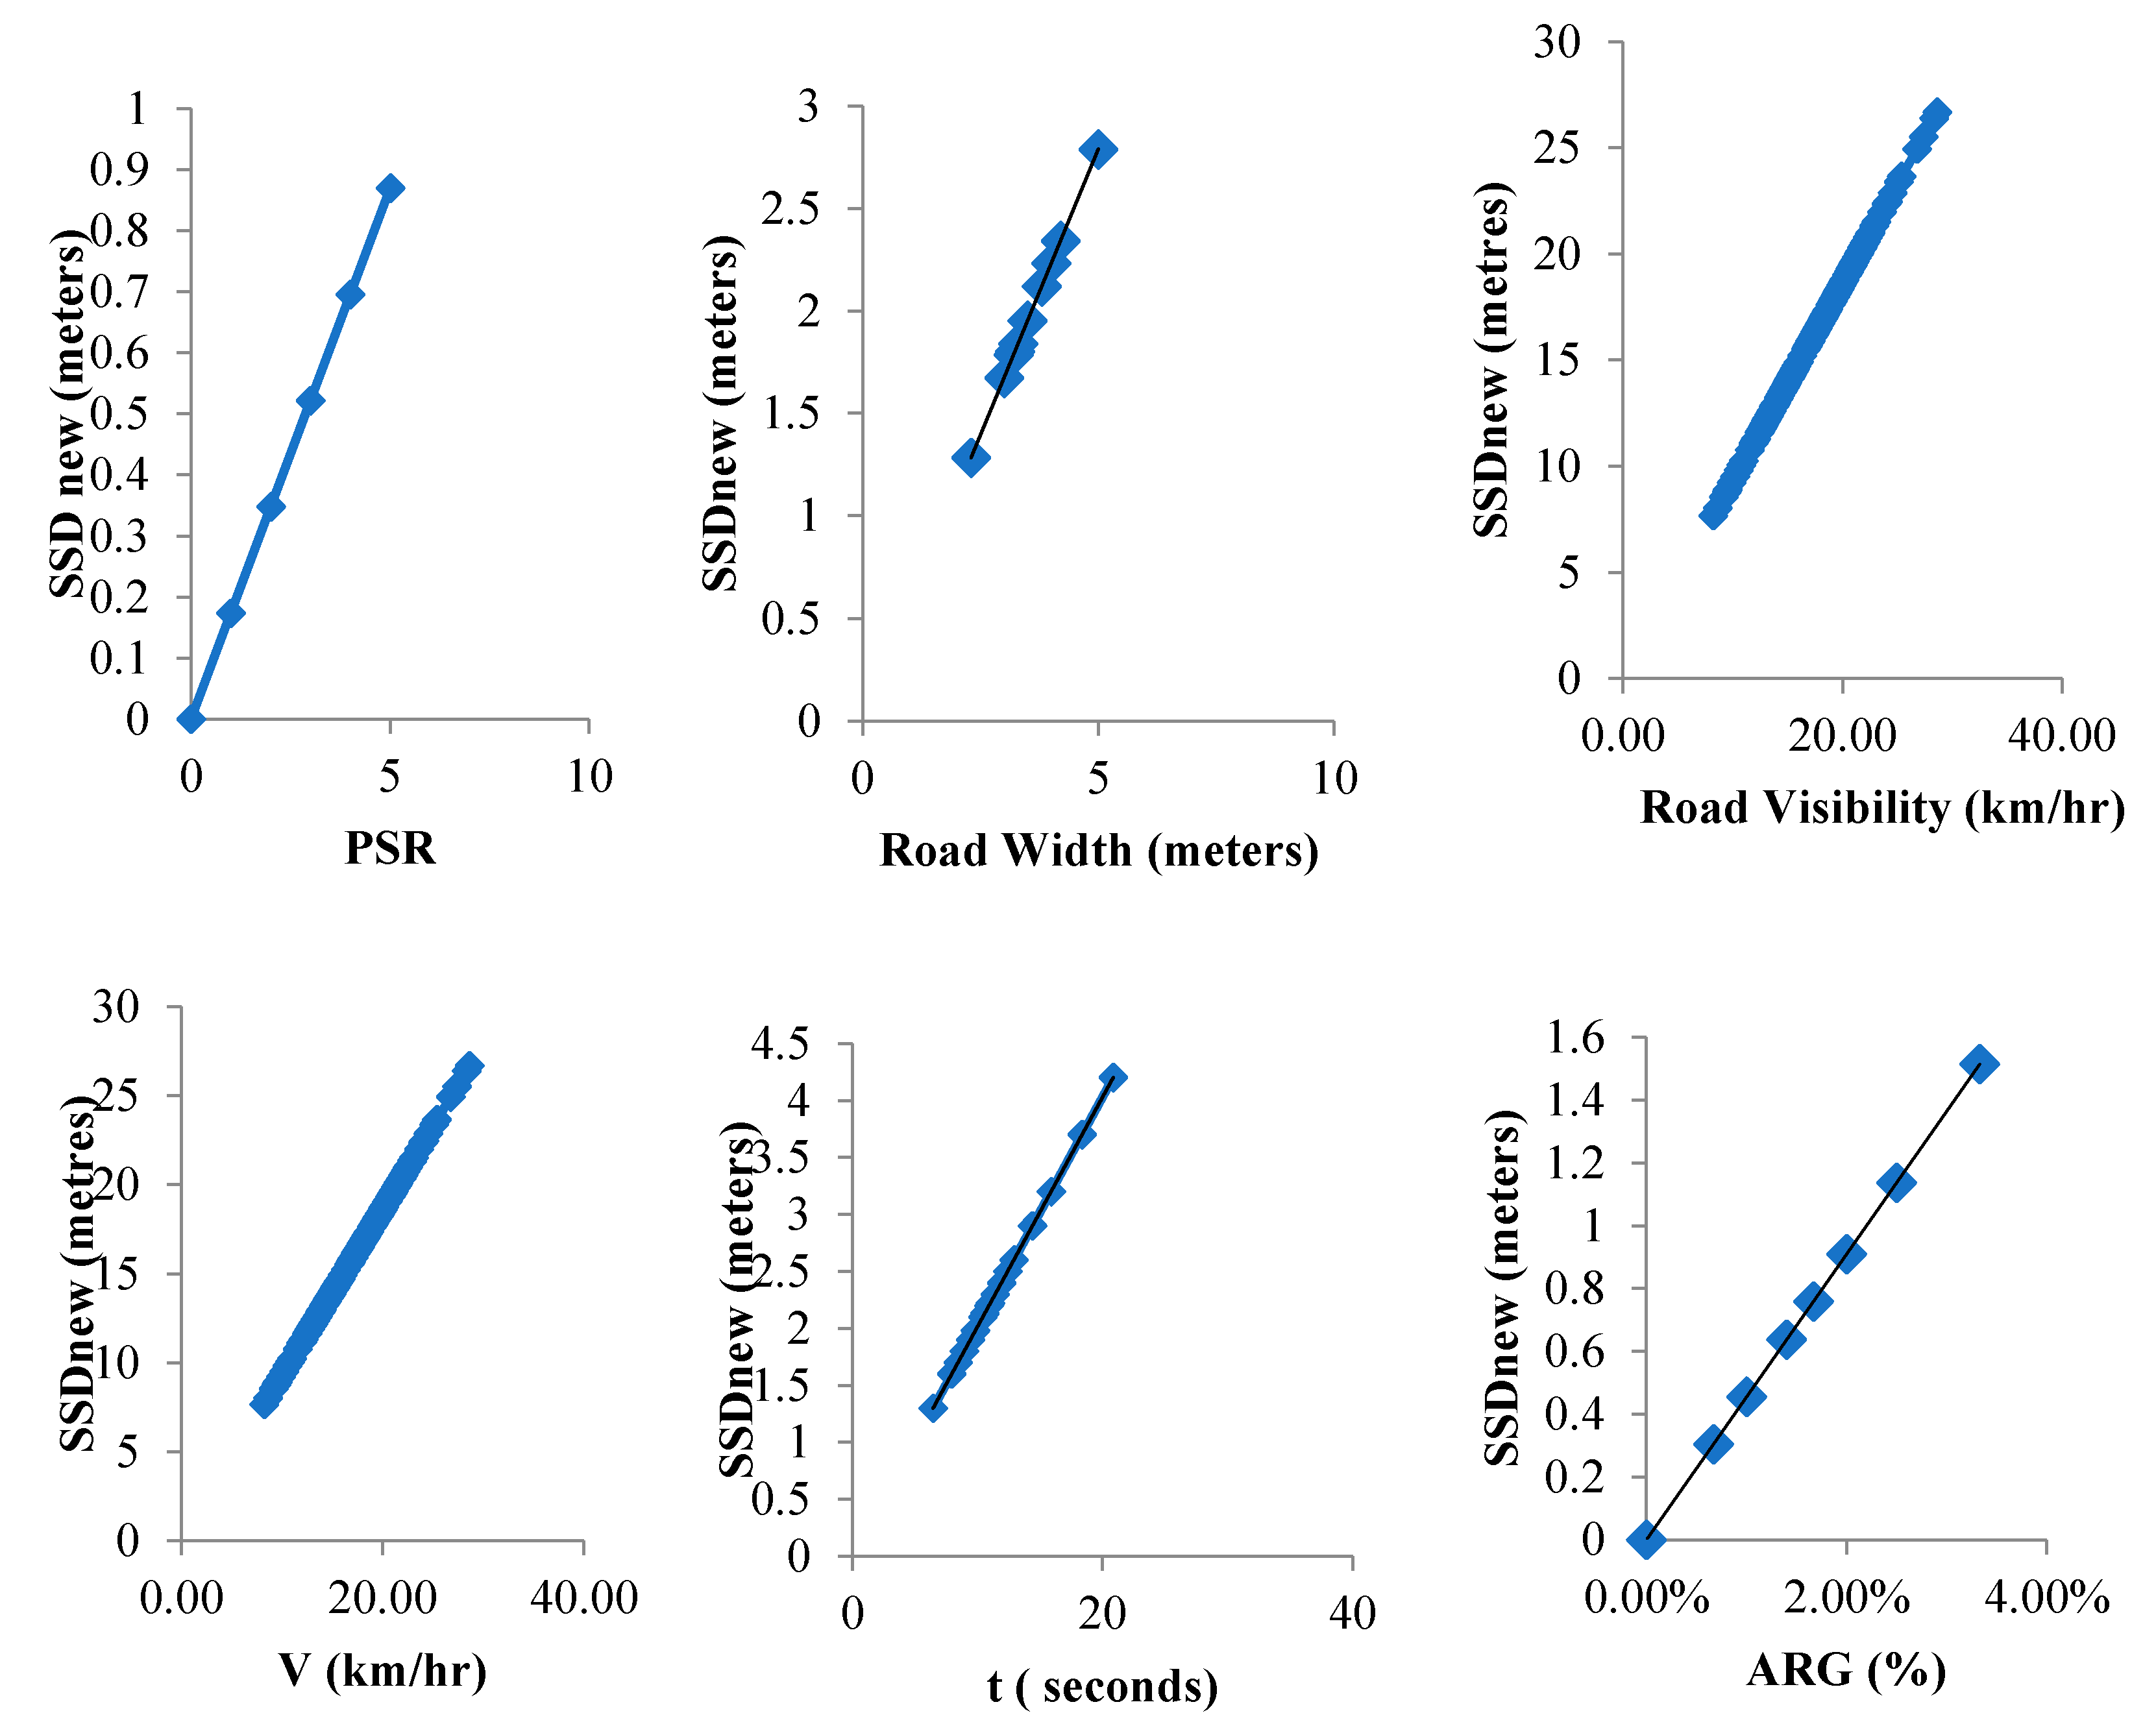
4.3. Sesnitivity Analysis
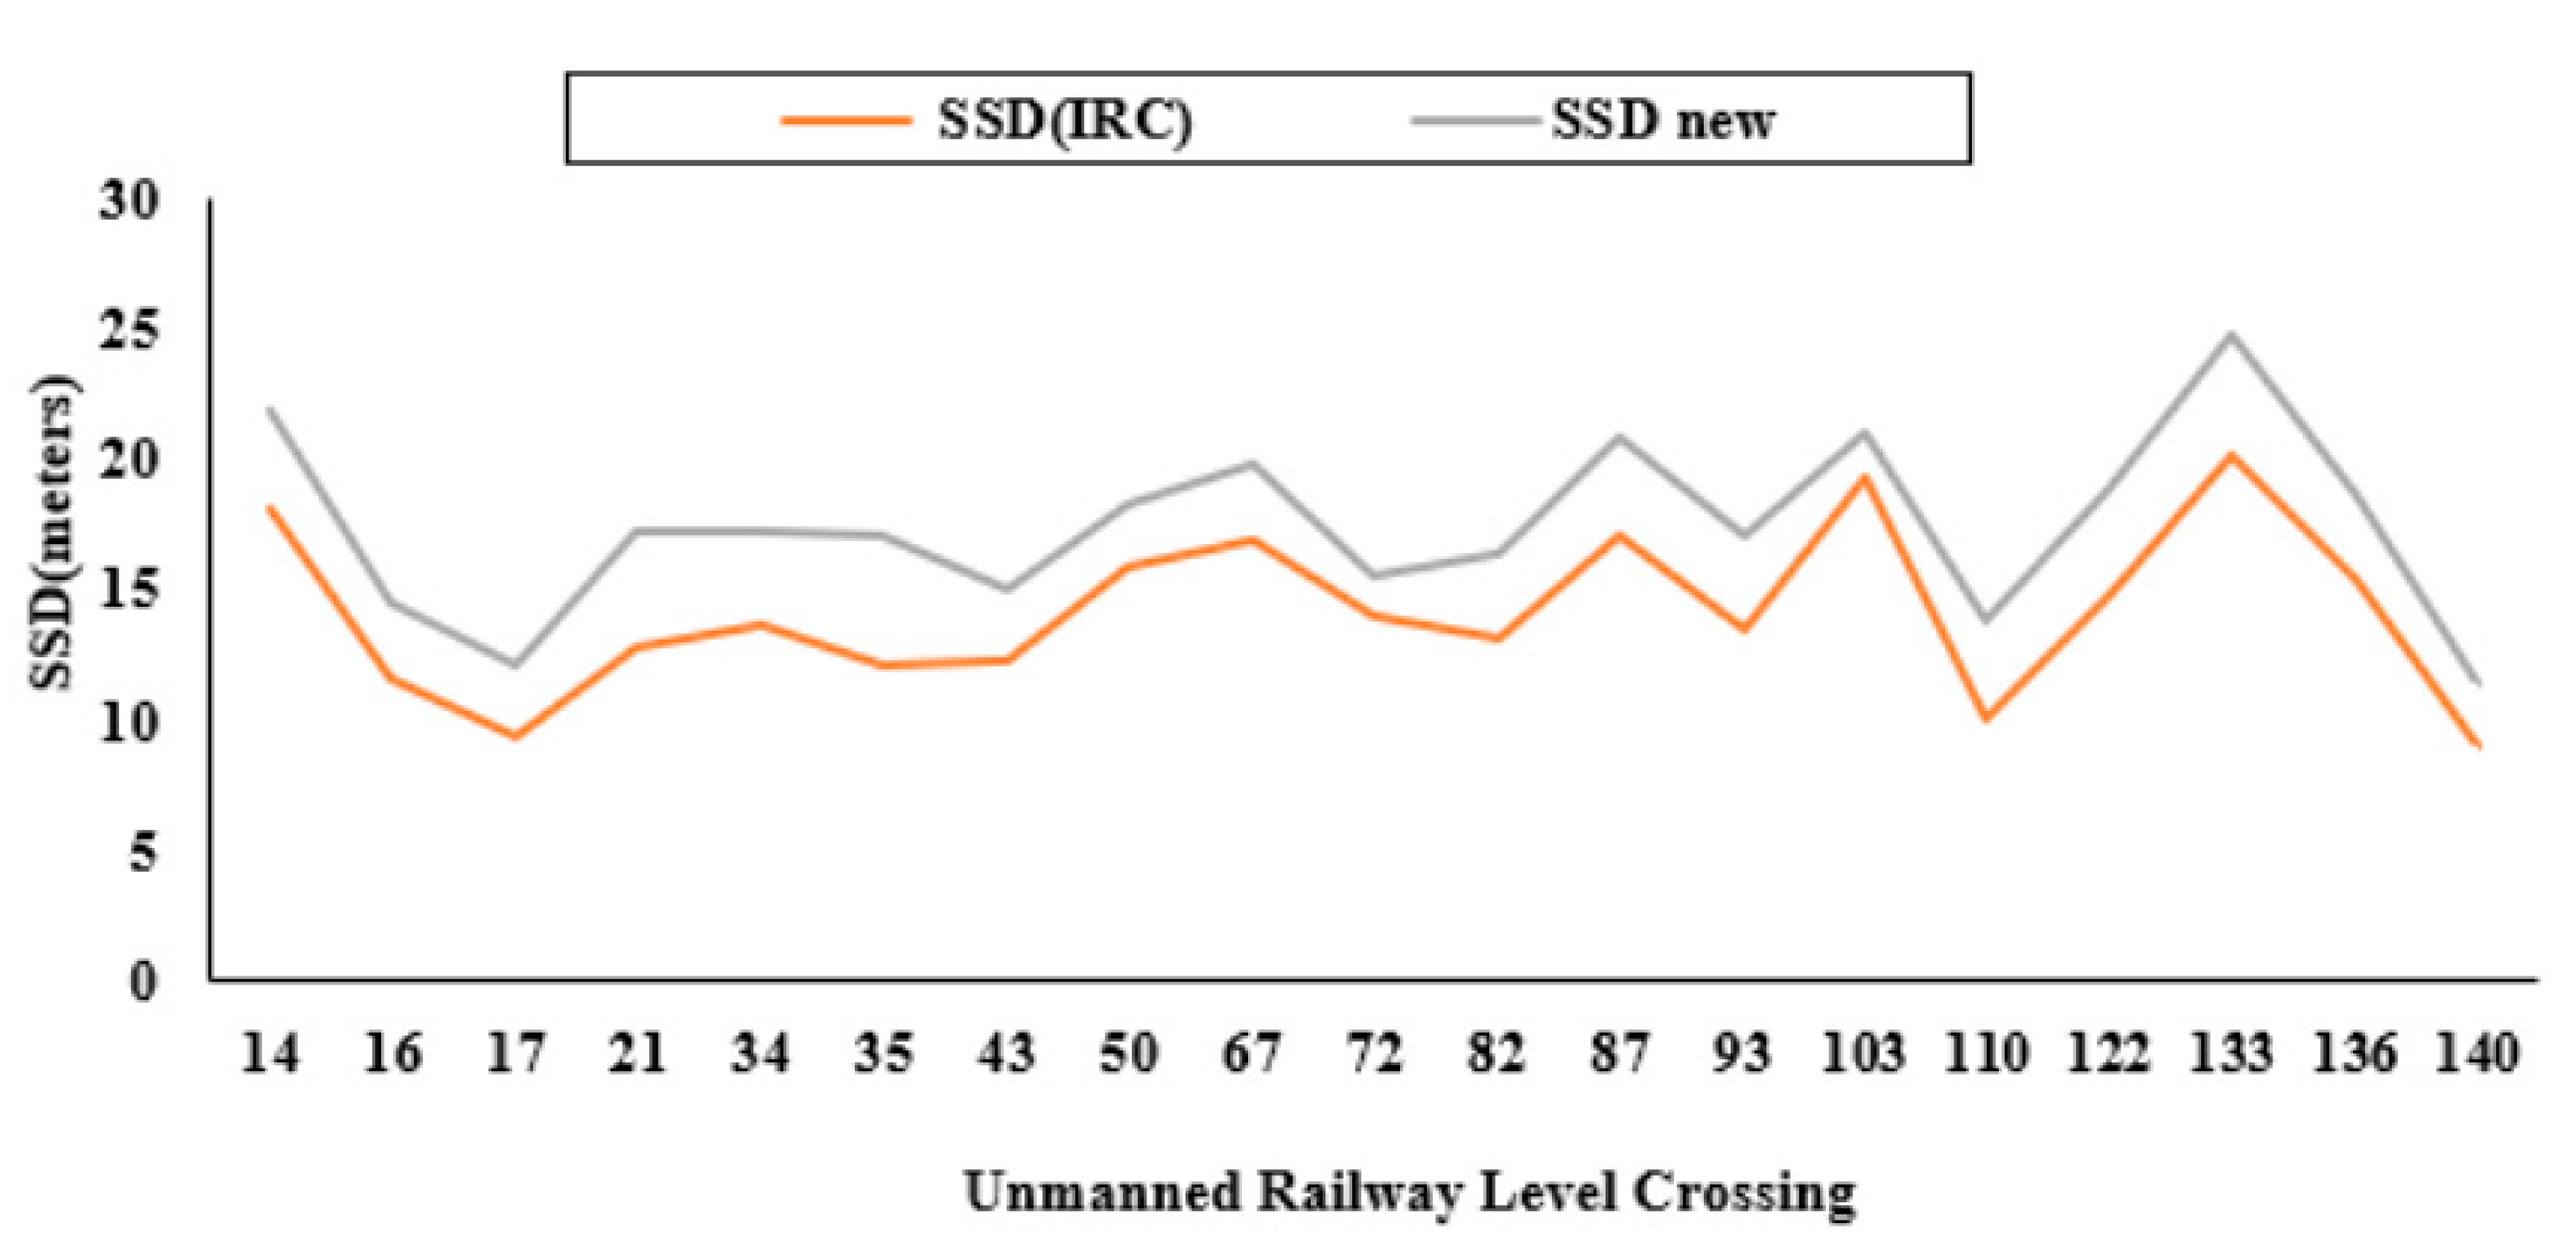
The sensitivity level of a particular parameter is obtained by keeping the other parameters constant. The sensitivity analysis of (Figure 5) the parameters PSR, road width (meters), road visibility (meters), V (km/hr), t (seconds), and ARG (%) were approximately in input ranges of 0 to 5, 2.3–5.0 m, 800 to 1000 m, 8.23–28.65 km/h (approx.), 1.3–4.2 s, and 0.00%–3.33% (approx.), respectively. If there is a rise in ‘PSR’ up to 41.58% (approx.), SSD is predicted to increase by up to 41.61% (approx.). If ‘road width’ increases by 31.02% (approx.), SSD is predicted to rise to 31.18% (approx.). With increasing ‘road visibility’ up to 15.07% (approx.), SSD is predicted to increase up to 15.11% (approx.). If the increase in ‘V’ rises to 39.29% (approx.), the SSD increase goes up by 39.3% (approx.). With the increase in ‘t’ to 46.62%, SSD is predicted to increase by 46.64% (approx.). If, again, an increase in distance of ‘ARG’ goes up to 44.32%, SSD is predicted to increase up to 93.91%.

4.4. SSD Analysis

The developed model predicts a significant rise in SSD at almost every crossing. The new SSD model suggested a rise of 23% (approx.) as compared to the IRC-calculated SSD IRC-39-1986 (1990) equation, as shown in Figure 6.

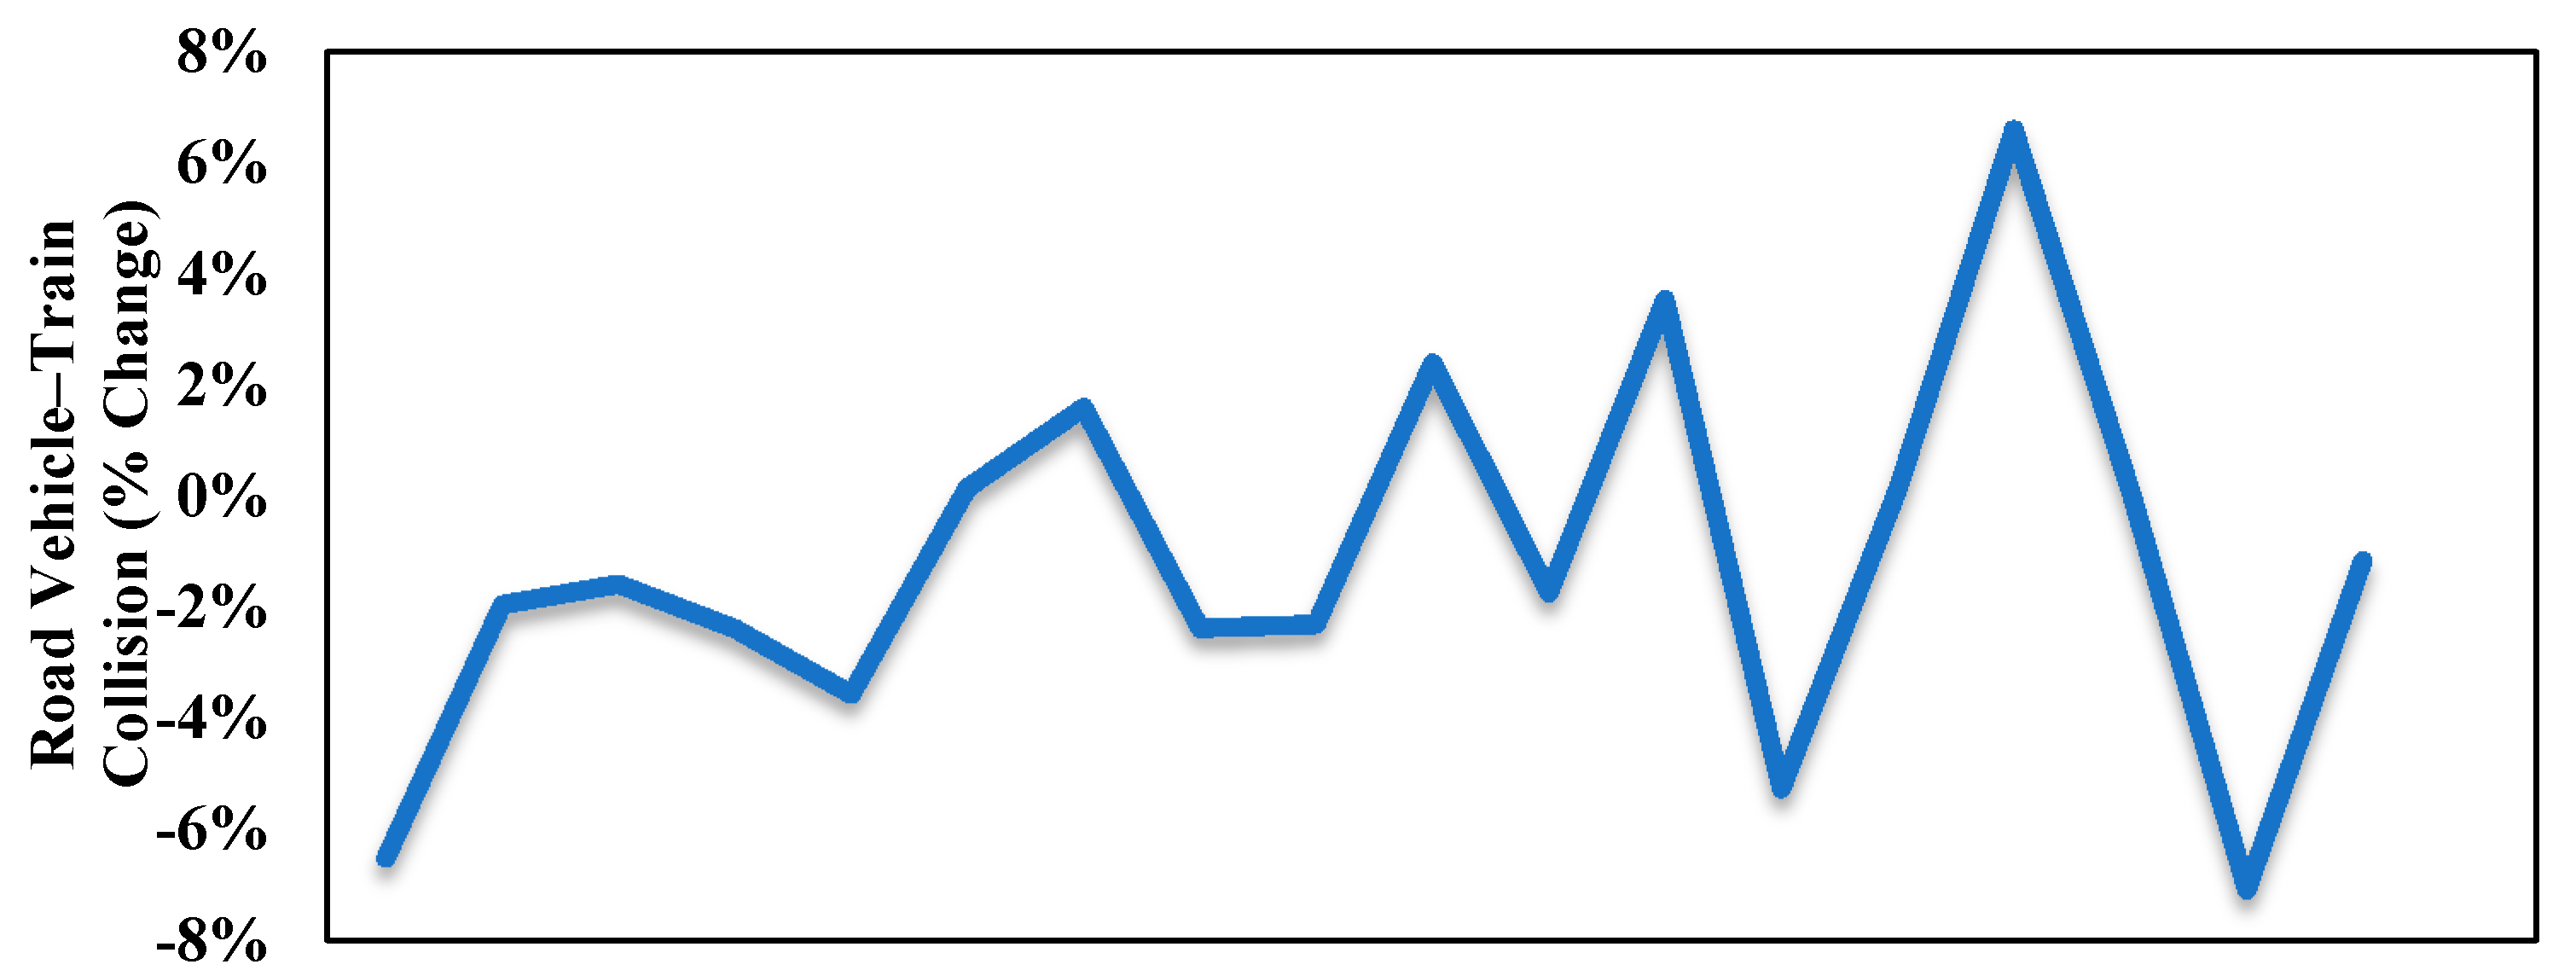
4.5. Road Vehicle–Train Collision Prediction Analysis

The new SSD model suggested a rise in SSD in comparison to the IRC equation. Figure 7 indicates that the rise in SSD tends to decrease the road vehicle–train collisions at unmanned railway level crossings. At almost half of the crossings, the road vehicle–train collisions tended to decrease in the range of 2 to 7% (approx.).

5. Conclusions and Future Work

In this study, a safe stopping sight distance model for road vehicles approaching unmanned railway level crossings was developed using linear regression analysis, which was found to be the best algorithm for SSD model prediction in comparison to Gradient Boosting, Random Forest, and Support Vector algorithms. Thereafter, a sight distance from road to rail track model was developed for road vehicles of length 0.5 to 10 m using the observed geometric characteristics of unmanned railway level crossings on the predefined route. The parameters viz. friction, environment, number of lanes, and construction, did not affect safe stopping sight distance. The approach road gradient was found to be the major contributing factor for stopping sight distance determination. The new safe stopping sight distance model suggested a rise of 23% in SSD in comparison to the IRC-39-1986 SSD equation. The accident prediction study suggested that an increase in the SSD calculated from the new SSD model predicts decreasing road vehicle–train collisions. The sight distance evaluation using machine learning algorithms of unmanned railway level crossings is expected to help in developing a warning system for road users. Therefore, in the future, the work can be extended to other artificial-intelligence-enabled techniques which may help in predominantly alerting the road users to avoid accidents with the train at unmanned railway level crossings, with already known complete sight distance information.

Author Contributions

Conceptualization, V.S., D.A. and H.M.A.; Methodology, N.G., A.S. and S.K.; Validation, V.S., A.S. and S.K.; Formal Analysis, A.S. and V.S.; Investigation, D.A. and H.M.A.; Resources, S.K.; Data Curation, V.S. and A.S.; Writing—Original Draft, V.S., D.A. and A.S.; Writing—Review and Editing, H.M.A. and N.G.; Supervision, S.K. and A.S.; Project Administration, H.M.A. and A.S. All authors have read and agreed to the published version of the manuscript.

Funding

This project was supported by the Deanship of Scientific Research (DSR), KingAbdulaziz University: Jeddah, under grant no. (KEP-12-611-42).

Institutional Review Board Statement

Not applicable.

Informed Consent Statement

Not applicable.

Data Availability Statement

Not applicable.

Conflicts of Interest

The authors declare no conflict of interest.

References

  1. Jolfaei, A.; Kant, K. Privacy and Security of Connected Vehicles in Intelligent Transportation System. In Proceedings of the 49th Annual IEEE/IFIP International Conference on Dependable Systems and Networks—Supplemental Volume (DSN-S), Portland, OR, USA, 24–27 June 2019; IEEE: Piscataway, NJ, USA, 2019; pp. 9–10. [Google Scholar]
  2. Jolfaei, A.; Kant, K. A lightweight integrity protection scheme for low latency smart grid applications. Comput. Secur. 2019, 86, 471–483. [Google Scholar] [CrossRef] [Green Version]
  3. Ai, B.; Molisch, A.F.; Rupp, M.; Zhong, Z.D. 5G key technologies for smart railways. Proc. IEEE 2020, 108, 856–893. [Google Scholar] [CrossRef]
  4. Stuart, J.J.; Mustard, D.; Johston, R.; Singh, M. Around 15,000 people killed every year in rail accidents. Times of India, 21 August 2013; 1–18. [Google Scholar]
  5. Chen, E.; Yan, Y.Z.; Wang, C.; Du, C. Investigating impacts of illegal crossings on vehicle operations at unmarked midblock locations. J. Transp. Saf. Secur. 2020, 1–20. [Google Scholar] [CrossRef]
  6. Menon, V.G.; Jacob, S.; Joseph, S.; Sehdev, P.; Khosravi, M.R.; Al-Turjman, F. An IoT-enabled intelligent automobile system for smart cities. Internet Things 2020, 100213. [Google Scholar] [CrossRef]
  7. Hassan, Y.; Easa, S.M. Modeling of required preview sight distance. J. Transp. Eng. 2000, 126, 13–20. [Google Scholar] [CrossRef]
  8. Fu, T.; Miranda-Moreno, L.; Saunier, N. A novel framework to evaluate pedestrian safety at non-signalized locations. Accid. Anal. Prev. 2018, 111, 23–33. [Google Scholar] [CrossRef] [PubMed]
  9. Fu, T.; Hu, W.; Miranda-Moreno, L.; Saunier, N. Investigating secondary pedestrian-vehicle interactions at non-signalized intersections using vision-based trajectory data. Transp. Res. Part C Emerg. Technol. 2019, 105, 222–240. [Google Scholar] [CrossRef]
  10. Al-Kaisy, A.; Miyake, G.T.; Staszcuk, J.; Scharf, D. Motorists’ voluntary yielding of right of way at uncontrolled midblock crosswalks with rectangular rapid flashing beacons. J. Transp. Saf. Secur. 2018, 10, 303–317. [Google Scholar] [CrossRef] [Green Version]
  11. Singhal, V.; Jain, S.S.; Anand, D.; Singh, A.; Verma, S.; Rodrigues, J.J.; Jhanjhi, N.Z.; Ghosh, U.; Jo, O.; Iwendi, C. Artificial intelligence enabled road vehicle-train collision risk assessment framework for unmanned railway level crossings. IEEE Access 2020, 8, 113790–113806. [Google Scholar] [CrossRef]
  12. Singhal, V.; Jain, S.S.; Parida, M. Train sound level detection system at unmanned railway level crossings. Eur. Transp. 2018, 68, 1–18. [Google Scholar]
  13. Singhal, V.; Jain, S.S. Road driver behaviour evaluation at unmanned railway level crossings. Eur. Transp. 2017, 65, 1–25. [Google Scholar]
  14. Mittal, P.; Singhal, V.; Jain, S.S. ICT enabled vehicular safe distance modeling at indian unmanned railway level crossings. SSRN Electron. J. 2019. [Google Scholar] [CrossRef]
  15. Mumtaz, S.; Jornet, J.M.; Aulin, J.; Gerstacker, W.H.; Dong, X.; Ai, B. Terahertz Communication for Vehicular Networks. IEEE Trans. Veh. Technol. 2017, 66, 5617–5625. [Google Scholar] [CrossRef] [Green Version]
  16. Liu, Q.; Li, P.; Zhao, W.; Cai, W.; Yu, S.; Leung, V.C.M. A survey on security threats and defensive techniques of machine learning: A data driven view. IEEE Access 2018, 6, 12103–12117. [Google Scholar] [CrossRef]
  17. Schoppert, W.; Hoyt, D.W. Factors Influencing Safety at Highway-Railway Grade Crossings; Highway Research Board: Washington, DC, USA; National Research Council: Washington, DC, USA; Transportation Research Board: Washington, DC, USA, 1967; pp. 1–113. [Google Scholar]
  18. Wigglesworth, C. The effects of local knowledge and sight restrictions on driver behaviour at open railway crossings. J. Saf. Res. 1978, 10, 100–107. [Google Scholar]
  19. IRC-73-1980. Geometric Design Standards for Rural Non-Urban Highways; The Indian Roads Congress: New Delhi, India, 1980. [Google Scholar]
  20. IRC-39-1986. Standards for Road-Raillevelcrossings; The Indian Roads Congress: New Delhi, India, 1986. [Google Scholar]
  21. King, T.C. The Effects of Lateral Sight Distance at Railway Crossing on Driving Speed and Visual Search; Unpublished Manuscript; Department of Psycholology, Queen’s University: Kingston, ON, Canada, 1989. [Google Scholar]
  22. Ward, N.J.; Wilde, G.J.S. Driver approach behaviour at an unprotected railway crossing before and after enhancement of lateral sight distances: An experimental investigation of a risk perception and behavioural compensation hypothesis. Saf. Sci. 1996, 22, 63–75. [Google Scholar] [CrossRef]
  23. Johtaja, R.O.; Nummelin, M. ‘Ratatekniset Määräykset ja Ohjeet’, Technical Guidelines for Finnish Railways, Part 9 Level Crossings; Finnish Transport Infrastructure Agency: Helsinki, Finland, 2002; pp. 1–52. [Google Scholar]
  24. Gou, M.; Bellavigna-Ladoux, O.; Dumont-Mackay, E. Impact of Heavy Vehicles on Crossing Safety Development of an Adapted Design Tool; Transport Canada Publication, TP 14172E; Transportation Development Centre: Montreal, QC, Canada, 2003. [Google Scholar]
  25. Nizam, A.; MacDonald, D. Highway-Rail Grade Crossing 101; Washington State Department: Seattle, WA, USA, 2005; pp. 1–104. [Google Scholar]
  26. Mornell, O. Plankorsningar Vägteknisk Utformning. 2008; volume 1. Available online: https://www.trafikverket.se/contentassets/5a8c103a24b94ba8874d4cb784a3d34a/bvs1586_30-plankorsningar_vagteknisk_utformning.pdf (accessed on 23 July 2021).
  27. New Zealand Transport Agency. Available online: https://www.nzta.govt.nz/. (accessed on 10 July 2008).
  28. Kallberg, V.-P. Determination of Sight Distance Requirements for Finnish Level Crossings. Open Transp. J. 2011, 5, 71–79. [Google Scholar] [CrossRef]
  29. Finnish Rail Administration. Available online: https://www.solita.fi/en/customers/more-efficient-and-safe-finnish-rail-transport/. (accessed on 2 January 2007).
  30. Sever, D. New approach to determining visibility length on passive protected level railroad crossings. Promet Traffic 2012, 24, 479–486. [Google Scholar] [CrossRef]
  31. Kumar, A.; Panday, M.N. Study of Safety Awareness at Railway Level Crossing. Int. J. Eng. Res. Technol. 2013, 2, 1097–1105. [Google Scholar]
  32. Moayedfar, R.; Moghadam, M.S.; Haghighatpour, P.J.I. Calculation of Sight Triangle Dimensions and -Unobstructed Area at Railway Level Crossings in Iran. J. Civ. Environ. Eng. 2014, 4, 60. [Google Scholar]
  33. Rudin-Brown, C.; Stuart, J.J.; Mustard, D.; French-St.George, M.; Johston, R. Extending the approach zone at passive level crossings: Improving train detection and driver decision-making. In Proceedings of the Global Level Crossing Symposium; Urbana, IL, USA, 3–8 August 2014, Transport Safety Board of Canada: Gatineau, QC, Canada, 2014; pp. 1–27. [Google Scholar]
  34. Zhou, Z.; Xiong, F.; Yu, H.; Xu, C.; Mumtaz, S.; Rodriguez, J.; Tariq, M. Trajectory-Based Reliable Content Distribution in D2D-Based Cooperative Vehicular Networks: A Coalition Formation Approach. In Proceedings of the IEEE International Conference on Communications, Kansas City, KS, USA, 20–24 May 2018; pp. 1–12. [Google Scholar]
  35. Malik, K.R.; Ahmad, M.; Khalid, S.; Ahmad, H.; Al-Turjman, F.; Jabbar, S. Image and command hybrid model for vehicle control using Internet of Vehicles. Trans. Emerg. Telecommun. Technol. 2020, 31, 1–13. [Google Scholar] [CrossRef]
  36. Zegeer, C.V.; Stewart, J.R.; Huang, H.H.; Lagerwey, P.A.; Feaganes, J.; Campbell, B. Safety Effects of Marked Versus Unmarked Crosswalks at Uncontrolled Locations. Transp. Res. Rec. 2005, 1773, 56–68. [Google Scholar] [CrossRef] [Green Version]
  37. Regression Algorithms: Which Machine Learning Metrics? Available online: https://www.mydatamodels.com/learn/guide/a-path-to-discover-ai/regression-algorithms-which-machine-learning-metrics/ (accessed on 10 June 2021).
Figure 1. Methodology for sight distance requirements determination.
Sustainability 13 08885 g001
Figure 2. Unmanned level crossing at skew crossing angle (not to scale).
Sustainability 13 08885 g002
Figure 3. Validation of developed SSD model.
Sustainability 13 08885 g003
Figure 4. Boxplot of accuracy of each algorithm for SSD.
Sustainability 13 08885 g004
Figure 5. Sensitivity analysis.
Sustainability 13 08885 g005
Figure 6. SSD vs. unmanned railway level crossing.
Sustainability 13 08885 g006
Figure 7. SSD vs. road vehicle–train collision (% change).
Sustainability 13 08885 g007
Table 1. Correlation values of data features.
FeaturesCorrelation
Speed of Road Vehicles0.785059
Perception and Reaction Time 0.574636
Road Visibility0.066366
Distance of Speed Breaker from Crossing−0.019334
Pavement Condition Rating−0.081655
Average Daily Traffic −0.131515
Approach Road Gradient−0.196355
Road Width−0.281600
Table 2. Significant/non-significant parameters of new SSD model.
S. No.ModelCoeff.Standard Error
(S.E.)
t-Statisticsp-ValueSignificant/
Not Significant
1.PSR0.170.0772.2690.02Significant
2.ADT0.000.0000.4860.63Not Significant
3.Road Width−0.560.183−3.0440.00Significant
4.Road Visibility−0.0090.002−4.5360.0Significant
5.V0.9310.03130.2950.0Significant
6.T4.9670.33414.8810.0Significant
7.ARG−45.4611.71−3.8830.0Significant
8.SBDC−0.0260.015−1.7060.09Not Significant
9.NL−2.9951.757−1.7070.09Not Significant
10.F----Not Significant
11.Environment----Not Significant
12.Construction----Not Significant
Note: PSR—present serviceability rating (0 to 5), ADT—average daily traffic (veh/day), RW—road width (meters), RV—road visibility (meters), V—speed of road vehicles (m/sec), t—total reaction time (sec), ARG—approach road gradient (%), f—friction, SBDC—speed breaker distance from crossing, and NL—number of lanes.
Table 3. Unmanned level crossing category-wise SSD.
Unmanned Level Crossing Category (i)ARG
(Observed)
Ti
(in Seconds)
Road WidthVisibilityAverage Speed Of Road Vehicle ( V ( i ) Observed)
(km/hr)
Distance of Stop Line from Crossing (Direction1)Distance of Speed Breaker from CrossingSSD
(as Per IRC)
in Meters
SSD New
in Meters
1<1%2.233.58881.2517.682.8523.2614.9915.04
21–2%2.273.78854.1718.972.5020.2115.7016.17
32–3%2.114.74850.0015.864.1421.1912.0311.64
4>3%2.364.49817.3317.114.8518.5814.0714.13
Table 4. Sight distance from road to railway track for crossing at Z = 45° and Z = 90° for road vehicle with length ‘l’.
Train Speed
V t
( km / hr )
Unmanned Level Crossing Category(i) Required   Sight   Distance   from   Road   to   Track   S L ( i ) in   Kilometers   for   Crossing   at   Z = 45 °   and   Z = 90 °
Road Vehicle Length ‘l’ (m)
0.512345678910
1010.410.420.420.430.430.440.440.450.460.460.47
20.390.400.400.410.410.420.420.430.430.440.44
30.370.370.380.390.390.400.410.410.420.420.43
40.380.390.390.400.400.410.410.420.430.430.44
2010.830.830.840.850.870.880.890.900.910.920.93
20.790.790.800.810.820.830.840.860.870.880.89
30.740.750.760.770.790.800.810.820.840.850.86
40.760.770.780.790.810.820.830.840.850.860.88
3011.241.251.261.281.301.311.331.351.371.381.40
21.181.191.201.221.241.251.271.281.301.311.33
31.111.121.141.161.181.201.221.231.251.271.29
41.151.161.171.191.211.231.241.261.281.301.31
4011.651.661.691.711.731.751.781.801.821.841.87
21.571.581.611.631.651.671.691.711.731.751.77
31.481.501.521.551.571.601.621.651.671.701.72
41.531.541.561.591.611.631.661.681.711.731.75
5012.062.082.112.132.162.192.222.252.282.302.33
21.971.982.012.032.062.092.112.142.162.192.22
31.851.871.901.931.961.992.032.062.092.122.15
41.911.931.961.992.012.042.072.102.132.162.19
6012.482.492.532.562.602.632.662.702.732.772.80
22.362.382.412.442.472.502.532.572.602.632.66
32.222.242.282.322.362.392.432.472.512.552.58
42.292.312.352.382.422.452.492.522.562.592.63
7012.892.912.952.993.033.073.113.153.193.233.27
22.752.772.812.852.882.922.962.993.033.073.10
32.592.622.662.702.752.792.842.882.932.973.01
42.682.702.742.782.822.862.902.942.983.023.07
Table 5. Validation statistical parameters of new SSD model.
Validation Statistical ParametersValues
MAE3.59
MSE13.83
RMSE3.71
MAPE (%)28%
Table 6. Feature importance.
Feature NameFeature Importance
Speed of Road Vehicles0.00338
Perception and Reaction Time−0.00003
Road Visibility−0.4159
Distance of Speed Breaker from Crossing−0.00152
Pavement Condition Rating0.93083
Average Daily Traffic4.61061
Approach Road Gradient−24.71019
Road Width0.03339
Publisher’s Note: MDPI stays neutral with regard to jurisdictional claims in published maps and institutional affiliations.

