1. Introduction
The high levels of environmental degradation that have occurred in the last decades have contributed to rising global interest towards renewable energy sources. For the purpose of supporting and encouraging climate action, the European Union generated several financial tools in the past years, with the aim to stimulate the research and development of innovative systems that will help mitigate pollution. Such tools include the Innovation Fund, NER 300 [
1] and LIFE Climate action [
2]. Currently, the EU is implementing the European Green Deal, which has as its main objectives the achievement of climate neutrality by 2050, the engagement of all forms of social entities and citizens in climate action and the reduction of net greenhouse gas emissions by at least 55% in the next 10 years [
3]. The most common green energy sources include hydro energy, wind, solar and biomass energy. In order to efficiently extract energy from such sources it is necessary to develop task-oriented systems specifically designed for each type of application.
Wind turbines represent devices that have the capability to convert the kinetic energy of the wind to mechanical or electrical energy that can be further used for industrial or domestic applications. Generically, wind turbines can be divided into two large categories, depending on the direction of the rotor axis: horizontal axis wind turbines (HAWTs) and vertical axis wind turbines (VAWTs) [
4]. The first type is better suited for large scale applications, as such turbines have higher efficiency than the latter, and it is most commonly installed in large, isolated areas due to the high levels of noise produced. On the other hand, the last category is suitable for smaller applications, such as providing power for a household or public illumination. In addition, VAWTs can harvest the kinetic energy of the wind from any direction, as opposed to HAWTs, which need an additional yaw-system, as they can only harvest wind energy from one direction [
5]. This property makes VAWTs fitted for applications in turbulent winds, and together with the low noise level they produce, compared to HAWTs, vertical axis wind turbines are considered appropriate for installment in urban and adjacent populated areas. There are various geometrical solutions for VAWTs, including Savonius, Darrieus and Lenz models. Such models can be improved further in order to produce better results. For this purpose, one must be mindful of the aerodynamic properties of the geometry submitted to an optimization process, as they highly influence the overall performances. Modern research methods are comprised of computational aerodynamics, computational fluid dynamics (CFD) and experimental procedures. CFD methods offer complex insights regarding the flow around wind turbines, without the need of sophisticated testing systems such as those needed for experimental campaigns. Therefore, CFD tools are often engaged in the optimization process of wind turbines [
6]. Furthermore, along the aerodynamic investigation, novel software tools also allow the acoustic, mechanical, optical, electrical or thermal evaluation of different systems designed for the generation of renewable energy. Some of these aspects are emphasized in paper [
7], where the authors employ a multiphysics software for an optical, electrical and thermal 3D analysis of solar cells, discussing broadly each involved phase: mesh generation and its properties, case setup and results for each investigated aspect.
Various approaches could be adopted when talking about optimizing a wind turbine or similar systems. Key elements from the aerodynamic design could be optimized separately and then used for the geometry, or the configuration could be modified as a whole. When the blade’s airfoil is specifically targeted for optimization, it is often because the main objective is improving the lift-to-drag ratio and thus the overall performances [
8]. When improving the whole geometry, in addition to a growth in performances, the enhancement of the start-up behavior is also desired, as well as mitigating the negative effects caused by blade-to-blade interaction.
In the first case, the airfoil is frequently the selected parameter for optimization. Modern solutions that use CFD for the optimization of airfoils engage methods such as genetic algorithms and artificial neural networks [
9] and employ software tools such as parametric design or adjoints [
10]. The optimization process of a wavy airfoil based on adjoint methods is presented in [
11]. The resulting configurations show higher lift-to-drag ratios, and the optimal one presents a sudden increase for the angle of attack in time and major variations for this parameter, thus being destabilized.
Another study regarding airfoil optimization techniques is conducted by Zhang et al. in [
12]. The authors describe an inverse design method based on a targeted pressure gradient, which they manage to validate with experimental data for the RAE2822 airfoil.
M. Jafaryar et al. [
13] also investigate the applications of asymmetrical airfoils for VAWTs and aim to optimize standard four digits NACA airfoils. The work presented in their paper examines comparatively different asymmetrical airfoil shapes by means of CFD analysis, with emphasis on the resulted turbulence intensity and pressure contours in order to assess which one is aerodynamically fitted to develop a vertical axis wind turbine. At the end of their study, the authors conclude that the optimal airfoil shape is very similar to symmetric airfoils.
Regarding the study of the self-starting behavior and capabilities of VAWTs, in paper [
14], the authors propose a methodology for the development of a new blade profile, firstly considering and analyzing both symmetrical and asymmetrical standard blade airfoils. The outcome of their research was a new blade profile, EN0005, that is aerodynamically capable to self-start the wind turbine without the need of other external components or energy input.
Another innovative approach towards self-starting and performance improvement is represented by flow control methods, such as Gurney Flaps [
15], leading-edge serrations [
16] and, more recently, vented airfoils. The latter one represents a newly described concept by Mitchell et al. in [
17]. The authors evaluate the capabilities of the new vented airfoil design using CFD methods, concluding that for low tip speed ratios (TSRs) there is a noticeable increase in torque, which helps the wind turbine start. On the other hand, for higher TSRs, the power coefficient is mildly decreased (up to a 9% decrease for a TSR value of 2, and an approximate decrease of 1% for higher values).
When referring to asymmetrical vertical axis wind turbines, current state of the art largely provides information regarding wind turbines with asymmetrical profiles for the blades [
18,
19]. In the case of this paper, the authors propose a new approach regarding asymmetrical VAWTs, proposing a geometry with different radii and chords for each blade, while using a symmetrical NACA airfoil for all three blades.
The described geometry was adopted to improve the starting behavior of VAWTs, as well as a solution for the alleviation in efficiency that occurred for the classic H-Darrieus model due to blade-to-blade interaction. The investigation proposed in this paper will focus mainly on comparing performances between the proposed new configuration and the classic one, with the purpose of numerically validating the concept. To achieve this, several 2D computational fluid dynamics (CFD) simulations were carried out employing ANSYS Fluent, adopting the transition Shear Stress Transport (SST) turbulence model.
2. Materials and Methods
This section explains the algorithm that was used to define the new concept configuration, starting from a classic geometry. The approach to the numerical investigation, including meshing techniques for the two studied geometries and case setup in ANSYS Fluent, is also extensively discussed.
2.1. Geometry Generation
The current research is focused on a baseline H-Darrieus geometry and a new asymmetrical H-Darrieus wind turbine design. For both configurations, a symmetrical NACA0021 airfoil for the blades was used. The geometrical features of the baseline wind turbine are provided in
Table 1.
In an attempt to prevent the vortices created by one blade from dissipating right into the leading edge of the next one, the new turbine concept mentioned proposes the following methodology regarding the assessment of the parameters for the asymmetrical geometry:
Evaluate the boundary layer around the used airfoil at different angles of attack with the purpose of determining the maximum boundary layer thickness;
Set one blade as a landmark (usually the one positioned at 0° in the starting position). Then, for the radius of the blade on the right, subtract the maximum boundary layer thickness, and for the blade on the left, add the same value;
Evaluate the values of the chords for the blades with different radii, being mindful of the Reynolds number.
As explained in the first item listed above, in order to determine the geometry of the new turbine concept discussed, it is necessary to evaluate the boundary layer around the used airfoil at different angles of attack. The angle of attack (AoA) is evaluated as a function of tip speed ratio (TSR) and position angle (θ-varying from 0° to 360° for a full revolution of the wind turbine) using the following expression:
For a tip speed ratio of 2.5, the values of the angle of attack ranged from −24° to 24°. With the purpose of assessing the maximum boundary layer around the airfoil at the mentioned AoAs, steady state simulations are documented, for a constant velocity of 12 m/s. The velocity field around the NACA0021 airfoil at different angles of attack is illustrated in
Figure 1, where the growth in boundary layer thickness can be observed.
The maximum boundary layer thickness for the analyzed airfoil with a chord of 3 × 10⁻¹ m was of approximately 2.8 × 10⁻¹ m. With this value, the radii for the new geometry can be determined as discussed on the second item of the methodology listed before.
Regarding the evaluation of the chord, it is determined as a function of dynamic viscosity of air (μ), Reynolds number (Re-the same value as for the first blade), air density (ρ), tip speed ratio (TSR) and design velocity (V
∞), using the following expression:
The geometrical characteristics of the asymmetrical wind turbine, calculated with the previously described approach, are presented in
Table 2.
2.2. Numerical Simulation
Both the baseline and the new asymmetrical geometry concept were investigated by means of CFD simulations, using ANSYS Fluent.
The 2D computational domain for the numerical analysis consisted of 2 subdomains: a stator domain (surrounding static domain) and a rotor domain, which included the three blades and the shaft. The subdomains were connected through an interface defined between them. Three structured computational grids were generated for each geometry using ANSYS ICEM tool: a coarse one (292,695 elements), a medium one (497,490 elements) and a fine one (756,285 elements).
For mesh generation, the blocking method was employed, and the y+ value was set to no more than one in order to resolve any possible occurring problems near the boundary layer. Hence, the height for the first cell was computed accordingly and its value was estimated at approximately 1 × 10
−5. The adopted value for the growth ratio was 1.1 for all three generated computational grids, whereas the maximum number of elements on the edges was different for each type. The first generated mesh was the medium one, which was computed accordingly with best meshing practices for such applications [
20]. The coarse and fine grids were computed similarly, only altering the number of elements on the edges as follows: for the coarse one, the number of elements was decreased by 20%, whereas for the fine one, it was increased by the same amount. The presented approach towards mesh generation was successfully implemented for other studies in the field, as was the independence mesh study managed in [
21], for which the mesh topology was specifically based on prior work associated with the authors of the current research, as mentioned in the cited paper.
Mesh details are summarized in
Table 3 for future reference.
The fine mesh for both geometries is presented in
Figure 2 and
Figure 3, respectively.
In
Figure 3, one can also observe the different radii of the asymmetrical turbine and the different chord values for each blade.
The configurations were evaluated for tip speed ratios varying from 0.5 to up to 3, monitoring the moment coefficient for each blade and the vorticity magnitude field. The power coefficient was assessed by multiplying the torque coefficient with the blade’s tip speed ratio and then adding the obtained values. This approach was needed because for the asymmetrical wind turbine, each blade had a different tip speed ratio, even though in the results section the tip speed ratios presented are the values reported to the trademark blade.
As mentioned at the beginning of this subsection, the ANSYS Fluent software was employed for the investigation of the flow around the wind turbines. The used model for this research was the transition Shear Stress Transport (SST) model, which is based on the coupling of the SST k-ω transport equations with the other two transport equations (one for intermittency and one for momentum-thickness Reynolds number). The model combines the advantages of k-ω and k-ε formulations and is recommended for applications such as the presented one, as it correctly approximates the flow around the blade, as well as its far field flow [
22,
23].
The used method was the SIMPLE method, with second order upwind schemes for spatial discretization.
Regarding the boundary conditions of the elements included in the domain, the blades and the shaft are defined as walls, an interface is defined between the rotor and stator subdomains, the stator subdomain is defined as stationary, and the rotor subdomain is defined using mesh motion, providing the angular velocity specific to the tip speed ratio of the analyzed case. The inlet velocity was set at 12 m/s, and the flow direction was set on the X axis, as depicted in
Figure 4. A schematic diagram of the computational domain including all discussed boundary conditions is given in
Figure 4.
The cases are initialized with a velocity inlet of 12 m/s. The details of all the cases investigated for each geometry are presented in
Table 4. The number of iterations refers to the entire simulation, that consists of 7 full cycles of the turbine. The time step size (t) was calculated as a function of angular velocity (ω) as follows:
3. Results and Discussion
In this section, three main characteristics will be addressed comparatively for the two simulated geometries: torque coefficient, power coefficient and vorticity magnitude.
3.1. Torque Coefficient
The moment coefficient was monitored during the simulated cases for both analyzed configurations. To draw a conclusion regarding the self-starting behavior of the studied wind turbines from the current numerical investigation, one must examine the moment coefficient for the low values of the tip speed ratio.
For the coarse mesh, the average torque coefficient for a revolution at a low tip speed ratio value of 0.5 was 8 × 10
−3 for the baseline and 28 × 10
−3 for the asymmetric model. The increase in the moment coefficient for the asymmetrical wind turbine indicates an improved start-up behavior, as a higher torque coefficient at reduced starting tip speed ratios is associated with an amplified acceleration, facilitating the start-up process [
17]. For the fine mesh, the average torque coefficient for a revolution at a low tip speed ratio value of 0.5 was 26 × 10
−3 for the baseline and 34 × 10
−3 for the asymmetric model. The torque coefficient for each blade as a function of the azimuth angle is depicted for each studied configuration in
Figure 5, for a tip speed ratio value of 0.5. This value for the tip speed ratio was selected for visualization, as the sub-unit values are relevant in the analysis of start-up behaviour.
For better visualization, the total torque coefficient variation with the azimuth angle for a full revolution of the wind turbine is depicted comparatively for both studied geometries in
Figure 6. The total torque coefficient for each azimuth angle was evaluated as the sum of torque coefficients corresponding to each one of the three blades. The total torque coefficient of the proposed asymmetrical concept outperforms the one of the baseline, highlighting its enhanced behaviour at start-up.
By comparatively analyzing the torque coefficient variation for both studied configurations, it can be observed that the asymmetric geometry generates higher values for the evaluated parameter at low tip speed ratios, enhancing its start-up behaviour. Thus, the start-up behavior is slightly improved for the asymmetrical model when compared to the classic H-Darrieus geometry. The torque coefficient’s variation with the azimuth angle for each blade for a tip speed ratio of 1 is illustrated in
Figure 7 for comparison. As expected, the peak torque coefficient varies for each blade for the asymmetric model due to the different radii and chords. The average torque coefficient for a full revolution in this case was 6.5 × 10
−2 for the baseline model and 11.1 × 10
−2 for the asymmetric proposed concept. Thus, the latter one presents, as aimed, superior behaviour at start-up compared to the baseline.
Figure 8 shows the difference between the two considered geometries in terms of the total torque coefficient by comparing its variation with azimuth angle for a tip speed ratio of 1. In this case, the difference is not as accentuated as for the previously discussed case. However, the asymmetric geometry preserves its superiority.
3.2. Power Coefficient
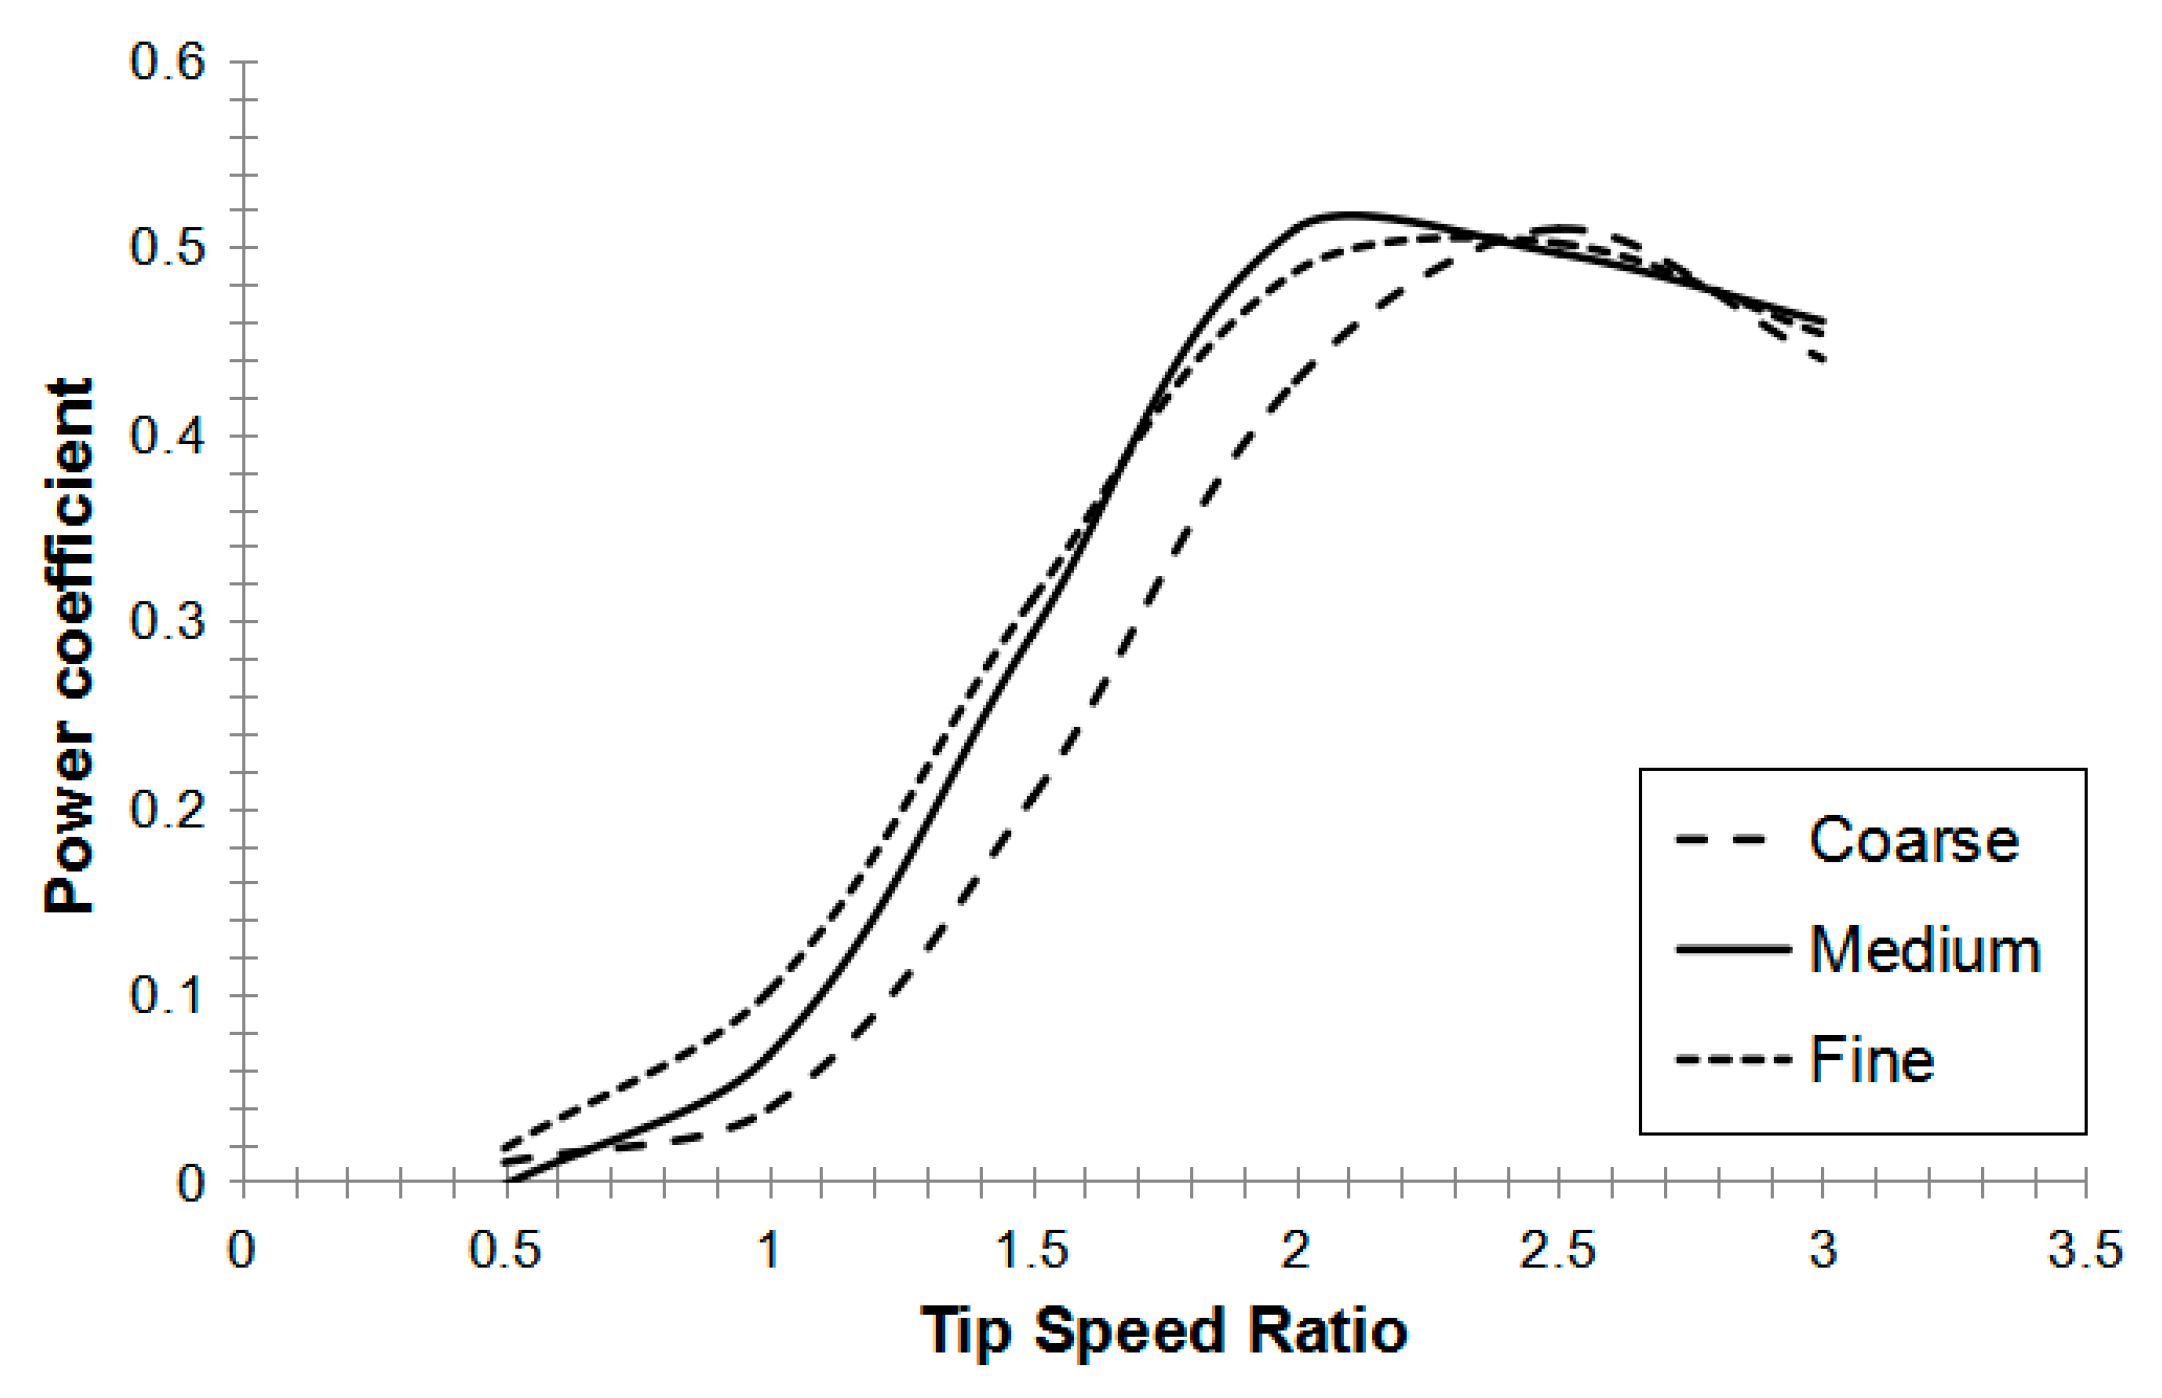
The average power coefficient was expressed as the product of the tip speed ratio with the corresponding average moment coefficient for each blade. The overall power coefficient for each studied geometry is illustrated as a function of the tip speed ratio in
Figure 9 and
Figure 10 for each mesh.
For the fine and medium mesh, the power coefficient reached its peak at a tip speed ratio value of 2. The relative error between the medium mesh and the fine one for the monitored parameter is 3.9% between the two values of the power coefficient for a tip speed ratio value of 2, whereas the relative error between the coarse mesh and the medium one is 13.8%. For higher tip speed ratios, the relative error is reduced, as observed in
Figure 9.
Regarding the asymmetric configuration (
Figure 10), the maximum values for the power coefficient were obtained at a tip speed ratio of 2 for the fine and medium mesh, and the relative error between the two was 4.4%. The relative error is mitigated for tip speed ratios higher than 2.5. For better visualization,
Figure 11 comparatively represents the power coefficient variation with tip speed ratio for both configurations for the fine mesh.
It can be observed from
Figure 11 that although the baseline wind turbine (classic H-Darrieus model) reaches its peak power coefficient earlier, the asymmetric wind turbine surpasses the performances of the classic configuration for tip speed ratios higher than 2. Furthermore, the decrease in power coefficient after the peak occurs more abrupt for the baseline, whereas the asymmetric model registers a slow controlled decrease for the discussed parameter. As observed, the proposed concept surpasses the performances of the baseline for low tip speed ratios, enhancing the start-up behaviour. In addition, for high tip speed ratios, it maintains its superiority; for a tip speed ratio of 3, the power coefficient is 10% higher than the baseline. In comparison, the baseline only tops the performance of the new concept for a tip speed ratio of 2, with approximately 5%. In order to evaluate if the maximum power coefficient achieved by the classic geometry has an impact on the amount of energy generated by the system, the power coefficient must be quantified over the studied operating period. To this extent the power coefficient curves presented in
Figure 11 were approximated by two mathematical equations, which were then mathematically integrated, and the results were compared.
Figure 12 illustrates the power coefficient variation with TSR for both studied geometries together with the curves for the polynomials that approximate them.
For the baseline model, the curve depicted in
Figure 12 is approximated by the following equation:
For the asymmetric configuration, the curve depicted in
Figure 12 is approximated by the following equation:
Equations (4) and (5) were integrated as follows:
When comparing the two results, it is clear that the asymmetric configuration is superior to the baseline by approximately 28% in terms of the power coefficient for the studied interval. Thus, the proposed asymmetric geometry generates the higher amount of energy during the operating conditions discussed.
Thus, the new concept not only facilitates the start-up process, but it also provides higher efficiency. Regarding the TSR value of two, the power coefficient penalty is minor compared to the advantages.
3.3. Vorticity Magnitude
In this subsection, the vorticity magnitude contours for each geometry at different tip speed ratios and different blade positions will be discussed. The contours will be presented for the following tip speed ratio values:
0.5—as it provides insight on blade-to-blade interaction at start-up;
2—as it represents the tip speed ratio for which the classic geometry attains its peak power coefficient;
2.5—as it represents the tip speed ratio for which the new asymmetric wind turbine geometry attains its peak power coefficient.
Figure 13,
Figure 14 and
Figure 15 depict the vorticity magnitude contours for the established tip speed ratios—0.5, 2 and 2.5—at different blade positions for both evaluated wind turbines.
For better visualization, the results for the different geometries are presented as a pair for each blade position. For low tip speed ratios that occur during start-up, such as 0.5, it can be observed that the blade-to-blade interaction is not very distinguishable. Moreover, the vorticity field is more pronounced for the asymmetric configuration and this effect transposes into a higher torque coefficient.
In
Figure 14, the vorticity contours are presented for a tip speed ratio of 2, the value for which the classic geometry achieves its peak power coefficient.
It can be observed that, for this case, the blade-to-blade interaction is more noticeable. For the baseline model, the vortices from one blade dissipate in the trailing edge of the next blade, thus acting as an aerodynamic break and preventing the wind turbine from accelerating further. The described behavior is most distinguishable in
Figure 14a for the first blade. This effect explains the abrupt diminishment in power coefficient after a tip speed ratio of 2 for the classic geometry. Comparing the two cases, is conspicuous that the asymmetric concept fulfilled its purpose and mitigated blade-to-blade interaction, as the blades’ and radii’s disposal prevents the vortices from a blade from dissolving into the next blade. The aerodynamic trail of one blade rather disintegrates in the vicinity of the next blade, but not on its surface, as for the baseline wind turbine. Additionally, it is noticeable that the vorticity field is more pronounced for the asymmetric configuration in comparison with the baseline, resulting in a lower power coefficient for the new configuration for this particular tip speed ratio, as discussed in the previous subsection. This is due to the new configuration’s self-starting capabilities, which enhance the torque coefficient. When correlating this behaviour with the vorticity field of the asymmetric geometry for a tip speed ratio of 2.5 (
Figure 15), it can be observed that the vorticity field is not as pronounced after the new geometry attains its peak power coefficient. It can be concluded from this that its properties that aid the self-starting of the turbine are persistent until the asymmetric configuration reaches its peak power coefficient.
Vorticity magnitude contours for a tip speed ratio value of 2.5, for which the baseline starts its abrupt decrease in efficiency and the asymmetric one reaches its peak power coefficient, are illustrated in
Figure 15.
For higher tip speed ratios, the vortices become more and more prominent, hence the negative impact of the blade-to-blade interaction for the baseline is accentuated, whereas the property of the asymmetric one that alleviates this effect is highlighted. This phenomenon is best pictured in
Figure 15c,d, where it is easily discernible that the blade distribution for the new concept successfully improves its quality to limit negative blade-to-blade interactions.
4. Conclusions
The current research aimed to numerically validate a new asymmetric wind turbine concept. The main objective of the study was achieved by means of CFD analysis, and the results are supportive of the proposed approach regarding wind turbine design.
As a result, from the numerical investigation, conclusions were drawn regarding the start-up behavior for the new concept in comparison with a classic geometry, as well as the efficiency and the blade-to-blade interaction. The latter one was most definitely improved, as highlighted in the previous section. Regarding the efficiency, the baseline model reached its maximum power coefficient faster than the new proposed model at a tip speed ratio value of 2, but its decrement afterwards was hasty. On the other hand, the new asymmetric concept attained its peak power coefficient for a tip speed ratio value of 2.5, and from there, its reduction was smooth. The asymmetric proposed concept reaches power coefficients of up to 10% higher than those of the baseline. Furthermore, for low starting tip speed ratios, such as 0.5, the new proposed geometry registered higher torque coefficients compared to the baseline, this being associated with an improved start-up behavior, as concluded from the current state of the art discussed in the introduction section.
To conclude with, the results gained from the numerical evaluation of the new asymmetric wind turbine concept are promising, and it represents an innovative approach towards passive flow control methods, which should be further studied. Future work will include the experimental validation of the results in order to assess the accuracy of the proposed methodology.


