
Development and Operation Modes of Hydrogen Fuel Cell Generation System for Remote Consumers’ Power Supply

 ,
, 
 and
and 
Abstract
:1. Introduction
- -
- consumers along the oil and gas pipelines (for example: electrochemical protection, linear telemechanics, radio relay communication equipment, cleaning device launchers);
- -
- stationary railway objects (communication devices, automatic crossing signaling);
- -
- autonomous meteorological and telecommunication stations.
2. Analysis and Selection of the Hydrogen Fuel Cell Generation System Main Units
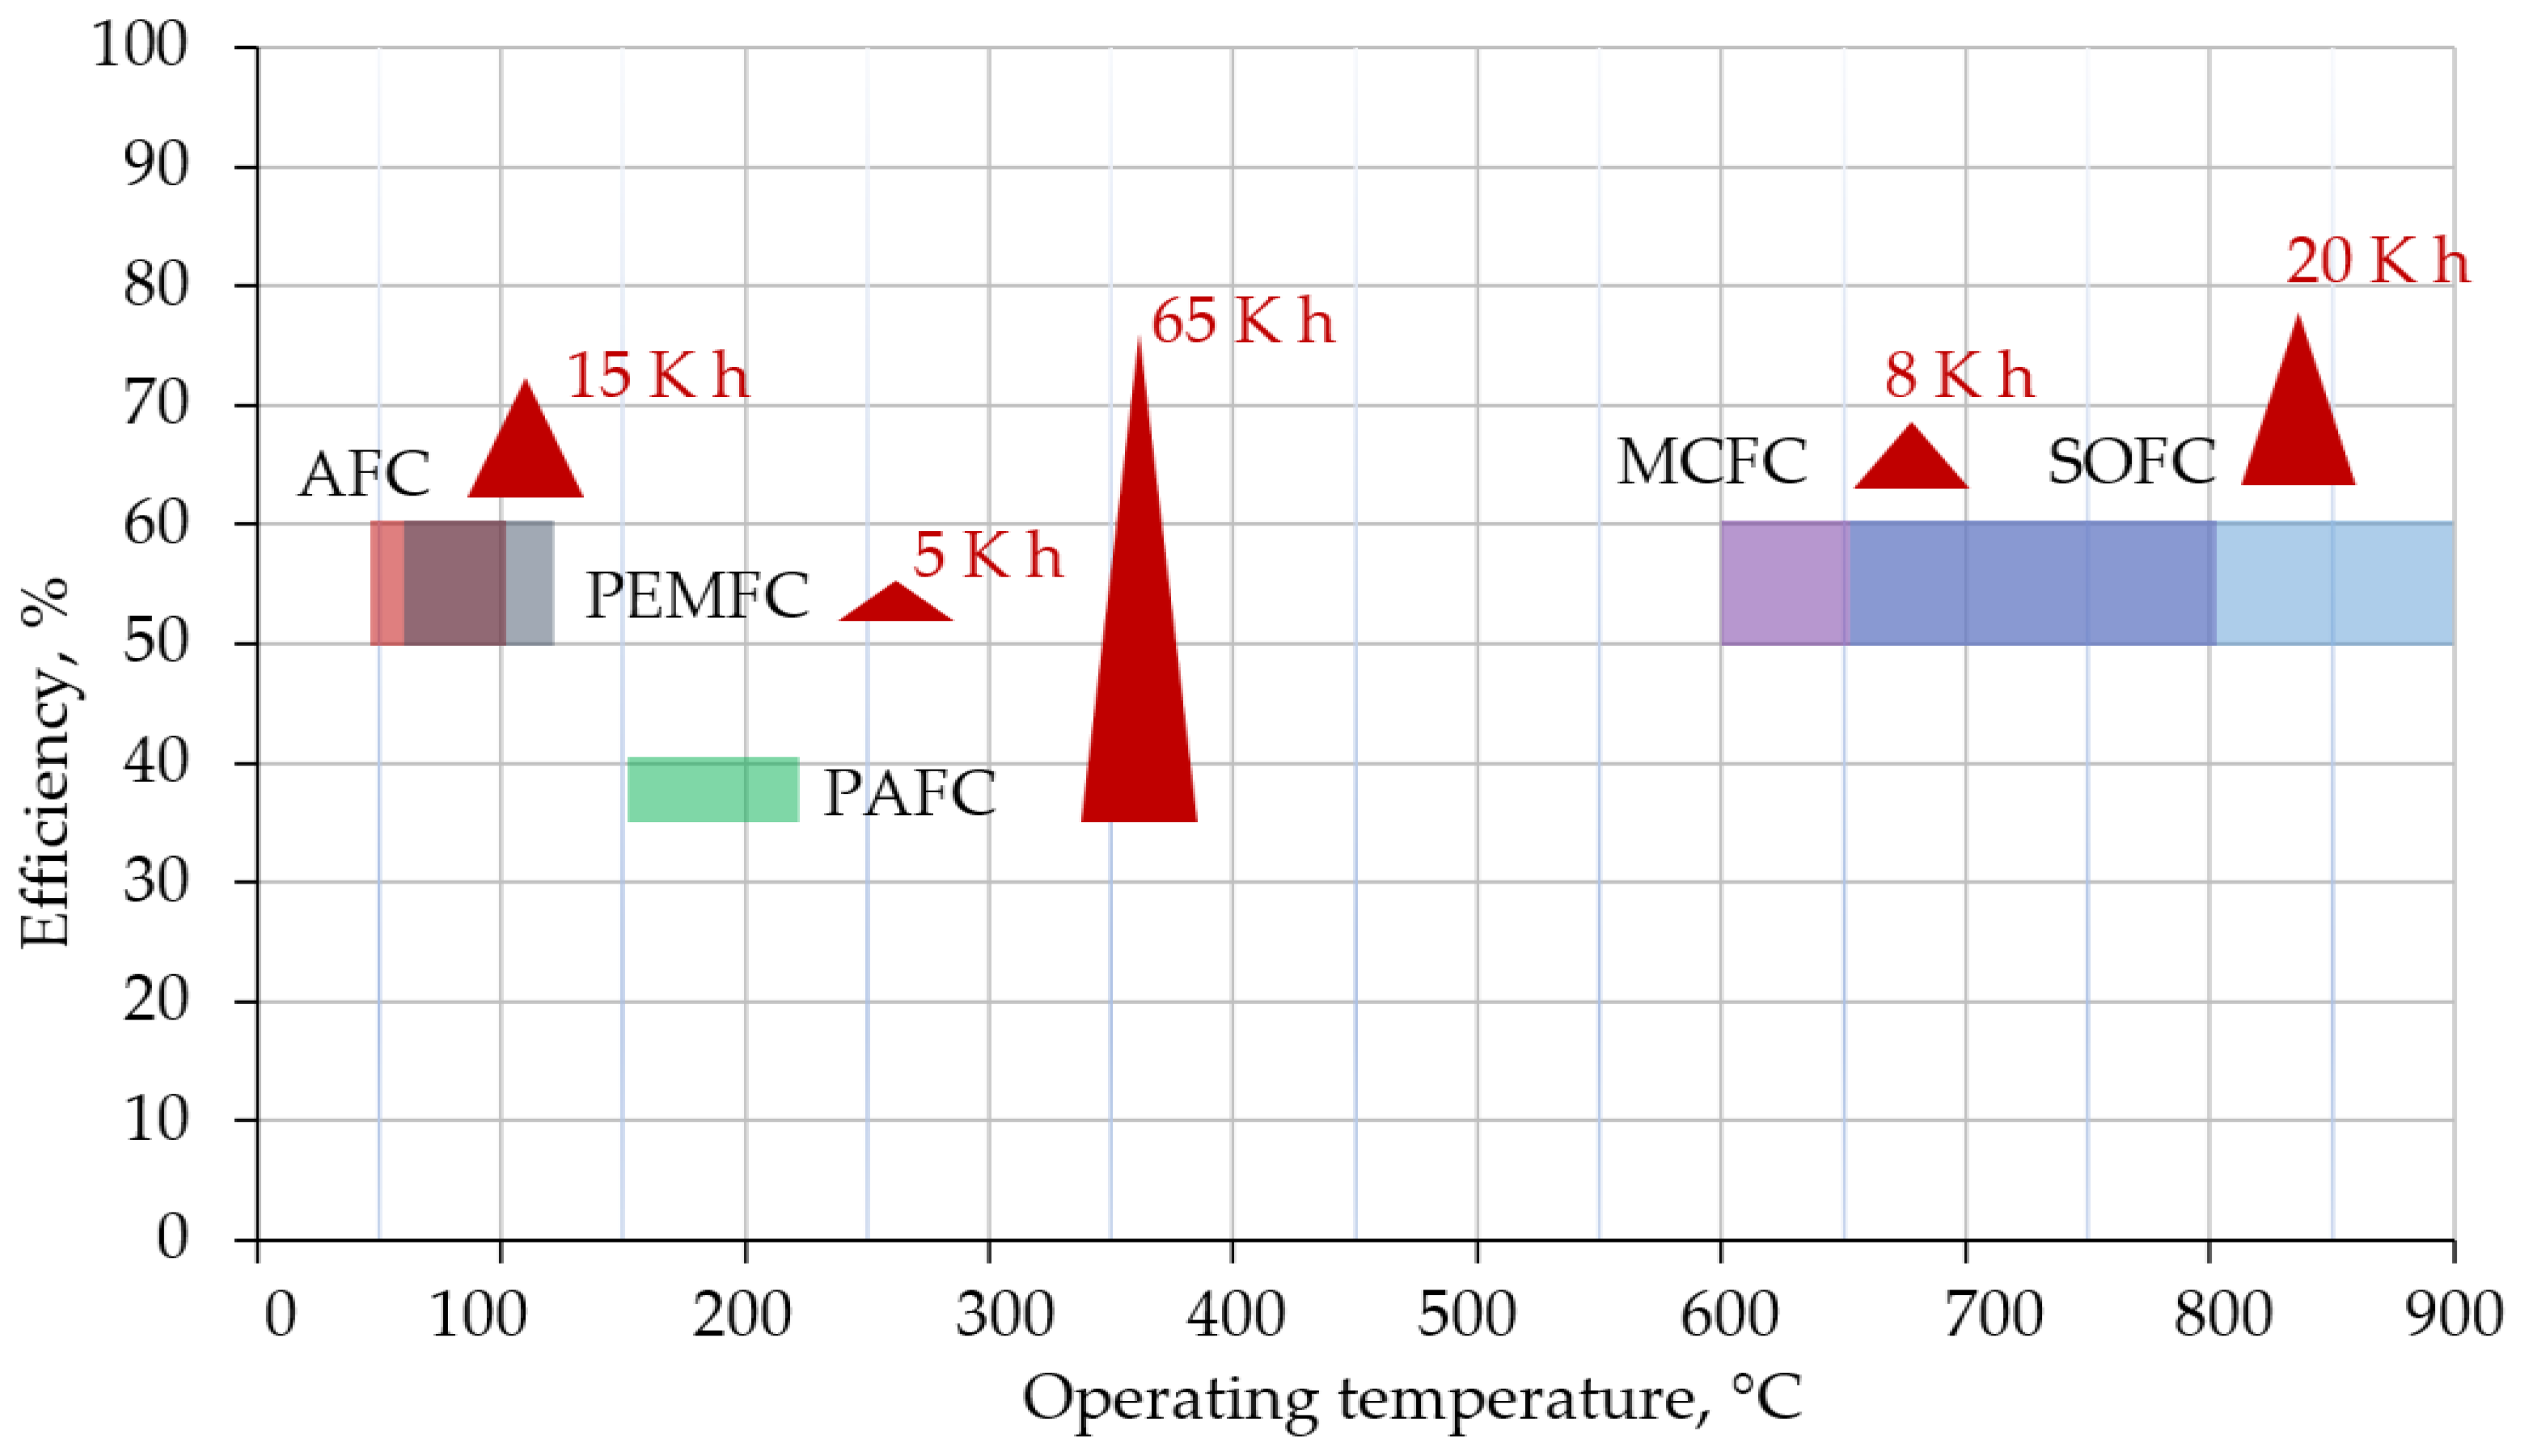
2.1. Fuel Cells
- fuel cells with a polymer or proton exchange membrane—PEMFC;
- fuel cells with alkaline electrolyte—AFC;
- fuel cells with phosphate electrolyte—PAFC;
- fuel cells with molten carbonate—MCFC;
- fuel cells with solid oxide electrolyte—SOFC.
- high electricity generation efficiency;
- low requirements for fuel quality (to reduce the cost of special preparation and large fuel volumes processing);
- the possibility of additional use of the heat released by the fuel cell (to increase the overall source efficiency).
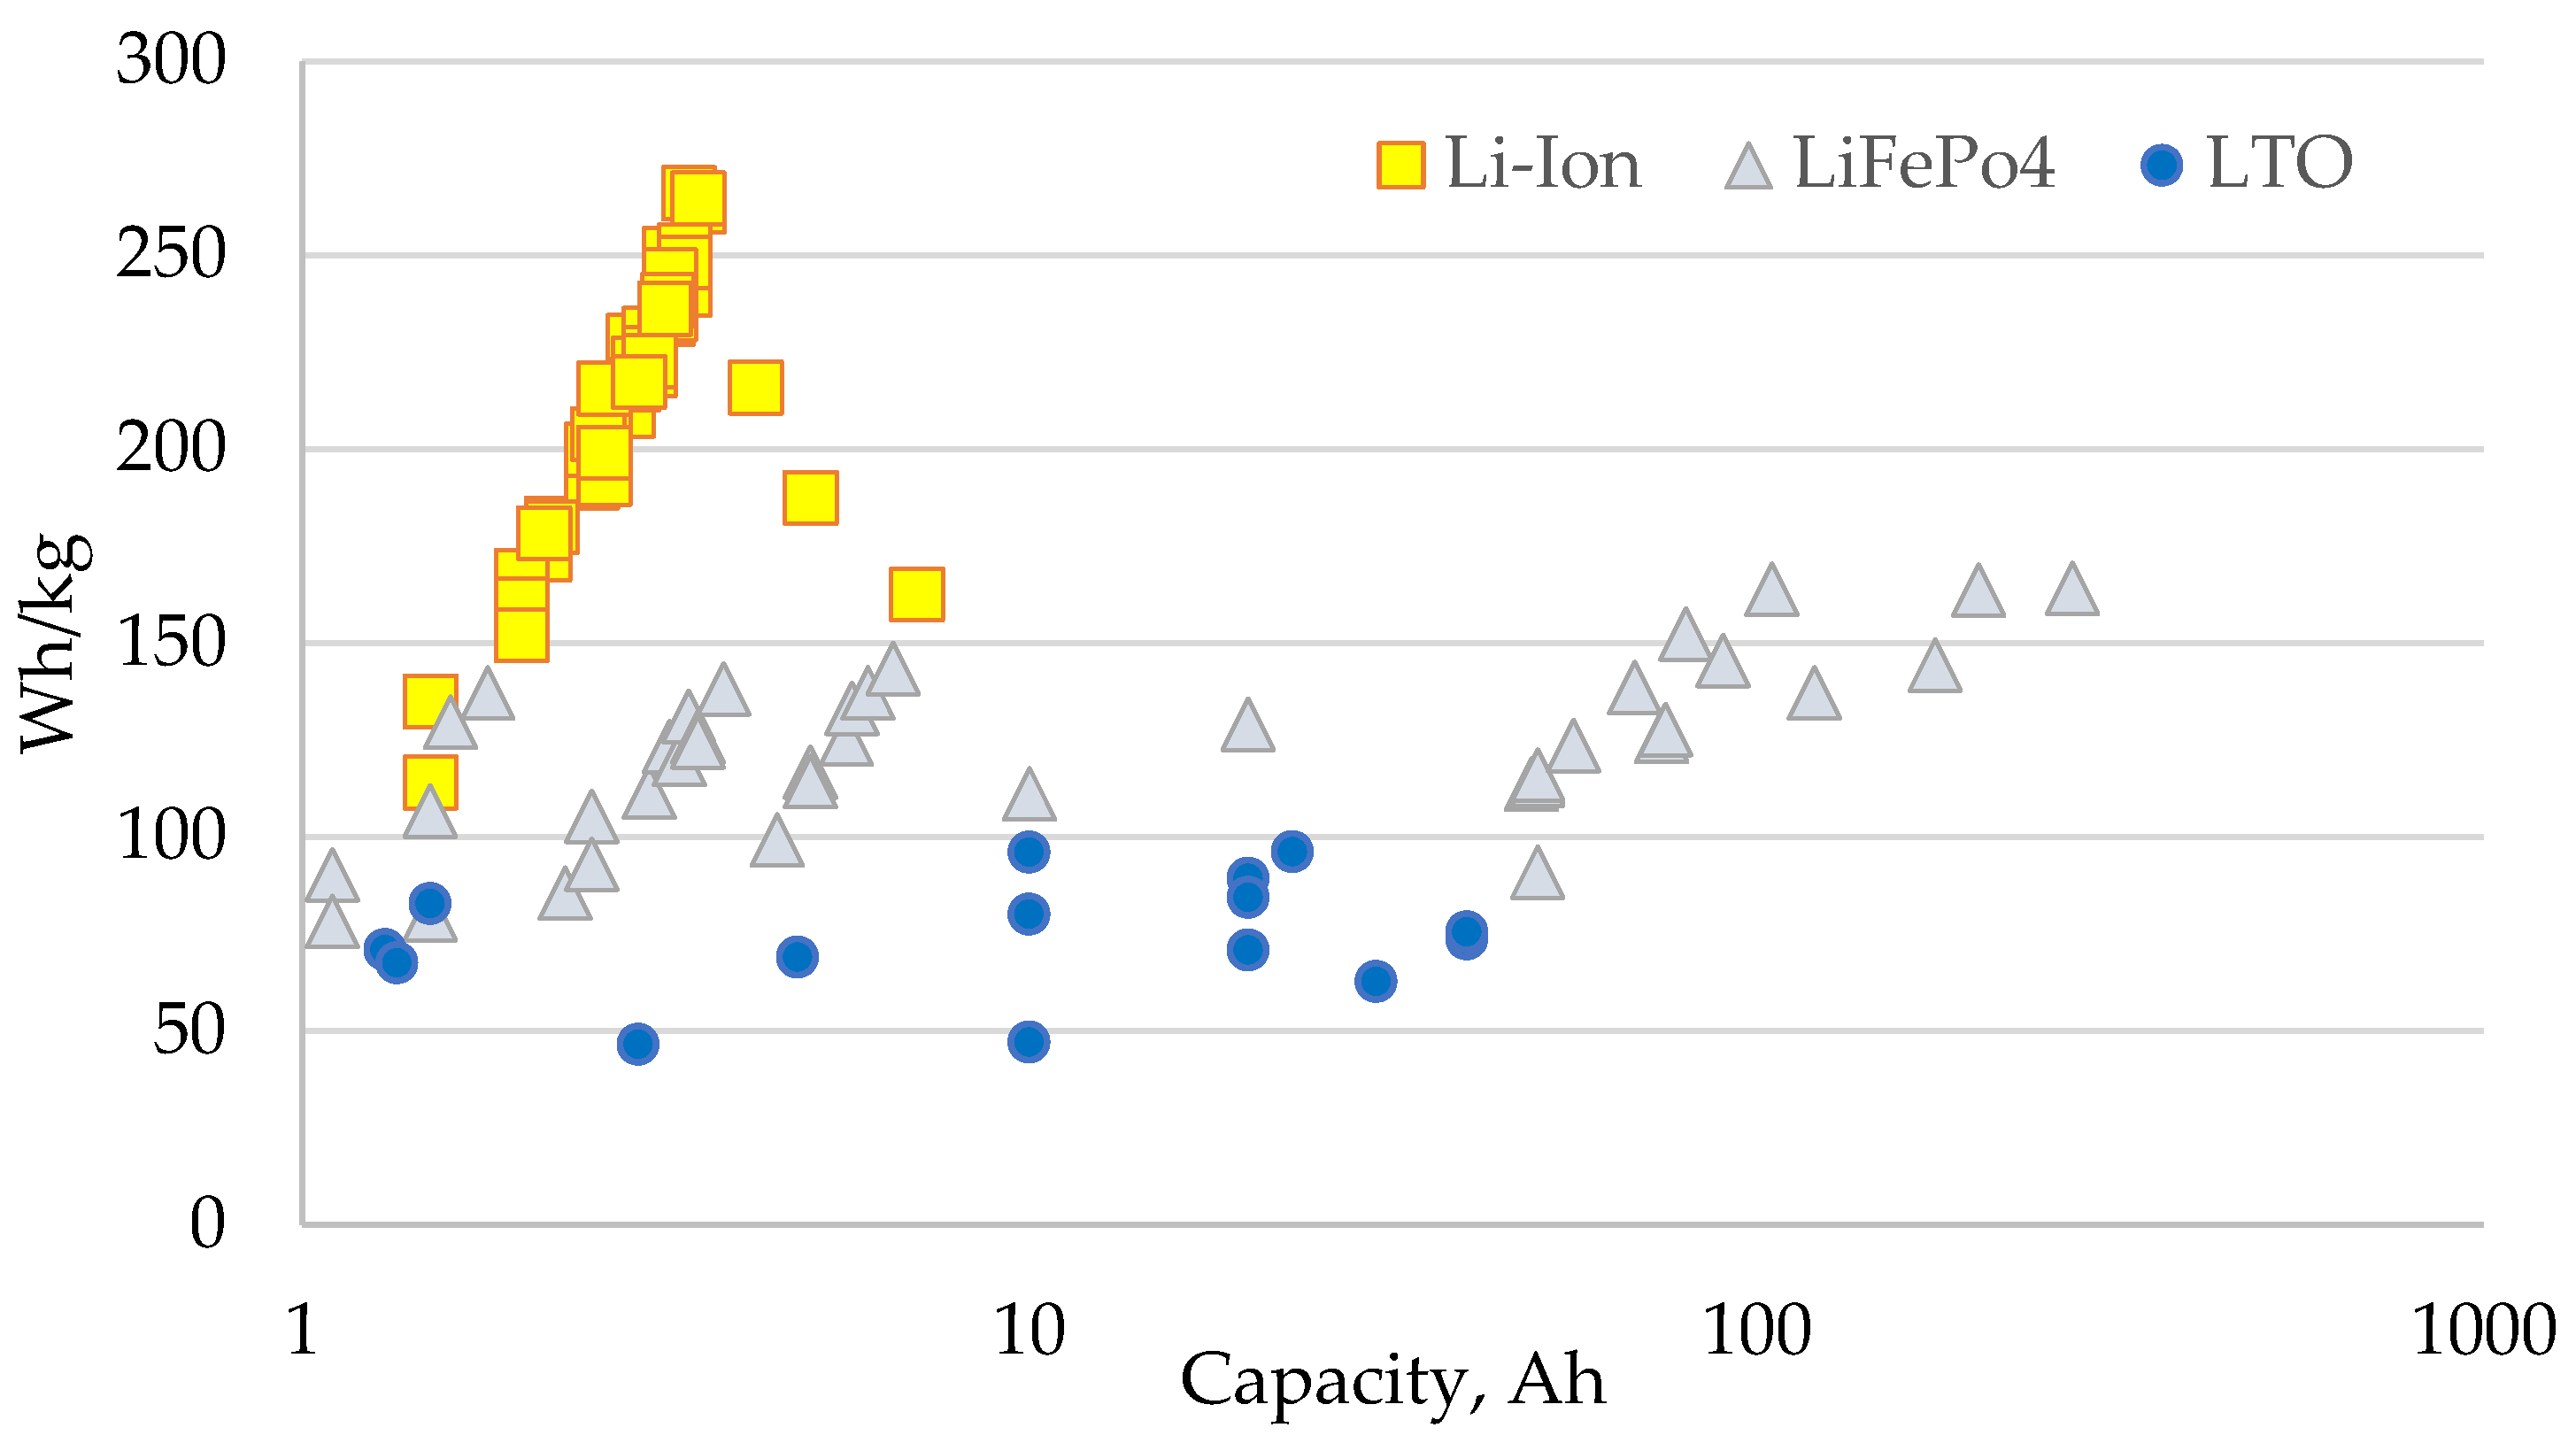
2.2. Battery Storage
3. Materials and Methods
3.1. Calculation of Fuel Cells Internal Resistance
3.2. Battery Storage Parameters Calculation
3.3. Filter Capacitance Values Calculation
3.4. AVI Output Voltage Modulation Depth Calculation
3.5. Converter Output Voltage Boost Coefficient Calculation
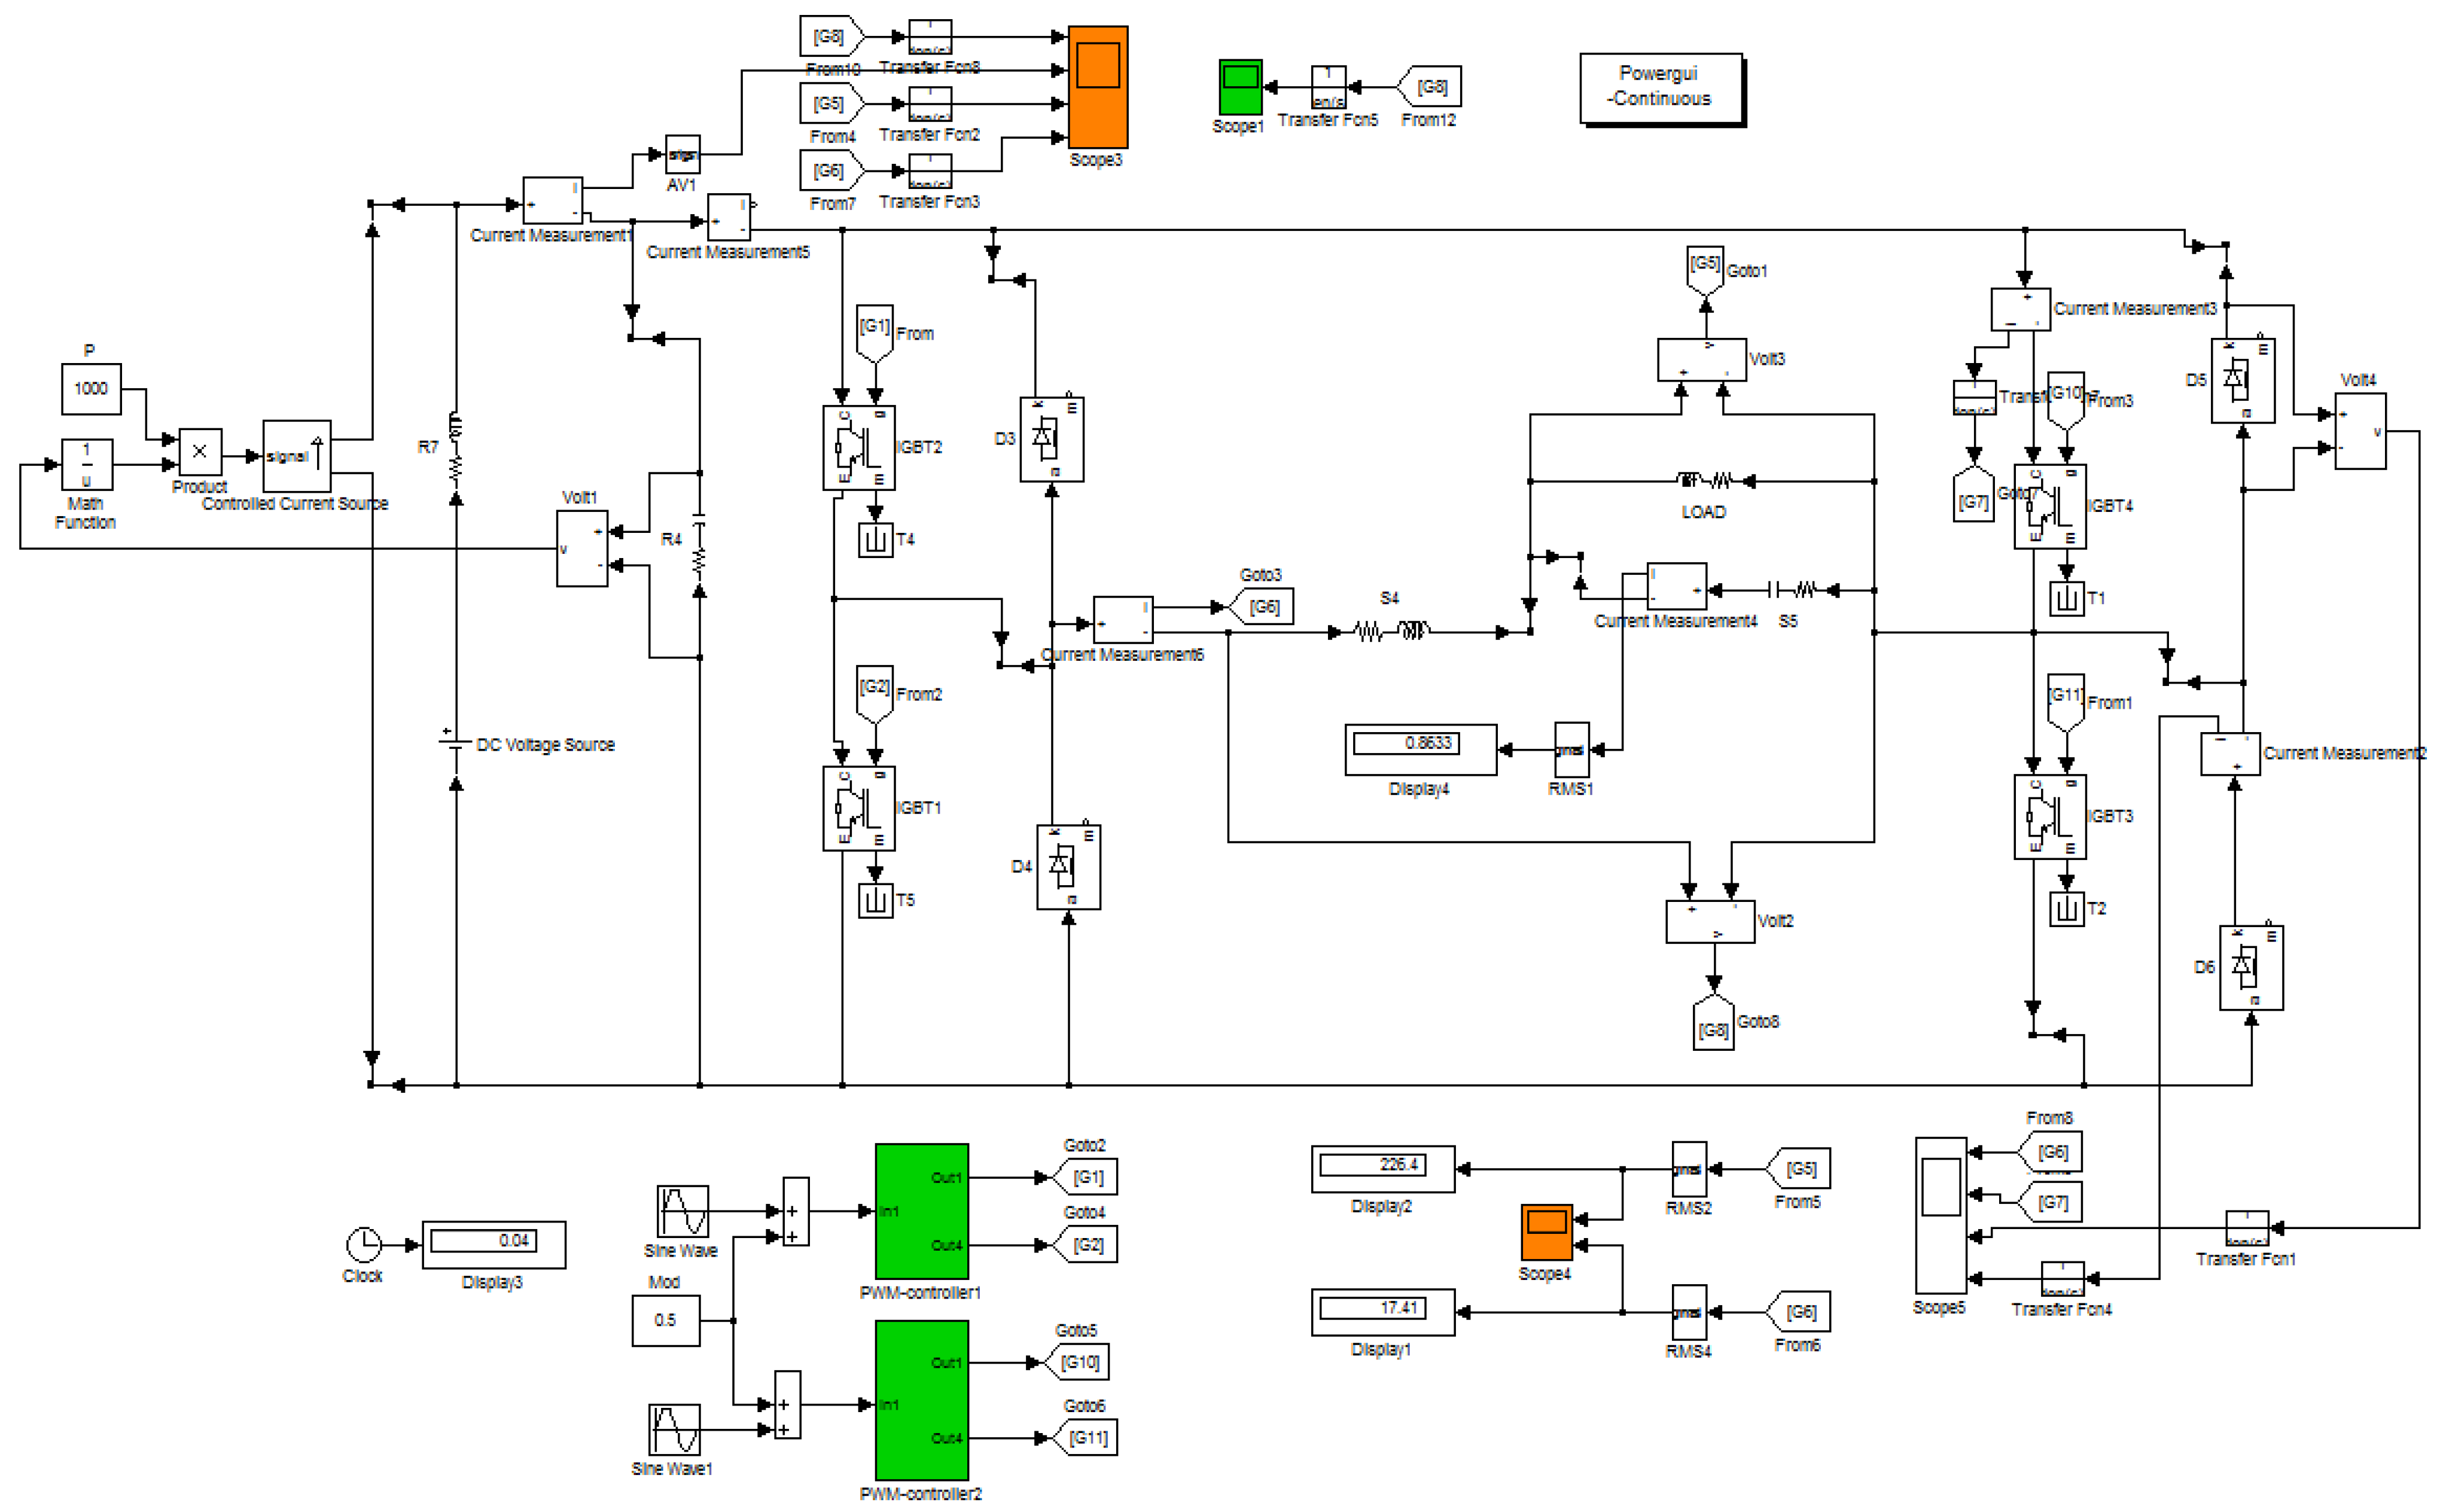
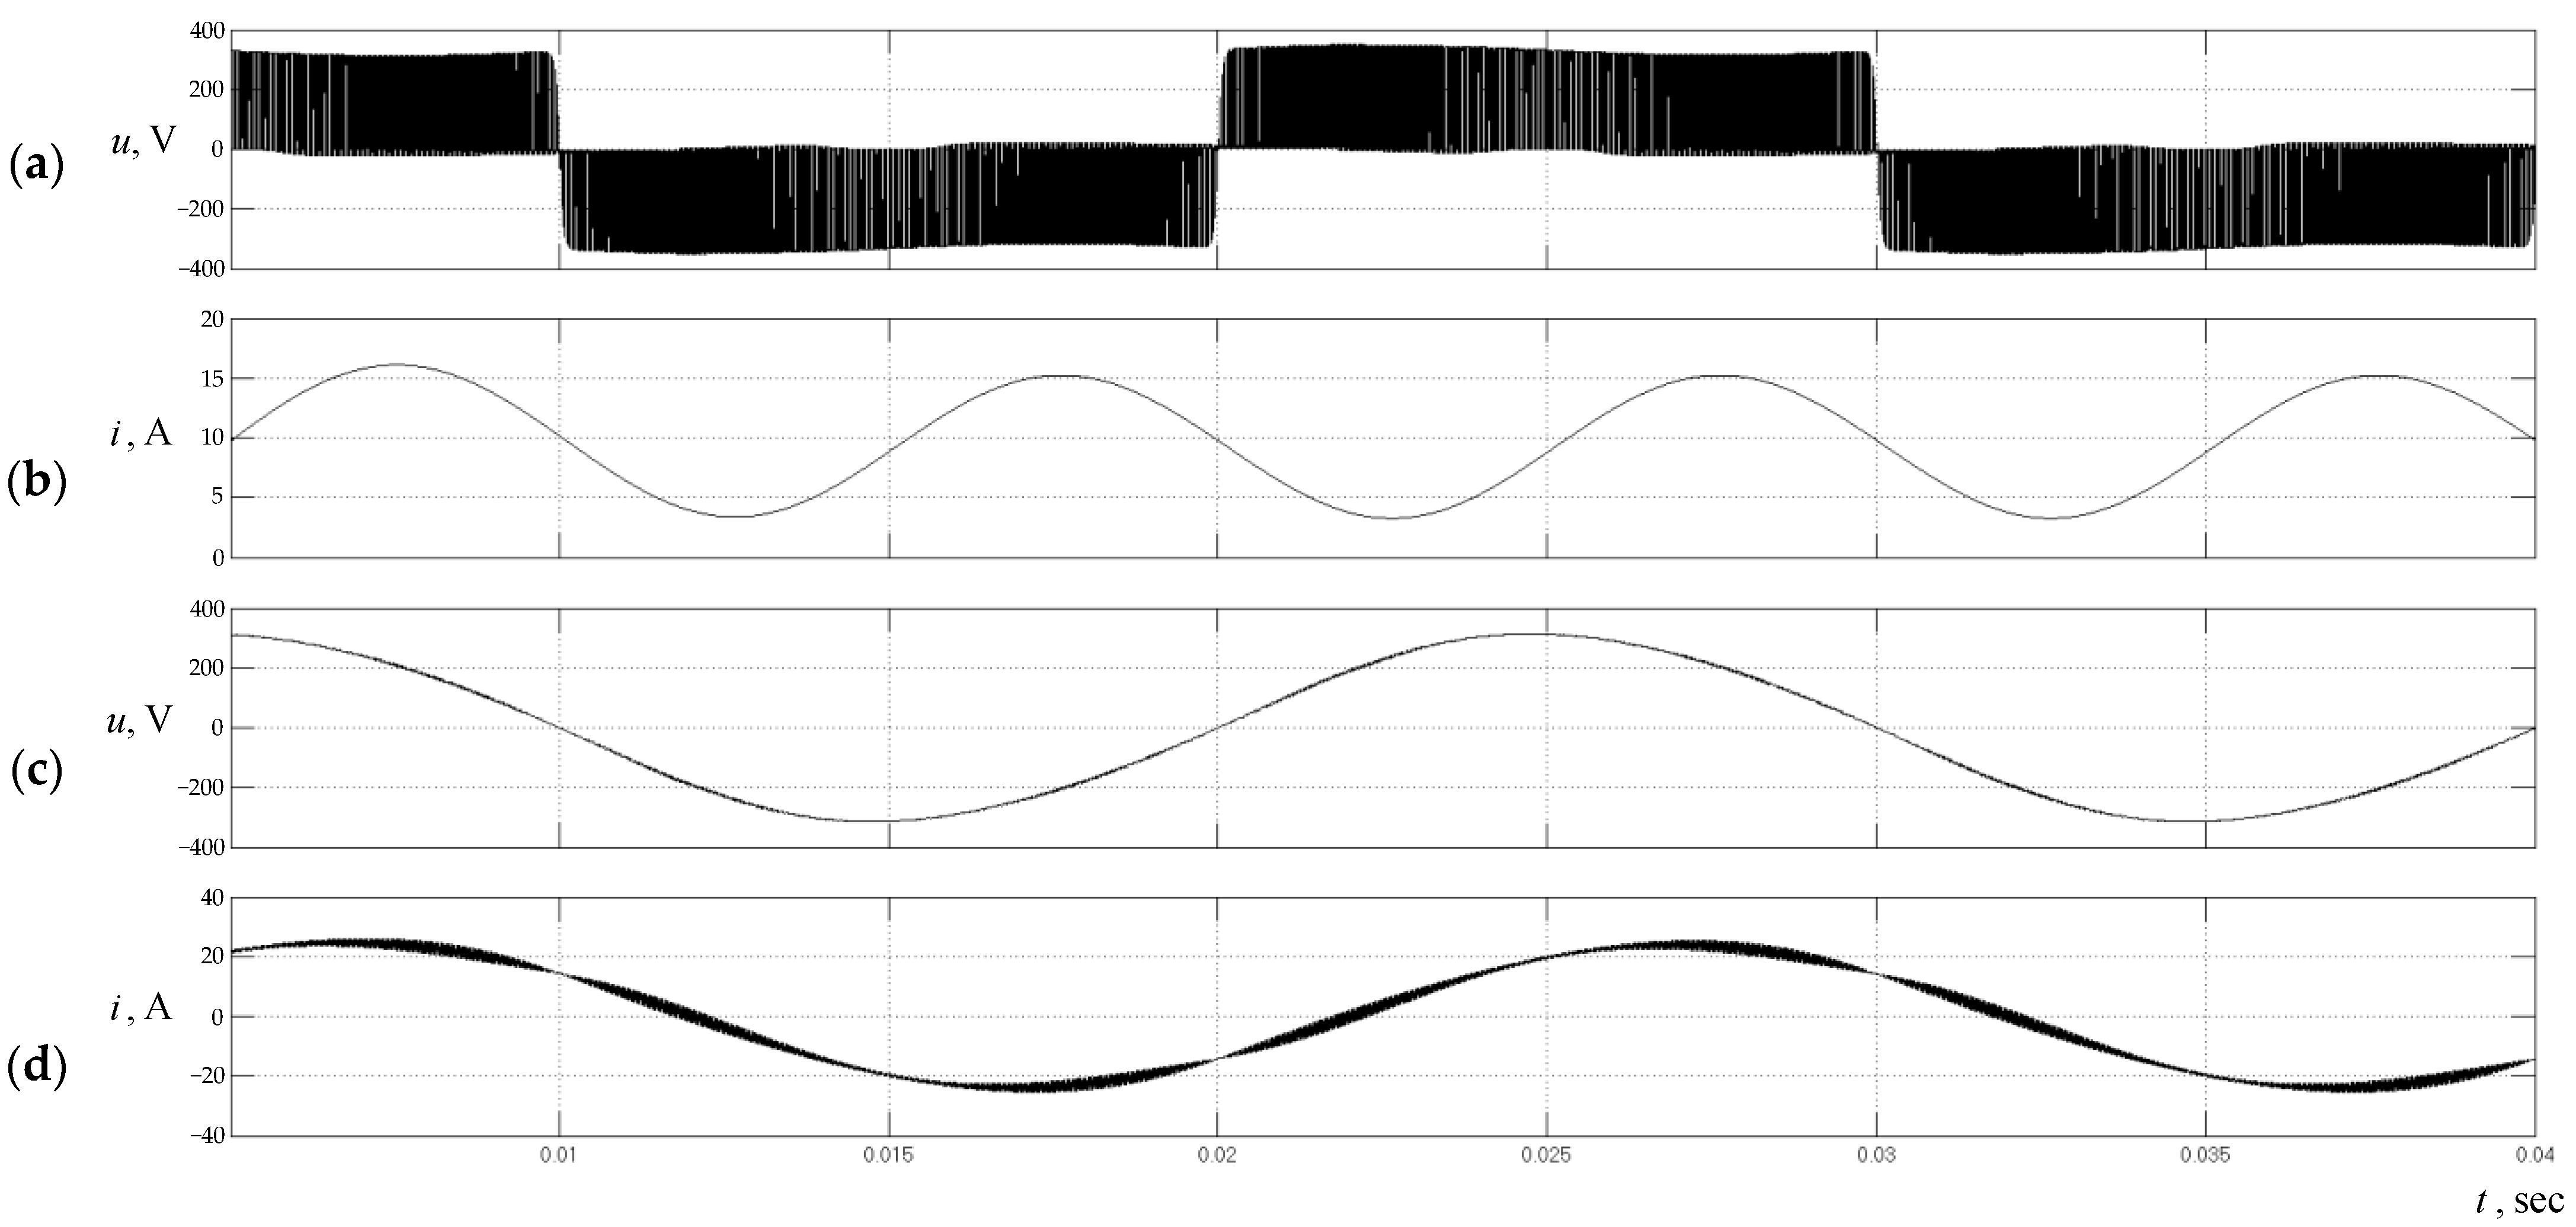
4. Simulation Modeling of Hydrogen Fuel Cell Generation System Operation Modes
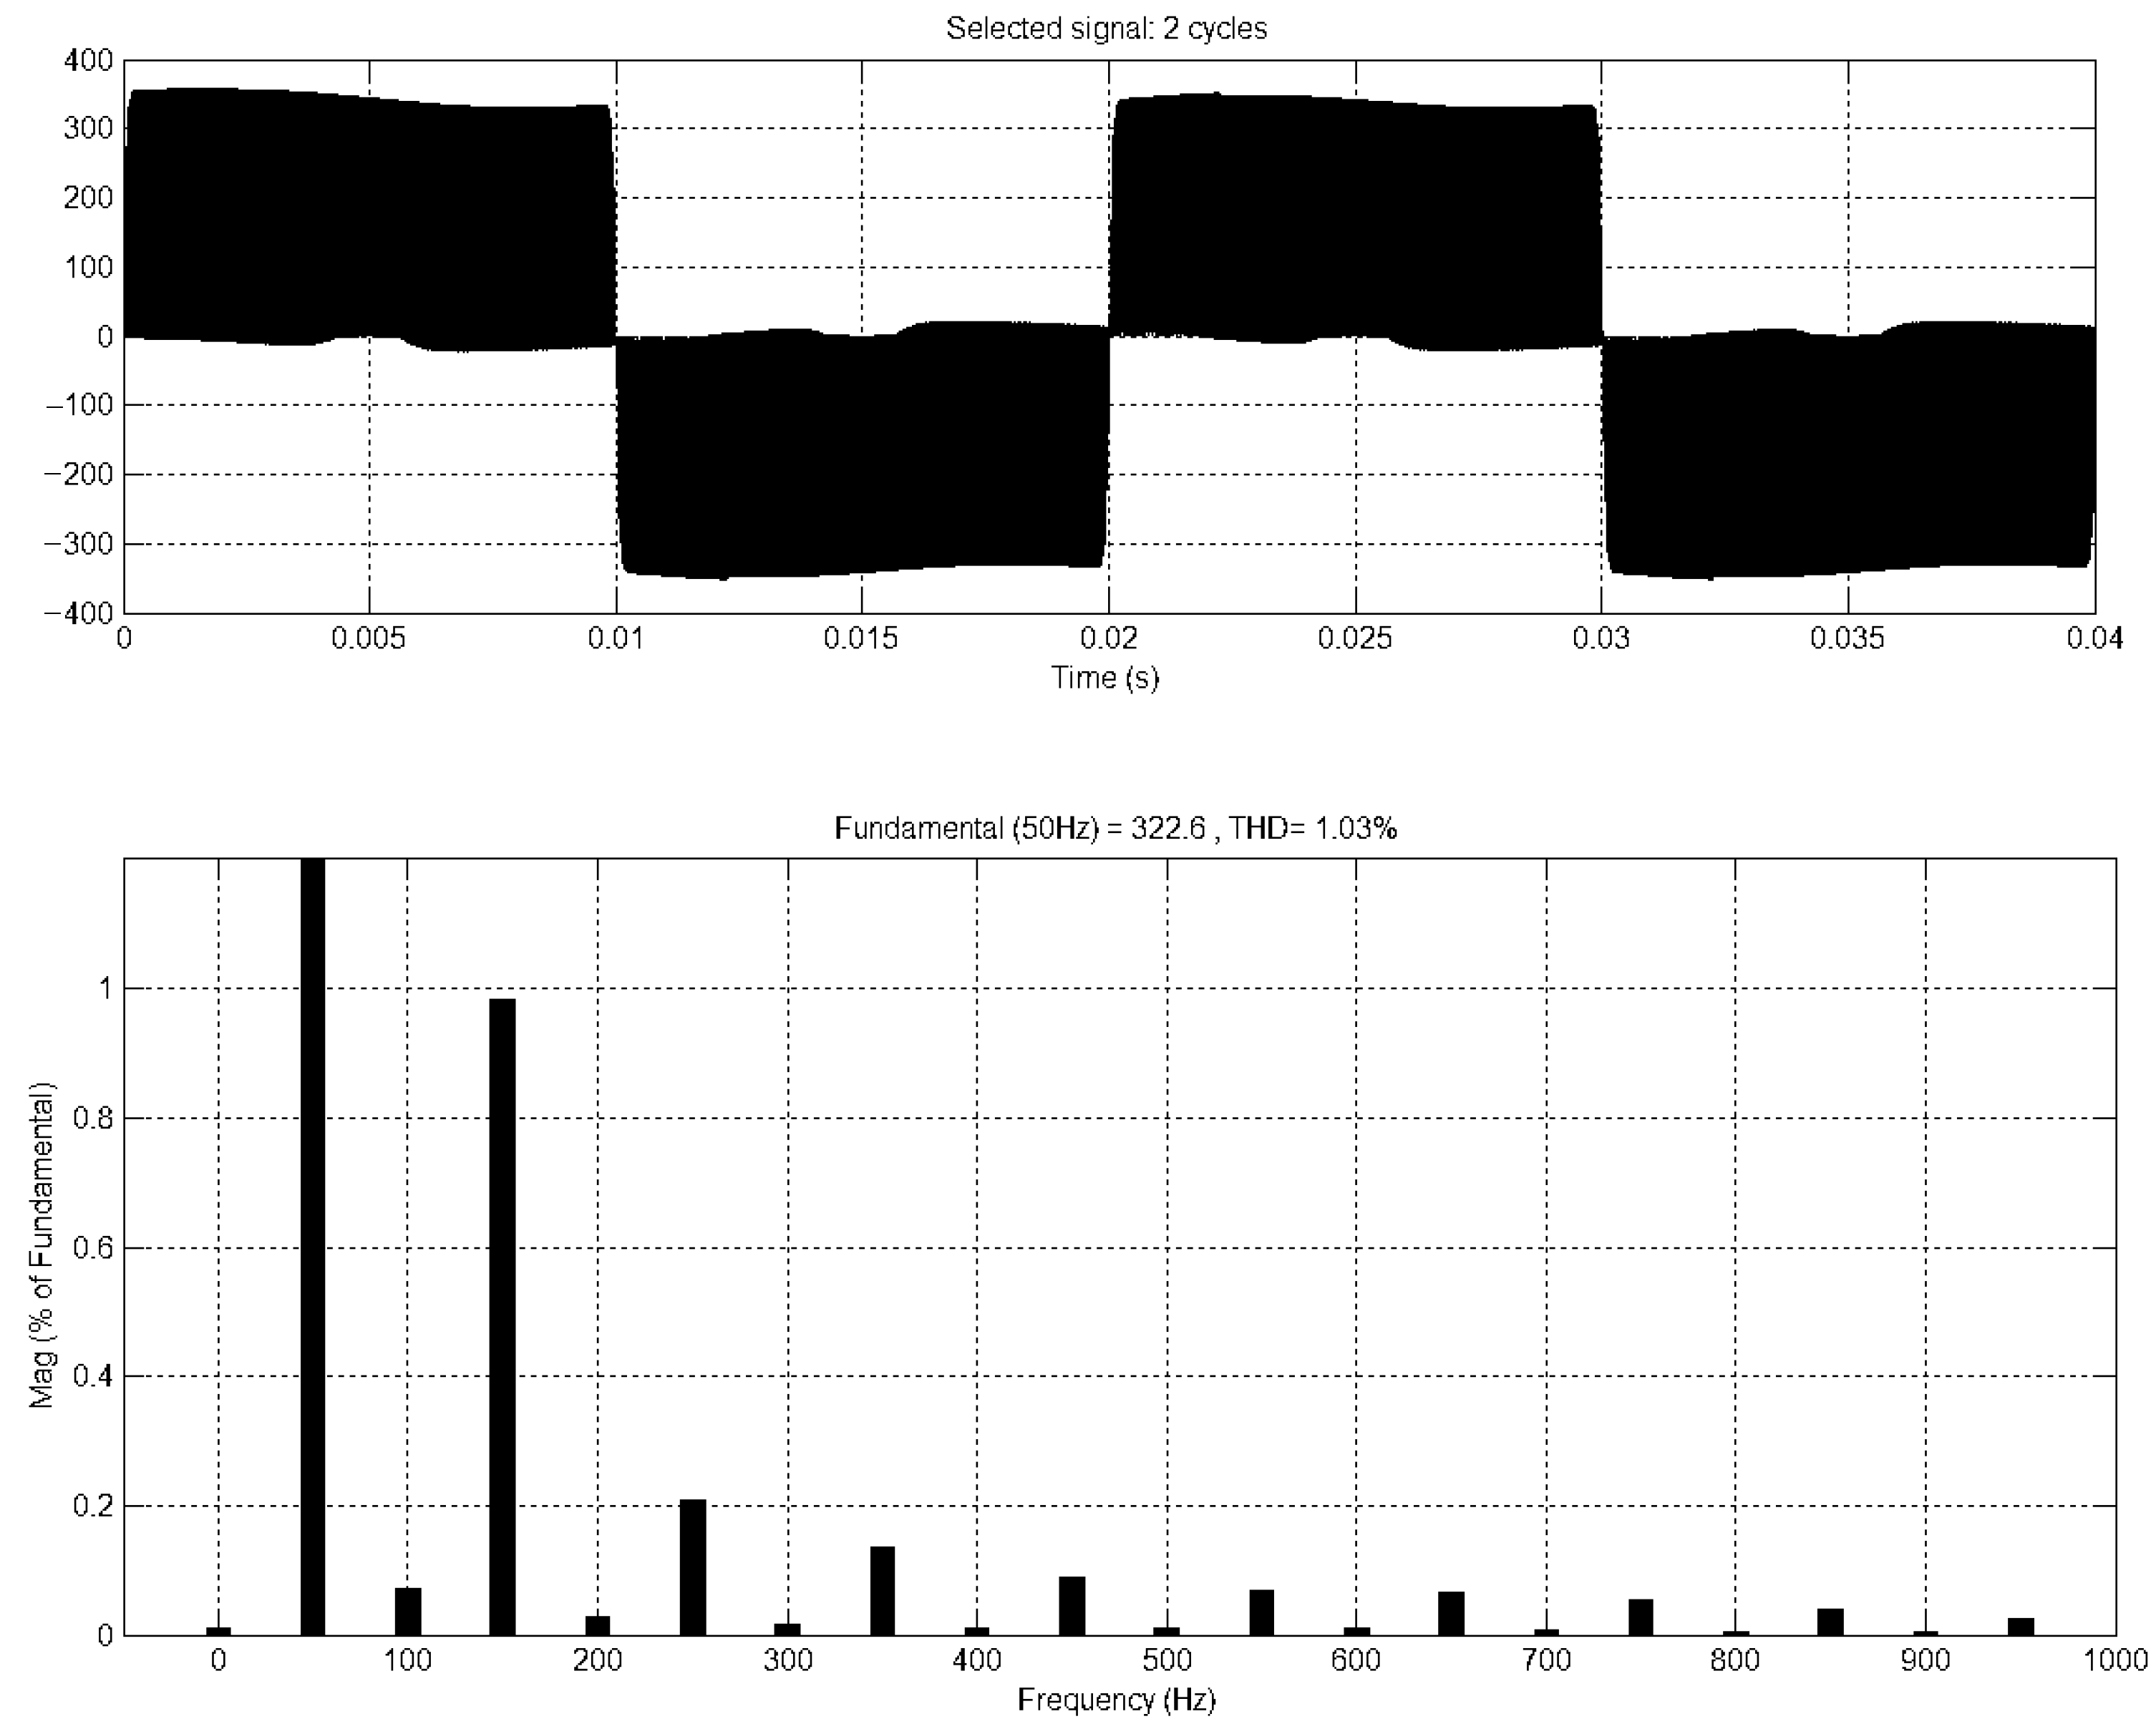
5. Results and Discussion
6. Cost Estimation of Electric Power Generated by Hydrogen Fuel Cell Generation System
- •
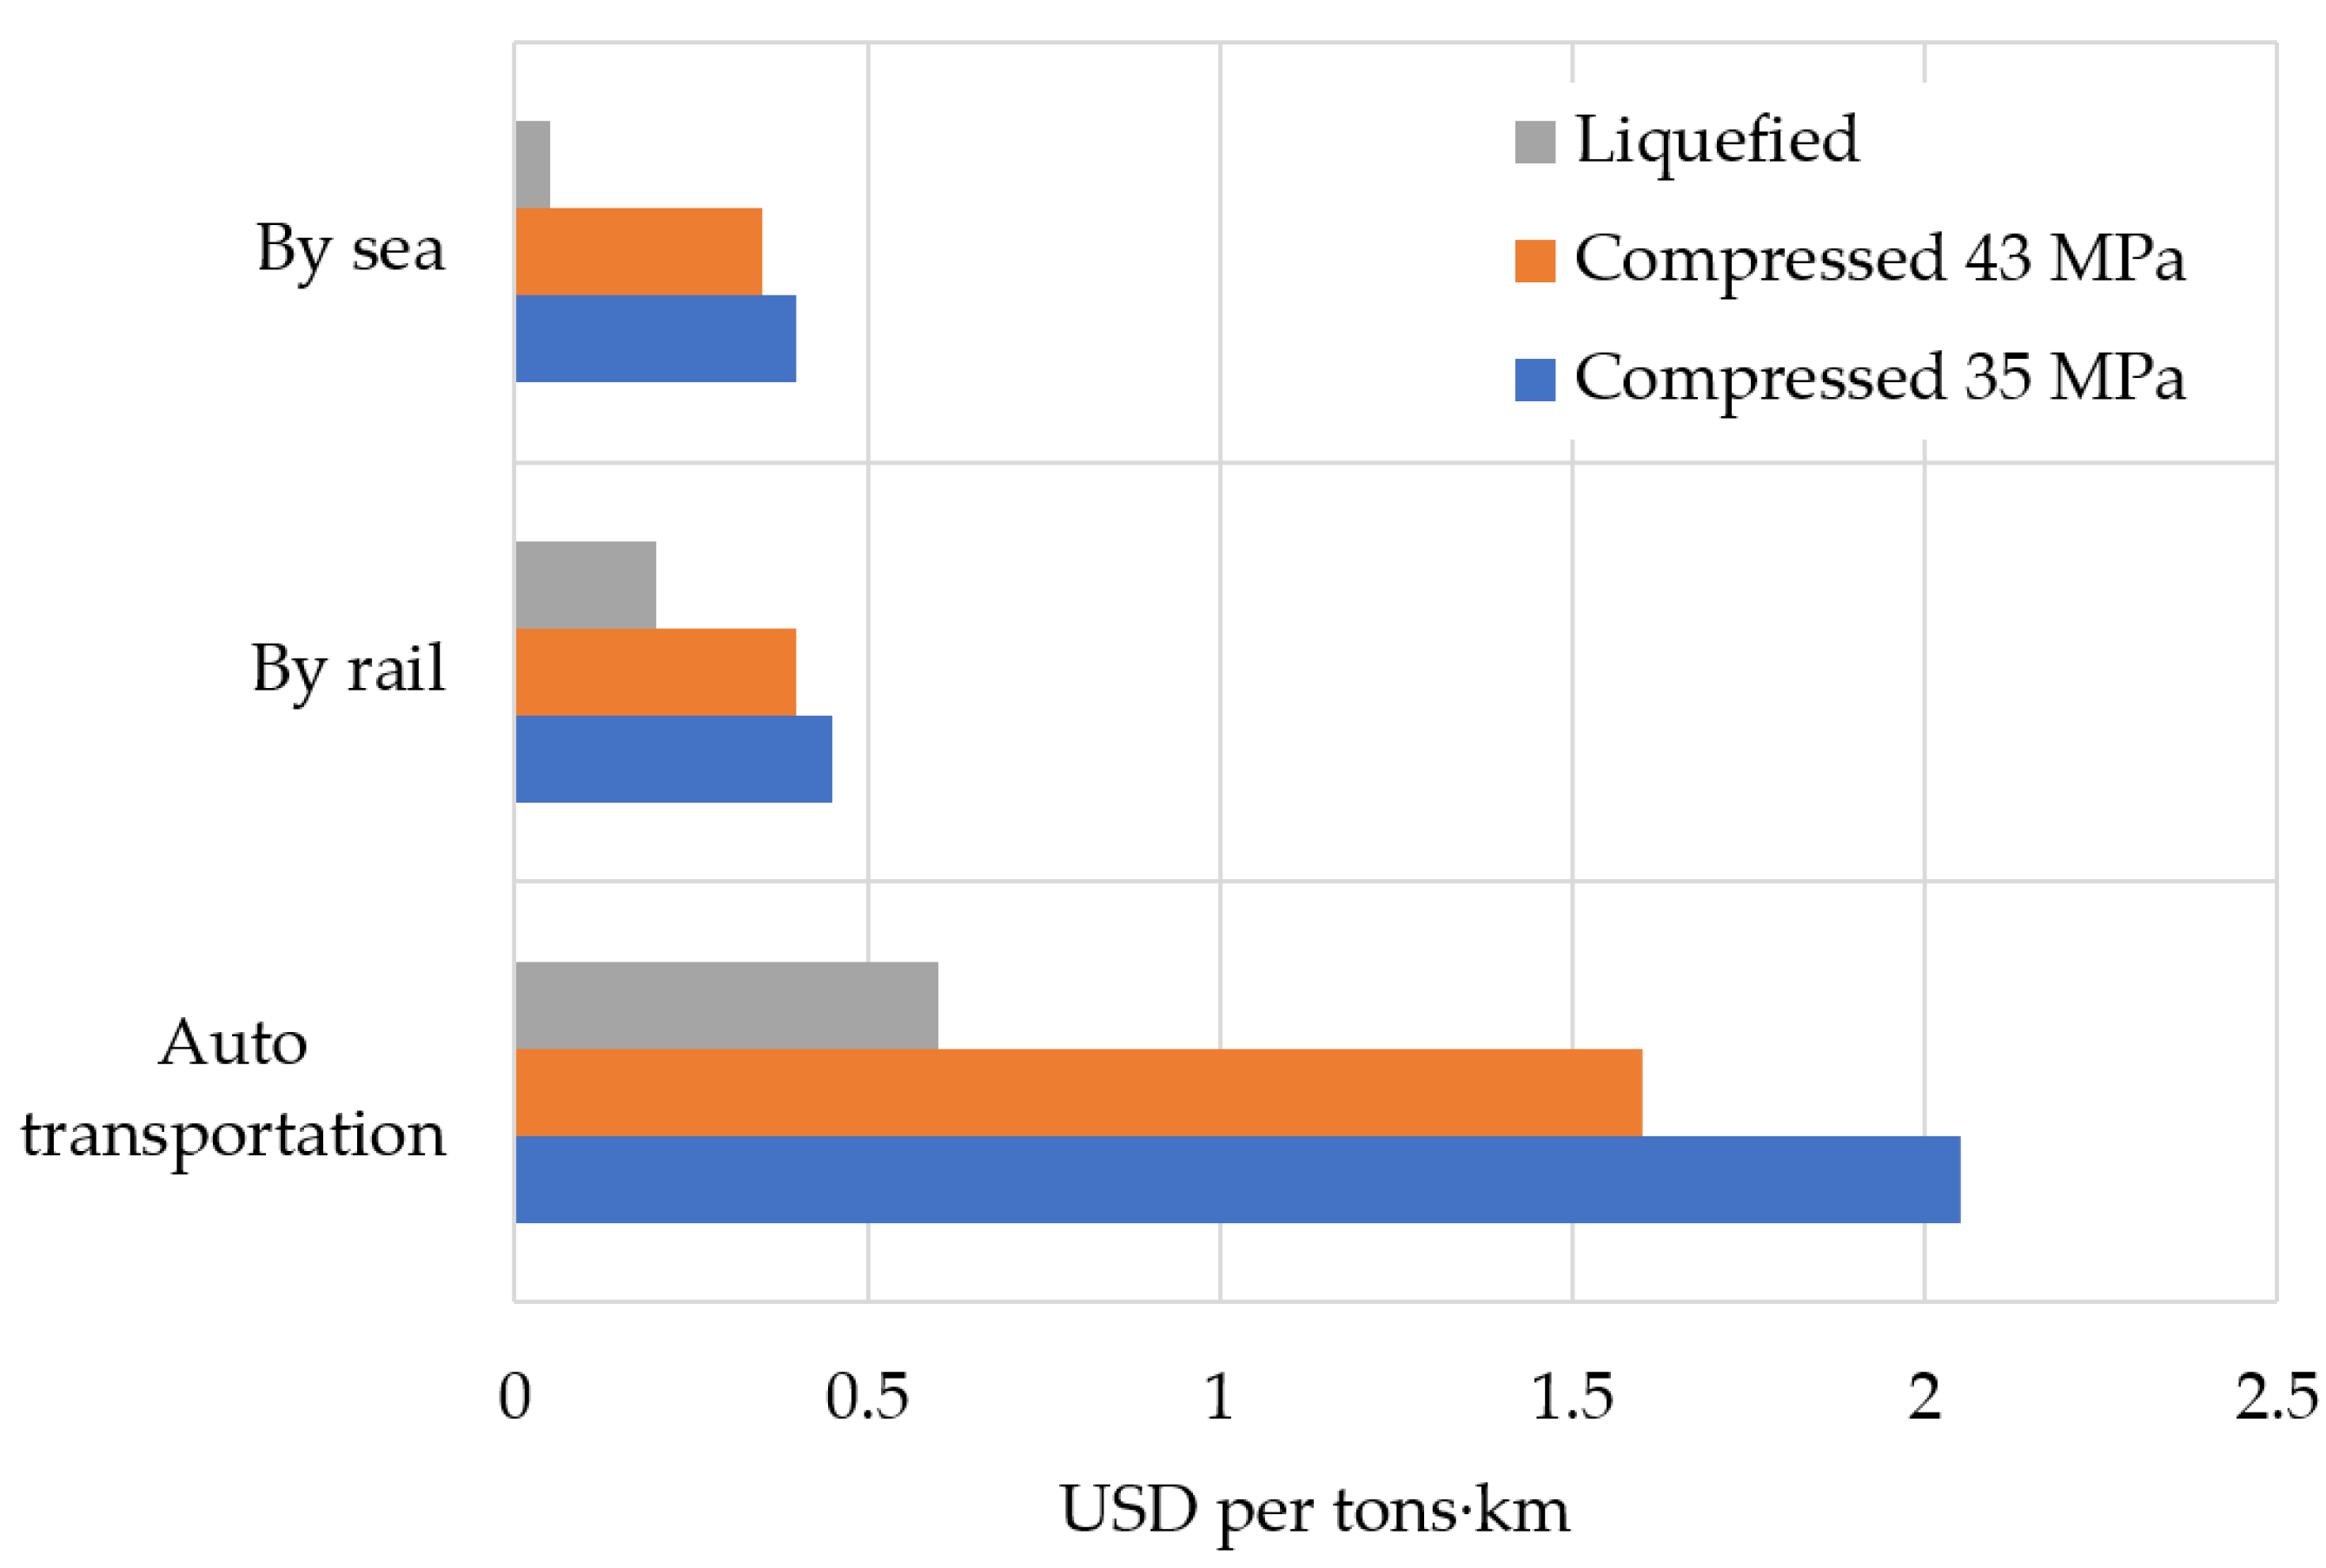
- Hydrogen cost. The price of hydrogen may vary depending on the country of origin and the prices of fossil fuels in it, on the method of producing hydrogen (steam reforming of hydrocarbons, gasification of solid fuels, thermochemical decomposition of water using the energy of a high-temperature gas-cooled reactor (HTGR), electrolysis of water), its transportation (by pipeline or in cylinders) and its state (compressed or liquefied). The methods to produce hydrogen differ in the amount of costs for electricity, H2O, natural gas, etc. In addition, each method of producing H2 is characterized by a different amount of CO2 emissions;
- •
- The power of the hydrogen plant, its duty factor and its fuel consumption;
- •
- Cost of greenhouse gas emissions and hydrogen plant utilization after the end of its life.
7. Conclusions
Author Contributions
Funding
Institutional Review Board Statement
Informed Consent Statement
Data Availability Statement
Conflicts of Interest
References
- Voropay, N.I. Prospects and problems of electric power system transformations. Electrichestvo 2020, 7, 12–21. [Google Scholar] [CrossRef]
- Pethaiah, S.S.; Sadasivuni, K.K.; Jayakumar, A.; Ponnamma, D.; Tiwary, C.S.; Sasikumar, G. Methanol electrolysis for hydrogen production using polymer electrolyte membrane: A mini-review. Energies 2020, 13, 5879. [Google Scholar] [CrossRef]
- Sosnina, E.; Shalukho, A.; Veselov, L. Application of SOFCs on biogas in power supply systems for agricultural enterprises. Smart Electr. Eng. 2020, 4, 27–41. [Google Scholar] [CrossRef]
- Hemmes, K. A personal retrospect on three decades of high temperature fuel cell research; ideas and lessons learned. Int. J. Hydrogen Energy 2021, 46, 14962–14976. [Google Scholar] [CrossRef]
- Zhou, S.; Cui, Q.; Zhang, M.; Xia, G.; Wang, K. Study on the management of fuel cell vehicle energy system using hybrid fuzzy logic controller. Power Gener. Technol. 2018, 39, 554–560. [Google Scholar] [CrossRef]
- Li, G.; Chen, J.; Zheng, X.; Xiao, C.; Zhou, S. Research on energy management strategy of hydrogen fuel cell vehicles. In Proceedings of the 2020 Chinese Automation Congress (CAC), Shanghai, China, 6–8 November 2020; pp. 7604–7607. [Google Scholar] [CrossRef]
- Choi, H.-J.; Park, S.-J.; Choi, J.-S.; Cha, I.-S.; Yoon, J.-P.; Suh, J.-S.; Gun, S.-D. An analysis of PEMFC & photovoltaic 500W hybrid system. In Proceedings of the 7th International Conference on Power Electronics, Daegu, Korea, 22–26 October 2007; pp. 522–524. [Google Scholar] [CrossRef]
- Khurshid, O.; Saher, S.; Qamar, A. Power generation by hybrid approach solar PV/battery power/hydrogen generation/fuel cell. In Proceedings of the 2019 International Conference on Electrical, Communication, and Computer Engineering (ICECCE), Swat, Pakistan, 24–25 July 2019; pp. 1–4. [Google Scholar] [CrossRef]
- Wilson, P.R.; Wilcock, R. Hybrid hydrogen fuel cell and photo-voltaic system for remote telecommunications applications. In Proceedings of the 2013 4th IEEE International Symposium on Power Electronics for Distributed Generation Systems (PEDG), Rogers, AR, USA, 8–11 July 2013; pp. 1–4. [Google Scholar] [CrossRef] [Green Version]
- Taoufikl, M.; Lassad, S. Hybrid photovoltaic-fuel cell system with storage device control. In Proceedings of the 2017 International Conference on Green Energy Conversion Systems (GECS), Hammamet, Tunisia, 23–25 March 2017; pp. 1–6. [Google Scholar] [CrossRef]
- Rao, T.E.; Elango, S.; Swamy, G.G. Power management strategy between PV-Wind fuel hybrid system. In Proceedings of the 2021 7th International Conference on Electrical Energy Systems (ICEES), Chennai, India, 11–13 February 2021; pp. 101–107. [Google Scholar] [CrossRef]
- Wang, B.; Xian, L.; Manandhar, U.; Ye, J.; Ukil, A.; Gooi, H.B. A stand-alone hybrid PV-fuel cell power system using single-inductor dual-input single-output boost converter with model predictive control. In Proceedings of the 2017 Asian Conference on Energy, Power and Transportation Electrification (ACEPT), Singapore, 24–26 October 2017; pp. 1–5. [Google Scholar] [CrossRef]
- Wang, Y.-X.; Ou, K.; Qin, F.-F.; Kim, Y.-B. Proton exchange membrane fuel cell protection control for its hybrid power system application. In Proceedings of the 2015 IEEE PES Asia-Pacific Power and Energy Engineering Conference (APPEEC), Brisbane, Australia, 15–18 November 2015; pp. 1–5. [Google Scholar] [CrossRef]
- Loskutov, A.; Sosnina, E.; Chivenkov, A.; Kryukov, E. The development of hybrid power source based on SOFC for distant electricity consumers power supply. In Proceedings of the 2015 IEEE Innovative Smart Grid Technologies—Asia (ISGT ASIA), Bangkok, Thailand, 3–6 November 2015; pp. 1–6. [Google Scholar] [CrossRef]
- Filippov, S.; Golodnitsky, A.; Kashin, A. Fuel cells and hydrogen energy. Energy Policy 2020, 11, 28–39. [Google Scholar] [CrossRef]
- Faizan, M.; Ali, S.; Ahmad, D.A. An overview of fuel cell based distribution generation integration. In Proceedings of the 2019 International Conference on Power Electronics, Control and Automation (ICPECA), New Delhi, India, 16–17 November 2019; pp. 1–6. [Google Scholar] [CrossRef]
- Giorgi, L.; Leccese, F. Fuel cells: Technologies and applications. Open Fuel Cells J. 2013, 6, 1–20. [Google Scholar] [CrossRef] [Green Version]
- Jayakumar, A. An assessment on polymer electrolyte membrane fuel cell stack components. In Applied Physical Chemistry with Multidisciplinary Approaches, 1st ed.; Haghi, A.K., Balkose, A., Thomas, S., Eds.; Apple Academic Press: Boca Raton, FL, USA, 2018; pp. 23–49. [Google Scholar] [CrossRef]
- Jayakumar, A. A comprehensive assessment on the durability of gas diffusion electrode materials in PEM fuel cell stack. Front. Energy 2019, 13, 325–338. [Google Scholar] [CrossRef]
- Chaudhary, S.; Chauhan, Y.K. Studies and performance investigations on fuel cells. In Proceedings of the 2014 International Conference on Advances in Engineering & Technology Research (ICAETR—2014), Unnao, India, 1–2 August 2014; pp. 1–6. [Google Scholar] [CrossRef]
- Lee, S.C.; Kwon, O.; Lee, D. Fuel cell simulation: Steady-state and dynamic case. In Proceedings of the 2012 7th International Conference on Computer Science & Education (ICCSE), Melbourne, Australia, 14–17 July 2012; pp. 974–979. [Google Scholar] [CrossRef]
- Sohn, S.; Oh, J.; Lee, Y.; Park, D.; Oh, I. Design of a fuel-cell-powered catamaran-type unmanned surface vehicle. IEEE J. Ocean. Eng. 2015, 40, 388–396. [Google Scholar] [CrossRef]
- Guaitolini, S.V.M.; Yahyaoui, I.; Fardin, J.F.; Encarnação, L.F.; Tadeo, F. A review of fuel cell and energy cogeneration technologies. In Proceedings of the 2018 9th International Renewable Energy Congress (IREC), Hammamet, Tunisia, 20–22 March 2018; pp. 1–6. [Google Scholar] [CrossRef]
- Dongguan Power Long Battery Technology Co, Ltd. (PLB). Available online: http://www.plb-battery.com/battery-cells/3-2v-3500mah-lifepo4-lfp-battery-cell-for.html (accessed on 2 June 2021).
- Sinyak, Y.V. Modeling the cost of Hydrogen fuel in the conditions of its centralized production. In Hydrogen Energy Technologies: Materials of the Seminar of the Laboratory of Hydrogen Energy Technologies of the Joint Institute for High Temperatures of the Russian Academy of Sciences; Leontiev, A.I., Dunikov, D.O., Eds.; Federal State Budgetary Institution of Science Joint Institute for High Temperatures of the Russian Academy of Sciences (JIHT RAS): Moscow, Russia, 2017; Volume 1, pp. 39–56. [Google Scholar]
- Mitrova, T.; Melnikov, Y.; Chugunov, D.; Glagoleva, A. The Hydrogen Economy—A Path towards Low Carbon Development; SKOLKOVO Energy Centre, Moscow School of Management SKOLKOVO: Moscow, Russia, 2019. [Google Scholar]
- Christensen, A. Assessment of Hydrogen Production Costs from Electrolysis: United States and Europe; International Council on Clean Transportation: Berlin, Germany, 2020. [Google Scholar]
- Glenk, G.; Reichelstein, S. Economics of converting renewable power to hydrogen. Nat. Energy 2019, 4, 216–222. [Google Scholar] [CrossRef]
- Albrecht, U.; Barth, F.; Bünger, U.; Fraile, D.; Lanoix, J.-C.; Pschorr-Schoberer, E.; Vanhoudt, W.; Weindorf, W.; Zerta, M.; Zittel, W. Study on Hydrogen from Renewable Resources in the EU; Ludwig-Bölkow-Systemtechnik GmbH (LBST): Munich, Germany, 2015. [Google Scholar]
- Grube, T.; Höhlein, B. Costs of making hydrogen available in supply systems based on renewables. In Hydrogen and Fuel Cell; Töpler, J., Lehmann, J., Eds.; Springer: Berlin/Heidelberg, Germany, 2016. [Google Scholar] [CrossRef]
- ACIL Allen Consulting for ARENA. Opportunities for Australia from Hydrogen Exports. Available online: https://acilallen.com.au/projects/energy/opportunities-for-australia-from-hydrogen-exports (accessed on 2 June 2021).


| Fuel Cell Type | Electrolyte | Electrode Material | Anodic Reaction | Cathodic Reaction | Critical CO Content in Fuel |
|---|---|---|---|---|---|
| PEMFC | Perfluoro-sulfonic acid (Nafion) | Anode: Pt, PtRu Cathode: Pt | H2→2H+ + 2e− | 0.5O2 + 2H+ + 2e−→H2O | CO > 10–100 ppm |
| AFC | Potassium hydroxide, soaked in a matrix KOH | Anode: Ni Cathode: Ag | H2 + 2OH→2H2O + 2e− | 0.5O2 + H2O + 2e−→2OH− | CO > 10 ppm |
| PAFC | Phosphoric acid soaked in a matrix | Anode: Pt, PtRu Cathode: Pt | H2→2H+ + 2e− | 0.5O2 + 2H+ + 2e−→H2O | CO > 0.5% |
| MCFC | Carbonate solution | Anode: Ni-5Cr Cathode: NiO(Li) | H2 + CO32−→H2O + CO2+2e− | 0.5O2 + CO2 + 2e−→CO32− | does not poison the catalyst |
| SOFC | Yttria-stabilized zirconia, or more recently, lanthanide-doped ceria | Anode: Ni-YSZ Cathode: Lanthanum strontium manganite (LSM) | H2 + O2−→H2O + 2e− | 0.5O2 + 2e−→O2− | does not poison the catalyst |
| Type | Li-Ion | LiFePO4 | LTO | ||
|---|---|---|---|---|---|
| Type (form factor) | cylindrical | cylindrical | prismatic | cylindrical | prismatic |
| Capacity C, Ah | 0.7–7 | 1.1–50 | 10–280 | 1.3–40 | 2.9–23 |
| Gravimetric energy density, Wh/kg | 120–270 | 80–140 | 110–165 | 70–96 | 46–90 |
| Cell voltage, V | 3.6 | 3.2 | 3.2 | 2.4 | 2.3–2.4 |
| Standard charge current, C∙A | 0.5 | 0.5 | 0.5 | 0.5 | 1.0 |
| Maximum charge current, C∙A | 1.0 | 1.0 | 1.0 | 5.0 | 4.0 |
| Long-term discharge current, C∙A | 2.0 | 1.0–3.0 | 1.0–3.0 | 1.0–5.0 | 1.0–3.0 |
| Maximum discharge current, C∙A | 3.0 | 3.0–5.0 | 3.0–5.0 | 5.0–10.0 | 4.0–10.0 |
| Service life, cycles (not less) | 1000 | 2000 | 3500 | 10,000 | 15,000 |
| Charge-discharge depth, %SOC | 20–80 | 20–80 | 20–80 | 0–100 | 0–100 |
| Operating temperature (discharge), °C | −20–+60 | −20–+60 | −20–+55 | −30–+60 | −30–+60 |
| Specific cost, USD/Ah | 1.0–2.5 | 0.7–3.0 | 0.5–0.9 | 0.75–3.0 | 1.0–2.1 |
| Unit | Symbol (Figure 3) | Type | Nominal Parameters |
|---|---|---|---|
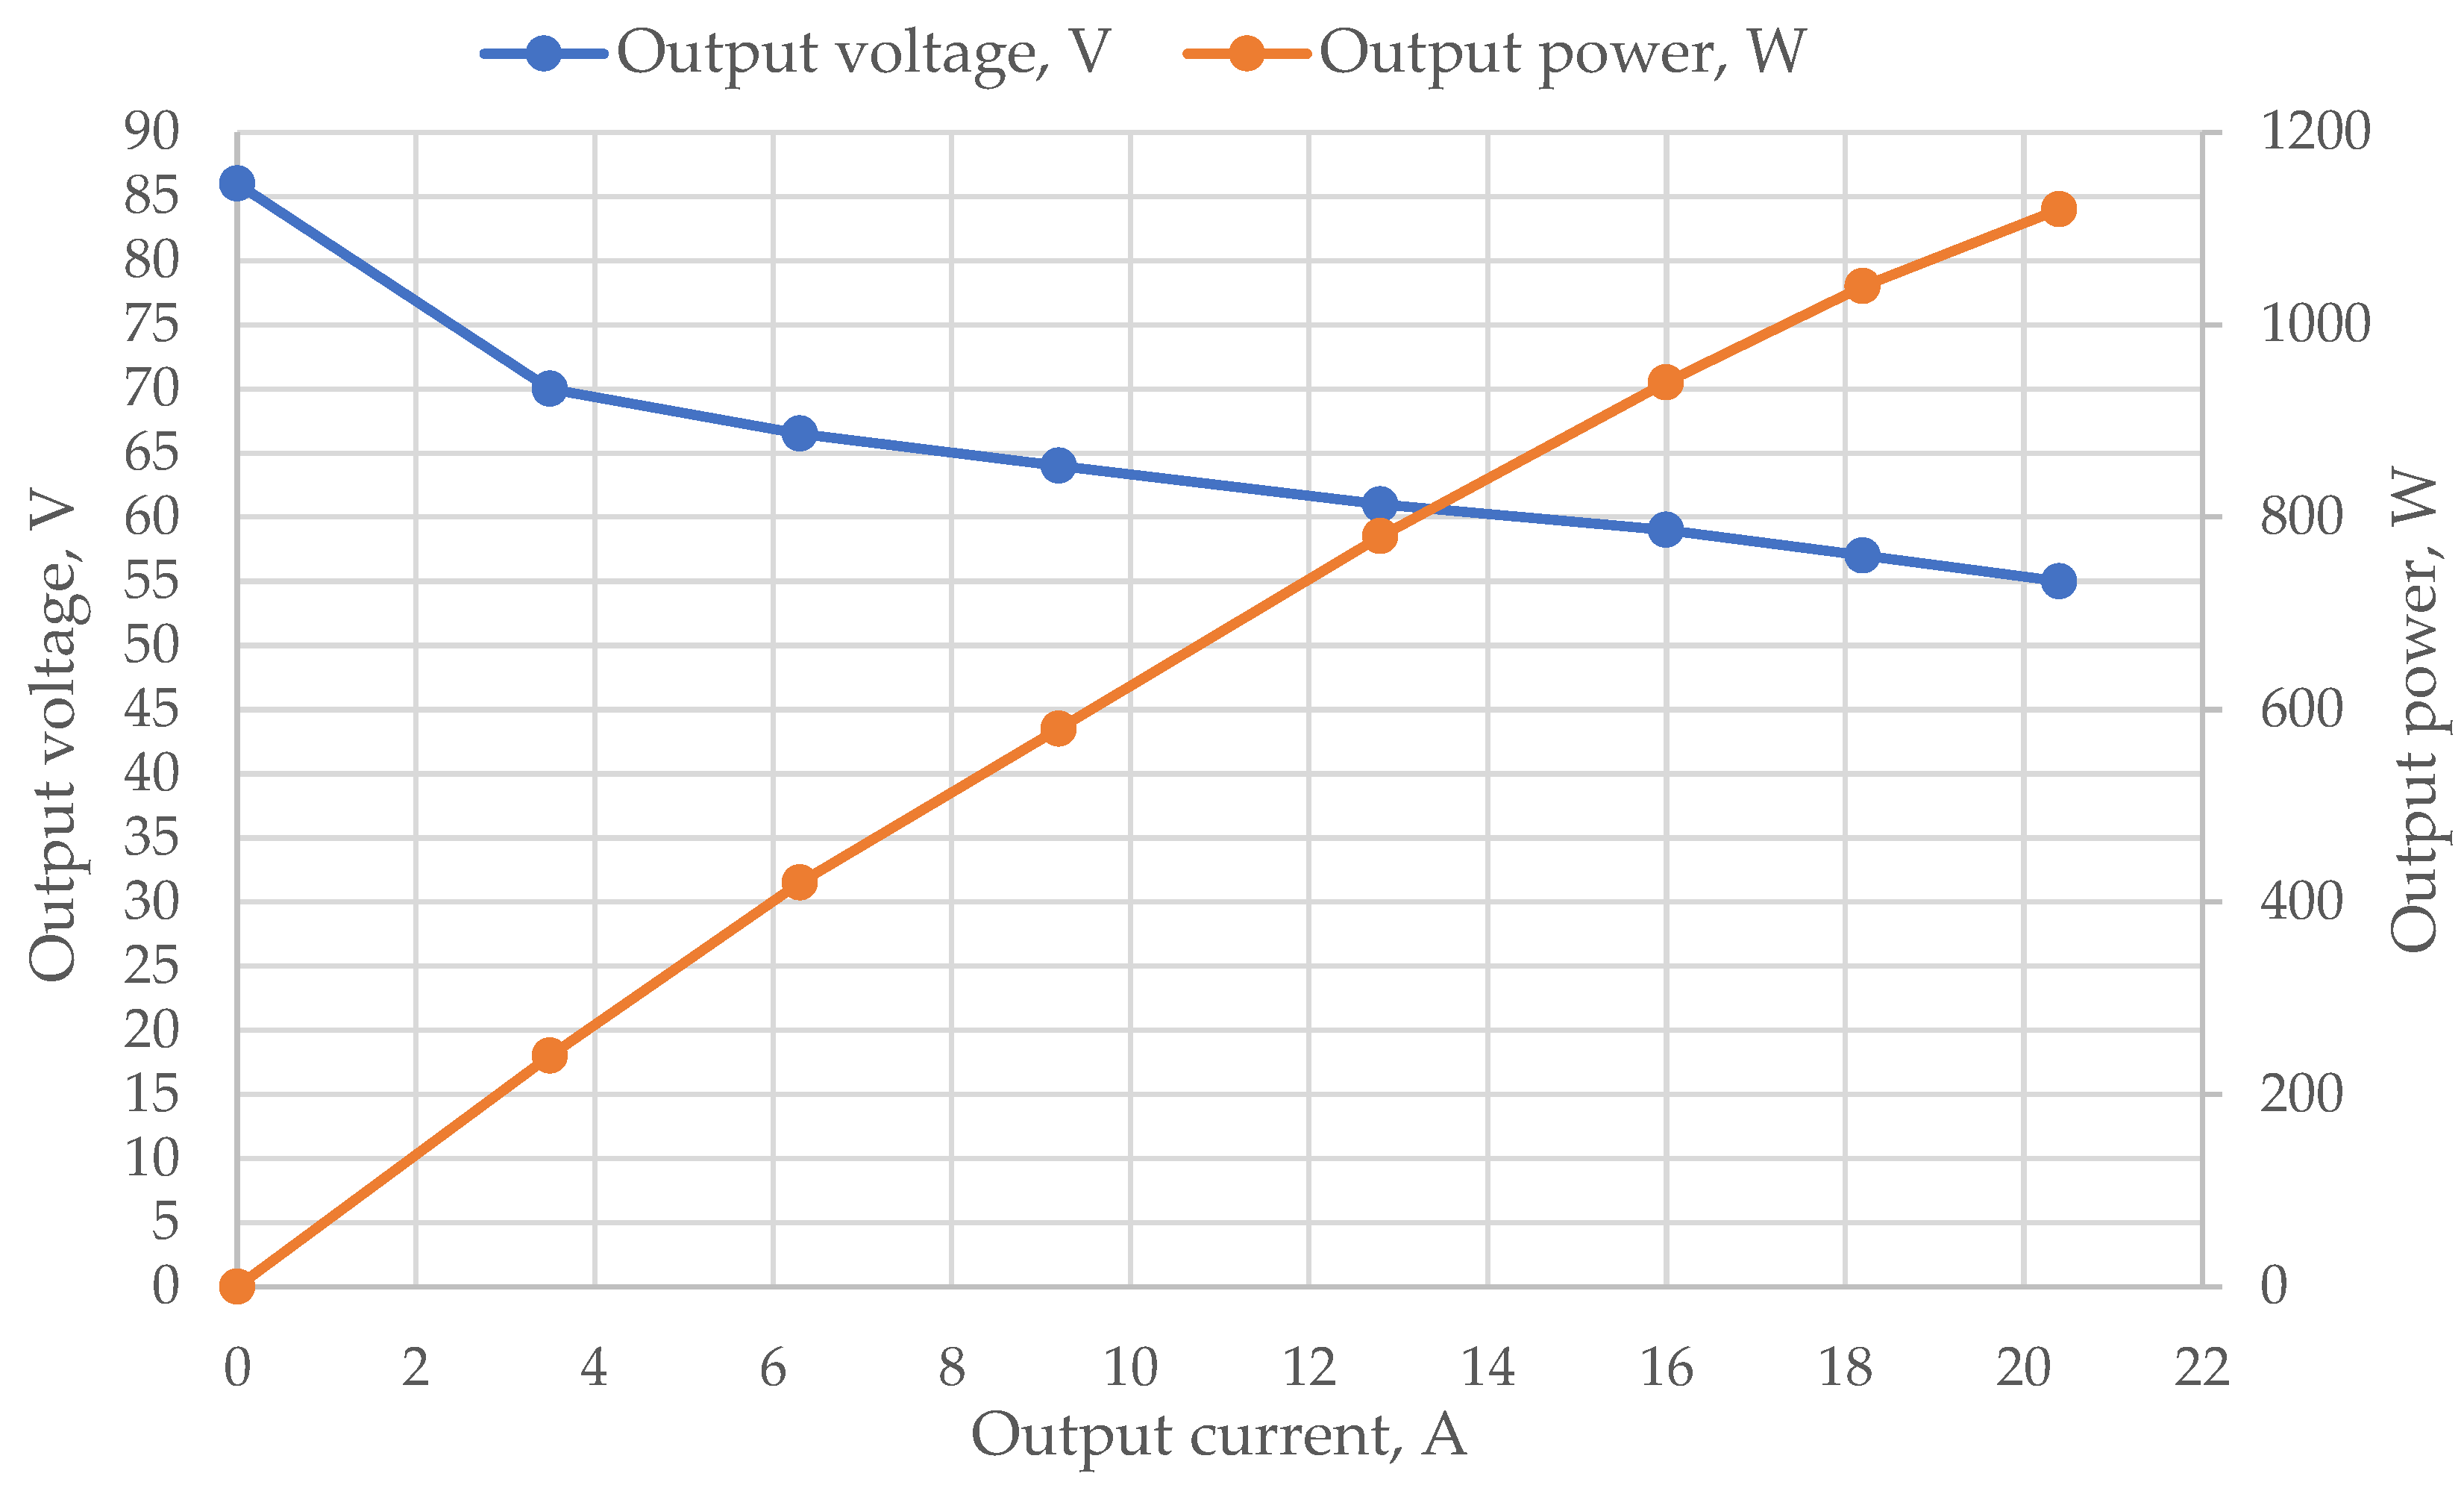
| Fuel cell | FC | PEMFC | 1 kW, 46 V |
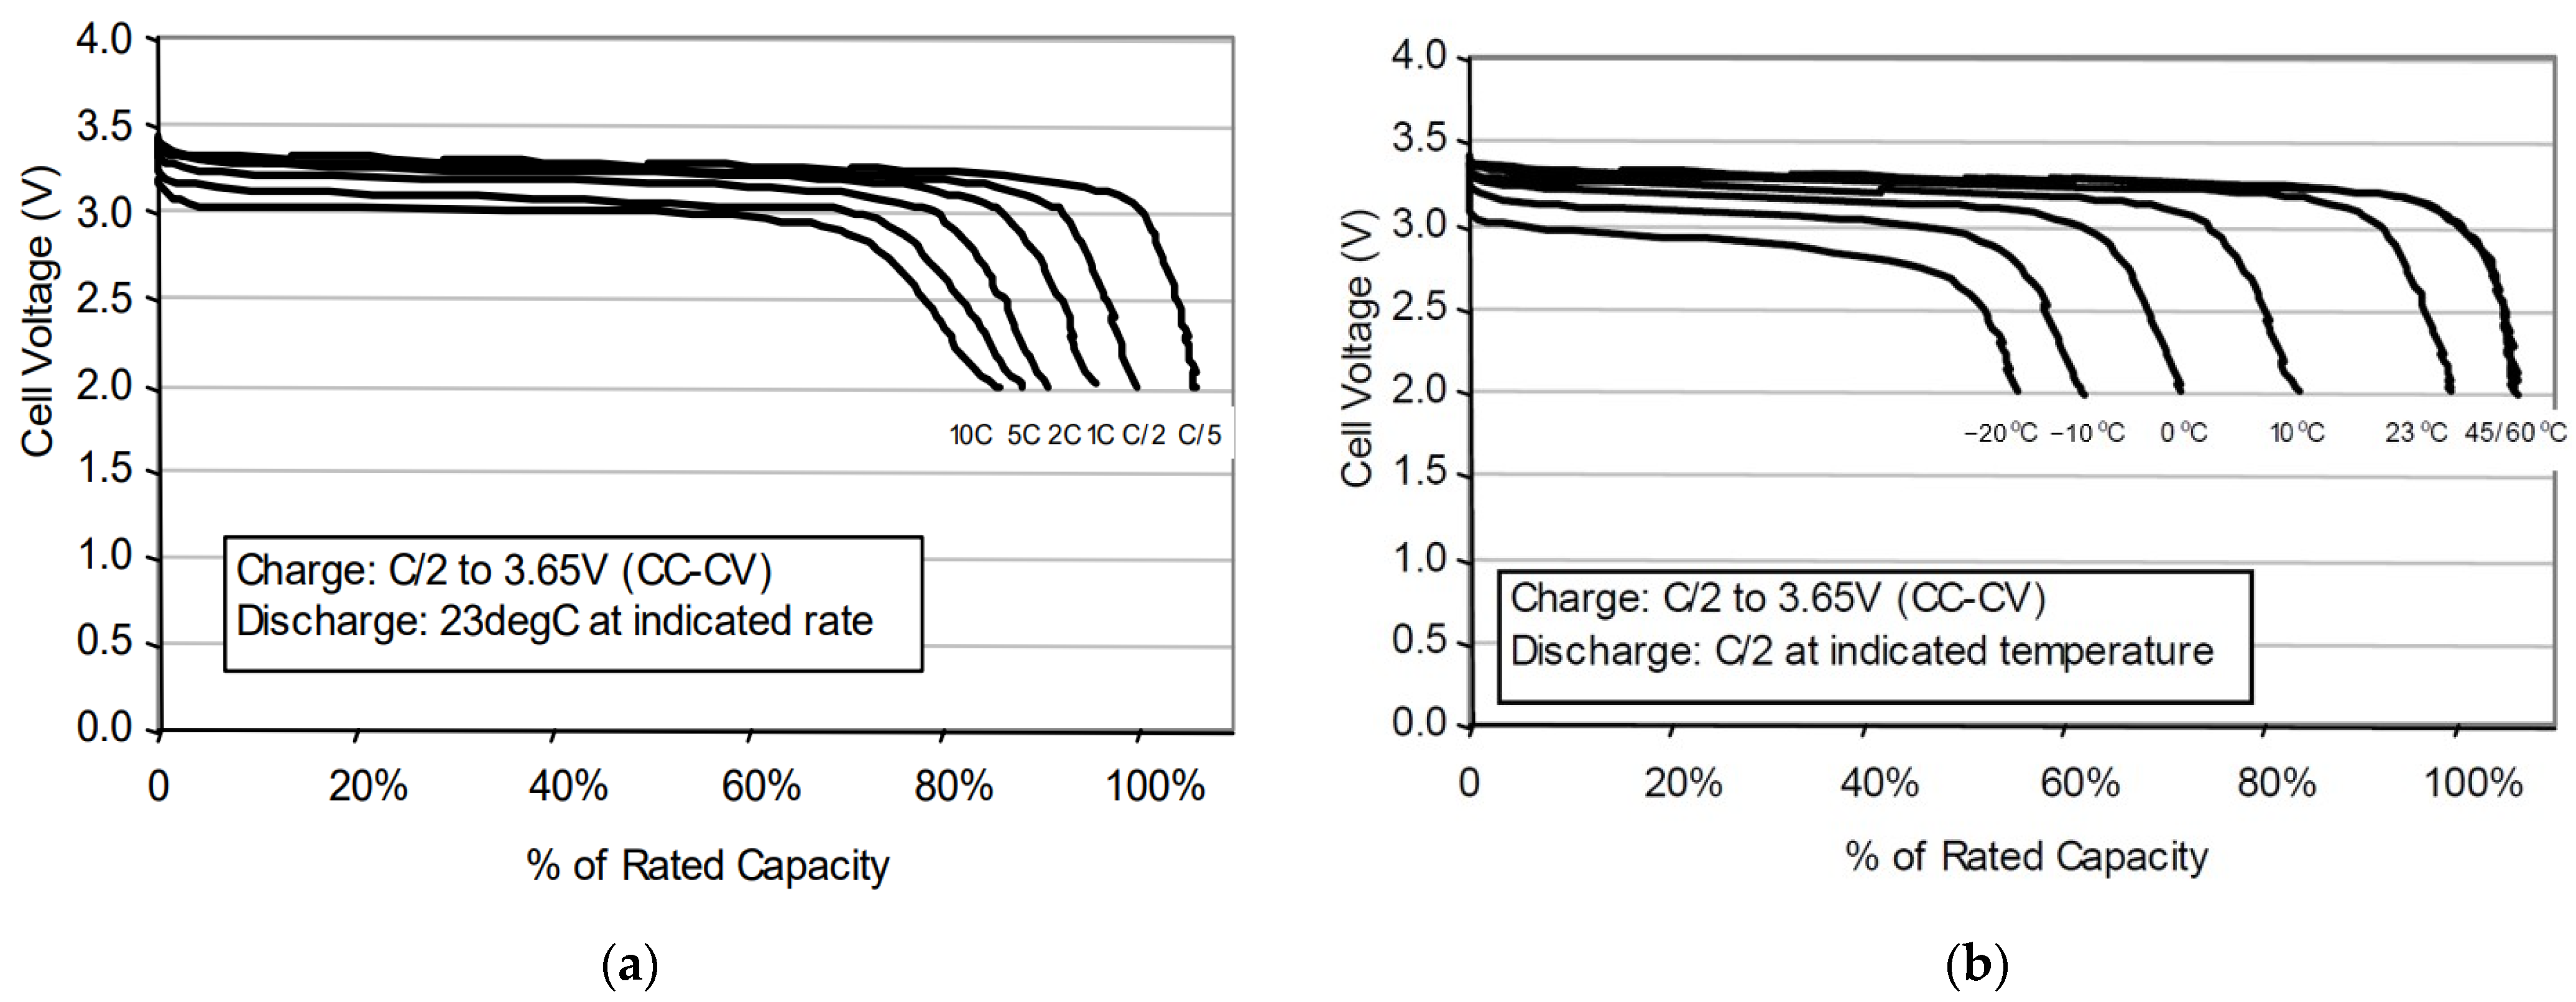
| Battery storage | BC | LiFePO4, cylindrical | 3.5 Ah, 12 × 36 V |
| Converter | C | single-phase bridge, MOSFET/IGBT | see Section 3.5 |
| Autonomous voltage inverter | AVI | single-phase bridge, MOSFET/IGBT | single-phase, 220 V |
| Filters | C1, C2 | capacitors | see Section 3.3 |
| Relays | KV1-KV4 | solid-state | - |
| Load | ZL | - | 3 kW, 220 V |
| Electrical mains | U | if applicable | 220 V |
| Parameter | Value |
|---|---|
| Capacity C, Ah/kWh | 3.5/1.6 |
| Nominal voltage, V | 460.8 |
| Maximum voltage UBSmax, V | 518.4 |
| Minimum voltage UBSmin, V | 360 |
| Continuous charge current, A | 3.5 |
| Maximum discharge current, A | 28 |
| Internal resistance AC 1 kHz rBSmax, Ω | 2.6 |
| Operating temperature t, °C | −20–+50 |
| Volumetric Energy Density, Wh/L | 306 |
| Gravimetric Energy Density, Wh/kg | 125 |
| Parameter | Value |
|---|---|
| Load rated power P, kW | 3 |
| Power factor cos φL | 0.8 |
| The effective value of the HFCGS output voltage (single phase) Uout, V | 220 |
| Output voltage frequency fout, Hz | 50 |
| FC rated power PFC, kW | 1 |
| Battery voltage UBSmin/UBSmax, V | 360/500 |
| Converters clock frequency fCL, kHz | 20 |
| Output L-C filter L, μH/C, μF | 500/2 |
| Capacities C1, μF/C2 and C3, mF | 235/1.0 and 2.0 |
| H2 Production Technology | Energy Consumption per 1 kg H2 | CO2 Emission per 1 kg H2, kg | ||||
|---|---|---|---|---|---|---|
| Natural Gas, m3 | Coal, kg | H2O, kg | Electrical Energy, kWh | Thermal Energy, kWh | ||
| Steam methane reformation | 5–5.5 | - | 4–4.5 | 0.7–0.9 | - | 9.5 |
| Coal gasification | - | 7–7.5 | 9 | 0.7–0.8 | - | 21 |
| Thermochemical water splitting based on HTGR | - | - | 9–20 | 2–2.5 | 60–65 | 1.7 |
| Electrolysis (from an electrical network) | - | - | 9 | 55–60 | - | 41.1 |
| Electrolysis (from a wind turbine) | - | - | 9 | 55–60 | - | - |
| Electrolysis (from a solar energy station) | - | - | 9 | 55–60 | - | - |
| Parameters | Value |
|---|---|
| Energy prices | |
| Natural gas, thousand m3 | 111 |
| Coal, USD/ton | 112 |
| Electric energy from a centralized source, USD/kWh | 0.05 |
| Specific capital investment in auxiliary energy sources | |
| HTGR, USD/kW (thermal power) | 500 |
| Solar power plants (SPP), USD/kW | 1000 |
| Wind power plants (WPP), USD/kW | 500 |
| Specific investment in elements of hydrogen production technology | |
| Electrolyser, USD/kW | 740 |
| Methane reformer, USD/kg H2 | 25–30 |
| Hydrogen compressor, USD/kW | 2000 |
| H2 liquefaction unit, USD/kg H2/day | 1100 |
| The cost of transporting hydrogen per 100 km | |
| Compressed pipeline, USD/kg | 0.09 |
| Liquefied by auto transportation in cryogenic tanks, USD/kg | 0.04 |
| Hydrogen Production Technology | Hydrogen Cost, USD/kg H2 | ||
|---|---|---|---|
| Estimates of Russian Experts | Estimation of Global Experts | ||
| compressed | SMR (natural gas) | 1.2–2.7 | 1.8–3.5 |
| Coal gasification | 1.9–2.3 | 1.6 | |
| Thermochemical water splitting with HTGR | 3.3–7.5 | 1.0–1.6 | |
| Electrolysis (from an electrical network) | 4.3–9.3 | 4.7 | |
| Electrolysis (from a wind turbine) | 4.4–25.9 | 3.9–7.1 | |
| Electrolysis (from a solar energy station) | 7.1–50 | 6.4–25.8 | |
| liquefied | SMR (natural gas) | 2.9–4.4 | 3.8 |
| Coal gasification | 3.8–4.1 | 4.5–5.1 | |
| Thermochemical water splitting with HTGR | 5.7–10.2 | 1.4–2.1 | |
| Electrolysis (from an electrical network) | 5.7–11.6 | 7.8 | |
| Electrolysis (from a wind turbine) | 6.0–31.3 | 4.5–9.5 | |
| Electrolysis (from a solar energy station) | 9.1–60.0 | 7.5 | |
| Parameter | Value |
|---|---|
| Fuel cell power, kW | 1 |
| Hydrogen consumption, liters per minute | 12 |
| Hydrogen source service life, years | 10 |
| The total cost of hydrogen source experimental sample (with hydrogen generator), thousand USD | 50 |
| Distilled water cost, USD/m3 | 18 |
| Inflation rate, % | 5.1 |
Publisher’s Note: MDPI stays neutral with regard to jurisdictional claims in published maps and institutional affiliations. |
© 2021 by the authors. Licensee MDPI, Basel, Switzerland. This article is an open access article distributed under the terms and conditions of the Creative Commons Attribution (CC BY) license (https://creativecommons.org/licenses/by/4.0/).
Share and Cite
Kulikov, A.; Loskutov, A.; Kurkin, A.; Dar’enkov, A.; Kozelkov, A.; Vanyaev, V.; Shahov, A.; Shalukho, A.; Bedretdinov, R.; Lipuzhin, I.; et al. Development and Operation Modes of Hydrogen Fuel Cell Generation System for Remote Consumers’ Power Supply. Sustainability 2021, 13, 9355. https://doi.org/10.3390/su13169355
Kulikov A, Loskutov A, Kurkin A, Dar’enkov A, Kozelkov A, Vanyaev V, Shahov A, Shalukho A, Bedretdinov R, Lipuzhin I, et al. Development and Operation Modes of Hydrogen Fuel Cell Generation System for Remote Consumers’ Power Supply. Sustainability. 2021; 13(16):9355. https://doi.org/10.3390/su13169355
Chicago/Turabian StyleKulikov, Aleksandr, Aleksey Loskutov, Andrey Kurkin, Andrey Dar’enkov, Andrey Kozelkov, Valery Vanyaev, Andrey Shahov, Andrey Shalukho, Rustam Bedretdinov, Ivan Lipuzhin, and et al. 2021. "Development and Operation Modes of Hydrogen Fuel Cell Generation System for Remote Consumers’ Power Supply" Sustainability 13, no. 16: 9355. https://doi.org/10.3390/su13169355
APA StyleKulikov, A., Loskutov, A., Kurkin, A., Dar’enkov, A., Kozelkov, A., Vanyaev, V., Shahov, A., Shalukho, A., Bedretdinov, R., Lipuzhin, I., & Kryukov, E. (2021). Development and Operation Modes of Hydrogen Fuel Cell Generation System for Remote Consumers’ Power Supply. Sustainability, 13(16), 9355. https://doi.org/10.3390/su13169355