Article

Innovation Performance Indicators for Architecture, Engineering and Construction Organization

Civil and Environmental Engineering, Stanford University, Stanford, CA 94305, USA
*
Author to whom correspondence should be addressed.
Sustainability 2021, 13(16), 9038; https://doi.org/10.3390/su13169038
Submission received: 26 July 2021 / Revised: 5 August 2021 / Accepted: 7 August 2021 / Published: 12 August 2021

Abstract

:
It is known that organizations can gain a competitive advantage only by managing effectively for today, while simultaneously creating innovation for tomorrow, and sustainability is one of the innovative strategies in major architecture, engineering, and construction (AEC) organizations. Innovation is vital to AEC organizations’ growth, yet most do not have a comprehensive measurement of innovation performance. Similar to the balanced scorecard approach, key indicators should be identified for the measuring of innovation performance to facilitate management. This article presents a study by using a triangulation approach that integrates systematic literature reviews and two-step consultations with experienced senior professionals to compile a set of key indicators for innovation performance measures for the AEC Industry.

1. Introduction

Much research has argued that the technological era of the 21st century is based on knowledge, information, and innovation [1,2,3]. Tushman and Nadler, in their study [4], emphasize that organizations can gain a competitive advantage only by managing effectively for today, while simultaneously creating innovation for tomorrow. However, a report presented by the Boston Consulting Group for the World Economic Forum in 2017 [5] indicated that the Architecture, Engineering, and Construction (AEC) industry had largely not benefited from the process, product, and service innovations. The AEC industry has been hesitant to embrace the latest innovation opportunities fully, and its labor productivity has stagnated or even decreased over the past 50 years [6]. The report suggested firms in the AEC industry did not emphasize enough innovation. For example, Virtual Design and Construction (VDC), as defined by Kunz and Fischer [7] as the use of integrated multi-disciplinary performance models of design–construction projects to support explicit and public business objectives, offers a platform for effective management and the innovation development of AEC. Though VDC has been introduced for years, many AEC firms still do not fully recognize this platform [8]. This indeed is not a new finding. Many researchers have shared a similar view [9,10]. A report published by the National Endowment for Science, Technology and the Arts of the United States in 2007 [11] has indicated that the AEC industry is regarded as a low innovative industry as it cannot match the conventional policy definition of innovation. The major factors causing the lag behind situation can be summarized as follows:
(1)
The industry largely favors a traditional way of business procedures as the acts of the parties in the industry are rigidly restricted by procurements and data are presented in paper documents [6].
(2)
The end-users of the product (a building or structure) may favor conventional building form and/or building style rather than contemporary design [12,13].
(3)
As the designers and contractors work under difficult time and cost restrictions, in order to minimize the risk of the rejection of building plans, the client, designer and contractors always prefer the design and construction to be in compliance with the prescriptive building codes rather than using a performance-based approach [14].
Though AEC firms have been plagued by low innovation levels, characterized by lagging productivity growth, limited digitalization, limited use of new materials and inefficient project management, they have recently paid more attention to innovation in their organizational strategies; in particular, sustainability is a widely used innovative strategy. A review on the annual reports [15] of 10 major AEC firms in the US has revealed that they all pay attention to innovation. A summary of the relevant descriptions in the annual reports is given in Appendix A. The descriptions presented in the reports have indicated that the firms have their strategies on innovation. However, it is not clear if the AEC firms have managed the innovation related strategies effectively to ensure that they remain competitive for the future.
It is well known that performance measurement and analysis are crucial for an organization’s management [16,17,18]. Managing innovation, as part of the general management of the organization, should also be supported by innovation performance measurement. Innovation performance measurement is considered a broad concept which includes the evaluation of various aspects such as firms’ strategies on innovation, ideas and knowledge; customers’ needs and the market situation; learning, training and knowledge sharing; and employees’ engagement and creativity, etc. [19,20] In other words, it is logical for the AEC firms’ management to understand innovation performance [21,22,23]. In the general management field, there are studies on performance measures for the innovation of organizations [24,25,26,27,28] and countries [29,30], but can these findings be directly applied to AEC firms? To respond to this question, we have to examine the characteristics of the AEC industry.
It is known that the AEC industry is extensively regulated [31]. Modern buildings and civil works are complex. Planning permission and the approval of building plans are normally required at the planning and design stage. License and consent are always required for implementing building works. Occupation permits and operation licenses should be obtained prior to the use of the product (the building). The low-price rule and tight schedules are always applicable to the construction process. Moreover, no two sites are the same, which implies that no two products are identical. Under this circumstance, the industry pays more attention not only to the product, but also to the process. Manufacturing, information technology and other industries may usually emphasize the products more than the process when measuring innovation performance, as product measurement can be easily quantified and objectively represented. This may cause the AEC firms difficulties in managing innovation in the same way as other industries. For example, a contractor (construction firm) may invest in developing innovative construction techniques or technologies, such as developing robots for laying bricks, in order to improve its productivity and innovation. Though the robot itself may be a product, the goal of creating this robot is not for selling, but for the enhanced productivity, hence, process innovation.
The manufacturing industry, pharmaceutical industry and software industry, for instance, may consider a new patent or product as the key to success. They may depend on patents to provide unique products for customers, generating necessary revenue, and reinvesting a portion of this revenue in innovation for sustained competitiveness. They may evaluate financially new product sales or revenue growth as the indicator for innovation. Other common evaluation indicators include measuring the number of patents, Research & Development (R&D) expenditures, trademarks or number of new products produced. These indicators are mainly designed for industries where an innovation is typically a new product for customers and can be quantified through sales and investment on generating the innovation. However, it is not a common practice for AEC firms to apply for patents to measure new product sales or trademarks, etc. Zawawi et al. [32] in their study have indicated that each industry or firm has their own specific method of innovation to ensure good performance; therefore, a specific innovation model for each industry should be developed. In view of the specific characteristics of the AEC industry, it is suggested that the innovation performance measures adopted in other industries should not be directly applied. Instead, modification is needed in order to effectively apply innovation to the AEC industry. The key objective of this study is to explore the current pool of innovation indicators used in other industries as described in the body of literature and review these indicators. Through professional judgement from practitioners in senior management roles, a set f indicators that are most appropriate for the AEC industry can be established.

2. Previous Studies

In order to explore the previous studies on innovation performance for the AEC industry, a literature review by keyword search on Web of Science (WoS) [33] was performed for the period from 1 July 2011 to 30 June 2021 and is summarized in Table 1. Nine articles (listed in Table 2) were found to present studies on innovation performance related to the AEC industry. Only Science Citation Index (SCI) or Social Science Citation Index (SSCI) listed journals are considered in this study, thus the search uses WoS to ensure quality inputs. Details of the selection process are elaborated on in the information collection section.
The aforesaid articles present research on various issues of innovation performance. However, they do not specifically relate to the establishment of an innovation performance evaluation approach.
Today, the rapid advancement of information technology and new materials have changed our working patterns and living behavior. Even though the AEC industry lags behind others in adopting innovation, new technologies/innovative approaches can help the industry work efficiently and improve our architectural environment. Several previous pieces of research have acknowledged the management of new technology, such as technology implementation dynamics in project teams [43]; dynamics of project-based collaborative networks for BIM implementation [44]; understanding and managing systemic innovation in project-based industries [45,46]; modeling the circumstances under which a management-defined communication structure can add value to an organization [47]; organizational culture and knowledge transfer in project-based organizations [48]; and exploring key factors that influence the design of the project-based organization [49]. Nevertheless, the works which access innovation performance for the AEC industry are limited.
There are research works in the general management field, which may provide insights for studying the innovation performance for AEC organizations. The purpose of measuring performance through tracking the Key Performance Indicators (KPIs) is to enable reliable information, both quantitative and qualitative, to be used for benchmarking purposes, critical for any organization aiming to operate effectively [50]. Innovation KPIs allow managers to better understand the organizations’ strengths and weaknesses, identify room for improvement and monitor success.
In general, innovation performance should not be evaluated by a single indicator [51]. It should be measured by a complex evaluation process which comprises a set of indicators relating to the organization strategies, process, and outputs:
Innovation Performance = f(set of indicators)
To formulate innovation performance evaluation, two main challenges need to be addressed:
(1)
The identification and formulation of evaluating indicators;
(2)
The establishing of methods to quantify and measure in conformance with the indicators.
In general, there are two terms that should be clarified: indicators and metrics. In this study, we define the terms as:
(1)
an indicator is used to measure and indicates performance and success;
(2)
a metric is solely a judgement, whether it is a number or a qualitative description within an indicator that helps track performance and progress.
The establishment of Key Performance Indicators (KPI) for measuring innovation performance has been reported [52,53]; however, there appears to be little agreement about what should be measured and how it should be measured [54].
Direct measurement in terms of financial return may seem to be a simple indicator for measuring innovation performance. However, Henttonen et al. in their study [55], indicated that the importnace of financial measures for innovation is not significant. Measurability should not be considered as a primary criterion for selecting indicators, especially when measuring innovation performance. For example, innovativeness, a broad conceptual term to represent a perception for an idea, is widely chosen by managers to judge innovation performance [56]. As mentioned above, some firms measure new product sales or revenue growth, the number of patents, R&D expenditures, trademarks, or the quantity of products produced as the indicators for innovation in practice. However, Chobotová and Rylková, in their study [57], commented that these measurements do not necessarily correlate to innovation activities. Moreover, such measurements may not be applicable to the AEC industry. For instance, the adoption of building information modelling (BIM)/virtual design and construction (VDC), considered one of the innovation initiatives for design, construction, and construction project management, cannot be directly measured through the measurements of number of patents, trademarks or number of new products.
It is evident that quantitative indicators are reasonably simple to measure and track. Nevertheless, they require great attention to detail to interpret effectively. It may be misleading to concentrate on readily available figures in some situations without considering what they truly represent. Neely and Hii [58] have indicated that innovation has a multi-dimensional character and cannot be easily measured directly by quantity. While qualitative indicators focus more on human performance as a measure of effectiveness, their accuracy will depend on the “goodness” of experts’ opinions and may be trade-specific. They may be biased due to over- or under-measuring [59]. Rogers [60] indicated that innovation might be a risky activity and could disrupt organizational operations, and its impact on firms’ performances is difficult to measure and predict. Even if it provides “benefits” to the organization, the return may only be accounted for after several years. Measuring the annual return owing to innovation operations may not truly reflect its effectiveness. Taques et al. [61] have also mentioned that a quantitative single-dimension analysis may cause measurement bias in organizational innovation.
Innovation performance should be viewed in the context of the corporate model of innovation and the process of creative accumulation in the organization [62], i.e., the measurement criteria should be contextual and considered at the management level. Good innovation performance evaluation is subject to the judgments and interpretations of experts. Schwartz et al. [56] further related the stressed criteria of practitioners should be simple and easily judged. Experienced practitioners are experts with practical knowledge and insights, most suitable to provide the required judgments.
From a broad view of innovation performance at the management level of an organization, there should not be too many indicators. Each indicator should include a broader spectrum that can be judged by senior managers who have adequate knowledge in the field. From the decision-maker’s point of view, they should not be overloaded by too many time-consuming indicators that may not even provide valuable information [54]. Too many indicators may also result in the sending of confusing or contradictory information. Nonetheless, in the general business management field, an investigation initiated by Boston Consultant Group 2007 [63] has reported that most firms use less than five indicators to track the performance of innovation, which is falls very short of the number necessary to conduct a thorough investigation.
With respect to the views described above, we summarized the following issues that are considered for establishing a set of indicators for AEC industry:
(a)
innovation performance evaluation is a complex process comprising of a set of indicators;
(b)
the number of indicators selected for the assessment should be limited to between five and ten;
(c)
the evaluation should be proceeded initially by considering two components, namely efficiency (examine how things can be carried out, referring to the input and process) and effectiveness (examine the capability of producing a desired output and outcome, referring to the output and outcome);
(d)
the measurement for an indicator should not be a quantitative figure only; clear qualitative indicators should also be included and be easily understandable to experts.
Innovation performance can be conducted at the project or organizational level. Product innovation, for example, should be considered at the project level [64,65]. When evaluating the overall innovation performance of an AEC firm and not for a particular project, it should be carried out at the organizational level [66,67].

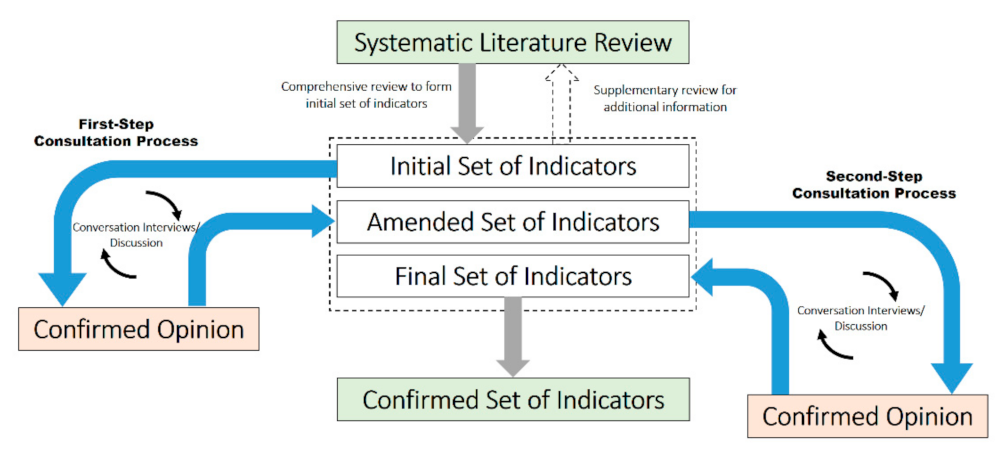
3. Approach and Methodology

The approach of this study first started by adopting the Systematic Literature Review (SLR) [68] approach on the basis of a seven-step approach proposed by Xiao and Watson [69]. As described above, there are studies concerning innovation performance in general management and other fields. It is therefore possible to establish an initial pool of innovation performance indicators by reviewing studies in various fields. Innovation performance indicators were identified by a systematic review of previous studies.
It is also indicated above that there are not many closely related studies for identifying innovation performance indicators for the AEC industry. The pool established in the first stage then formed the basis for the second stage processing. In this stage, we adopted a two-step consultation processing approach. The triangulation approach is used for establishing the sets of innovation performance indicators through SLR and the two-stage consultation [70,71]. Carter et al. [70] mentioned that the four types of triangulation methods are (i) method triangulation, (ii) investigator triangulation, (iii) theory triangulation, and (iv) data source triangulation. We adopted the method triangulation approach [72] in that the three different methods of data collection were SLR and two separate conversation interviews. Figure 1 below outlines the method of triangulation approach:
The pool of indicators was established by SLR, and was then reviewed by two groups of senior professionals through conversation interviews/discussions/written communications. The first group comprised of senior professionals, who were experienced professionals holding senior management positions in the AEC industry in the US. Then, the new pool of indicators compiled by the first group of experts, including the set of indicators drawn from SLR, was reviewed/commented through conversation interviews/discussions/written communications by a second extended group of experts, who were also experienced professionals holding senior management positions in the AEC industry in the US, Hong Kong and China. At this second step, much broader views from senior professionals in several regions were gathered. A final pool of indicators was reached through the conversation interviews, discussions and written communications, consolidated through conversation and discussion until a steady set of indicators was reached.
Conversation interviews, discussions and written communications were adopted for identifying and defining the indicators as some of the indicators were qualitative and had a broader meaning. Discussions with the experts were necessary to assure they fully understood the meaning of the indicators and provided valuable comments, such as compiling the definition of the indicators. Moreover, the consolidated views and definition of the metrics for measuring each indicator were also compiled. A detailed description of the process is given in Section 4 below.

4. Information Collection and Triangulation Approach

4.1. Systematic Literature Review

At this stage, we started initial checks by using the keywords “innovation + performance” and “performance + indicators” in the search engine, Web of Science, for 2020–2021, which returned 537 and 2,183 journal articles across all disciplines, respectively. This implied that there were numerous studies concerning innovation performance or performance indicators. However, most of these articles were not relevant to our study; emphasis should be placed on studying the evaluation approach and establishing corresponding indicators. We then structured the search by using the established Systematic Literature Review (SLR) approach. There are some guidelines on the adoption of SLR [73,74,75,76]. On the basis of the method proposed by the study of Xiao and Watson [69], a modified seven-step SLR exercise is adopted and illustrated in Figure 2.
Step 1: Formulating the aim/problem of the review 
Literature review is a form of research enquiry. It is necessary to formulate the aim of the review and the problem for the investigation. This review exercise aims to identify key innovation performance indicators adopted in previous research works. The indicators are those used for performance evaluation in management [76,77]. However, there are different performance evaluations applicable in other aspects of management. We shall concentrate on performance evaluation for innovation [78].
Step 2: Developing the review protocol 
Review protocol is then developed to improve the review process’s creditability [79,80]. The protocol is a plan that allows other researchers to follow and repeat the process to yield similar results [73,74]. With reference to the studies by Gates [81] and Gomersall et al. [82], we have developed the following protocol for the study and shown it in Table 3 below:
Step 3: Determining the pool for searching: literature of high quality 
The quality of the literature undoubtedly affects the quality of the review. Developing accurate and objective strategies to identify well-recognized journals that publish high-quality research can help researchers select the most valuable literature to review. To assure the quality of the literature, we searched the literature published in renowned journals, particularly those journals listed in the SCI/SSCI in Web of Science. Nazim [83] mentioned that the indexing system for SCI/SSCI-listed journals had a generally stipulated policy that no journal could be indexed until a period had elapsed, allowing the publisher to determine if the publication had merit and was recommended by well-known scholars in the respective discipline. The publications in SCI/SSCI journals are thus, recognized as good quality and reliable articles. Accordingly, an electronic search in the Web of Science for publications is used in this study. Moreover, Scopus Indexing and other similar sources are also useful databases for searching for journal articles, conference proceedings, theses, and reports. These sources provide extensive information to support the research.
Step 4: Brief screening and reviewing for inclusion and exclusion 
The keywords included in the study served as the primary key for the electronic search. Having compiled a list of articles for reference, the abstracts of listed articles are reviewed for relevancy with respect to the aim of the study. The objective is to investigate innovation performance measures. The shortlisted articles are then scrutinized (see later in this paper) to extract the information concerning innovation performance, assessment/evaluation framework, corresponding indicators, and metrics. There is no consensus on which articles should be considered relevant [84]. In order to avoid selection bias and to maintain the generalizability of review findings, articles describing innovation performance and mentioning evaluation indicators are included regardless of the basis of the works, i.e., research works carried out in different countries/cities, for different organizations/parties and different industries are included. Figure 3 illustrates the flow of the process in this step.
Step 5: Restrictive reviewing for category establishment 
This step identifies indicators and establishes the corresponding categories, in order to select the indicator categories and compile an initial list of indicators. The procedures are as follows:
(1)
To adopt a restrictive searching approach, by using the keywords “innovation + performance + indicators”/“innovation + performance + measure” for the list of articles compiled in Step 4;
(2)
To obtain the articles for a full-text review;
(3)
To review the full text of the new set of articles and extract the “indicators” presented/mentioned in the selected articles.
On the basis of the steps mentioned earlier, a list of key relevant articles, the corresponding aim and objectives of the articles, the indicators presented, and the designated categories are summarized in Table 4 below.
Step 6: Grouping of identified indicators 
The information extracted from the identified articles is recorded/coded. The performance indicators, whether the studies are for general organizational performance or the innovation performance of an organization, are recorded and remarked. The procedures for this grouping of indicators and naming of categories are as follows:
(1)
To assign name/title to each indicator category;
(2)
To classify/group the indicator to the relevant indicator category and provide a detailed description/explanation for each indicator.
Data extraction in the above process is summarized. Indicators that included similar meanings are then grouped and organized to establish a set of 4–10 indicators [99].
Step 7: Analyzing and synthesizing for initial set of indicators 
Manoochehri [100] has recommended organizations use 8–12 indicators for the innovation dashboard. Birchall et al. [54] put forward the criteria for selecting innovation indicators (metrics), suggesting that they should:
(1)
cover critical issues;
(2)
be simple and clear to all parties;
(3)
not rely on complex and challenging data collection;
(4)
be understood and reliable;
(5)
be easy for interpretation and evaluation;
(6)
be presentable in scale for use in executive decision-making.
This list is then further consolidated into 10 indicator categories, and descriptions/explanations are provided for each indicator with reference to the criteria mentioned above. Table 5 shows the consolidated list of indicators and the corresponding descriptions/explanations.
This consolidated set of innovation performance indicators is regarded as the “initial set of indicators” for further processing using the two-step consultation process described below.

4.2. Second Stage Two-Step Consultation Process

Patton [101] mentions that multiple data collection methods and analyses provide more support for the research process. The triangulation approach refers to the use of multiple methods and data collection to compile a comprehensive study to achieve agreement or convergence of information from different sets of data [102]. As described above, we adopted the method triangulation approach [103,104,105] for processing the data. By integrating the SLR and two-step consultation processes [106], a set of indicators was compiled for the innovation performance evaluation in the AEC industry.
Two groups of senior professionals were invited for a consultation in a two-step approach. The first step was proceeded by inviting 12 AEC professionals, who had at least 10 years of experience at senior management positions in the AEC industry in the United States, to have in-depth discussions/online chatting/written communications to ensure that all the interviewees fully understood and referred to the similar meanings of the indicators. After extensive communication, the opinions of the professionals were confirmed and compiled to a selective set of indicators. Figure 4 shows the flow of the process. Table 6 describes the major remarks and decisions in the process.
The second-step was proceeded by inviting 20 AEC professionals, who also had extensive experience (at least 10 years’ experience) holding senior management positions in the AEC industry in the United States, Hong Kong and Mainland China, for conversation interviews/discussions/online chatting/written communications. Similar to the first step, we proceeded with an in-depth consultation. Discussions with the senior professionals from different regions were carried out in order to gather an extended view of experts with wider international and regional experience. The set of indicators compiled in the first step was shown to the interviewees in this step. After an in-depth consultation, the opinions of the professionals were confirmed and a final set of indicators was established. Figure 5 shows the flow of the process, Table 7 describes the major remarks/decisions in the process and Table 8 shows the Final Set of Indicators. In addition, the metrics for the indicators’ measurements were also suggested (Appendix B) and confirmed in the consultation processes.

5. Discussions

This study searched through the current research body on innovation performance measurements. It integrated knowledge with industry-specific inputs for compiling a customized set of innovation performance measures for the AEC industry. This set of metrics provides the means for industry practitioners to evaluate their innovation performances for the organization and to identify the factors that industry experts deem necessary for innovation. These factors may change through time and require an adaptive learning process to identify such factors; hence, this method should be repeated regularly for the best results. This research illustrates an approach for collecting and integrating industry experts’ opinions and transforming them into a valuable set of metrics. This approach is repeatable for other industries and essential for developing a tailored set of innovation measures to reflect unique industry characteristics.

Limitations and Future Works

During the search for innovation indicators within the current research body, this research only considered SCI and SSCI journals and was limited to the last 10 years of published papers to ensure the quality of published references. Elaborated discussion on the choice of this scope of reviewed works can be found in step three of Section 4. Nonetheless, aside from SCI and SSCI journals, other reviewed or non-reviewed works such as proceedings, industry publications, etc., might also provide quality insights for this research. Therefore, future research can be carried out to expand the pool of search for innovation indicators.
As the concept of innovation and what pertains to each industry varies over time, results from this study should be updated by incorporating more recent inputs from industry experts. Though the core idea of innovation might not vary over time, innovation studies are bound to be time-dependent, and results should be used with care. Aside from industry characteristics, an organization’s vision, mission, or culture may affect the choice of indicators. Thus, this set of innovation performance indicators are provided as a reference for the AEC industry, which can be readily adopted or tailored with company-specific inputs. This research can be further expanded to incorporate different characteristics of AEC stakeholders, especially the difference between architecture and engineering firms (AE firms), construction firms, and owners.
In addition to the difference introduced by industry and company characteristics, attributes such as the organization’s size, regional differences, including both cultural and government policy differences, are possible factors that might affect the applicability and effectiveness of the resulting set of innovation performance indicators. Future studies may focus on each aspect and collect data inputs accordingly to better understand the probable effects of these factors.

6. Conclusions

Although AEC industry is regarded as lagging behind in innovation, firms have recently paid more attention to innovation. To effectively manage innovation, investigations on performance evaluation for various fields such as manufacturing, information technology, etc., were widely initiated recently. However, there are not many works on innovation performance evaluation for the AEC industry and this study attempts to fill this research gap. In view of the specific characteristics of the AEC industry, the performance indicators in other fields may not directly apply to AEC firms. On the basis of the works in other fields, a set of innovation performance indicators was compiled by the method triangulation approach, which integrates SLR and two-step consultation process. Six leading (input/process) indicators and three lagging (output/outcome) indicators are identified. Metrics for the indicators’ measurements are also compiled in the consultation processes and shown in Appendix B. These metrics as compiled in this study provide a set of readily applicable customized innovation performance indicators for organizations within the AEC industry. This set of metrics supports the measurement of innovation performance in AEC organizations and provides a common basis for comparisons and benchmarking, adding a set of AEC-specific innovation performance indicators to the current literature body. Furthermore, this helps organization managers to monitor the innovation activities within their organization, and identify their strengths and weaknesses for improvement. This set of metrics can also provide valuable insights for policy makers where they assess the performance of firms and identify areas with regard to supporting innovation activities in the industry. For example, if the performance is generally lower than other regions, one may want to consider incentivizing the industry through supportive government policies, such as providing funding or recognizing the usage of innovative approaches in public projects.
Previous studies have argued that the number of indicators for performance evaluation should be limited. A total of nine indicators can serve for practical innovation performance evaluation by using a simple auditing approach. Equation (1) may be re-written as:
I n n o v a t i o n   P e r f o r m a n c e = i 6 w i I i + j 3 w j O j
where I = input indicators and O = output indicators, and w is the corresponding weighting for input and output indicators.
This paper presents a study to compile the set of innovation performance indicators. Future works should be carried out to establish the evaluation framework. The SMART (Simple Multi-Attribute Rating Technique) method [107], with example applications [108,109,110,111], can be used to evaluate innovation performance, and Equation (2) shows a simple form of this evaluation framework. However, more works should be initiated, particularly via the elicitation of weightings for each of the indicators. These weightings may be affected by factors such as the region, size, and nature of the organizations. Nevertheless, the set of indicators and the corresponding measurement metrics can serve as the basis for researchers and practitioners to formulate the evaluation and support the decision-making of the management.

Author Contributions

J.T.Y.L. designed and performed the research, analyzed the data, and wrote the paper; C.K. designed the research in the conceptual stage, supervised and reviewed the paper. Both authors have read and agreed to the published version of the manuscript.

Funding

This research received no external funding.

Institutional Review Board Statement

Not applicable.

Informed Consent Statement

Not applicable.

Data Availability Statement

Data sharing not applicable; all “new” data created or analyzed in this study are listed in the content already. Data sharing is not applicable to this article.

Conflicts of Interest

The authors declare no conflict of interest.

Appendix A

Table A1. Information Extracted from Annual Reports of 10 Major US Firms relating to AEC Industry.
AEC FirmsKey Innovation Commitment Described in the Annual ReportsInnovation Specially Mentioned in the Annual ReportsInnovation Highlights
AECOM (Reports from 2008–2020)Being Passionate about problem solving: “ we embrace our clients’ biggest challenges—combining collaboration with innovation to deliver transformational results”.Investing in technologies at the forefront of the AEC industry that create value across the entire project life cycle.
  • Digital engineering
  • Machine learning
  • Augmented reality
  • Modular construction
  • Life cycle and environment.
Becthel (Reports from 2009–2020)Directing tens of millions of dollars toward investments in innovation to realize both incremental and disruptive improvements in project delivery and cost competitiveness.
  • Innovation also means using ideas from other industries and building on existing technological advances.
  • By self-performing, Bechtel is able to improve quality and schedules, enhance logistics, and reduce costs for our customers.
  • Drones (for materials tracking)
  • Supply chain process
  • Consolidating set of manufacturing and fabrication facilities
  • Innovation for clean nuclear energy.
  • Innovative modularized piles for marine terminals.
  • Virtual Project Delivery (developing data-centric smart models for engineering and design).
Jacobs Engineering (Reports from 2007–2020)Company’s strategies: to build a High Performance Culture, i.e., to reinforce a culture of accountability, inspirational leadership and innovation that will drive long-term outperformance.
  • Recognizing the talent of employees that is the key to their contribution to achieving the company’s vision.
  • Employees’ innovation and determination to embed sustainability into their design and delivery of service for clients.
  • Sustainability is embedded in the company’s innovative design. Plan Beyond is how the company defines and identifies with its approach to sustainability.
  • Developing a strong reputation for delivering services for the entire life cycle of a project, including research and development, test and evaluation, and acquisition support.
Fluor (Reports from 1998–2020)Investing continuously in the innovation that differentiates the company from their competitors and enable the company to deliver the capital-efficient solutions that the clients demand.
  • Holding the 3rd Innovation Unwrapped event 2017, when employees from across the company compete to spend a week working on real client challenges, partly with the client, and come up with robust solutions.
  • Commencing an action plan based on excellence, lean, growth and innovation for the company’s future.
The company maintains a controlling interest in NuScale Power LLC, the operation of which are primarily research and development.
The following are designs by NuScale:
  • Small Modular Reactor
  • Safety Pin—smart.
Arcadis (Reports from 2014–2020)
  • Capturing the opportunities provided by global mega trends for innovation and growth, to step up investments in digitalization to become a digital frontrunner in AEC industry.
  • Focusing on people, innovation, and performance, driving profitable growth.
  • Being passionate about the clients’ success and bring insights, agility, and innovation to co-create value.
  • Maintaining a strong talent pool with engaged and talented employees for innovation and growth.
  • Recognizing demographic and climate changes that require innovative solutions to secure human wellbeing and support economic development.
  • Considering innovation with strong relevance to sustainable development.
  • Digitalization
  • Water technology
  • Environmental innovation (sustainable development).
DPR Construction (SWOT reports from 2009–2019/online information)
  • Joining innovation and technology to create a defining movement: Its goal from inception is to rebuild the building industry.
  • Innovation has certainly been a part of the company relative to how they set up their core values.
  • The culture in the company is innovative, collaborative and inspiring.
  • Setting a goal to institutionalize VDC & BIM “in everything they do” and recognize members should skillfully use and improve the application.
  • Having an open working environment to facilitate idea and knowledge sharing.
  • Ranking #1 science & technology construction firm by BD + C.
  • Virtual design and construction—wide range of virtual building services
  • Using technology/collaboration for project efficiency and sustainability
  • Setting project up for success using lean, BIM and IPD
  • Encouraging staff to sharing knowledge to the industry.
Gensler (Annual reports from 2014–2020)
  • Every day, by using innovation and creativity to solve important challenges
  • Making significant investments in platforms that drive innovation, developing its own software applications, investing in data-driven design, hiring talented leaders from related fields, and growing in ways that will allow exciting new partnerships with its clients.
  • Bringing creativity and innovation to help its clients thrive, and we do this as one community.
  • Valuing a collaborative, passionate team of people with diverse backgrounds, perspectives, and talents to ignite innovation and add breadth to the company’s global practice.
  • The company dedicates significant resources to research, design technology, new ventures, and design innovation platforms to increase the value the company will deliver to clients.
  • The company has a global collaborative culture, uniting people from across the globe and from every part of its practice to spark new ideas.
  • Recognizing research is the fuel that drives innovation, and the company will apply research findings in myriad ways to improve building performance and drive clients’ businesses.
  • Offer Gensler Design Excellence Awards, Gensler Research + Innovation Awards
  • Ranking #1 architecture firm on Building Design + Construction’s 2018 Giants 300.
  • Design innovation—risk-taking to encourage diverse thinking and points of view that can inject new ideas and methods into design process.
  • Established “Design Lab” in 2018 to provide a platform for creative process (This initiative taps the creative power of 6000+ people through an internal web portal and other digital tools).
  • Gensler Research Institute—a collaborative network of global researchers.
  • GenslerVR delivering virtual reality renderings with project teams and clients.
Brady Construction (Annual reports from 2001–2016)
  • One of the key competencies is innovation advantage, i.e., technologically advanced, internally developed products drive growth and sustain gross profit margins.
  • One of the key strategies in 2016 is enhancing the firm’s innovation development process to deliver high-value, innovative products that align with the company’s target markets.
  • Recognizing in the annual report that if they fail to make innovations, then their business and financial results could be adversely affected.
  • Research and development expenses increased to $36.7 million in fiscal 2015 from $35.0 million in fiscal 2014. The increase in R&D spending was a result of our innovation development initiative to realign the R&D processes in order to accelerate new product innovation, increased investments in emerging technologies
  • RFID
  • Sensing technologies
  • Digital capabilities
  • Identification Solutions products
  • Workplace Safety and compliance products.
Stantec (Annual reports from 2011–2020)
  • Staff comprising engaged and inspired global experts winning and delivering projects that will better our world.
  • With innovation and excellence, the company will deliver solutions, value, and a client experience
  • Pursuing its business goal of being a top-tier global design and delivery firm that is recognized for its creative, technology-centric, and collaborative approach.
  • Invests approximately $3 million per year to fund employee creativity and innovation.
  • Information Technology
  • Sustainability.
Tetra Tech, Inc. (Annual reports from 2000–2020)
  • Providing innovative consulting and engineering services, with a focus on providing solutions that integrate innovation with practical experience.
  • Adapting emerging science and technology in the development of high-end consulting and engineering solutions is central to our approach to Leading with Science in the delivery of our services.
  • Recognizing the fact that complex projects for the public and private sectors, at the leading edge of policy and technology development, often require innovative solutions that combine multiple aspects of our interdisciplinary capabilities, technical resources and institutional knowledge.
  • Holding frequent meetings with existing and potential clients; giving presentations to civic and professional bodies, and presenting seminars on research and technical applications.
  • “Greening” of infrastructure,
  • Design of energy efficiency
  • Innovation in the capture and sequestration of carbon,
  • Formulation of emergency preparedness and response plans,
  • Improvement in water and land resource management practices
  • Data analytics
  • Design engineering
  • Construction management.

Appendix B

Table A2. Key Metrics for Innovation Indicators.
Innovation CriteriaKey MetricsRemarks & ExamplesUnit of Measures
DurabilityDurabilityVery Poor: very sensitive to change in market and may be easily replaced in a very short period of time.
Very Good: extremely durable and are anticipated to stay unless disruption of work.
Ordinal scale
Employee CreativityCreativity of teams
  • New ways to achieve goals or objectives
  • New and practical ideas to improve performance
  • New technologies/processes/techniques/product ideas
  • New ways to increase quality
  • Good source of creative ideas
  • Promoting ideas to others
  • Exhibiting creativity on the job
  • Creative solutions to problems
  • Fresh approach to problems
  • New ways of performing work tasks.
Ordinal scale
Engagement% of employees involved in idea generation# of Employee involved in idea generation/Total # of employee.%
Culture that foster and supports innovationFirm’s culture based on its supportiveness to innovation:
How long did time managers spend with innovations compared to normal tasks?
Are the firm tolerable to risk and failure?
Does the firm orient to the future market?
Ordinal Scale
Ideas and KnowledgeKnowledge sharing sessionse.g., meeting, seminar, forum, courses, online chatting, etc.Ordinal Scale
Idea pool—# of new ideas in the pipeline# of new ideas that are considered to be valuable but have not started pilotingNumbers
Extent of support from firm on employee continue developmentSubsidizing work-related courses, online/formal/informal, etc.
Providing internal training sessions from senior employees, site senior management, outsiders, etc.
Ordinal Scale
ImpactImpact on the firm’s imageMinimal impact on firm’s image
Greatly enhance firm’s image and toward branding power where customers will first think of the firm when coming to a certain kind of service
Ordinal Scale
Innovation ProcessIncentive schemesIncentive schemesOrdinal Scale
# of innovative ideas generated# of innovative ideas generatedNumbers
Vetting process of innovative ideas (potential of enhancement and implementation)No standard or protocol on how innovative ideas will be selected.
A well-designed and organized process with clear rubrics and respectable judges for selecting innovative ideas to pilot.
Ordinal Scale
Quality of Ideas% of piloted ideas# of piloted ideas/# of innovative ideas generated%
Diffusion rate of new ideas in the firm% of innovative ideas implemented across the firm/# of innovative ideas generated%
Return on InvestmentEnhancement in quality performance% increase in quality%
Enhancement in communication performance% increase in communication efficiency%
Enhancement in productivity% increase in productivity%
Enhancement in cost performance% decrease in cost/budget%
Enhancement in time performance% decrease in time spent%
Strategic AlignmentAttention from management level on innovationNo attention from the management level on innovation and not supportive when coming to innovative activities.
Strong, enthusiastic, accountable, dedicated, supportive and attentive management level on innovation.
Ordinal Scale
% of investment in R&D/revenueInvestment in R&D/Total Revenue%
% of strategies/policies regarding innovation# of innovation related strategies/policies/Total # of strategies and policies%

References

  1. Collison, C. Knowledge Management; Computer Press: Brno, Czech Republic, 2005. [Google Scholar]
  2. Hamel, G.; Green, B. The Future of Management; Harvard Business School Press: Boston, MA, USA, 2007. [Google Scholar]
  3. Bartes, F. Competitive Intelligence. In Management, Economics and Business Development in European Conditions; Brno University of Technology: Brno, Czech Republic, 2009; ISBN 978-80-214-3893-4. [Google Scholar]
  4. Tushman, M.; Nadler, D. Organizing for Innovation. Calif. Manag. Rev. 1986, 28, 74–92. [Google Scholar] [CrossRef]
  5. Boston Consulting Group for the World Economic Forum (2017). Shaping the Future of Construction Inspiring innovators Redefine the Industry. Available online: http://www3.weforum.org/docs/WEF_Shaping_the_Future_of_Construction_Inspiring_Innovators_redefine_the_industry_2017.pdf (accessed on 10 August 2020).
  6. Teicholz, P. Labor-Productivity Declines in the Construction Industry: Causes and Remedies (Another Look). AECbytes Viewpoint. 2013. Available online: http://www.aecbytes.com/viewpoint/2013/issue_67.html (accessed on 18 November 2013).
  7. Kunz, J.; Fischer, M. Virtual Design and Construction: Themes, Case Studies and Implementation Suggestions; CIFE Working Paper #097; Department of Civil & Environmental Engineering, Stanford University: Stanford, CA, USA, 2012. [Google Scholar]
  8. Mandujano, M.G.; Mourgues, C.; Alarcon, L.F.; Kunz, J. Modeling virtual design and construction implementation strategies considering lean management impacts. Comput. Aided Civ. Infrastruct. Eng. 2017, 32, 930–951. [Google Scholar] [CrossRef]
  9. Woudhuysen, J.; Abley, I. Why Is Construction So Backward? Wiley Academy: Chichester, UK, 2004. [Google Scholar]
  10. Abadi, A. A Study of Innovation Perception within the Construction Industry. Ph.D. Thesis, University of Manchester, Manchester, UK, 2014. [Google Scholar]
  11. National Endowments for the Arts. 2007 Annual Report. Available online: https://www.arts.gov/sites/default/files/AR2007.pdf (accessed on 10 May 2021).
  12. National Civic Art Society. Americans’ Preferred Architecture for Federal Buildings. 2020. Available online: https://static1.squarespace.com/static/59bfe5dbf14aa1b6bbb12cd0/t/5f845dfda65e566a0e0a8d32/1602510358640/Americans%27-Preferred-Architecture-for-Federal-Buildings-National-Civic-Art-Society-Harris-Poll-Survey.pdf (accessed on 10 May 2021).
  13. Dom’s Plan B Blog. 2018. Available online: https://domz60.wordpress.com/tag/popular/ (accessed on 10 May 2021).
  14. Lo, S.M.; Lam, K.C.; Fang, Z. An Investigation on the building officials’ perception for the use of performance based fire engineering approach in building design. Fire Technol. 2002, 38, 271–286. [Google Scholar] [CrossRef]
  15. Kabanoff, B.; Brown, S. Knowledge structures of prospectors, analyzers and defenders: Content, structure, stability and performance. Strateg. Manag. J. 2008, 29, 149–171. [Google Scholar] [CrossRef]
  16. Popova, V.; Sharpanskykh, A. Modeling organizational performance indicators. Inf. Syst. 2010, 35, 505–527. [Google Scholar] [CrossRef]
  17. Grigoroudis, E.; Orfanoudaki, E.; Zopounidis, C. Strategic performance measurement in a healthcare organisation: A multiple criteria approach based on balanced scorecard. Omega 2012, 40, 104–119. [Google Scholar] [CrossRef]
  18. Kompalla, A.; Buchmuller, M.; Heinemann, B.; Kopia, J. Performance measurement of management system standards using the balanced scorecard. Amfiteatru Econ. 2017, 19, 981–1002. [Google Scholar]
  19. Adams, R.; Bessant, J.; Phelps, R. Innovation management measurement: A review. Int. J. Manag. Rev. 2006, 8, 21–47. [Google Scholar] [CrossRef]
  20. Crossan, M.M.; Apaydin, M. A multi-dimensional framework of organizational innovation: A systematic review of the literature. J. Manag. Stud. 2010, 47, 1154–1191. [Google Scholar] [CrossRef]
  21. Subramanian, A.; Nilakanta, S. Organizational innovativeness: Exploring the relationship between organizational determinants of innovation, types of innovations, and measures of organizational performance. Omega 1996, 24, 631–647. [Google Scholar] [CrossRef]
  22. de Jong, M.; Marston, N.; Roth, E.; van Biljon, P. The Eight Essentials of Innovation Performance; McKinsey & Company: New York, NY, USA, 2013. [Google Scholar]
  23. Roszko-Wójtowicz, E.; Białek, J. A multivariate approach in measuring innovation Performance. J. Econ. Bus. 2016, 34, 443–479. [Google Scholar] [CrossRef]
  24. Serrano-Bedia, A.M.; López-Fernández, M.C.; García-Piqueres, G. Complementarity between innovation knowledge sources: Does the innovation performance measure matter? Bus. Res. Q. 2018, 21, 53–67. [Google Scholar] [CrossRef]
  25. Grillitsch, M.; Schubert, T.; Srholec, M. Knowledge base combinations and firm growth. Res. Policy 2019, 48, 234–247. [Google Scholar] [CrossRef]
  26. Brenner, T.; Broekel, T. Methodological issues in measuring innovation performance of spatial units. Ind. Innov. 2011, 18, 7–37. [Google Scholar] [CrossRef]
  27. Ghazinoory, S.; Riahi, P.; Azar, A.; Miremadi, T. Measuring innovation performance of developing regions: Learning and catch-up in provinces of Iran. Technol. Econ. Dev. Econ. 2014, 20, 507–533. [Google Scholar] [CrossRef]
  28. McKinsey Report 2016. Imagining Construction’s Digital Future. Available online: https://www.mckinsey.com/business-functions/operations/our-insights/imagining-constructions-digital-future (accessed on 10 May 2021).
  29. Svandova, E.; Jirásek, M. On measuring countries’ innovation performance: Organisational level perspective. Acta Univ. Agric. Silvic. Mendel. Brun. 2019, 67, 871–881. [Google Scholar] [CrossRef] [Green Version]
  30. Carrillo, M. Measuring and ranking R&D performance at the country level. Econ. Sociol. 2019, 12, 100–114. [Google Scholar] [CrossRef]
  31. The Next Normal in Construction; McKinsey Report 2020; McKinsey & Company: New York, NY, USA, 2020; Available online: https://www.mckinsey.com/~/media/McKinsey/Industries/Capital%20Projects%20and%20Infrastructure/Our%20Insights/The%20next%20normal%20in%20construction/The-next-normal-in-construction.pdf (accessed on 10 May 2021).
  32. Zawawi, N.F.M.; Wahab, S.A.; Al-Mamun, A.; Yaacob, A.S.; NKSamy Fazal, S.A. Defining the concept of innovation and firm innovativeness: A critical analysis from resource-based view perspective. Int. J. Bus. Manag. 2016, 11, 87–94. [Google Scholar] [CrossRef]
  33. Siksnelyte-Butkiene, I.; Streimikiene, D.; Balezentis, T.; Skulskis, V. A systematic literature review of multi-criteria decision-making methods for sustainable selection of insulation materials in buildings. Sustainability 2021, 13, 737. [Google Scholar] [CrossRef]
  34. Li, Y.F.; Song, Y.; Wang, J.X.; Li, C.W. Intellectual capital, knowledge sharing, and innovation performance: Evidence from the Chinese construction industry. Sustainability 2019, 11, 2713. [Google Scholar] [CrossRef] [Green Version]
  35. Zheng, J.W.; Wu, G.D.; Xie, H.T. Impacts of leadership on project-based organizational innovation performance: The mediator of knowledge sharing and moderator of social capital. Sustainability 2017, 9, 1893. [Google Scholar] [CrossRef] [Green Version]
  36. Wang, Q.; Zhao, L.W.; Chang-Richards, A.; Zhang, Y.Y.; Li, H.J. Understanding the impact of social capital on the innovation performance of construction enterprises: Based on the mediating effect of knowledge transfer. Sustainability 2021, 13, 5099. [Google Scholar] [CrossRef]
  37. Kim, D.G.; Choi, S.O. Impact of construction it technology convergence innovation on business performance. Sustainability 2018, 10, 3972. [Google Scholar] [CrossRef] [Green Version]
  38. Xue, X.L.; Zhang, R.X.; Wang, L.; Fan, H.Q.; Yang, R.J.; Dai, J. Collaborative in-novation in construction project: A social network perspective. KSCE J. Civ. Eng. 2018, 22, 417–427. [Google Scholar] [CrossRef]
  39. Chen, T.; Huang, G.Q.; Olanipekun, A.O. Simulating the evolution mechanism of inner innovation in large-scale construction enterprise with an improved NK model. Sustainability 2018, 10, 4221. [Google Scholar] [CrossRef] [Green Version]
  40. Ozorhon, B. Analysis of construction innovation process at project level. J. Manag. Eng. 2013, 29, 455–463. [Google Scholar] [CrossRef]
  41. Lai, X.D.; Liu, J.X.; Georgiev, G. Low carbon technology integration innovation assessment index review based on rough set theory—An evidence from construction industry in China. J. Clean. Prod. 2016, 126, 88–96. [Google Scholar] [CrossRef]
  42. Le, Y.; Wan, J.Y.; Wang, G.; Bai, J.; Zhang, B. Exploring the missing link between top management team characteristics and megaproject performance. Eng. Constr. Archit. Manag. 2020, 27, 1039–1064. [Google Scholar]
  43. Hartmann, T.; Levitt, R.E. Understanding and managing three-dimensional/four-dimensional model implementations at the project team level. ASCE J. Constr. Eng. Manag. 2010, 136, 757–767. [Google Scholar] [CrossRef] [Green Version]
  44. Cao, D.P.; Li, H.; Wang, G.B.; Luo, X.C.; Yang, X.C.; Tan, D. Dynamics of project-based collaborative networks for BIM implementation: Analysis based on stochastic actor-oriented models. J. Manag. Eng. 2017, 33, 04016055. [Google Scholar] [CrossRef]
  45. Miterev, M.; Mancini, M.; Turner, R. Towards a design for the project-based organization. Int. J. Proj. Manag. 2017, 35, 479–491. [Google Scholar] [CrossRef]
  46. Taylor, J.E.; Levitt, R.E. Understanding and Managing Systemic Innovation in Project-Based Industries; Global Projects Center, Stanford University: Stanford, CA, USA, 2004; Available online: https://gpc.stanford.edu/sites/default/files/taylorlevitt2004_0.pdf (accessed on 10 May 2021).
  47. Nasrallah, W.; Levitt, R.; Glynn, P. Interaction value analysis: When structured communication benefits organizations. Organ. Sci. 2003, 14, 541–557. [Google Scholar] [CrossRef] [Green Version]
  48. Wei, Y.H.; Miraglia, S. Organizational culture and knowledge transfer in project-based organizations: Theoretical insights from a Chinese construction organization. Int. J. Proj. Manag. 2017, 35, 571–585. [Google Scholar] [CrossRef]
  49. The KPI Working Group. KPI Report for the Minister for Construction; Department of the Environment, Transport and the Regions: London, UK, 2000. [Google Scholar]
  50. Cruz-Cázares, C.; Bayona-Sáez, C.; García-Marco, T. You can’t manage right what you can’t measure well: Technological innovation efficiency. Res. Policy 2013, 42, 1239–1250. [Google Scholar] [CrossRef]
  51. Yu, A.Y.; Shi, Y.; You, J.X.; Zhu, J. Innovation performance evaluation for high-tech companies using a dynamic network data envelopment analysis approach. Eur. J. Oper. Res. 2021, 292, 199–212. [Google Scholar] [CrossRef]
  52. European Commission. Science, Research and Innovation Performance of the EU. Directorate-General for Research and Innovation, European Commission. Available online: https://op.europa.eu/s/pBoz (accessed on 11 August 2021).
  53. Gaulta, F. Defining and measuring innovation in all sectors of the economy. Res. Policy 2018, 47, 617–622. [Google Scholar] [CrossRef]
  54. Birchall, D.; Chanaron, J.; Tovstiga, G.; Hillenbrand, C. Innovation performance measurement: Current practices, issues and management challenges. Int. J. Technol. Manag. 2011, 56, 1–20. [Google Scholar] [CrossRef]
  55. Henttonen, K.; Ojanen, V.; Puumalainen, K. Searching for appropriate performance measures for innovation and development projects. R&D Manag. 2016, 46, 914–927. [Google Scholar]
  56. Schwartz, L.; Miller, R.; Plummer, D.; Fusfeld, A.R. Measuring the effectiveness of R&D. Res. Technol. Manag. 2011, 54, 29–36. [Google Scholar]
  57. Chobotová, M.; Rylková, Ž. Measurement of innovation performance. Int. J. Econ. Manag. Eng. 2014, 8, 2085–2090. [Google Scholar]
  58. Neely, A.; Hii, J. Innovation and Business Performance: A Literature Review; Report for the Judge Institute of Management Studies; University of Cambridge: Cambridge, UK, 1998. [Google Scholar]
  59. Werner, B.M.; Souder, W.E. Measuring R&D performance—State of the art. Res. Technol. Manag. 1997, 38, 22–39. [Google Scholar]
  60. Rogers, E.M. Diffusion of Innovations, 5th ed.; Free Press: New York, NY, USA, 2003. [Google Scholar]
  61. Taques, F.H.; López, M.G.; Basso, L.F.; Areal, N. Indicators used to measure service innovation and manufacturing innovation. J. Innov. Knowl. 2021, 6, 11–26. [Google Scholar] [CrossRef]
  62. Walker, R.M.; Chen, J.Y.; Aravind, D. Management innovation and firm performance: An integration of research findings. Eur. Manag. J. 2015, 33, 407–422. [Google Scholar] [CrossRef] [Green Version]
  63. BCG. Innovation 2007: A BCG Senior Management Survey; The Boston Consulting Group: Boston, MA, USA, 2007. [Google Scholar]
  64. Calantone, R.J.; Harmancioglu, N.; Droge, C. Inconclusive innovation “Returns”: A meta-analysis of research on innovation in new product development. J. Prod. Innov. Manag. 2010, 27, 1065–1081. [Google Scholar] [CrossRef]
  65. Chen, J.; Damanpour, F.; Reilly, R.R. Understanding antecedents of new product development speed: A meta-analysis. J. Oper. Manag. 2010, 28, 17–33. [Google Scholar] [CrossRef]
  66. Silva, J.J.; Cirani, C.B.S. The capability of organizational innovation: Systematic review of literature and research proposals. Gestão Produção. 2020, 27, e4819. [Google Scholar] [CrossRef]
  67. Sears, G.J.; Baba, V.V. Toward a multi-stage, multi-level theory of innovation. Can. J. Adm. Sci. 2011, 28, 357–372. [Google Scholar] [CrossRef]
  68. Lame, G. Systematic Literature Reviews: An Introduction. In Proceedings of the 22nd International Conference on Engineering Design (ICED19), Delft, The Netherlands, 5–8 August 2019. [Google Scholar] [CrossRef] [Green Version]
  69. Xiao, Y.; Watson, M. Guidance on conducting a systematic literature review. J. Plan. Educ. Res. 2019, 39, 93–112. [Google Scholar] [CrossRef]
  70. Carter, N.; Bryant-Lukosius, D.; DiCenso, A.; Blythe, J.; Neville, A.J. The use of triangulation in qualitative research. Oncol. Nurs. Forum 2014, 41, 545–547. [Google Scholar] [CrossRef] [PubMed]
  71. Meijer, P.C.; Verloop, N.; Beijaard, D. Multi-Method triangulation in a qualitative study on teachers’ practical knowledge: An attempt to increase internal validity. Qual. Quant. 2002, 36, 145–167. [Google Scholar] [CrossRef]
  72. Risjord, M.W.; Dunbar, S.B.; Moloney, M.F. A new foundation for methodological triangulation. J. Nurs. Scholarsh. 2002, 34, 269–275. [Google Scholar] [CrossRef] [PubMed]
  73. Kitchenham, B.; Brereton, O.P.; Budgen, D.; Turner, M.; Bailey, J.; Linkman, S. Systematic literature reviews in software engineering–A systematic literature review. Inf. Softw. Technol. 2009, 51, 7–15. [Google Scholar] [CrossRef]
  74. Kitchenham, B.; Brereton, O.P. A systematic review of systematic review process research in software engineering. Inf. Softw. Technol. 2013, 55, 2049–2075. [Google Scholar] [CrossRef]
  75. Purssell, E.; McCrae, N. How to Perform a Systematic Literature Review; Springer: Berlin/Heidelberg, Germany, 2020; ISBN 978-3-030-49671-5. [Google Scholar]
  76. Nankervis, A.R.; Compton, R. Performance management: Theory in practice? Asia Pac. J. Hum. Resour. 2006, 44, 83–101. [Google Scholar] [CrossRef]
  77. Dijk, D.V.; Schodl, M.M. Performance Appraisal and Evaluation. In International Encyclopedia of the Social & Behavioral Sciences, 2nd ed.; Wright, J., Ed.; Elsevier: Amsterdam, The Netherlands, 2015; pp. 716–721. [Google Scholar]
  78. Hong, J.; Liao, Y.; Zhang, Y.; Yu, Z. The effect of supply chain quality management practices and capabilities on operational and innovation performance: Evidence from Chinese manufacturers. Int. J. Prod. Econ. 2019, 212, 227–235. [Google Scholar] [CrossRef]
  79. Okoli, C.; Schabram, K. A guide to conducting a systematic literature review of information systems Research. Sprouts Work. Pap. Inf. Syst. 2010, 10. [Google Scholar] [CrossRef] [Green Version]
  80. Breretona, P.; Kitchenhama, B.A.; Budgenb, D.; Turnera, M.; Khalilc, M. Lessons from applying the systematic literature review process within the software engineering domain. J. Syst. Softw. 2007, 80, 571–583. [Google Scholar] [CrossRef] [Green Version]
  81. Gates, S. Review of methodology of quantitative reviews using meta-analysis in ecology. J. Anim. Ecol. 2002, 71, 547–557. [Google Scholar] [CrossRef]
  82. Gomersall, J.S.; Jadotte, Y.T.; Xue, Y.F.; Lockwood, S.; Riddle, D.; Preda, A. Conducting systematic reviews of economic evaluations. Int. J. Evid. Based Healthc. 2015, 13, 170–178. [Google Scholar] [CrossRef]
  83. Nazim, A.S.; Young, H.C.; Ali, N.M. Determining the quality of publications and research for tenure or promotion decisions. Libr. Rev. 1996, 45, 39–53. [Google Scholar] [CrossRef]
  84. Dixon-Woods, M.; Agarwal, S.; Jones, D.; Young, B.; Sutton, A. Synthesizing qualitative and quantitative evidence: A review of possible methods. J. Health Serv. Res. Policy 2005, 10, 45–53. [Google Scholar] [CrossRef]
  85. Chen, F.; Zhao, T.; Liao, Z. The impact of technology-environmental innovation on CO2 emissions in China’s transportation sector. Environ. Sci. Pollut. Res. 2020, 27, 29485–29501. [Google Scholar] [CrossRef]
  86. Dziallas, M.; Blind, K. Innovation indicators throughout the innovation process: An extensive literature analysis. Technovation 2019, 80, 3–29. [Google Scholar] [CrossRef]
  87. Piro, F.N. The R&D composition of European countries: Concentrated versus dispersed profiles. Scientometrics 2019, 119, 1095–1119. [Google Scholar]
  88. Brogi, S.; Menichini, T. Do the ISO 14001 Environmental management systems influence eco-innovation performance? Evidences from the EU context. Eur. J. Sustain. Dev. 2019, 8, 292–303. [Google Scholar] [CrossRef]
  89. Popadic, I.; Borocki, J.; Radisic, M.; Stefanic, I.; Duspara, L. The challenges while measuring enterprise innovative activities—the case from a developing country. Teh. Vjesn. Tech. Gaz. 2018, 25, 452–459. [Google Scholar]
  90. Garcia-Granero, E.M.; Piedra-Munoz, L.; Galdeano-Gomez, E. Eco-innovation measurement: A review of firm performance indicators. J. Clean. Prod. 2018, 191, 304–317. [Google Scholar] [CrossRef]
  91. Mehta, S. National innovation system of India: An empirical analysis. Millenn. Asia 2018, 9, 203–224. [Google Scholar] [CrossRef]
  92. Nwachukwu, C.; Chladkova, H.; Fadeyi, O. Strategy formulation process and innovation performance nexus. Int. J. Qual. Res. 2018, 12, 147–164. [Google Scholar]
  93. Mazur, K.; Inkow, M. Methodological aspects of innovation performance measurement in the IT sector. Management 2017, 21, 14–27. [Google Scholar] [CrossRef] [Green Version]
  94. Ocnarescu, I.; Bouchard, C. Memorable projects and aesthetic experiences in an industrial R&D lab. Soc. Bus. Rev. 2017, 12, 285–301. [Google Scholar]
  95. Moagar-Poladian, S.; Folea, V.; Paunica, M. Competitiveness of EU member states in attracting EU funding for research and innovation. Rom. J. Econ. Forecast. 2017, 20, 150–167. [Google Scholar]
  96. Plewa, M. Long-Run dynamics between product life cycle length and innovation performance in Manufacturing. Int. J. Innov. Manag. 2017, 21, 1750006. [Google Scholar] [CrossRef]
  97. Noktehdan, M.; Shahbazpour, M.; Wilkinson, S. Driving innovative thinking in the New Zealand construction industry. Buildings 2015, 5, 297–309. [Google Scholar] [CrossRef]
  98. Cheng, C.C.J.; Huizingh, E.K.R.E. When is open innovation beneficial? The role of strategic orientation. J. Prod. Innov. Manag. 2014, 31, 1235–1253. [Google Scholar] [CrossRef]
  99. Price Waterhouse Coopers. Guide to Key Performance Indicators; Connected Thinking; Price Waterhouse Coopers LLP: London, UK, 2007. [Google Scholar]
  100. Manoochehri, G. Measuring innovation: Challenges and best practices. Calif. J. Oper. Manag. 2010, 8, 67–73. [Google Scholar]
  101. Patton, M.Q. Enhancing the quality and credibility of qualitative analysis. HSR 1999, 34, 1189–1208. [Google Scholar]
  102. Patton, M.Q. Qualitative Research & Evaluation Methods: Integrating Theory and Practice, 4th ed.; SAGE: Thousand Oaks, CA, USA, 2015. [Google Scholar]
  103. Ashour, M. Triangulation as a powerful methodological research technique in technology-based services. Bus. Manag. Stud. Int. J. 2018, 6, 193–208. [Google Scholar] [CrossRef]
  104. Edwards, W. How to use multiattribute utility measurement for social decisionmaking. IEEE Trans. Syst. Man Cybern. 1977, 7, 326–340. [Google Scholar] [CrossRef]
  105. Olson, D.L. Smart. In Decision Aids for Selection Problems; Springer: New York, NY, USA, 1996; pp. 34–48. [Google Scholar]
  106. Risawandi, R.R. Study of the simple multi-attribute rating technique for decision support. Decis. Mak. 2016, 4, C4. [Google Scholar]
  107. Conejar, R.J.; Kim, H.K. A medical decision support system (DSS) for ubiquitous healthcare diagnosis system. Int. J. Softw. Eng. Appl. 2014, 8, 237–244. [Google Scholar]
  108. Kasie, F.M. Combining simple multiple attribute rating technique and analytical hierarchy process for designing multi-criteria performance measurement framework. Glob. J. Res. Eng. 2013, 13, 15–29. [Google Scholar]
  109. Taylor, J.M., Jr.; Love, B.N. Simple multi-attribute rating technique for renewable energy deployment decisions (SMART REDD). J. Def. Model. Simul. 2014, 11, 227–232. [Google Scholar] [CrossRef]
  110. Amato, F.; Casola, V.; Esposito, M.; Mazzeo, A.; Mazzocca, N. A smart decision support systems based on a fast classifier and a semantic post reasoner. Int. J. Syst. Syst. Eng. 2013, 4, 317–336. [Google Scholar] [CrossRef]
  111. Fitriani, N.; Suzanti, I.O.; Jauhari, A.; Khozaimi, A. Application monitoring and evaluation using SMART (Simple Multi attribute Rating Technique) Method. J. Phys. Conf. Ser. 2020, 1569, 022090. [Google Scholar] [CrossRef]
Figure 1. SLR and Triangulation Approach Process.
Sustainability 13 09038 g001
Figure 2. Overall Flow of the SLR.
Sustainability 13 09038 g002
Figure 3. Initial Stage for Information Gathering (Brief Screening).
Sustainability 13 09038 g003
Figure 4. Flow of First-Step Consultation Process.
Sustainability 13 09038 g004
Figure 5. Second Stage Consultation with Experts.
Sustainability 13 09038 g005
Table 1. Keyword Search on Web of Science (1 July 2011 to 30 June 2021).
Keyword Search by:No. of ArticlesRemarks
Innovation + Performance + Measure4None relating to AEC industry
Innovation + Performance + Evaluation6None relating to AEC industry
Innovation + Performance + Assessment2None relating to AEC industry
Innovation + Performance and Construction199 out of 19 articles relating to AEC industry
Table 2. Keyword Search on Web of Science (1 July 2011 to 30 June 2021).
ArticlesKey Objectives of the Research (Information Extracted from the Abstract of the Article)
1.
Li, YF; Song, Y; Wang, JX; Li, CW [34]
Intellectual capital not only has a direct positive influence on the innovation performance of construction enterprises, but also positively affects their innovation performance through knowledge sharing.
2.
Zheng, JW; Wu, GD; Xie, HT [35]
Project managers should promote a higher stimulation of a leadership behavior, encouraging knowledge management, and establishing social capital, thus improving the innovation performance of project-based organizations in construction projects.
3.
Wang, Q; Zhao, LW; Chang-Richards, A; Zhang, YY; Li, HJ [36]
The research results can not only improve an understanding of effects of social capital on the innovation performances of construction enterprises, but also validates the importance of knowledge transfer in stimulating innovation performance.
4.
Kim, DG; Choi, SO [37]
It is found that any improvement of IT convergence innovation competence such as business efficiency IT index, collaboration IT index, and strategy management IT index has a positive impact on the production process, financial performance, and customer satisfaction with the services the companies provided.
5.
Xue, XL; Zhang, RX; Wang, L; Fan, HQ; Yang, RJ; Dai, J [38]
The decomposition of a collaborative relationship with network analysis contributes to a better understanding of the innovation process in construction projects. In particular, key nodes which influence construction innovation through collaborative relationships are revealed and analyzed.
6.
Chen, T; Huang, GQ; Olanipekun, AO [39]
This study reveals the mutual effects of the factors in the inner innovation system in Large Scale Construction Enterprises and provides an effective model for internal systems analyses in the construction industry and in other sectors.
7.
Ozorhon, B [40]
Collaborative working among team members and strong commitment prove to be the primary enablers of innovation; reluctance, inexperience, and cost are regarded as barriers to innovation. This study helps to develop a better understanding of the inter-organizational nature of construction innovations, thereby improving innovation performance.
8.
Lai, XD; Liu, JX; Georgiev, G [41]
An integration innovation management evaluation model is needed for the sustainability evaluation in the construction practice. Its development is the main scientific objective of this study, by taking into consideration the entire life cycle assessment and various other factors.
9.
Le, Y; Wan, JY; Wang, G; Bai, J; Zhang, B [42]
The purpose of this paper is to analyze the relationship between the demographic characteristics of top management teams (i.e., age, gender, administrative level, senior management experience and educational background) and megaproject performance, with respect to schedule, cost, quality, safety and technological innovation. The findings revealed that age has a significant influence on schedule performance; gender has a significant influence on safety performance; senior management experience has a significant influence on cost performance; and educational background has a significant influence on both schedule and technological innovation performance.
Table 3. Protocol for the Review.
CriteriaAction/Remarks
Purpose of the Study
  • To investigate organizations’ performance evaluation in respect of innovation issues
Research Issues
  • To establish the innovation performance indicators/metrics for evaluation
Inclusion Criteria
  • To include performance indicators for AEC organizations
Search Strategies
  • To search the information from high-quality literature, i.e., from renowned electronic indexing systems
Screening Procedures
  • To compile a list of keywords according to the research issues
  • To identify a high-quality electronic indexing system—SCI/SSCI listed journals in the Web of Science system
  • To perform searches in the electronic system
  • To identify articles that have relevant titles
  • To extract the abstracts of relevant articles for review
  • To identify articles that have relevant abstracts
  • To download full relevant articles for scrutinization
Data Extraction Approach
  • To extract the information, in particular the indicators and metrics presented in the relevant articles
  • To remark the background information of the studies
  • To categorize the information according to the nature of the articles, the field, and the time
Synthesis and Reporting
  • To summarize the information collected
  • To group the information according to the categories given in the previous step
  • To consolidate the information and provide remarks to each indicator
  • To report the list of indicators
Table 4. Summary of articles extracted by first stage literature review.
ArticleAim/Objective of the StudyIndicators/Metrics (Presented or Mentioned in the Article)Implied Ideas/Meaning of the IndicatorsIndicator Categories Designated
Chen F, Zhao T, Liao Z (2020) [85]To study the influence of technological–environmental innovation indicator systems on CO2 emissions of China’s transportation sector.
  • Innovation performance
  • Innovation resources
  • Knowledge innovation
  • Innovation environment
  • Innovation activities
  • Financial and human resources
  • Knowledge creation
  • Organization support (training and knowledge sharing, etc.)
  • innovation process
  • finance resources
  • people & organization;
  • creativity of employees
  • training
  • knowledge sharing
Dziallas, M., & Blind, K. (2019) [86]Literature review on innovation indicators based on the different stages of innovation. The review
identifies 82 unique indicators to evaluate innovations under different dimensions.
Note: Only company-specific categories will be listed below:
  • Strategy
  • Innovation culture
  • Competence and knowledge
  • Organizational structure
  • R&D activities and input
  • Financial performance
  • Innovative products
  • Innovation process
  • Innovation project management
  • Strategy
  • Innovation culture
  • Competence and knowledge
  • Organizational structure
  • R&D activities and input
  • Financial performance
  • Innovation outcome (innovation product, etc.)
  • people & organization
  • knowledge sharing
  • people & organization
  • creativity of employees
  • financial resources
  • innovation process
  • resultant of new ideas implementation of new ideas
Piro FN (2019) [87]To study the R&D composition of European countries and whether the profiles are associated with Research and Innovation performance indicators.
  • R&D systems
  • Intellectual assets
  • Culture
  • Creativity
  • Ideas creation and implementation
  • Organization strategies
  • People and organization structure/culture
  • Creativity of people
  • implementation of ideas
  • quality of ideas
  • people & organization
  • creativity of employees
  • resultant of new ideas
Brogi S, Menichini T (2019) [88]To study to what extent the ISO certification of Environmental Management Systems influences eco-innovation performance.
  • Financial or human resources
  • R&D personnel and researchers
  • Early stage investments
  • Level of advancement and implementation of eco-innovation
  • Resource efficiency Outcomes
  • Financial and human resources
  • Organization support
  • R&D investment
  • Innovation process and implementation
  • Output/product efficiency
  • finance resources
  • people & organization
  • finance resources
  • quality of ideas
  • innovation process
  • implementation of new ideas
  • resultant of new ideas
  • customers’ satisfaction
Popadic et al. (2018) [89]This article presents the results of innovation activities analyses on a given sample of Small-Medium Enterprises.
  • Income growth rate
  • Level of customer’s satisfaction
  • Deadlines of responses to customer requirements
  • Employee productivity
  • No of new products/services
  • Available technological knowledge of employees
  • Growth rate of new customers
  • The number of key customer orders increase
  • Customer Loyalty (Number of Repeated Orders)
  • Output/product returns
  • Output/product efficiency
  • Processing efficiency
  • New/innovative idea
  • Knowledge
  • Customers’ satisfaction
  • Competence of employees
  • people & organization
  • financial resources
  • resultant of new ideas
  • customer’s satisfaction
  • implementation of new ideas
  • innovation process
  • quality of new ideas
  • creativity of employees
Garcia-Granero EM, Piedra-Munoz L Galdeano-Gomez E (2018) [90]To perform a critical review of literature on eco-innovation performance indicators.
  • Product
  • Process
  • Organization
  • Marketing
  • Customer’s expectation and satisfaction
  • Process (efficiency)
  • Organization (support/strategy)
  • Marketing (returns/financial situation)
  • customers’ satisfaction
  • resultant of new ideas
  • quality of new ideas
  • innovation process
  • financial resources
  • people & organization
Mehta S (2018) [91]To study empirically the national innovation system of India.Input:
  • Expenditure on R&D
  • Human capital: knowledge & education
Output:
  • Productivity
  • Patents
  • Proportion of high-tech exports
  • Financial support
  • Knowledge/Training
  • Process efficiency
  • Quality of new ideas (patents)
  • financial resources
  • knowledge sharing
  • training
  • quality of new ideas
  • innovation process
  • implementation of new ideas
Nwachukwu C, Chladkova H, Fadeyi O (2018) [92]To study the link between strategy formulation process and innovation performance indicators in microfinance banks.
  • Product
  • Process
  • Market
  • Strategic formulation
  • Product: customer’s expectation and satisfaction
  • Process: implementation and efficiency
  • Returns/financial situation
  • Strategy: organizational strategy
  • customers’ satisfaction
  • financial resources
  • implementation of new ideas
  • quality of new ideas
  • innovation process
  • resultant of new ideas
Mazur K, Inkow M (2017) [93]To examine what innovation performance indicators are appropriate for research on innovation process in the IT sector.
  • Workforce creativity
  • Knowledge sharing
  • R&D input and outputs
  • New products or patents
  • Employee creativity
  • Knowledge/training
  • Financial support
  • New ideas
  • creativity of employees
  • training
  • knowledge sharing
  • quality of new ideas
  • resultant of new ideas
  • people & organization
Ocnarescu I, Bouchard, C (2017) [94]To study the mechanism of aesthetic experiences of work in a research and innovation context—an R&D laboratory of a multinational communications and information technology company.
  • R&D researchers’ aesthetic experiences
  • People
  • Organization structure
  • Employee creativity
  • Researchers’ Knowledge
  • employees’ creativity
  • quality of ideas
  • people and organization
  • implementation of new ideas
Moagar-Poladian S, Folea V, Paunica M (2017) [95]The article presents a study on the competitiveness of European Union Member States in terms of research and innovation from the perspective of attracting EU funding for research, as well as from the viewpoint of key science and innovation performance indicators.
  • Technological innovation
  • Employment in knowledge-intensive activities
  • Competitiveness of knowledge-intensive goods and services
  • Employment
  • R&D intensity
  • Knowledge/Training
  • Customer’s satisfaction/competitiveness
  • Financial and human resources
  • knowledge sharing;
  • training
  • customers’ satisfaction;
  • quality of idea
  • resultant of new ideas
  • finance resources;
  • people and organization
Plewa M (2017) [96]To study the long-run dynamics between product life cycles and key innovation performance indicators.
  • Time-To-Market
  • Development Speed
  • Impact
  • Profitability
  • Industry Consequences
  • Capabilities
  • Quality
  • Success
  • Process (efficiency)
  • Customer’s satisfaction (impact)
  • Profit/Returns
  • Quality of products
  • Success
  • innovation process implementation of new ideas
  • customers’ satisfaction
  • resultant of new ideas
  • quality of new ideas
  • finance resources
Noktehdan M, Shahbazpour M, Wilkinson S (2015) [97]To study the relationship between innovation and productivity improvement in the construction industry.
  • Innovation Type
  • Innovation Novelty
  • Innovation Benefit
  • New ideas
  • Creativity
  • Number of new ideas
  • Returns
  • Customers satisfaction
  • employee’s creativity
  • quality of new ideas
  • implementation of new ideas
  • resultant of new ideas
  • customers’ satisfaction
Cheng CCJ, Huizingh EKRE (2014) [98]To study the relation between open innovation and innovation performance.
  • new product/service innovativeness
  • new product/service success customer performance
  • financial performance
  • New idea
  • Quality of new ideas
  • Number of new ideas
  • Financial support
  • Customer’s satisfaction
  • quality of new ideas
  • implementation of new ideas
  • finance resources;
  • resultant of new ideas
  • customers’ satisfaction
Table 5. Consolidated list of indicators—initial set.
Consolidated Metric Category (Indicators)Descriptions/Explanations
Financial ResourcesDescribes the financial resources an organization is willing to invest in innovation-related activities, including, but not limited to, establishing grants for supporting pilot projects, holding idea competitions with financial incentives and financial support on investing in new technologies, etc.
Innovation ProcessDescribes the systematic process in the firm that an innovative idea will go through, including how the process helps incentivize idea generation, implementation, the flow of the new ideas from generation to implementation (or even commercialization), etc.
Creativity of EmployeesDescribes the creativity of employees when solving problems in their work process and how willing they are to share their new ideas with the organization.
People and OrganizationsIncludes organization culture, management structure, technological environment, infrastructure, and leadership. Describes employee engagement in the innovation process and how well the current organization is to support innovation.
TrainingIncludes training sessions provided by the organization for the employee to learn new technologies or approaches. It also includes how the organization supports the self-development of the employee, such as subsidiaries for employees to take related online courses.
Knowledge SharingIncludes the means and methods by which the organization supports knowledge sharing among its employees; how advanced implementation can be transferred from one team to another.
Implementation of New IdeasIncludes the efficiency of the implementation of new ideas, the diffusion rate of new ideas, etc. How the new idea/concept/method is being implemented in the organization; the strategies used.
Quality of New IdeasIncludes the measurement of the sustainability, scalability, and effectiveness of the idea, reflecting how well the idea is for bringing value to the organization.
Resultant of New IdeasIncludes enhancement of project satisfaction, cost, time, quality, organization’s image, competitiveness, etc. In other words, the performance chang led by the innovation, e.g., return of investment.
Customers’ SatisfactionClients’ satisfaction; end-users’ satisfaction; and revenue.
Table 6. Description of First-Step Conversation Interviews.
Major ItemsDescriptions/InformationDecision/Actions
Establish initial set of indicators by SLR--------
Inviting senior professionals in the US to join the conversation/discussions/chatting/written communications for vetting an initial set of indicators
  • Discuss with experts’ and solicit their comments on the definition/usefulness/measurement, etc., of each indicator by using open-ended questions
Record comments and discuss with other experts
Assess the usefulness of the indicator: “training and knowledge sharing”
  • Collect experts’ comments on the “training and knowledge sharing” indicator
  • None of the experts specifically considered training as an independent indicator
  • Knowledge sharing and training are regarded as similar and can be grouped together
  • It is suggested that the “idea pool” can be set as an indicator to replace knowledge sharing
Delete “training and knowledge sharing”; group them together and form a new indicator “ideas and knowledge” which includes idea pool (how many more ideas are in the pipeline, waiting for investment, piloting, or implementation, etc.)
Add durability to explain the resiliency of the innovation
  • Experts commented that they would like to know how the “value” of the innovation is sustained over time, i.e., the resiliency of the innovation
  • It is suggested to use “durability” to describe the resiliency
Add a new indicator: durability
Add accessibility to reflect the ease of implementation of the innovation
  • Experts commented that the technological maturity of the environment supports the idea
  • The ease to apply and repeat
  • The scale the idea
Add a new indicator: accessibility
Add strategic alignment to describe how the ideas from the innovation team align with operational and business strategies of the company
  • Experts expect that the organizational strategy concerning innovation is important;
  • It is necessary to know how business plans, objectives, operational goals support the innovative activities
Add a new indicator: strategic alignment
Establish second set of indicators
  • Comments and suggestions collected
  • Further review of literatures to supplement the comments from experts
  • Confirmation of the set of indicators
Finalized the second set of indito cater for for the next stage process
Table 7. Description of Second Step Conversation Interviews.
TaskInformationDecision
Secondset of indicators established in the first step consultation process-------
Invite senior professionals in US, Hong Kong and Mainland China to join the conversation/discussion for vetting the second set of indicators
  • Discuss with experts and solicit their comments on the definition/usefulness/measurement, etc., of each indicator by using open-ended questions
Record comments and discuss with other experts
Assess the usefulness of the indicator: “resultant of new ideas”
  • Discuss with experts and collect their views/comments on the “resultant of new ideas” indicator
  • Most experts commented that using the term “return on investment” (ROI) should be better since ROI is more specific and commonly used in the field already
  • Experts also indicated that customer satisfaction should be reflected by the “resultant of new ideas” indicator
Customers’ satisfaction to be included in “resultant of new idea”; change the wording of “resultant of new idea” to “return of investment (ROI)”
Comment on the indicator: “implementation of new ideas“
  • Experts commented that this term should be considered and incorporated into the “innovation process” indicator
  • The innovation process should include the implementation idea
“implementation of new idea” should be included in the indicator: “innovation process”
Add Impact as a new indicator to represent the soft side of “resultant”
  • The majority of experts have the view that the soft side of resultant, such as the image of the company should be included
  • A term “impact ”was suggested to the indicator list to indicate the softer impact of innovation such as branding and the organization’s image
  • They also commented that it is necessary to distinguish impacts; it refers to the issues that can hardly be quantified, such as typical design, cost, and schedule ROI
Add a new indicator: Impact
Merge financial resources into strategic alignment
  • Experts commented that it is better to merge financial resources into strategic alignment in order to describe a broader concept of the resources allocated to innovation through the organization’s strategy or policies, which includes the financial/human resources assigned to innovation activities
Delete the “financial resources” indicator and add explanation to “strategic alignment” to include the concept of financial and human resources
Amend “people and organization” into engagement
  • Experts, especially those from the US, mentioned that engagement level of employees should be one of the indicators for measuring innovation performance
  • This indicator also includes the culture of organization
Change “People & Organization” to “Engagement”; add further explanation to the term “engagement”
Delete the indicator “accessibility”
  • Accessibility is deleted and incorporated into the “innovation process” indicator where it includes the process of vetting innovation ideas, which should be a measure for the “accessibility” of the ideas
Delete “accessibility” and add further explanation to “innovation process”
Retain the indicator “durability”
  • Experts commented this term is not very clear; however, they all agreed that it describes a very specific portion of innovation performance where one may want to assess the performance in a longer time horizon;
  • When we evaluate innovation, it is difficult to tell the value of the innovation in a short time frame; we should also consider its performance in the long run
Keep the term “durability” and add further explanation to clarify this indicator
Establish Final Set of Indicators
  • Consultation with experts to reach a final set of indicators with corresponding explanations/definition to each indicators
Finalize the Final Set of Indicators (for subsequent works)
Table 8. Finalized Set of Innovation Performance Indicators.
CategoriesIndicatorsExplanations
Leading (Input/Process)Creativity of EmployeesCreativity of Employees describes the creativity of employees when solving problems faced in their work process and how willing they are to share their new ideas with the organization.
Innovation ProcessInnovation Process describes the system within the organization that supports innovation, including how the system helps incentivize idea generation, implementation, and the flow of the new ideas from generation to implementation (or even commercialization), etc.
DurabilityDurability describes how “durable” the value of the innovation will be in the market and how resilient this innovation will be to change.
Ideas and KnowledgeIdeas and Knowledge includes the organizations’ idea pool and how knowledge transfers between communities and groups.
EngagementEngagement describes the engagement level of employees in carrying out innovation. This includes how engaged employees are in generating new ideas, and implementing these new ideas in projects, etc. This engagement is also hindered by other factors, which are included in this indicator, such as the organization’s culture.
Strategic AlignmentStrategic Alignment includes aligning organizational policies/strategies that promote and manage innovation, management style, organization structure, etc.
Lagging (Output/Outcome)Return on Investment (ROI)ROI describes the measurement of the return on the investment of the innovations. In general, measuring the enhancement in performance results from the idea, such as project satisfaction, cost, time, quality, etc. In other words, the performance change led by the innovations. Customers’ satisfaction is included.
ImpactImpact measures the “soft” impact of innovations such as their effect on the organization‘s image, competitiveness in the industry, etc.
Quality of New IdeasQuality of Ideas includes the measurement of the applicability, scalability, etc., of the idea, representing the value of the ideas.
Publisher’s Note: MDPI stays neutral with regard to jurisdictional claims in published maps and institutional affiliations.

