Article

Carbon Footprint in Vegeburger Production Technology Using a Prototype Forming and Breading Device

by
Magdalena Wróbel-Jędrzejewska
1,*,
Joanna Markowska
1,
Agata Bieńczak
2,
Paweł Woźniak
2,
Łukasz Ignasiak
2,
Elżbieta Polak
1,
Katarzyna Kozłowicz
3 and
Renata Różyło
4
1
Institute of Agriculture and Food Biotechnology—State Research Institute, 02-532 Warsaw, Poland
2
Łukasiewicz Research Network—Industrial Institute of Agricultural Engineering, 60-963 Poznan, Poland
3
Department of Biological Basis of Food and Feed Technology, University of Life Sciences in Lublin, 20-950 Lublin, Poland
4
Department of Food Engineering and Machines, University of Life Sciences in Lublin, 20-950 Lublin, Poland
*
Author to whom correspondence should be addressed.
Sustainability 2021, 13(16), 9093; https://doi.org/10.3390/su13169093
Submission received: 13 July 2021 / Revised: 10 August 2021 / Accepted: 10 August 2021 / Published: 13 August 2021
(This article belongs to the Topic Industrial Engineering and Management)

Abstract

:
The aim of the research was to develop a laboratory test stand for forming vegeburgers and to determine the carbon footprint of vegeburger production technology with the addition of frozen vegetable outgrades. This vegetable material is waste from frozen food production. During the research, unique recipes for vegeburgers fabricated of vegetable outgrades, potatoes, fiber, potato flour, salt and spices were also developed. The physicochemical properties, texture and color of vegeburgers were determined. The CO2 to kWh conversion factor, with a value of 0.765 kg CO2∙kWh−1 was used to calculate the carbon footprint. Vegeburgers obtained during the study were characterized by protein content ranging from 2.05 to 2.29 g 100 g−1, carbohydrate content from 7.27 to 10.36 g 100 g−1, fiber content ranging from 3.97 to 4.92 g 100 g−1 and fat content was at the level of 0.20–0.24 g 100 g−1. The amount of sodium did not exceed 1 g 100 g−1. The amount of disqualifying nutrients (fat, trans fat, saturated fat and cholesterol) was significantly lower compared to similar products on the market. The conducted analyses showed that the highest CO2 emission occurred during the blanching process. The proportion of this process for small productions (2.0 kg) ranged from 62% to 68%. The process of vegeburger formation had the second largest percentage in emissions and accounts for 22% to 24% for small productions (2.0 kg). The total carbon footprint was 1.09–1.13 kg CO2/kg of product, respectively, i.e., about 0.10–0.12 kg CO2 per one vegeburger. The research demonstrated that the process of producing vegeburgers from vegetable outgrades is a low-emission process compared with other agri-food technologies. Considering the above, this study allows for improvement of the management of waste from frozen food production, and is also the basis for the development of low-emission agri-food technologies.

1. Introduction

Changes in lifestyle, the variety and general availability of goods on the market, competitive prices and attractiveness of commercial offers resulted in significant changes in the consumption behavior of society in recent years. We consume excessively, ineffectively and at an increasing pace not only food, but also shrinking environmental resources, which has a negative impact on global climate change. The growing food demand has made the food industry one of the fastest growing industries in the world. These processes are accompanied by a strong society pursuit of a lifestyle based on health and sustainable development. It is a motivation for science and business to take actions to ensure adequate food quality and safety, as well as to identify and monitor key environmental aspects in the entire food chain that affect climate change [1].
These changes may be caused by CO2 emissions, the amount of which affects the environment. Identifying the factors that generate a carbon footprint, and subsequently optimizing the stages of the production process in terms of energy consumption allows for the development of a special software, i.e., an expert system for calculating the carbon footprint.
One of such activity leading to the optimization of production may be the management of post-production waste, such as full-value remains after sorting vegetables (so-called outgrades). Vegetables are one of the main products of plant origin that provide both environmental and nutritional benefits [2].
According to the literature, vegetable waste can be a source of valuable ingredients, including bioactive substances [3,4]. Vegetable waste from the agri-food industry is generated in large quantities and can cause significant environmental pollution [3]. The emergence of new waste management technologies allows the waste of natural resources to be reduced and can minimize the impact of food production on the environment [5,6]. Wasting food is often reported to deplete resources, which also has an impact on greenhouse gas emissions [7].
The estimated emission of greenhouse gases (including carbon dioxide, methane, nitrous oxide, and freons) to the atmosphere throughout the life cycle of a given product, process or technology is called the carbon footprint (CF). Two types of emissions are considered in the carbon footprint analysis: direct GHG emissions as a result of inter alia, fuel combustion and the manufacturing and natural processes generating greenhouse gas emissions; indirect emissions, as a consequence of the use of energy media in the production process (electricity, heat), each of which has its own CF resulting from its production and delivery to the balanced system. Electricity production in Poland is based mainly on hard coal combustion processes [8,9,10]. In most manufacturing plants, electricity is drawn from the public network.
The carbon footprint (CF) value for different greenhouse gases is given in the equivalent amount (CO2-e), calculated using the following formula:
C O 2 e = G H G · G W P G H G
where:
C O 2 e is the equivalent of emission expressed in kg (or other mass units) of CO2.
GHG is the amount of a given greenhouse gas emission in kg (or other mass units).
G W P G H G is the GWP value (global warming potential) of a given greenhouse gas
(kg CO2-e/kg GHG).
On the other hand, the carbon footprint of a product, process or technology is the sum of all direct and indirect emissions that were identified over the entire cycle and scope of the analysis:
C F = i = 1 n C O 2 e i + j = 1 m C O 2 e j C O 2 e = G H G · G W P G H G
where:
C F is the carbon footprint of the product (kg CO2-e/kg of product).
C O 2 e i is the amount of direct emissions from the i of this source expressed in the equivalent amount of CO2 (kg CO2-e/kg of product).
C O 2 e j is the amount of indirect emissions from the j of this source expressed in the equivalent amount of CO2 (kg CO2-e/kg of product).
The principles of the CF analysis and the methods of calculating its value are described in detail in the normative documents: PAS 2050 [11] and Norma ISO 14,067 [12]. Agriculture and the agri-food industry in general have a significant share in greenhouse gas emissions, including those assessed using the carbon footprint index [13,14]. Agriculture utilizes about 35% of the land area and is responsible for nearly 13.5% of global anthropogenic greenhouse gas emissions, including approximately 25% of global CO2 emissions, approximately 50% of CH4 emissions and approximately 70% of N2O emissions [15]. The carbon footprint of agricultural products is the main indicator for monitoring the efficiency and sustainability of the production processes in agriculture, or more broadly in the agri-food industry [16,17]. The use of CF calculators when assessing the environmental impact of food products [18] is becoming popular, which also influences their positive perception by consumers [19]. Borsato et al. [20] presented the carbon footprint values for selected vegetables, where according to these data, cauliflower and broccoli had a CF value of 0.30 kg CO2-e/kg, carrots 0.15 kg CO2-e/kg and onions 0.10 kg CO2-e/kg. Carbon footprints are also determined for selected media and raw materials [21,22].
Considering the importance and necessity of determining the carbon footprint for various branches of the food industry, the main objective of this study was to calculate the carbon footprint of vegeburger production technology with the use of a full-value frozen vegetable outgrade and to develop a test stand for the product forming process. This work forms the basis for the development of low-emission agri-food technologies.

2. Materials and Methods

2.1. Materials

The raw material for the production of vegeburgers was a frozen vegetable outgrade: cauliflower, broccoli, green and yellow beans, onions and carrots, which were leftovers from their calibration process. Frozen vegetables were obtained from Unifreeze Sp. z o.o., (Miesiączkowo, Poland). The recipe also used potatoes (fresh), fiber (Vitalpro sp. z o.o, Legnica, Poland), potato flour, salt and spices from commercial trade.

2.2. Physicochemical Analysis of Raw Materials and Vegeburgers

Dry matter content was determined in vegetable outgrades, vegetables and vegeburgers [23]; fat content according to AOAC International (2000), total protein content according to the Kjeldahl method [23], and ash content [23] and pH value by potentiometry [24]. Dry matter content was determined in vegetable outgrades, vegetables and vegeburgers [23] using a Sartorius MA 40 dryer (Sartorius, Germany) for 180 min at 105 ± 2 °C. The determination of the total protein content according to the Kjeldahl method [23] was performed using a K−425 digestion oven (BÜCHI Labortech-nik AG, Flawil, Switzerland,) and a B−324 steam distiller (BÜCHI Labortechnik AG, Flawil, Switzerland). Fat content according to AOAC International (2000), was determined using a B−811 device (BÜCHI Labortechnik AG, Flawil, Switzerland). Determination of ash content was carried out [23] using a muffle furnace (type FCF22M model SM2002, CZYLOK, Jastrzębie Zdrój, Poland) and pH value was determined by the potentiometric method using the CX−505 device (ELMETRON Sp.j., Zabrze, Poland) [24]. The dietary fiber content was determined by the enzymatic method of Sigma-Aldrich TDF 100A test based on AOAC985.29 (1997).

2.3. Color Determination of Raw Materials and Vegeburgers

Color (CIE L*a*b*) was determined using a Konica Minolta CM−5 spectrophotometer, in accordance with the research methodology recommended by the device manufacturer. A D65 illuminant (daylight at noon), a standard colorimetric observer with a 10° field of view and a 30 mm aperture were applied for color measurements. The following were also calculated:
The color saturation degree is C * [25]:
C* = [a2 + b2]0.5
where hue (h) [26], determines the dominant wavelength in the spectrum of that color. In the CIE Lab system, hue is the angle formed by a straight line passing through the center of the system and a point with coordinates a *, b * with the axis a.

2.4. Texture Determination of Raw Materials and Vegeburgers

The samples were vegeburgers of 85 mm diameter and 15 mm height. Texture was determined using a CT3 TA texture analyzer (Brookfield Ametek). A texture profile analysis (TPA) test was performed using a TA−25 probe (Ø 50.8 mm cylinder, prespex). The probe return velocity was 1.0 mm/s, the target depth was 3 mm, and the trigger load was 0.2 N. Hardness, cohesiveness, elasticity, gumminess and chewiness were used for instrumental texture characterization of the samples [27].
The compression test was conducted using a TA−7 probe (60 mm blade length acrylic knife). The test speed was 1.0 mm/s, target depth was 5 mm, and the trigger load was 2 N. Hardness and stickiness were used for instrumental textural characterization of the samples [27].
The hardness value is the peak force that occurs during the first compression. Adhesiveness is the work performed in detaching the probe from the sample. Cohesiveness is how well the product withstands a second deformation relative to its resistance under the first deformation. Springiness is how well a product physically springs back after it is deformed during the first compression and is allowed to wait for the target wait time between strokes. Gumminess is hardness * cohesiveness. Chewiness is calculated as gumminess * springiness.
The vegeburger samples were subjected to texture analysis with three repetitions. Measurement control and data processing were performed using the computer program TexturePro CT V 1.2 Build 9.
One-way analysis of variance (ANOVA) was performed, and statistical significance was given as p-values using the Statistica®10.0 PL software (StatSoft Poland Sp. z o.o. Krakow). Statistical significance was given as p-value, where differences at 95% confidence level (p < 0.05) were considered statistically significant for the results of all analyses using different formulations. The final results obtained were expressed as mean values ± standard deviation.

2.5. Development of Vegeburger Production Technology

The developed vegeburger formulas are given in Table 1. Vegeburger composition was modeled taking into account the type and amount of vegetables in the final product and preparation degree of the plant material, so that the forming process would be easy to perform, and the product would not deform and disintegrate.
Vegetable mass for forming was prepared according to the scheme depicted in Figure 1. Due to the presence of bast, which was perceptible in the organoleptic evaluation, string bean outgrades (green and yellow beans) were mechanically ground.

2.6. Development of the Test Stand for Vegeburger Formation

The process of designing a prototype of a technological line for frozen food production, especially vegeburgers started based on the developed production technology of new frozen products on the example of vegetarian burgers with the use of full-value multi-vegetable outgrades. It was assumed that the technological line for forming and coating multi-vegetable products would consist of a forming module, a wet breading unit, a dry breading unit, a mixer and a fryer. A decision was made to build the forming test stand (Figure 2) to verify the adopted design assumptions in order to select the right mechanism concepts for the machine production of a multi-vegetable product. The research model was equipped with an analogous matrix unit planned for the target technological line. The conducted tests were aimed at analyzing the functionality of the matrix assembly for vegeburger formation, observing the preservation of the given shape while falling onto the net and during the transfer to individual conveyors.
The material for forming vegeburgers was prepared in the first stage. The portions of vegetables provided by the recipe: green beans, broccoli, onions, carrots, cauliflower and yellow beans were combined, with attention to the behavior of individual vegetables during the process. Deformation of vegetables was not observed. The shredded potatoes, previously subjected to heat treatment, were added to the mixed vegetables to act as a binding material. Potato flour was also added in an appropriate amount in relation to potato quantity in order to obtain a very compact and easy-to-shape mass. In the second stage, research tasks were carried out that involved machine shaping of a multi-vegetable mass.

2.7. Carbon Footprint Determination

The above-described technological and construction works were supplemented with tests that enabled the calculation of the carbon footprint for the production of frozen vegeburgers produced on a laboratory scale.
The mass was prepared in accordance with the previously developed and described technology using laboratory apparatuses and devices arranged in an experimental technological line. Vegeburger formation was carried out on a designed and constructed test stand. A scheme of the individual stages of experimental vegeburger production was developed, taking into account the devices that affect indirect emission (Figure 3). Guidelines for the methodology and research scope of determining the carbon footprint at individual stages of the technological process for laboratory production were established.
The technological process of producing a vegeburger under these conditions was analyzed in order to determine the measuring range. Assuming the measuring range from blanching to forming, points were set to register important parameters for the monitoring of indirect emissions in this experimental production. A mass balance of ingredients used in production was performed based on the selected formula and technology.
A method for calculating the carbon footprint under these conditions was developed. The laboratory technological line was metered. Energy consumption during the experimental production was measured in eight replicates.
The laboratory metering system of the technological line was equipped with sensors monitoring the power consumption of devices used to prepare vegeburgers. Energy consumption was recorded using Energy Logger 4000 devices. These are meters with the function of saving data in their internal memory for 6 months. The collected values can be transferred to a computer via a standard SDHC card for further analysis and storage. Such metering allowed the division of the entire production process into stages and the collection of relevant data. On this basis, a database was created to calculate the carbon footprint depending on the composition and type of formula used to obtain a frozen vegeburger.
The scope of the analysis of the vegeburger production carbon footprint also included the production of frozen vegetable outgrades at Unifreeze Sp. z o.o. The plant raw material obtained from agricultural crops, delivered to the plant, was initially cooled and subjected to quality assessment and selection. The following stages involved washing the raw material, cutting it, blanching and freezing in a freezing tunnel. Then, the calibrated product was packed and stored. Vegetable outgrade is created during such production, which is a full-value waste after sorting.
CF tests were performed for frozen vegetables by allocating total direct and indirect emissions (global CF value calculated for the plant) for individual products, determined in proportion to the production volume of individual products.

3. Results and Discussion

3.1. Raw Material Quality Analysis

Vegetable outgrades and vegetables such as potatoes and carrots, which were utilized as raw materials in laboratory tests, were characterized by the parameters presented in Table 2. Average nutrient contents determined in the plant material were comparable to the data for full-value vegetables listed in nutritional tables [28] and in the USDA National Nutrient Database for Standard Reference [29]. Vegetable outgrade was characterized by a higher fiber content, ranging from 1.89 g/100 g for cauliflower to 4.74 g/100 g for string beans compared with the nutritional values of frozen vegetables shown in the tables.
Color is an important distinguishing feature of plant material quality. Table 3 shows the colors of vegetable outgrades and vegetables. It was observed during the research that the technological process of obtaining vegetable outgrades, as well as the conditions of preparation of remaining vegetables, including blanching, did not affect their color. The potato had the lightest color (L* = 66.22), the cauliflower floret outgrades were a little darker (L* = 63.68), followed by onion outgrades (L* = 61.59); broccoli floret outgrades had the darkest color (L* = 27.20). The a* component of the color ranged from −11.51 for green bean outgrades to 24.02 for carrots. The b* index ranged from 3.3 for cauliflower head outgrades to 31.58 for carrots. These varied color results were caused by the natural colors of vegetables derived from natural pigments in fruits and vegetables, many of which differ with the variety, as well as with the plant’s growth and maturation. Natural pigments found in fruits and vegetables include chlorophylls (green), carotenoids (yellow, orange and red) and anthocyanins (red, blue), as well as flavonoids (yellow) and betalains (red). In addition, enzymatic and non-enzymatic browning reactions can produce brown, gray and black colors. Technological processes that vegetables are subjected to may cause changes in their colors. Chlorophylls are sensitive to heat and acid but stable in an alkaline environment, while carotenoids are susceptible to light and oxidation, but they are relatively stable at elevated temperatures. Anthocyanins are sensitive to both pH and temperature, while flavonoids are sensitive to oxidation, but they are relatively stable during temperature changes [30].
Technological treatments related to thermal processing affect the color of vegetables to a varying degree [31]. Literature data indicate a lower temperature stability of chlorophyll, which is responsible for the color in green vegetables [32,33,34]. Yuan et al. [35] showed that boiling water and microwave cooking resulted in high chlorophyll loss in broccoli, while steaming did not significantly reduce chlorophyll content. In contrast, blanched green peas were visually lighter than unblanched and frozen-stored peas [36]. Lau et al. [37] noticed an initial increase in the green color of green asparagus during heat treatment at 70–98 °C. Analogous results of the increase in the green color were also observed for broccoli subjected to blanching in hot water and steam [38]. Blanching of vegetables changes their color and the degree of these changes depends on the type of blanching. Less color changes are observed in steam blanching compared with the process carried out in water. Sobol et al. [39] demonstrated that the stimulation of potato tubers with UV-C rays before processing had a beneficial effect on the color of French fries, while blanching potato strips and soaking in water at 40 ºC resulted in the production of lighter colored French fries.

3.2. Vegeburger Properties

Vegeburgers were prepared in accordance with the presented workflow (Figure 1), using a prototype test stand. The physicochemical properties of vegeburgers, depending on the formula (I-IV), are presented in Table 4, the color is described in Table 5 and texture in Table 6. The amounts of basic nutrients, such as protein and fat, did not differ significantly depending on recipe composition (Table 4). Protein content for the developed burgers ranged from 2.05 to 2.29 g∙100 g−1, carbohydrate content was 7.27–10.36 g∙100 g−1 and fiber content ranged from 3.97 to 4.92 g∙100 g−1. Fat content in the developed vegeburgers was at the level of 0.20–0.24 g ∙ 100 g−1. The content of ingredients such as salt and fat did not exceed 1 g and 0.3 g per 100 g of the product. The amount of disqualifying nutrients (fat, trans fat, saturated fat and cholesterol) was significantly lower compared to similar products on the market [40].
Per serving, vegetables are high in essential vitamins, minerals, protein and dietary fiber, they do not contain cholesterol and are low in fat. Meat contains high amounts of protein, B vitamins and minerals such as iron and zinc per unit body weight, and minerals such as iron and zinc per serving unit. On a dietary level, replacing a portion of meatball meat in the daily diet can both reduce environmental impact and improve consumer nutritional outcomes [41,42,43]. The results of the research confirmed the potential of vegetables, in this case also of vegetable outgrades, in terms of improving the nutritional value of food products and their great potential in formulating diets and food systems. Chaudhary and Tremorin [44] demonstrated the potential of using lentils as a part of meat replacement in burgers.
Color parameters of vegeburgers are given in Table 5. The light parameter (L*) ranged from 56.18 to 64.20, the a* index ranged from 5.49 to 6.73 and the b* parameter ranged from 18.21 to 28.20. Color parameters result from the natural color of the applied plant components. In addition, color discrepancies in individual formulas result from the application of a heterogenous raw material with a high basis weight.
Despite the variable composition of formulas, texture parameters of vegeburgers were comparable (Table 6). However, the differences obtained in the values of the elasticity, gumminess and chewiness parameters were due to the non-uniform composition of the raw material of vegeburgers (vegetable outgrades) (Figure 4). The presence of non-fragmented parts of vegetables, on the one hand, influences product attractiveness for consumers, and on the other hand, pose a technological challenge in the mechanical mass formation.
According to Bourne [45], the properties of food texture are assessed as a group of physical features that result from the food structure and are sensed by touch, and at the same time are related to deformation, disintegration and the flow of products under force. For consumers, particle size is one of the key physical characteristics of a food that makes it attractive. For example, ice crystals with a volume of 10–20 μm cause ice creams to be perceived as very smooth, while larger crystals with a volume of 50 μm give the perception of graininess [46]. The size of particles in chocolate influences the assessment of its desirability [47], and in the case of syrups, their overall attractiveness [48].
The analysis of textural properties was used to modify the technical assumptions of the model station and to identify the dependence of their influence on the hardness, cohesiveness, gumminess, springiness and chewiness of vegeburgers in various recipe combinations, and thus to develop methods to maintain product quality, while changing the composition.

3.3. Test Stand Analysis

During the analysis in the test stand, compact vegetable mass was placed in the mold, and subsequently the mold assembly was dynamically moved using a pneumatic drive and knocked out of the sleeve with a striker (Figure 5). After forming, vegetable mass in the form of a cutlet remained compact. The burger did not come apart when it was knocked out of the mold and dropped onto the transport net.
Figure 6 shows the method of testing the effectiveness of transferring a vegeburger from one conveyor to another. Product transition was smooth, it did not stop at the set-off point. On the basis of the conducted research, it was found that vegeburgers retained a compact consistency and did not disintegrate during knocking out or passing from one net to another, and the process was smooth. It was found that the assumed concept of the machine forming process was effective.
Testing the functionality of the test stand provided important information about the effectiveness of the mechanisms provided in the project, the technological line for the production of vegeburgers. According to the WRAP report [49], reduction in food waste at the preparation stage is 45% and the Sustainable Restaurant Association (SRA) [50] estimate indicates that avoidable food waste at this stage is 65%.
It was found on the basis of the conducted experimental studies that the design assumptions of the net drive, enabling effective transport and transfer of vegeburgers from one conveyor to another, were correct and did not cause deformation or damage to the product. However, it was observed that the formed products fell out of the mold assembly aperture by themselves. This information was used in the process of designing the forming module included in the prototype technological line.

3.4. Carbon Footprint Determination

Data on electricity consumption for various processes along with the calculated carbon footprint of the experimental vegeburger production are presented in Table 7. To calculate the carbon footprint, the CO2 to kWh conversion factor was used, with the value of 0.765 kg CO2∙kWh−1 (CO2 conversion factor for 2018, announced in December 2019 by the National Centre for Emissions Management (KOBIZE)).
The values of the determined carbon footprint of vegeburger production (experimental production), regardless of the formula used, ranged from 0.26 to 0.28 kg CO2 per kilogram of product. The lowest CF values were obtained for the largest productions (vegetable mass, 5.0 kg and 9.5 kg). Pie charts were prepared to assess the impact of individual steps on the carbon footprint (Figure 7, Figure 8, Figure 9). The following individual processes of vegeburger production were analyzed: potato blanching, potato shredding, green bean shredding, mixing ingredients of vegetable mass and forming vegeburgers. The conducted analyses showed that the highest CO2 emission occurred during the blanching process. The percentage of this process for small productions (2 kg) ranged from 62% to 68%. The higher the volume of vegeburger production, the bigger the share of the blanching process in the total emission, i.e., also in the carbon footprint (up to approximately 80%). The process of vegeburger formation had the second largest percentage in emissions and accounted for 22% to 24% for small productions (2.0 kg), and decreased drastically to about 15% for larger productions. The smallest percentage was associated with shredding (potatoes and beans).
CF calculation for food products involves different approaches and test ranges. Considering all stages (from agricultural production, through the processing plant, to the consumer) allows the relationships between materials and processes to be determined. For example, it was found when analyzing the carbon footprint for croissants (1.5 kg CO2/kg of product) that the processing and supply chain had the greatest impact on greenhouse gas emissions [51]. CF analysis of dairy products, e.g., cheeses (9.88 kg CO2/kg product) showed that emissions from the production chain (from farm to retailer) accounted for less than 10% of total emissions from cheese production, while it was identified that the highest energy consumption was related to dairy production, including refrigerated storage under the appropriate conditions [52]. Analogous results showing a significant share of refrigerated storage in food production were confirmed in the carbon footprint analysis only for the production of homogenized strawberry paste (2.47 kg CO2/kg of product) [53]. On one hand, the highest CO2 emission in the production of vegeburgers occurred during the blanching process and its proportion increased with production volume. On the other hand, the shredding of ingredients was associated with the lowest percentage.
The carbon footprint for vegetable outgrades was also determined. The carbon footprint of the plant’s total production (global CF value calculated for the plant) was determined and distributed among individual products based on the data obtained from Unifreeze Sp. z o.o. for a period of three years. The allocation was performed in proportion to the production volume of individual products. The production carbon footprint was calculated for all frozen products produced in the plant, taking into account the sum of all direct and indirect emissions. The amount of emissions was determined based on the data provided by the company for previous years, using the developed methodology, narrowing down the range only to production at the plant (i.e., internal transport, fuel and electricity consumption).
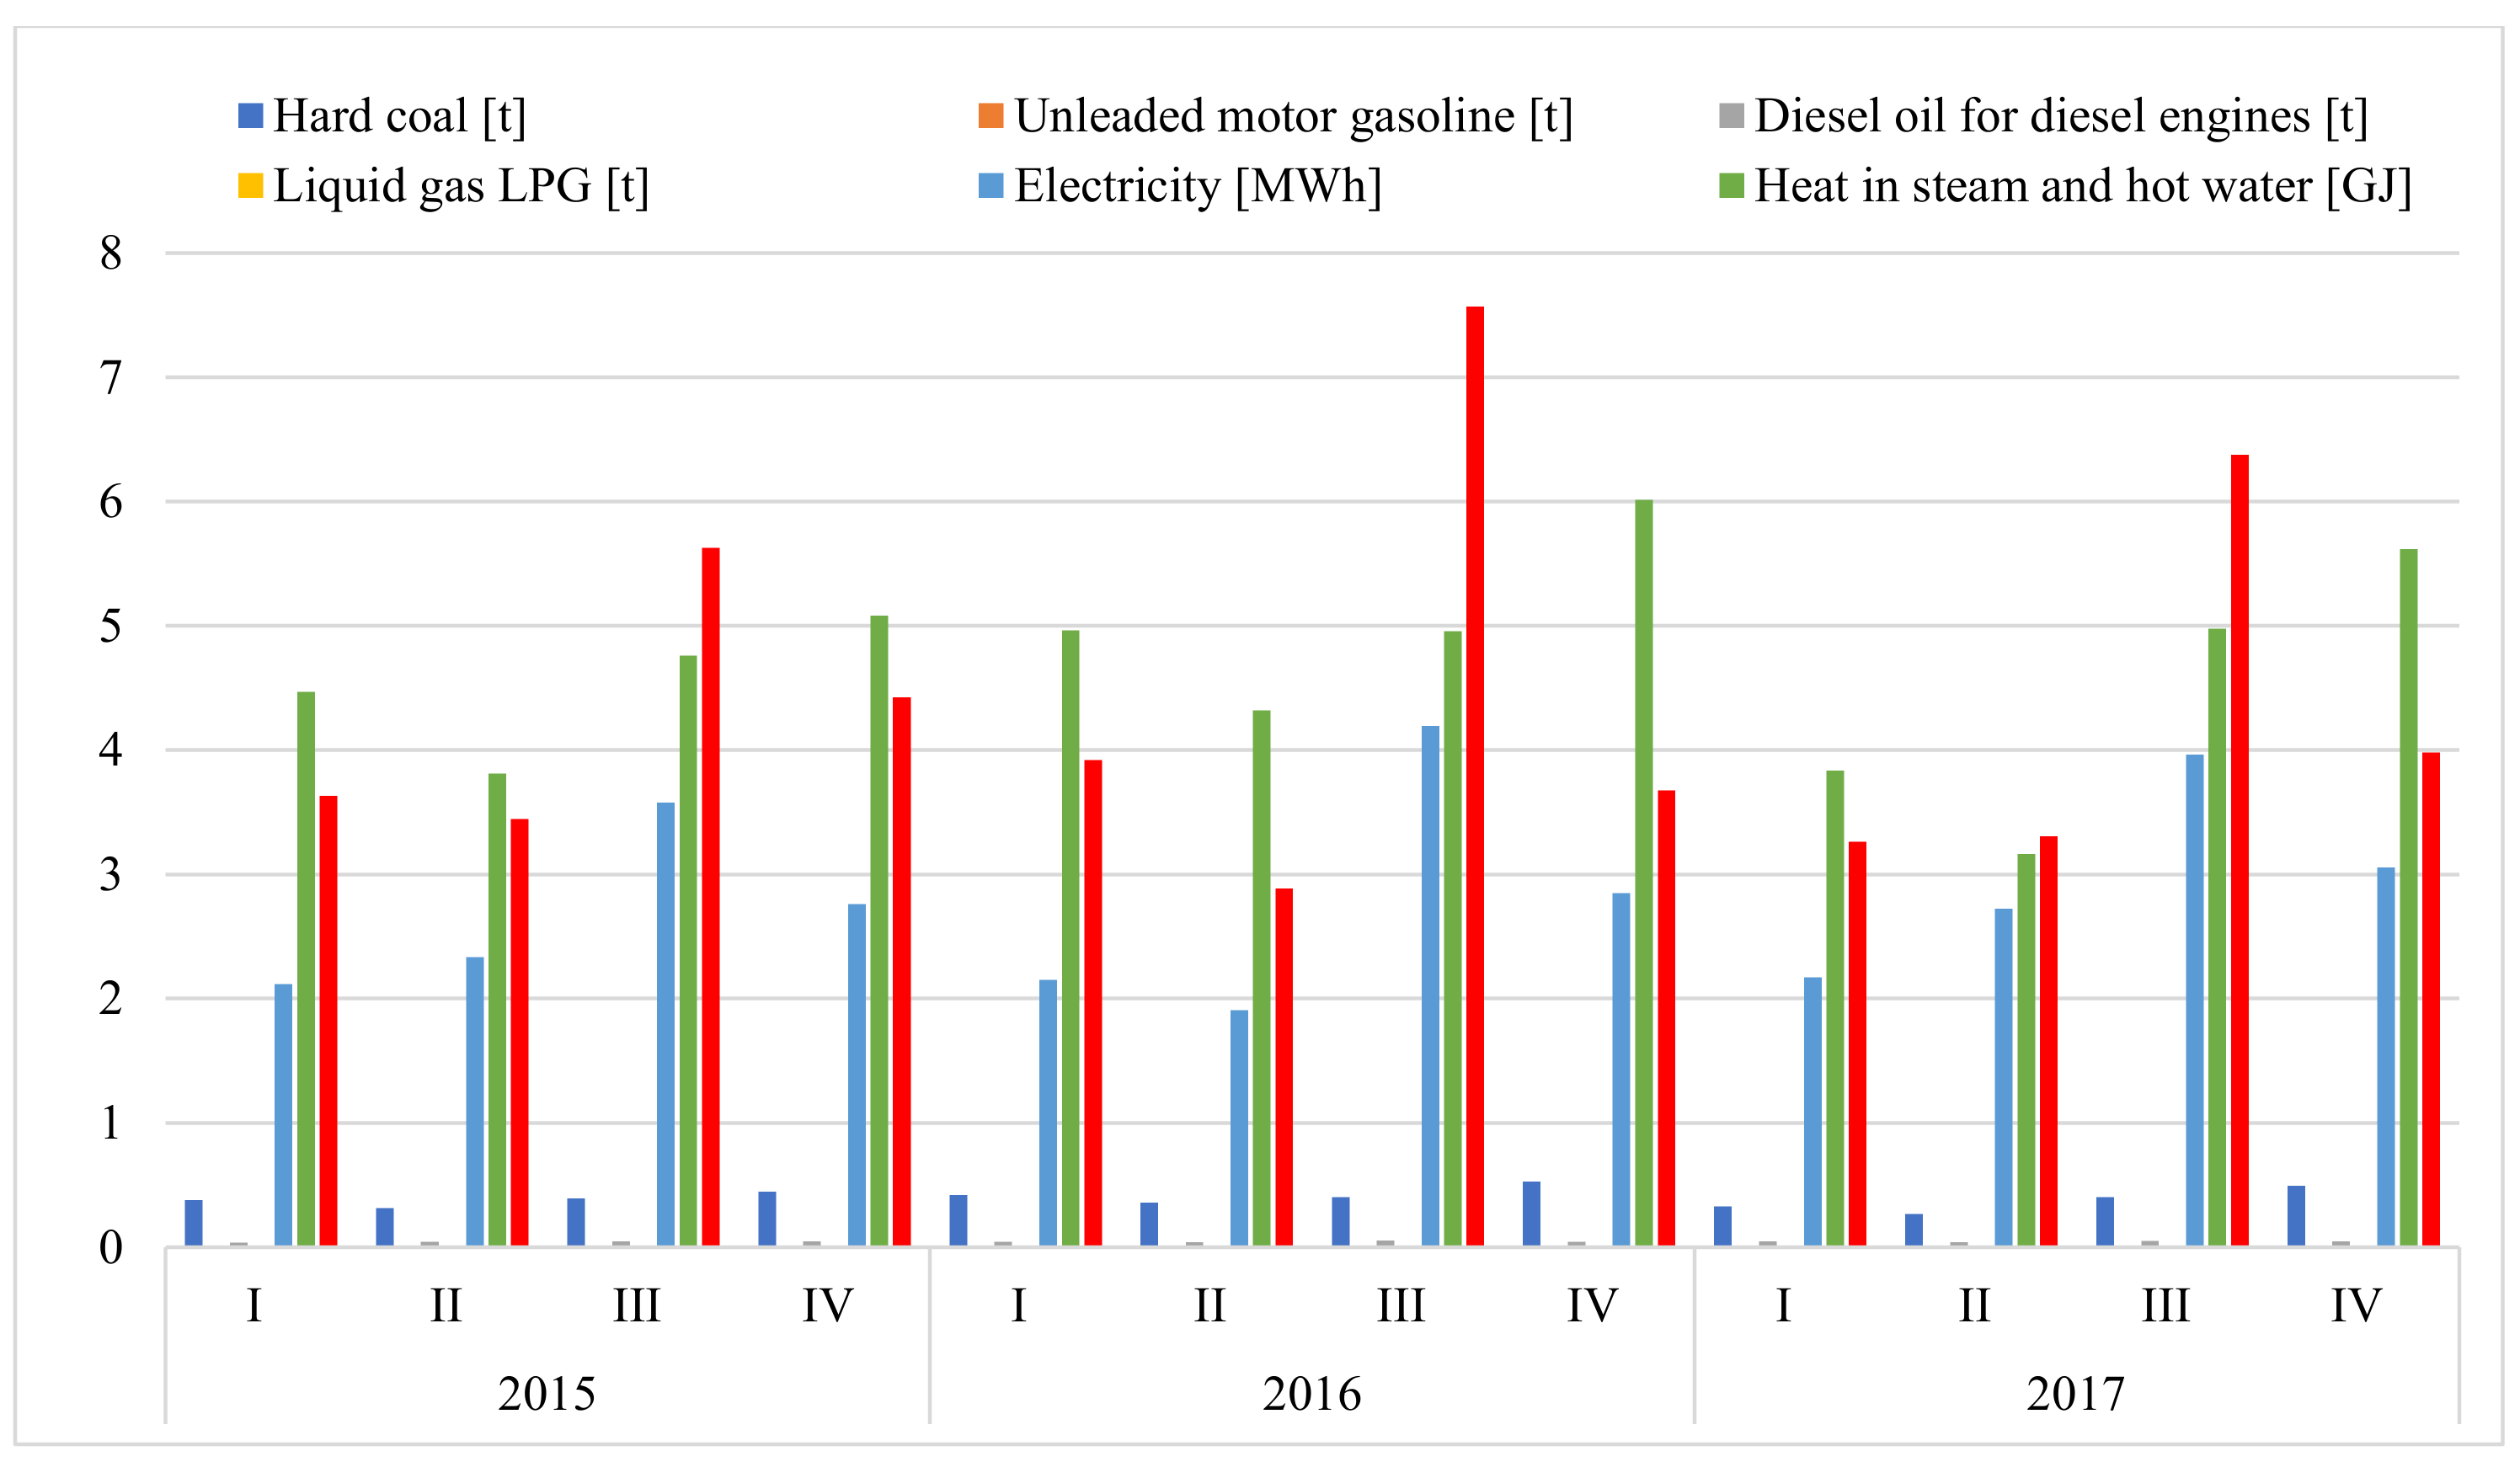
 Figure 10 and Figure 11 show the structure of the production volume and the energy media consumed for three years (2015, 2016, 2017) in a plant producing frozen food. The analysis was based on previously developed process schemes and the prepared indicator base [20,22]. On this basis, the carbon footprint of individual frozen products produced in the plant during this period was determined (Table 8). The carbon footprint of vegetables frozen in the plant, associated only with production, ranged from about 0.6 to 1.1 kg CO2/kg product. Plant-based protein raw materials usually have a much lower carbon, water and soil footprint than animal raw materials [54,55].
In the composition of a vegeburger, depending on the formula (Table 9), vegetable outgrades accounted for 44% to 54%, while potato content ranged from 23% to 36%. The carbon footprint in experimental production was calculated using the CF values from 2017 based on the calculated carbon footprints of frozen vegetables produced by Unifreeze Sp. z o.o. and the percentages of individual ingredients in vegeburgers. Potato flour and spices used in this study were not included in this analysis due to the lack of CF data, as well as the small percentage of these ingredients. The determined carbon footprint of vegetable outgrades for different formulas and the amount of substrates used in the experimental production of vegeburgers is presented in Table 10. Depending on the production volume, the CF value was 0.83 kg CO2/kg vegetable outgrades and 0.85 kg of CO2/kg vegetable outgrades, respectively. Then, total vegeburger CF was determined for different formulas of vegeburger experimental production taking into account the carbon footprint of vegetable outgrades production in the production plant and vegeburger experimental production. Data are summarized in Table 11. The total carbon footprint was 1.09–1.13 kg CO2/kg of product, respectively, i.e., about 0.10–0.12 kg CO2 per one vegeburger. This method of carbon footprint analysis enables data comparison with other technologies; however, it is necessary to take into account the measurement range adopted for analysis in other cases.
In order to compare carbon footprints of food products, we must take into account the same ranges of applied indices due to the different methods of calculating CFs for these products. Comparison of the CF obtained for vegeburger production (0.26–0.28 kg CO2 per kg of product) with the presented literature data (e.g., CFcroissant = 0.59 kg CO2/kg product, CFcheese = 0.99 kg CO2/kg product, CFstrawberry paste = 2.47 kg of CO2/kg product) showed that production is low energy intensive. On the other hand, extending the scope of the carbon footprint analysis, e.g., by taking into account the production of vegetable outgrades, caused a 4-fold increase in the index, reaching a value of approximately 1.11 per kilogram of product. Nevertheless, the process has a low emission compared with other agri-food technologies.

4. Summary and Conclusions

Vegeburger formula developed on the basis of full-value vegetable outgrades, production technology and the construction of a test stand allowed a laboratory-scale analysis with the simultaneous determination of the production carbon footprint to be conducted. The results of the tests of the finished product (vegeburger) demonstrated that its nutritional values were at a high level. At the same time, recipe composition and developed preparation technology confirmed the concept of vegeburger formation. Technological and technical solutions indicated low energy demand. This confirmed the relevance of carrying out further studies in order to develop a production technology for new frozen mechanically-formed products and to design a technological line for their production.
The identified limitations of these study were:
-
The study was conducted at laboratory scale;
-
The varietal characteristics of vegetables included in the vegeburger;
-
The particle size of vegetables in the outgrade determining the characteristics of the final product and the ability to form it on the stand;
-
The confirmation or wider analysis of trends (results) can be obtained only after extending the scale of research (planned execution on a semi-technical scale).
The obtained results indicate that a properly developed technology may contribute to the reduction in the negative impact of food production processes on climate change, as well as the rationalization and reduction in CO2 emissions to the atmosphere by the food industry. In addition, they also allow for increasing management of full-value food waste and public access to food products with high nutritional and health quality. The developed technology is a systemic solution that will positively affect the health of society by increasing the proportion of vegetables in diets, while ensuring the supply of full-value products in a quick and easy-to-prepare form. It can be used for the sustainable, environmental and social development of a country and contribute to reducing the negative effects of the civilization phenomena and climate change in view of the European low-emission policy. The conducted studies emphasize the ecological feasibility of changing to a meatless diet, since the calculated vegeburger CF is negligible compared with the parameter estimated for a similar portion of meat, and there is the possibility of using vegetables considered outgrades.
Precise determination of the CF index of food products is an important aspect due to the obligation of food labeling. The composition, nutritional values and even the carbon footprint associated with the production of the finished product presented on the label [56] often provide a complete picture and precise information about the product for the conscious consumer.

Author Contributions

For research articles with several authors, the following statements should be used “Conceptualization, M.W.-J., J.M., A.B., P.W., Ł.I. and E.P.; methodology, M.W.-J., J.M., A.B., P.W. and Ł.I.; software, M.W.-J., P.W. and Ł.I.; validation, M.W-J., J.M., A.B. and E.P.; formal analysis, M.W.-J., J.M. and A.B.; investigation, M.W.-J.; resources, M.W.-J., J.M. and E.P.; data curation, M.W.-J., J.M. and A.B.; writing—original draft preparation, M.W.-J., J.M., A.B., P.W. and E.P.; writing—review and editing, M.W.-J., J.M., E.P., K.K. and R.R.; visualization, M.W-J., J.M. and A.B.; supervision, M.W.-J., E.P., K.K. and R.R.; project administration, M.W.-J., J.M. and E.P.; funding acquisition, M.W.-J., J.M., A.B. and E.P. All authors have read and agreed to the published version of the manuscript”.

Funding

Investigation results presented in this paper are a part of results obtained in project of National Center for Research and Development, as part of the III BIOSTRATEG. “The development of an innovative carbon footprint calculation method for the basic basket of food products”-BIOSTRATEG3/343817/17/NCBR/2018.

Institutional Review Board Statement

Not applicable.

Informed Consent Statement

Informed consent was obtained from all subjects involved in the study.

Data Availability Statement

Data is not publicly available, though the data may be made available on request from the corresponding author.

Conflicts of Interest

The authors declare no conflict of interest.

References

  1. Karwacka, M.; Ciurzyńska, A.; Lenart, A.; Janowicz, M. Sustainable Development in the Agri-Food Sector in Terms of the Carbon Footprint: A Review. Sustainability 2020, 12, 6463. [Google Scholar] [CrossRef]
  2. Belitz, H.D.; Grosch, W.; Schieberle, P. Food Chemistry; Springer: Berlin/Heidelberg, Germany, 2009. [Google Scholar]
  3. Jiménez-Moreno, N.; Esparza, I.; Bimbela, F.; Gandía, L.M.; Ancín-Azpilicueta, C. Valorization of selected fruit and vegetable wastes as bioactive compounds: Opportunities and challenges. Crit. Rev. Environ. Sci. Tech. 2020, 50, 2061–2108. [Google Scholar] [CrossRef]
  4. Munir, A.; Sultana, B.; Bashir, A.; Ghaffar, A.; Munir, B.; Shar, G.A.; Nazir, A.; Iqbal, M. Evaluation of antioxidant potential of vegetables waste. Pol. J. Environ. Stud. 2018, 27, 947–952. [Google Scholar] [CrossRef]
  5. Esparza, I.; Jiménez-Moreno, N.; Bimbela, F.; Ancín-Azpilicueta, C.; Gandía, L.M. Fruit and vegetable waste management: Conventional and emerging approaches. J. Environ. Manag. 2020, 265, 110510. [Google Scholar] [CrossRef]
  6. Meier, T.; von Borstel, T.; Welte, B.; Hogan, B.; Finn, S.M.; Bonaventura, M.; Friedrich, S.; Weber, K.; Dräger de Teran, T. Food Waste in Healthcare, Business and Hospitality Catering: Composition, Environmental Impacts and Reduction Potential on Company and National Levels. Sustainability 2021, 13, 3288. [Google Scholar] [CrossRef]
  7. Schanes, K.; Dobernig, K.; Gözet, B. Food waste matters-A systematic review of household food waste practices and their policy implications. J. Clean. Prod. 2018, 182, 978–991. [Google Scholar] [CrossRef]
  8. Burmistrz, P.; Dziok, T.; Gołaś, J. Characteristics of Polish coking coals considering future regulations for mercury emission. In Proceedings of the MEC8 8th Mercury Emissions from Coal, Kruger Gate, South Africa, 18–20 May 2011; 2011. [Google Scholar]
  9. Gołaś, J.; Macherzyński, M.; Górecki, J.; Burmistrz, P.; Styszko, K.; Dziok, T.; Okońska, A.; Uruski, L. Environmental and analytical aspects of monitoring and reduction of mercury emission from coal combustion in Polish energy sector. In Proceedings of the International Symposium on Environmental Geochemistry, Aveiro, Portugal, 15 –22 July 2012; pp. 155–156. [Google Scholar]
  10. Burmistrz, P.; Dziok, T.; Makowska, D.; Wierońska, F.; Strugała, A. Contents of ecotoxic elements in Polish coking bituminous coals and in products of coking. Energy Fuels 2019, 108, 02002. [Google Scholar] [CrossRef]
  11. British Standards Institution PAS 2050. Guide to PAS 2050 How to Assess the Carbon Footprint of Goods and Services; British Standards: London, UK, 2008. [Google Scholar]
  12. Technical Specification ISO/TS 14067: Greenhouse gases–Carbon footprint of products–Requirements and guidelines for quantification and communication. 2018. Available online: https://www.sgs.com/en/news/2020/05/sgs-is-accredited-for-uni-en-iso-14067-greenhouse-gases-carbon-footprint-of-products (accessed on 1 February 2021).
  13. Pandey, D.; Agrawal, M. Carbon Footprint estimation in the agriculture sector. In Assessment of Carbon Footprint in Different Industrial Sectors; Golinska, P., Ed.; Springer: Singapore, 2014; Volume 1, pp. 25–48. [Google Scholar] [CrossRef]
  14. Al-Mansour, F.; Jejcic, V. A model calculation of the carbon footprint of agricultural products: The case of Slovenia. Energy 2017, 136, 7–15. [Google Scholar] [CrossRef]
  15. Montzka, S.A.; Dlugokemcky, E.J.; Butler, J.H. Non CO2 greenhouse gases and climate change. Nature 2011, 476, 46–50. [Google Scholar] [CrossRef] [PubMed]
  16. Garnett, T. Livestock-related greenhouse gas emissions: Impacts and options for policy makers. Environ. Sci. Policy 2009, 12, 491–503. [Google Scholar] [CrossRef]
  17. Konieczny, P.; Mroczek, E.; Kucharska, M. Carbon footprint in a sustainable food chain and its importance for the food consumer. J. Agribus. Rural Develop. 2013, 3, 51–64. [Google Scholar]
  18. Barendregt, W.; Biørn-Hansen, A.; Andersson, D. Users’ Experiences with the Use of Transaction Data to Estimate Consumption-Based Emissions in a Carbon Calculator. Sustainability 2020, 12, 7777. [Google Scholar] [CrossRef]
  19. Burgui-Burgui, M.; Chuvieco, E. Beyond Carbon Footprint Calculators. New Approaches for Linking Consumer Behaviour and Climate Action. Sustainability 2020, 12, 6529. [Google Scholar] [CrossRef]
  20. Borsato, E.; Tarolli, P.; Marinello, F. Sustaiable patterns of main agricultural products combining different footprint parameters. J. Clean. Prod. 2018, 179, 357–367. [Google Scholar] [CrossRef]
  21. KOBiZE. National Center for Balancing and Management of Emissions-Calorific Values (CO) and CO2 emission factors (EC) in 2011 to be reported under the Community Emission Trading Scheme. Warsaw, Poland, 2013. Available online: https://www.kobize.pl/ (accessed on 1 February 2021).
  22. DEFRA. UK Government GHG Conversion Factors for Company Reporting. 2017. Available online: https://assets.publishing.service.gov.uk/government/uploads/system/uploads/attachment_data/file/650244/2017_methodology_paper_FINAL_MASTER.pdf (accessed on 1 February 2021).
  23. Horwitz, W. AOAC International. Official Methods of Analysis of AOAC International, Seventeenth ed; Association of Analytical Communities: Gaithersburg, MD, USA, 2000, 2020. [Google Scholar]
  24. Technical Authority, Fruit and Vegetable Products PN-EN 1132:1999 Fruit and Vegetable Juices-Determination of the PH-Value; Polish Committee for Standardization: Warsaw, Poland, 2013.
  25. Dobrzańska, A.; Cais-Sokolińska, D. Assessment of the suitability of color measurement systems for testing milk and whey protein preparations. Res. Teach. Apparat. 2014, 3, 267–272. [Google Scholar]
  26. Chudy, S.; Gierałtowska, U.; Krzywdzińska-Bartkowiak, M.; Piątek, M. Color measurement of products. In Contemporary Trends in Shaping the Quality of Food; Piasecka-Kwiatkowska, D., Cegielska-Radziejewska, R., Eds.; Faculty of Food Sciences and Nutrition, Poznan University of Life Sciences: Poznan, Poland, 2016; pp. 85–95. [Google Scholar]
  27. Nishinari, K.; Kohyama, K.; Kumagai, H.; Funami, T.; Bourne, M.C. Parameters of Texture Profile Analysis. Food Sci. Technol. Res. 2013, 19, 519–521. [Google Scholar] [CrossRef] [Green Version]
  28. Kunachowicz, H.; Przygoda, B.; Nadolna, I.; Iwanow, K. Composition and Nutrient Tables of Foods; PZWL: Warszawa, Poland, 2017. [Google Scholar]
  29. USDA National Nutrient Database for Standard Reference, Legacy Release. Available online: https://data.nal.usda.gov/dataset/usda-national-nutrient-database-standard-reference-legacy-release (accessed on 1 February 2021).
  30. Clydesdale, F.M.; Francis, F.J. Principles of Food Science, Part I, Food Chemistry; Fennema, O.R., Ed.; Marcel Dekker: New York, NY, USA, 1976. [Google Scholar]
  31. Krokida, M.K.; Tsami, E.; Maroulis, Z.B. Kinetics on color changes drying of some fruits and vegetables. Dry. Technol. 1998, 16, 667–685. [Google Scholar] [CrossRef]
  32. Sweeney, J.P.; Martin, M.E. Stability of chlorophyll in vegetables as affected by pH. Food Technol. 1961, 15, 263–266. [Google Scholar]
  33. Buckle, K.A.; Edwards, R.A. Chlorophyll colour and pH changes in HTST processed green pea puree. J. Food Technol. 1970, 5, 173–178. [Google Scholar] [CrossRef]
  34. Steet, J.A.; Tong, C.H. Degradation kinetics of green color and chlorophylls in peas by colorimetry and HPLC. J. Food Sci. 1996, 61, 924–927. [Google Scholar] [CrossRef]
  35. Yuan, G.F.; Sun, B.; Yuan, J.; Wang, Q.M. Effects of different cooking methods on health-promoting compounds of broccoli. J. Zhejiang Univ. Sci. B 2009, 10, 580–588. [Google Scholar] [CrossRef] [Green Version]
  36. Lin, S.; Brewer, M.S. Effects of blanching method on the quality characteristics of frozen peas. J. Food Qual. 2005, 28, 350–360. [Google Scholar] [CrossRef]
  37. Lau, M.H.; Tang, J.; Swanson, B.G. Kinetics of textural and color changes in green asparagus during thermal treatments. J. Food Eng. 2000, 45, 231–236. [Google Scholar] [CrossRef]
  38. Severini, C.; Giuliani, R.; De Filippis, A.; Derossi, A.; De Pilli, T. Influence of different blanching methods on colour, ascorbic acid and phenolics content of broccoli. J. Food Sci. Technol. 2016, 53, 501–510. [Google Scholar] [CrossRef] [PubMed] [Green Version]
  39. Sobol, Z.; Jakubowski, T.; Nawara, P. The Efect of UV-C Stimulation of Potato Tubers and Soaking of Potato Strips in Water on Color and Analyzed Color by CIE L*a*b*. Sustainability 2020, 12, 3487. [Google Scholar] [CrossRef] [Green Version]
  40. Frosta Food Service. Available online: https://www.frostafoodservice.de/produkty/burgery-i-stixxy/pl/ (accessed on 4 February 2021).
  41. Chaudhary, A.; Marinangeli, C.; Tremorin, D.; Mathys, A. Nutritional combined greenhouse gas life cycle analysis for incorporating Canadian yellow pea into cereal-based food products. Nutrients 2018, 10, 490. [Google Scholar] [CrossRef] [Green Version]
  42. Mitchell, D.C.; Lawrence, F.R.; Hartman, T.J.; Curran, J.M. Consumption of dry beans, peas, and lentils could improve diet quality in the US population. J. Am. Diet. Assoc. 2009, 109, 909–913. [Google Scholar] [CrossRef] [PubMed]
  43. Mudryj, A.N.; Yu, N.; Hartman, T.J.; Mitchell, D.C.; Lawrence, F.R.; Aukema, H.M. Pulse consumption in Canadian adults influences nutrient intakes. Br. J. Nutr. 2012, 108, 27–36. [Google Scholar] [CrossRef] [Green Version]
  44. Chaudhary, A.; Tremorin, D. Nutritional and Environmental Sustainability of Lentil Reformulated Beef Burger. Sustainability 2020, 12, 6712. [Google Scholar] [CrossRef]
  45. Bourne, M.C. Food Texture and Viscosity Concept and Measurement; Academic Press: London, UK, 1982. [Google Scholar]
  46. Cook, K.L.K.; Hartel, R.W. Mechanisms of ice crystallization in ice cream production. Compr. Rev. Food Sci. Food Saf. 2010, 9, 213–222. [Google Scholar] [CrossRef]
  47. Breen, S.P.; Etter, N.M.; Ziegler, G.R.; Hayes, J.E. Oral somatosensatory acuity is related to particle size perception in chocolate. Sci. Rep. 2019, 9, 7437. [Google Scholar] [CrossRef] [PubMed]
  48. Tyle, P. Effect of size, shape and hardness of particles in suspension on oral texture and palatability. Acta Psychol. 1993, 84, 111–118. [Google Scholar] [CrossRef]
  49. Hollins, O. WRAP 2013. Overview of Waste in the UK Hospitality and Food Service Sector; WRAP: Oxon, UK, 2013; HFS001-006. [Google Scholar]
  50. Sustainable Restaurant Association (SRA). Too Good to Waste: Restaurant Food Waste Survey Report; SRA: London, UK, 2010. [Google Scholar]
  51. Turowski, J.; Tkacz, K. The carbon footprint—An innovative index of the environmental impact of the food chain. Work. Mater. Gdan. Univ. Fac. Management. Prod. Qual. Saf. Environ. Prot. Agric. Food Sect. 2010, 2, 399. [Google Scholar]
  52. Kristensen, T.; Søegaard, K.; Eriksen, J.; Mogensen, L. Carbon footprint of cheese produced on milk from Holstein and Jersey cows fed hay differing in herb content. J. Clean. Prod. 2015, 101, 229–237. [Google Scholar] [CrossRef]
  53. Wróbel-Jędrzejewska, M.; Stęplewska, U.; Polak, E.; Kuleta, P.; Przybysz, Ł. Carbon footprint of fruit paste technology. Pol. J. Environ. Stud. 2016, 25, 341–349. [Google Scholar] [CrossRef]
  54. Willett, W.; Rockström, J.; Loken, B.; Springmann, M.; Lang, T.; Vermeulen, S.; Garnett, T.; Tilman, D.; de Clerck, F.; Wood, A. Food in the Anthropocene: The EAT–Lancet Commission on healthy diets from sustainable food systems. Lancet 2019, 393, 447–492. [Google Scholar] [CrossRef]
  55. Poore, J.; Nemecek, T. Reducing food’s environmental impacts through producers and consumers. Science 2018, 360, 987–992. [Google Scholar] [CrossRef] [Green Version]
  56. Hallez, L.; Qutteina, Y.; Boen, F.; Smits, T. The ABC’s of Ecological and Nutrition Labels. The Impact of Label Theme and Complexity on the Environmental Footprint of Online Grocery Choices. Sustainability 2021, 13, 2474. [Google Scholar] [CrossRef]
Figure 1. Diagram of vegeburger preparation using the test stand.
Sustainability 13 09093 g001
Figure 2. Test stand for vegeburger formation.
Sustainability 13 09093 g002
Figure 3. Scheme of individual stages in the production of vegeburgers on a laboratory scale.
Sustainability 13 09093 g003
Figure 4. Appearance of vegeburgers prepared using the test stand.
Sustainability 13 09093 g004
Figure 5. Vegeburger formed in the research model.
Sustainability 13 09093 g005
Figure 6. Testing the effectiveness of transferring a vegeburger from one conveyor to another.
Sustainability 13 09093 g006
Figure 7. CO2 emission structure in the experimental production (2 kg of vegeburgers) for different formulas.
Sustainability 13 09093 g007
Figure 8. CO2 emission structure in the experimental production of 5 kg vegeburgers according to formula I (36% potatoes +45% vegetable outgrades).
Sustainability 13 09093 g008
Figure 9. CO2 emission structure in the experimental production of 9.5 kg vegeburgers according to formula II (30% potatoes +54% vegetable outgrades).
Sustainability 13 09093 g009
Figure 10. Production volume of frozen vegetables and fruits (thousand tons) in 2015–2017.
Sustainability 13 09093 g010
Figure 11. Consumption of fuel materials and energy (thousand) in 2015–2017.
Sustainability 13 09093 g011
Table 1. Vegeburger formula composition.
Composition/Quantity [%]Formula IFormula IIFormula IIIFormula IV
Potatoes36.030.029.023.0
Beans (green/yellow) *14.020.020.020.0
Broccoli * 14.016.016.016.0
Cauliflower * 14.016.016.016.0
Carrot 14.010.010.015.0
Onion * 2.02.02.02.0
Potato flour 3.03.03.03.0
Fiber 1.81.82.74.0
Salt 0.80.80.80.8
Spices 0.40.40.50.2
* Vegetable outgrades.
Table 2. Physicochemical parameters of vegetable outgrades (#)and vegetables.
ParameterBroccoli #Cauliflower #Yellow Bean # Green Bean # Onion #PotatoCarrot
Dry mass [g/100 g]6.85 ± 0.075.40 ± 0.0111.35 ± 0.0710.10 ± 0.149.81 ± 0.0413.46 ± 0.2610.20 ± 0.10
Fat [g/100 g]0.16 ± 0.010.06 ± 0.050.08 ± 0.010.09 ± 0.010.05 ± 0.010.06 ± 0.010.12 ± 0.01
Protein [g/100 g]2.52 ± 0.011.44 ± 0.012.24 ± 0.012.06 ± 0.011.62 ± 0.021.69 ± 0.030.92 ± 0.02
Fiber [g/100 g]2.50 ± 0.021.89 ± 0.044.73 ± 0.034.74 ± 0.022.17 ± 0.011.46 ± 0.023.08 ± 0.03
Ash [g/100 g]0.46 ± 0.010.32 ± 0.021.02 ± 0.010.92 ± 0.010.55 ± 0.010.55 ± 0.010.42 ± 0.02
pH [-]6.49 ± 0.016.01 ± 0.026.15 ± 0.015.95 ± 0.015.54 ± 0.015.57 ± 0.016.32 ± 0.05
Data are presented as mean ± SD. #: vegetable outgrades.
Table 3. Colors of vegetable outgrades (#) and vegetables.
ParameterBroccoli #Cauliflower #Yellow Bean #Green Bean #Onion #PotatoCarrot
FloretHeadFloretHead
L*27.20 ± 2.0549.14 ± 7.8263.68 ± 2.5355.18 ± 7.4555.35 ± 6.4840.31 ± 0.1961.59 ± 0.8866.22 ± 6.6742.40 ± 2.65
a*−9.80 ± 1.49−10.70 ± 4.97−3.27 ± 0.32−2.72 ± 0.37−5.40 ± 0.11−11.51 ± 0.50−2.38 ± 0.35−2.07 ± 0.3124.02 ± 3.28
b*15.38 ± 1.5625.09 ± 8.867.51 ± 0.563.30 ± 3.6217.97 ± 4.9423.95 ± 1.4624.30 ± 0.3725.53 ± 7.1331.58 ± 5.27
C*18.25 ± 2.0727.30 ± 10.068.20 ± 0.404.93 ± 2.0518.79 ± 4.7026.58 ± 1.5324.41 ± 0.4125.62 ± 7.1039.68 ± 6.15
h122.40 ± 1.97112.37 ± 3.23113.65 ± 3.52141.43 ± 42.91107.33 ± 4.80115.68 ± 0.4095.60 ± 0.7594.85 ± 1.4752.66 ± 1.17
Data are presented as mean ± SD. #: vegetable outgrades.
Table 4. Parameters of vegeburgers prepared using the test stand.
ParameterFormula IFormula IIFormula IIIFormula IV
Dry mass [g/100 g] 19.80 ± 0.1815.85 ± 0.1917.73 ± 0.2517.97 ± 0.05
Fat [g/100 g] 0.21 ± 0.020.20 ± 0.030.24 ± 0.030.20 ± 0.04
Protein [g/100 g] 2.08 ± 0.042.05 ± 0.032.29 ± 0.442.09 ± 0.03
Fiber [g/100 g] 3.97 ± 0.053.98 ± 0.084.13 ± 0.074.92 ± 0.05
Total carbohydrates [g/100 g] * 9.8310.368.707.27
Ash [g/100 g] 1.29 ± 0.021.22 ± 0.031.21 ± 0.031.29 ± 0.03
pH [-] 6.11 ± 0.036.20 ± 0.026.12 ± 0.046.15 ± 0.03
* Estimated on the basis of tabular values [25].
Table 5. Color of vegeburgers prepared using the test stand.
ParameterFormula IFormula IIFormula IIIFormula IV
min ÷ max
L* 57.08 ÷ 61.4556.18 ÷ 64.2058.60 ÷ 64.73 58.10 ÷ 62.83
a* 0.16 ÷ 6.73 −5.49 ÷ 4.74 −4.94 ÷ 5.05−1.70 ÷ 5.74
b* 22.31 ÷ 28.2018.21 ÷ 24.48 19.77 ÷ 24.45 19.41 ÷ 24.15
C* 22.33 ÷ 28.3018.28 ÷ 24.5020.38 ÷ 24.51 19.43 ÷ 24.18
h 76.00 ÷ 89.63 76.14 ÷ 104.37 77.45 ÷ 104.0275.15 ÷ 94.38
Table 6. Textural properties of vegeburgers prepared using the test stand.
ParameterFormula IFormula IIFormula IIIFormula IV
TPA test
Hardness [N]0.31 ± 0.100.35 ± 0.100.40 ± 0.140.31 ± 0.09
Cohesiveness [-]0.73 ± 0.100.57 ± 0.080.56 ± 0.140.58 ± 0.18
Springiness [mm]0.82 ± 0.091.16 ± 0.311.01 ± 0.190.68 ± 0.06
Gumminess [N]0.26 ± 0.040.38 ± 0.140.21 ± 0.040.17 ± 0.04
Chewiness [mJ]0.16 ± 0.090.33 ± 0.150.23 ± 0.090.13 ± 0.04
Compression (cutting) test
Hardness[N]11.96 ± 1.3110.00 ± 1.0011.25 ± 1.0810.04 ± 1.14
Adhesiveness[mJ]0.85 ± 0.191.05 ± 0.251.14 ± 0.331.14 ± 0.33
Mean ± SD with different letters indicates significant difference (p < 0.05).
Table 7. Carbon footprint determined for the experimental vegeburger production.
ProcessBlanchingShreddingShreddingMixingForming (Compressor)Forming
(Forming Machine)
CF [kgCO2/
kg Product]
Quantity
ComponentPotatoBeanVegetable MassVegeburger
FormulaUnit
Ikg1.8 1.8 0.75 5.00.2650
kWh0.565 0.005 0.002 0.0230.0470.058
IIkg0.6 0.60.22.00.2821
kWh0.188 0.0020.0010.0160.0430.030
IIkg0.6 0.60.22.00.2822
kWh0.188 0.0020.0010.0180.039 0.023
IIIkg0.6 0.60.22.0 0.2820
kWh0.188 0.0020.0010.0260.041 0.022
IVkg0.46 0.460.22.00.2819
kWh0.1440.0010.0010.0300.0350.022
IVkg0.46 0.46 kg0.22.00.2820
kWh0.144 0.0010.0010.0320.0340.020
IIIkg0.6 0.60.22.00.2823
kWh0.188 0.0020.0010.0350.0450.019
IIkg2.85 2.851.99.50.26101
kWh0.895 0.0080.0110.0430.1120.074
Table 8. Carbon footprint value of the production of selected frozen vegetables in 2015–2017.
ProductCF [kg CO2/kg product]CFaver
(2015–2017)
201520162017
Onion0.860.930.930.91
Broccoli0.780.830.970.86
Cauliflower0.760.880.870.84
Green bean0.710.600.680.66
Yellow bean0.710.600.680.66
Carrot0.810.790.800.80
Table 9. Vegetable proportion in a vegeburger included in the carbon footprint analysis.
FormulaPotatoesVegetable OutgradesCarrotPercent Share
BeansBroccoliCauliflowerOnionVegetable OutgradesPotatoes
kg%
I 1.800.750.700.700.100.674536
II 0.600.200.320.320.040.204430
III 0.600.200.320.320.040.204430
IV 0.460.200.320.320.040.304423
III 0.600.200.320.320.040.204430
II 2.851.901.521.520.190.955430
Table 10. CF of vegetable outgrades and other ingredients applied in vegeburger preparation using the test stand.
Formula BeansBroccoliCauliflowerCarrotOnionOutgrade
IMass [kg]0.750.700.700.67 0.10 2.92
CF [kg CO2/kg outgrade]0.5100.6790.6090.5360.0930.830
IIMass [kg]0.200.320.320.200.041.08
CF [kg CO2/kg outgrade]0.1360.3100.2780.1600.0370.850
IIMass [kg]1.901.521.520.950.196.08
CF [kg CO2/kg outgrade]1.2921.4741.3220.7600.1770.830
IIIMass [kg]0.200.320.320.200.041.08
CF [kg CO2/kg outgrade]0.1360.3100.2780.1600.0370.850
IVMass [kg]0.200.320.320.300.041.18
CF [kg CO2/kg outgrade]0.1360.3100.2780.2400.0370.850
Table 11. Textural properties of vegeburgers prepared using the test stand.
FormulaVegeburgers QuantityVegetable Outgrade Production CFVegeburger Production CFTotal CFVegeburger CF
pcs.Kg CO2/kg productKg CO2/product pcs.
I500.830.261.090.11
II210.850.281.130.11
II220.850.281.130.10
III200.850.281.130.11
IV190.850.281.130.12
IV200.850.281.130.11
III230.850.281.130.10
II1010.830.261.090.10
Publisher’s Note: MDPI stays neutral with regard to jurisdictional claims in published maps and institutional affiliations.

