1. Introduction
To combat climate change and fulfill the Paris Agreement’s goals, the European Union (EU) set binding climate and energy targets for 2030. They are reducing greenhouse gas emissions by at least 40%, increasing energy efficiency by at least 32.5%, increasing the share of renewable energy to at least 32% of EU energy use, and guaranteeing at least 15% electricity inter-connection levels between neighboring Member States, [
1,
2]. To help reach the Paris Climate Agreements and Sustainable Goals, widespread renewable energy sources are crucial [
3,
4]. One of those sources is hydroelectric power plants, a renewable energy source that aids in the reduction of greenhouse gasses [
5,
6,
7,
8,
9].
Due to climate change, natural disasters, including floods, are becoming more frequent [
10,
11,
12,
13,
14,
15]. Floods result from the overflow of rivers and streams and affect the operating regime of hydroelectric power plants. In fact, during flood events, hydropower plants must spill water over dams to maintain safe operation, particularly the stability and strength of the dam structure, and to protect hydraulic machines exposed the effects of water debris. From an energy point of view, any spilled water is an irrecoverable loss of energy. Many releases and environmental impacts resulting from the unrestricted exploitation of natural resources are showing their consequences. One consequence is the release of a high amount of natural water energy (such as heavy rain) in a short amount of time. With the equipment installed, we cannot process such a large amount of water, resulting in energy loss.
Excessive amounts of water that cannot be carried along existing hydraulic waterways through turbines should be spilled over the gate of the discharge paths of the hydropower plant. Furthermore, turbine fields often have to be stopped or closed due to water debris (mud, small stones, and wood pieces), which further increases the amount of spilled water. In addition, debris and ground transport of solid particles along the river bottom threatens the hydropower plant operation. Of course, much depends on the riverbed structure and the design in front of the dam. If suspended sediments occur and solid particles are transferred to the ground, the turbine fields should be stopped or closed to protect the equipment. Consequently, electricity production must be halted. Excess water is handled with jumps, drain valves, side drains, or other constructed safety structures. In the following chapters, we focus on the overflow of water over dams (upper discharge) in the chain of hydroelectric power plants on the Sava River in the southern part of Slovenia.
The reason we assessed these losses is in the character of the Sava River, which is a typical sub-Alpine river [
16]. Flood events are more frequent in the Spring, when the snow melts in the Alps, and in Autumn when heavy rainfalls occur. The flow rates are often too large for the installed capacity of the existing hydropower plants. Therefore, we attempted to estimate these losses and to determine a way to reduce them. With the added installed capacity, we could increase the existing production and thus reduce the import of electricity to Slovenia.
Review of Published Studies
A review of the literature revealed few contributions addressing the topic. Most articles focus on optimal hydropower plant capacity determination based on a flow duration curve. Liucci et al. [
17] present a study that finds a strong influence on the characteristics of two parameters: the overflow regime and extreme events caused by weather conditions on electricity production. Reichl and Hack [
18] deal with calculating the flow duration curve during several precipitation and impacts on the groundwater level; however, energy production or losses due to water overflow were not addressed. Duratorre et al. [
16] demonstrated that hydropower potential until the end of the century will increase, and the energy production would depend upon changes on a monthly scale rather than upon yearly flows. The future of hydrology is unpredictable, with more fluctuations in a shorter period.
Our paper focuses on the unused potential of spilled water, considering it as energy loss that occurs more often because of the effect of climate changes. We believe that such a contribution will guide hydropower plant operators to consider the feasibility of energy capture of spilled water.
To our knowledge, it is the first time that the hydropower potential of spilled water has been studied.
2. Materials and Methods
Hills surround the region of the Sava River, which is located between the village Boštanj and the city Brežice in Slovenia (
Figure 1). It is riddled with numerous permanent streams as well as intermittent springs and streams. In most cases, the river channel is straightening or changing direction duo to urban development. Intensive peak flows are observed several times a year, sometimes resulting in flooding of inhabited areas. In Slovenia, on the Sava River, four hydropower plants are installed and one is planned (
Figure 1). These are, in the direction of flow, HPP Boštanj, HPP Arto-Blanca, HPP Krško, and HPP Brežice. The last one, HPP Mokrice, is planned for construction in the coming years. The chain of HPPs are operating at instaled conditions, meaning with river flow rates up to Q
i = 500 m
3/s. The accumulation basins of the HPP Brežice and HPP Mokrice have the role of equalizing the daily Sava water flow variability from upstream HPPs. It is also possible to overflow excess water during extreme river flows through installed safety structures (bypass overflow fields) in front of HPP Brežice and HPP Mokrice. HPPs Boštanj, Arto-Blanca, and Krško have no large reservoirs, so all three hydroelectric power plants are of the run-of-the-river type.
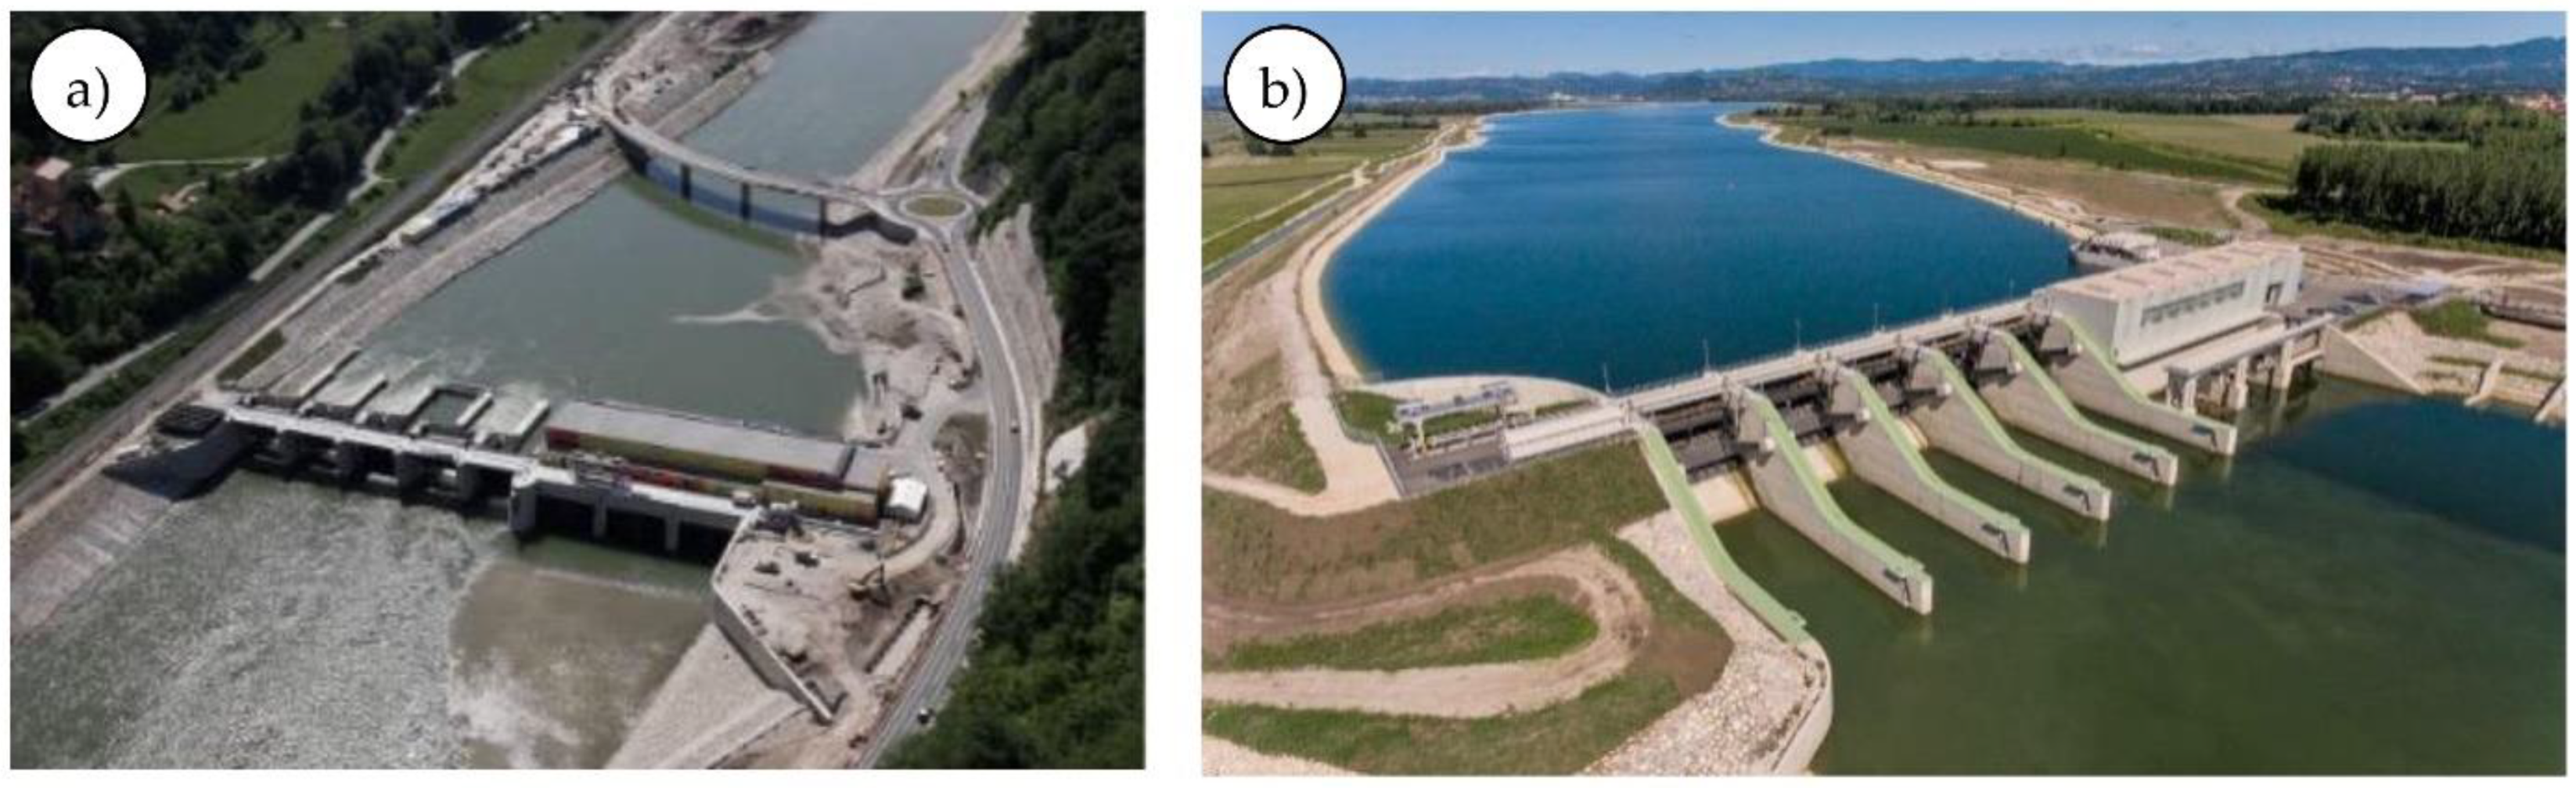
The 32.5 MW HPP Boštanj (
Figure 2a) is a hydroelectric power plant of the run-of-the-river and reservoir type, with three bulb-type turbines with a capacity of 10.84 MW each. The hydropower plant has a combined rated discharge of 500 m
3/s, an average flow of 193 m
3/s, a head of 7.47 m, 5 spillways, and an average annual production output of 109 GWh. The reservoir capacity is 8,000,000 m
3 with live storage of 1,170,000 m
3 [
20].
The 39.12 MW HPP Arto-Blanca (
Figure 2b) is a hydroelectric power plant of the run-of-the-river and reservoir type, with three vertical Kaplan turbines with a capacity of 13.04 MW each. The hydropower plant has a combined rated discharge of 500 m
3/s, an average annual flow of 201 m
3/s, a head of 9.29 m, 5 spillways, and an average annual production output of 148 GWh. The reservoir capacity is 9,950,000 m
3 with live storage of 1,300,000 m
3 [
20].
The 39.12 MW HPP Krško (
Figure 3a) is a hydroelectric power plant of the run-of-the-river and reservoir type, with three vertical Kaplan turbines with a capacity of 13.04 MW each. The hydropower plant has a combined rated discharge of 500 m
3/s, an average annual flow of 205 m
3/s, a head of 9.14 m, 5 spillways, and an average annual production output of 146 GWh. The reservoir capacity is 6,310,000 m
3 with live storage of 1,180,000 m
3 [
20].
The 47.4 MW HPP Brežice (
Figure 3b) is a hydroelectric power plant of the run-of-the-river and reservoir type, with three vertical Kaplan turbines with a capacity of 15.8 MW each. The hydropower plant has a combined rated discharge of 500 m
3/s, an average annual flow of 207 m
3/s, a head of 11 m, 5 spillways, and an average annual production output of 161 GWh. The reservoir capacity is 19,300,00 m
3 with live storage of 3,400,000 m
3 [
20].
The planned 28.05 MW HPP Mokrice (
Figure 4) will be a hydroelectric power plant of the run-of-the-river and reservoir types, with three tubular Kaplan turbines with a capacity of 9.35 MW each. The hydropower plant will have a combined rated discharge of 500 m
3/s, an average annual flow of 261 m
3/s, a head of 7.47 m, 5 spillways, and an average annual production output of 131 GWh. The reservoir capacity will be 8,300,000 m
3 with live storage of 3,400,000 m
3 [
20].
3. Data Review and Results
Data on the water level and spilled water in individual hydropower plants were collected between 2015 and 2019 [
21]. The volume of spilled water, the number of spilled events, and the estimated energy loss are summarized in
Table 1. A large volume of water in a given period was spilled at HPP Krško, precisely 4,272,865,479 m
3. The official opening of HPP Brežice was in September 2017; consequently, the monitored period for HPP Brežice is only two years (2018–2019). In the monitoring period, 3316 h of overflows were recorded. The share of spilled water is also increasing: the ratio of spilled water with the total volume of water and on average at all four hydropower plants is 12.5% (
Table 1).
Figure 5,
Figure 6,
Figure 7 and
Figure 8 show overflow flows (size and duration) in individual hydropower plants. Data is available from 2015 to 2020, except for HPP Brežice, for which data is recorded in 2018 and 2019. High river flow-rates (peaks) are in the Spring and Autumn. During these periods, the energy loss for all hydropower plants due to spilled water sums up to 372,354 MWh (
Table 1).
Figure 6,
Figure 7 and
Figure 8 show the time and quantities (flows) of spilled water from 2015 to 2019. The increase in flow in Spring and Autumn and the minimum flow in Summer are given. Interestingly, the emission times between individual years in the observed period match well, but they are not the same between years and between hydroelectric power plants, although they stand on the same river. That can be explained by the different operating regimes of individual hydropower plants, which consider local environmental factors, such as different bottoms, shoreline widths, and the banks’ state.
Data Analysis
Figure 9 shows the annual volume of water of the Sava River from a hydrological station of the Slovenian environment agency (ARSO) near HPP Brežice in the 1990–2019 period [
22]. The used data consist of daily averaged flow rates.
The data used for the graph in
Figure 10 consist of hourly averaged flow rates in the 2015–2019 period [
21]. The volume of spilled water is calculated from the flow rate data for individual HPPs. The difference in the amount of spilled water between HPPs is due to different reservoirs capacities and operating regimes.
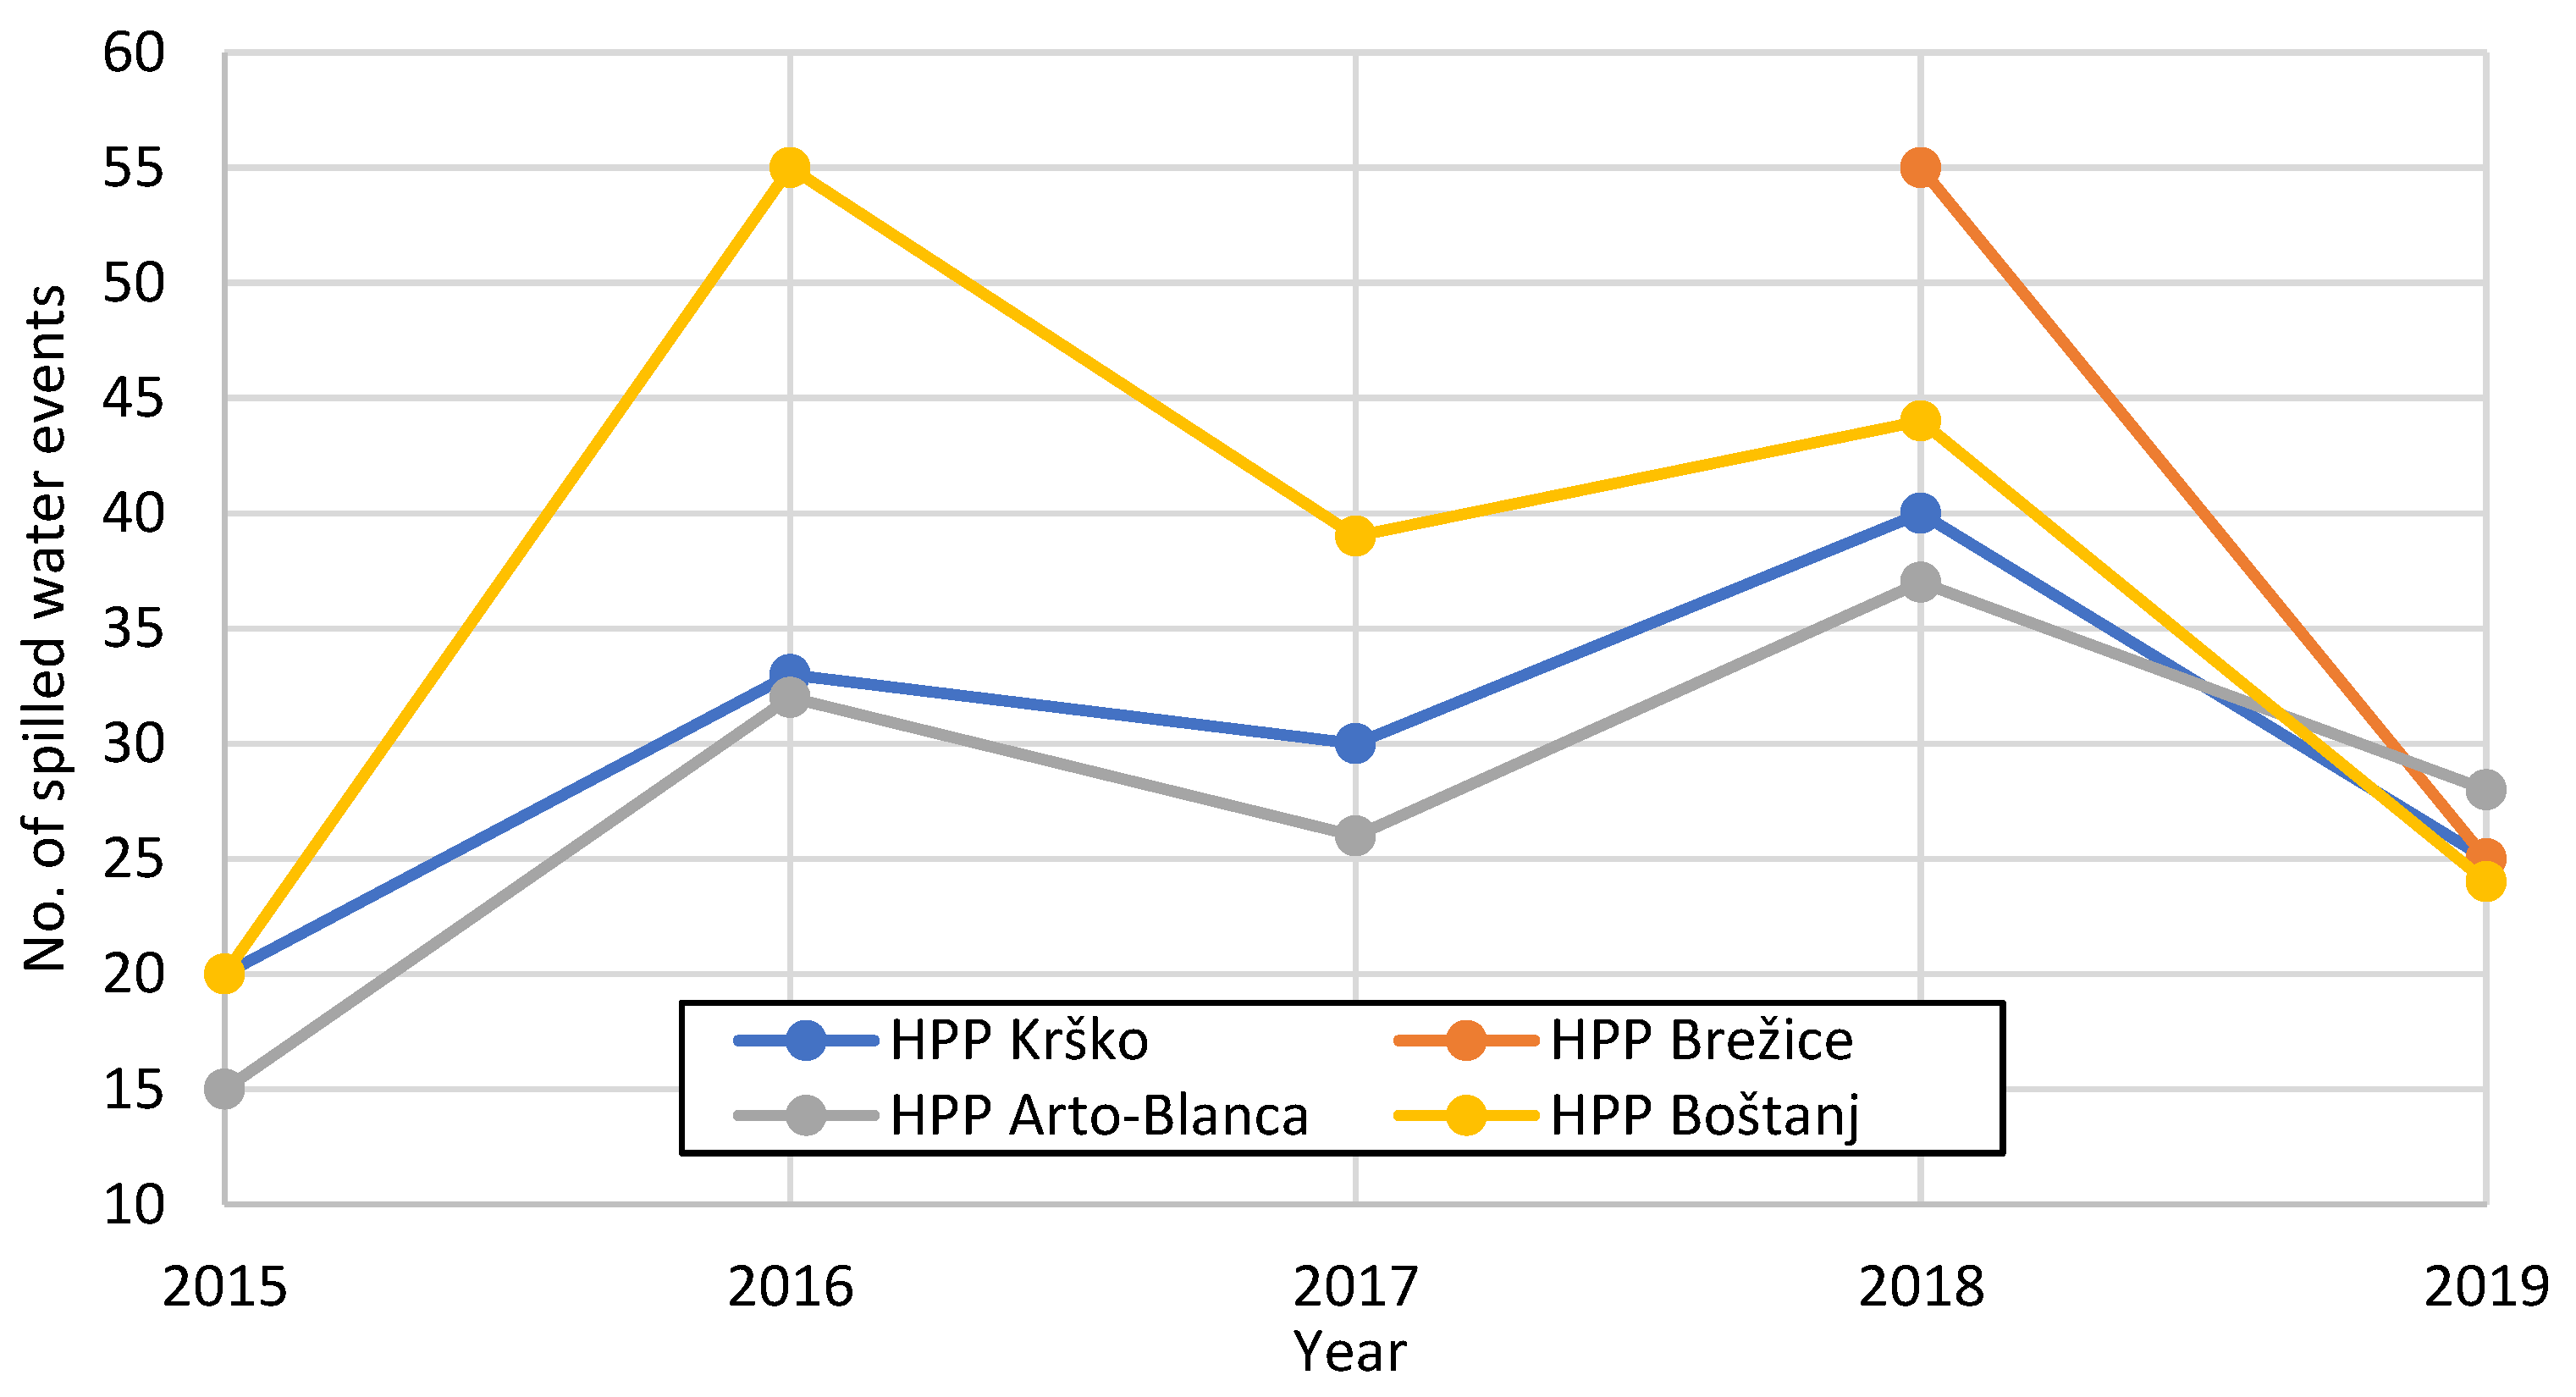
The graph in
Figure 11 shows the number of spilled water events for each HPP. Spilled water events are determined from river flow rates larger than the installed capacitiy on an individual HPP.
This amount of spilled water could be used with a “small” hydropower system with a built-in capacity of up to 10 MW (according to Slovenian legislation), and the average price would be EUR 43.58/MWh [
23]. Prices from 2015 to 2019 ranged between EUR 34.46 and EUR 48.43/MWh [
23]. At these prices, the potential loss in these five years would amount to EUR 11.5 million, or EUR 2.3 million per year (calculated for five years, including HPP Brežice). Given the occasional small hydropower plant, subsidized electricity prices for small producers could be eligible up to an installed capacity of 10 MW, which means that such capacity could cover the vast majority of outflows, except for the extreme (most significant), which would still largely overflow (be lost). From an economic point of view, it is pointless to have such large installed capacity units, which could only occasionally be used at full power.
4. Possible Solutions and New Proposal
Most operators today are taking into account weather forecasts and preparing in advance for higher river flows. In an article by Ahmad et al. [
24], we find proposals to adjust the performance based on the hydrological model from 1 to 16 days in advance and optimize production. Weather conditions in the entire vicinity of the river basin and the “source” runoff area must be taken into account. Weather conditions and forecasts must be closely monitored in advance and the water level of hydropower plants adjusted accordingly.
The technical solutions proposed by Hunt et al. [
25] are possible solutions; the authors primarily focused on harnessing the kinetic energy of spilled water. The proposed idea is interesting but is feasible only during construction or with a reconstruction of the dam. In the rest of the article, we focus on possible upgrades to existing hydropower systems, such as the use of Steff turbines [
26] or similar designs of smaller low-head turbines [
27].
The combination of the two previously proposed solutions, i.e., taking into account the water level and weather conditions and the forecasts for a large area, could be the reference for upgrading the existing hydropower system. The most appropriate combination of energy use of overflow water could be implemented without significant construction work in the hydropower plant. The weather conditions and the forecast have already been implemented. The emphasis is on the use of overflow water, and the overflow in HPP Krško has been partially evaluated.
4.1. Implementation Proposal—A Case Study on the HPP Krško Spillway
Technical data of the one overflow field of HPP Krško:
The width of the overflow field: m
Height (nominal drop): 9.14 m
As an example of the overflow, we consider one from 23 May 2015 from 00:00 to 25 May 2015 to 00:00, 48 h in total, as shown in
Figure 12.
We treated the flow conditions over the gate as an overflow over a narrow barrier (
Figure 13), for which we can formulate the energy equation. If the velocity head at point 2 above the weir crest is assumed to equal the total head upstream, then we may use Bernoulli’s equation, considering no losses:
from which the velocity at point 2 is approximately:
where
is the vertical distance to point 2, as shown in
Figure 13. If we assumed that the flow over the crest declines to
, then the specific volume flow rate up to the weir width
is
or approximately:
Usually, the upstream velocity head
, in front of the weir (sharp-crest), is neglected. With this, the Equation (3) is reduced to:
The calculated coefficient of 0.81 in Equation (4) is, in practice, too high [
28]. From our experience, based on experimental measurements on laboratory models of overflow gates [
29], we estimate this coefficient to be around 0.7, which should be accurate enough for our case.
One can calculate:
where:
where
× (number of spill water gates) in our case:
, at HPP Krško. The results of the calculated water heads and velocity (at point 2,
Figure 13) over the crest are given in
Figure 14.
The average values will be used for further calculations: the flow velocity over the weir is around 2 m/s, the head is 0.8 m, and the average flow rate over the weir is approximately 28 m
3/s (
Table 2).
To capture this “waterfall” energy, we propose the use of the Steff turbine (
Figure 15) [
26]. The crucial part of this turbine is the conveyor chain on which the profiled paddles are mounted. Available hydraulic energy is converted to mechanical/rotational energy and then into electric energy by a generator. The water weight is utilized, which produces the downhill force F over the conveyor chain of length L that is inclined at an angle.
The driving torque is defined by multiplying downhill force with lever arm
between the paddle center and the shaft:
where
is the water density,
is the gravity acceleration,
is the paddle surface area (paddle height times conveyor width), and
ε is the filling coefficient of the cell area relative to the paddle area. This filling factor can be determined in our case from the weir flow rate and angular speed, while the circumferential velocity is:
Since the weir flow rate is also equal to:
then the circumferential velocity from Equation (9) becomes:
In the case of hydraulic turbines (Pelton, Kaplan, waterwheels, etc.), it is known that the circumferential velocity is:
Combining Equations (11) and (12), the filling coefficient becomes constant:
With the filled coefficient, the theoretical driving torque becomes:
and theoretical turbine power is:
The creators of the Steff-turbine performed efficiency measurement on a 10 kW model at the University of German Armed Forces in Munich. They measured the efficiency rate of 0.7 up to 0.9, depending on the inclination angle and flow rates [
26]. For small angles (
), a higher efficiency is observed. In our case, the angles between 30 to 45 degrees are of interest, so the turbine efficiency is in the range of 0.8 up to 0.85. For our application we take turbine efficiency
ηturbine = 0.825, and the expected turbine power is thus:
4.2. Defining the Basic Geometry of the “Reverse Steff-Turbine”
Regarding the mean head determined from the weir flow rate (
Table 2),
, we chose the paddle a little bit higher:
- −
paddle height: ;
- −
with weir width: .
Regarding the mean velocity determined from the weir flow rate (
Table 2),
, we chose the larger turbine design velocity:
.
Now, the turbine rotation number is chosen—
(
), which defines the angular velocity:
Combining Equations (9) and (12), we obtain:
and from that, the mean radius of the paddles’ center is:
The conveyor chain length is chosen (between drums axis), , and the inclination angle is .
With all the assumed and chosen data, the theoretical torque is calculated:
and the power is:
or
There is a technical limitation to manufacture a conveyor chain with a width of 15 m, so we split one big unit into five smaller units that work in parallel. A conveyor chain width of 3 m is more flexible to implement. The technical data of the single unit will be:
;
269,429.8 Nm;
.
With division from a single unit to five smaller units, additional flow loss between the belts could be expected and estimated to be 10% of unit power. Thus, for further calculations, we consider the following unit data:
A schematic illustration of a possible unit behind the weir is shown in
Figure 16.
4.3. Estimated Production
At the current spilled water period, the Steff turbine can operate for about 38 h. The possible production of one unit is:
at one spill-water gate:
and at HPP Krško, with five spill water gates:
The total theoretical energy of the spilled water for this period of 38 h is 473.8 MWh, which is calculated from a flow rate of 140 m3/s (5 times 28 m3/s) and an installed head of 9.14 m. Considering the possible energy production of spilled water over the weirs (200 MWh) and the theoretically possible production (474 MWh), we can calculate a yield of 42% with the suggested technical approach.
The total spilled water losses in the five years of all installed power plants at Sava River represent a theoretically estimated power production of 372,354.0 MWh (
Table 1). If we can use around 40% of this energy, we obtain approximately 150,000 MWh in five years, or 30,000 MWh annualy. At the average electricity price of EUR 43.58/MWh [
23] (for small power plant production) in the given period between 2015–2019, this results in a revenue of EUR 6,537,000 or EUR 1,307,000 per year.
5. Discussion
The economic assessment and the concern for the environment and the electricity needs of Slovenia show that it would be appropriate to use the energy of spilled water over hydropower weirs. In addition, climate change will cause more and more water spills due to the current, excessive amounts of water in riverbeds resulting from storms and heavy rains in a short time. More of such events are expected in the future [
16]. Therefore, it makes sense to consider upgrading energy systems to use spilled water on existing hydropower systems. Of course, the upgrade must be physically reasonable and economically justified so that the managers or owners will decide on such upgrades. Therefore, a solution is given by choosing an already existing technology, i.e., the Steff turbine. So why the “modified” Steff turbine?
It allows the flow of debris and even larger floating pieces along the “conveyor belt” of the turbine blades. In most cases, we know that large bodies of water carry more significant amounts of sediment, which can mostly be caught in front of overflow fields, and sometimes some piece of more significant sediment passes over the dam. The advantages of the proposed technical solution with the modified Steff turbine are as follows:
It is robust and can be installed under the barrier on already built overflow fields;
It is adjustable at an angle, depending on the overflow (and the angle of the overflow field) and thus achieves optimal performance;
It is relatively easy to implement;
It can be accessed during operation with normal (installed) and low river flows;
It does not require extensive and complex maintenance;
It is cost-effective compared to other types of turbines.
From the given calculation example, i.e., the calculation of energies or possible electricity production from spilled water, it is clear that the economy allows for the construction of equipment that could capture about 40% of spilled water energy in a given case. That means that with the upgrade of the existing hydro-energy infrastructure, we could increase production. In this way, we would take advantage of unfavorable weather conditions for a sustainable and renewable electricity supply.
6. Conclusions
The authors believe the presented case study shows that spilled water over a barrier or locks could be used for energy production. All the water that does not go through the turbine track is irretrievably lost. In the future we can expect a more significant part of water to be spilled due to climate change. At the same time, the amount of spilled water is more considerable, which means that the exploitation of spilled water is becoming increasingly important. Uncertainty is, of course, expected when it comes to the projection of future hydrology and hydropower potential.
Using the available short-term data, we performed a case study with a modified technical solution and made a theoretical proposal on how to increase the efficiency of HPPs with the spilled water. The presented case study shows that there are economically and technically feasible reasons for upgrading existing hydropower systems. Doing so brings a double benefit: firstly, higher energy production and secondly, the use of unfavorable weather conditions for additional operation, which is not possible with classic implementations of hydro-energy infrastructures.
Due to climate change, extreme events are on the rise and are projected to increase in the medium term. The daily flow rates tend to oscillate more, so we need to be prepared and take advantage of these events where possible and justified. Although the article discusses the measured data at a specific location, we believe that the results can be calculated and generalized to other regions where similar problems occur.
As we need more electricity for community self-sufficiency while reducing our carbon footprint, the existing energy system must be as efficient as possible and use all available resources. One option may be to use water spilled over hydropower dams.


