3.1.1. Soil Texture
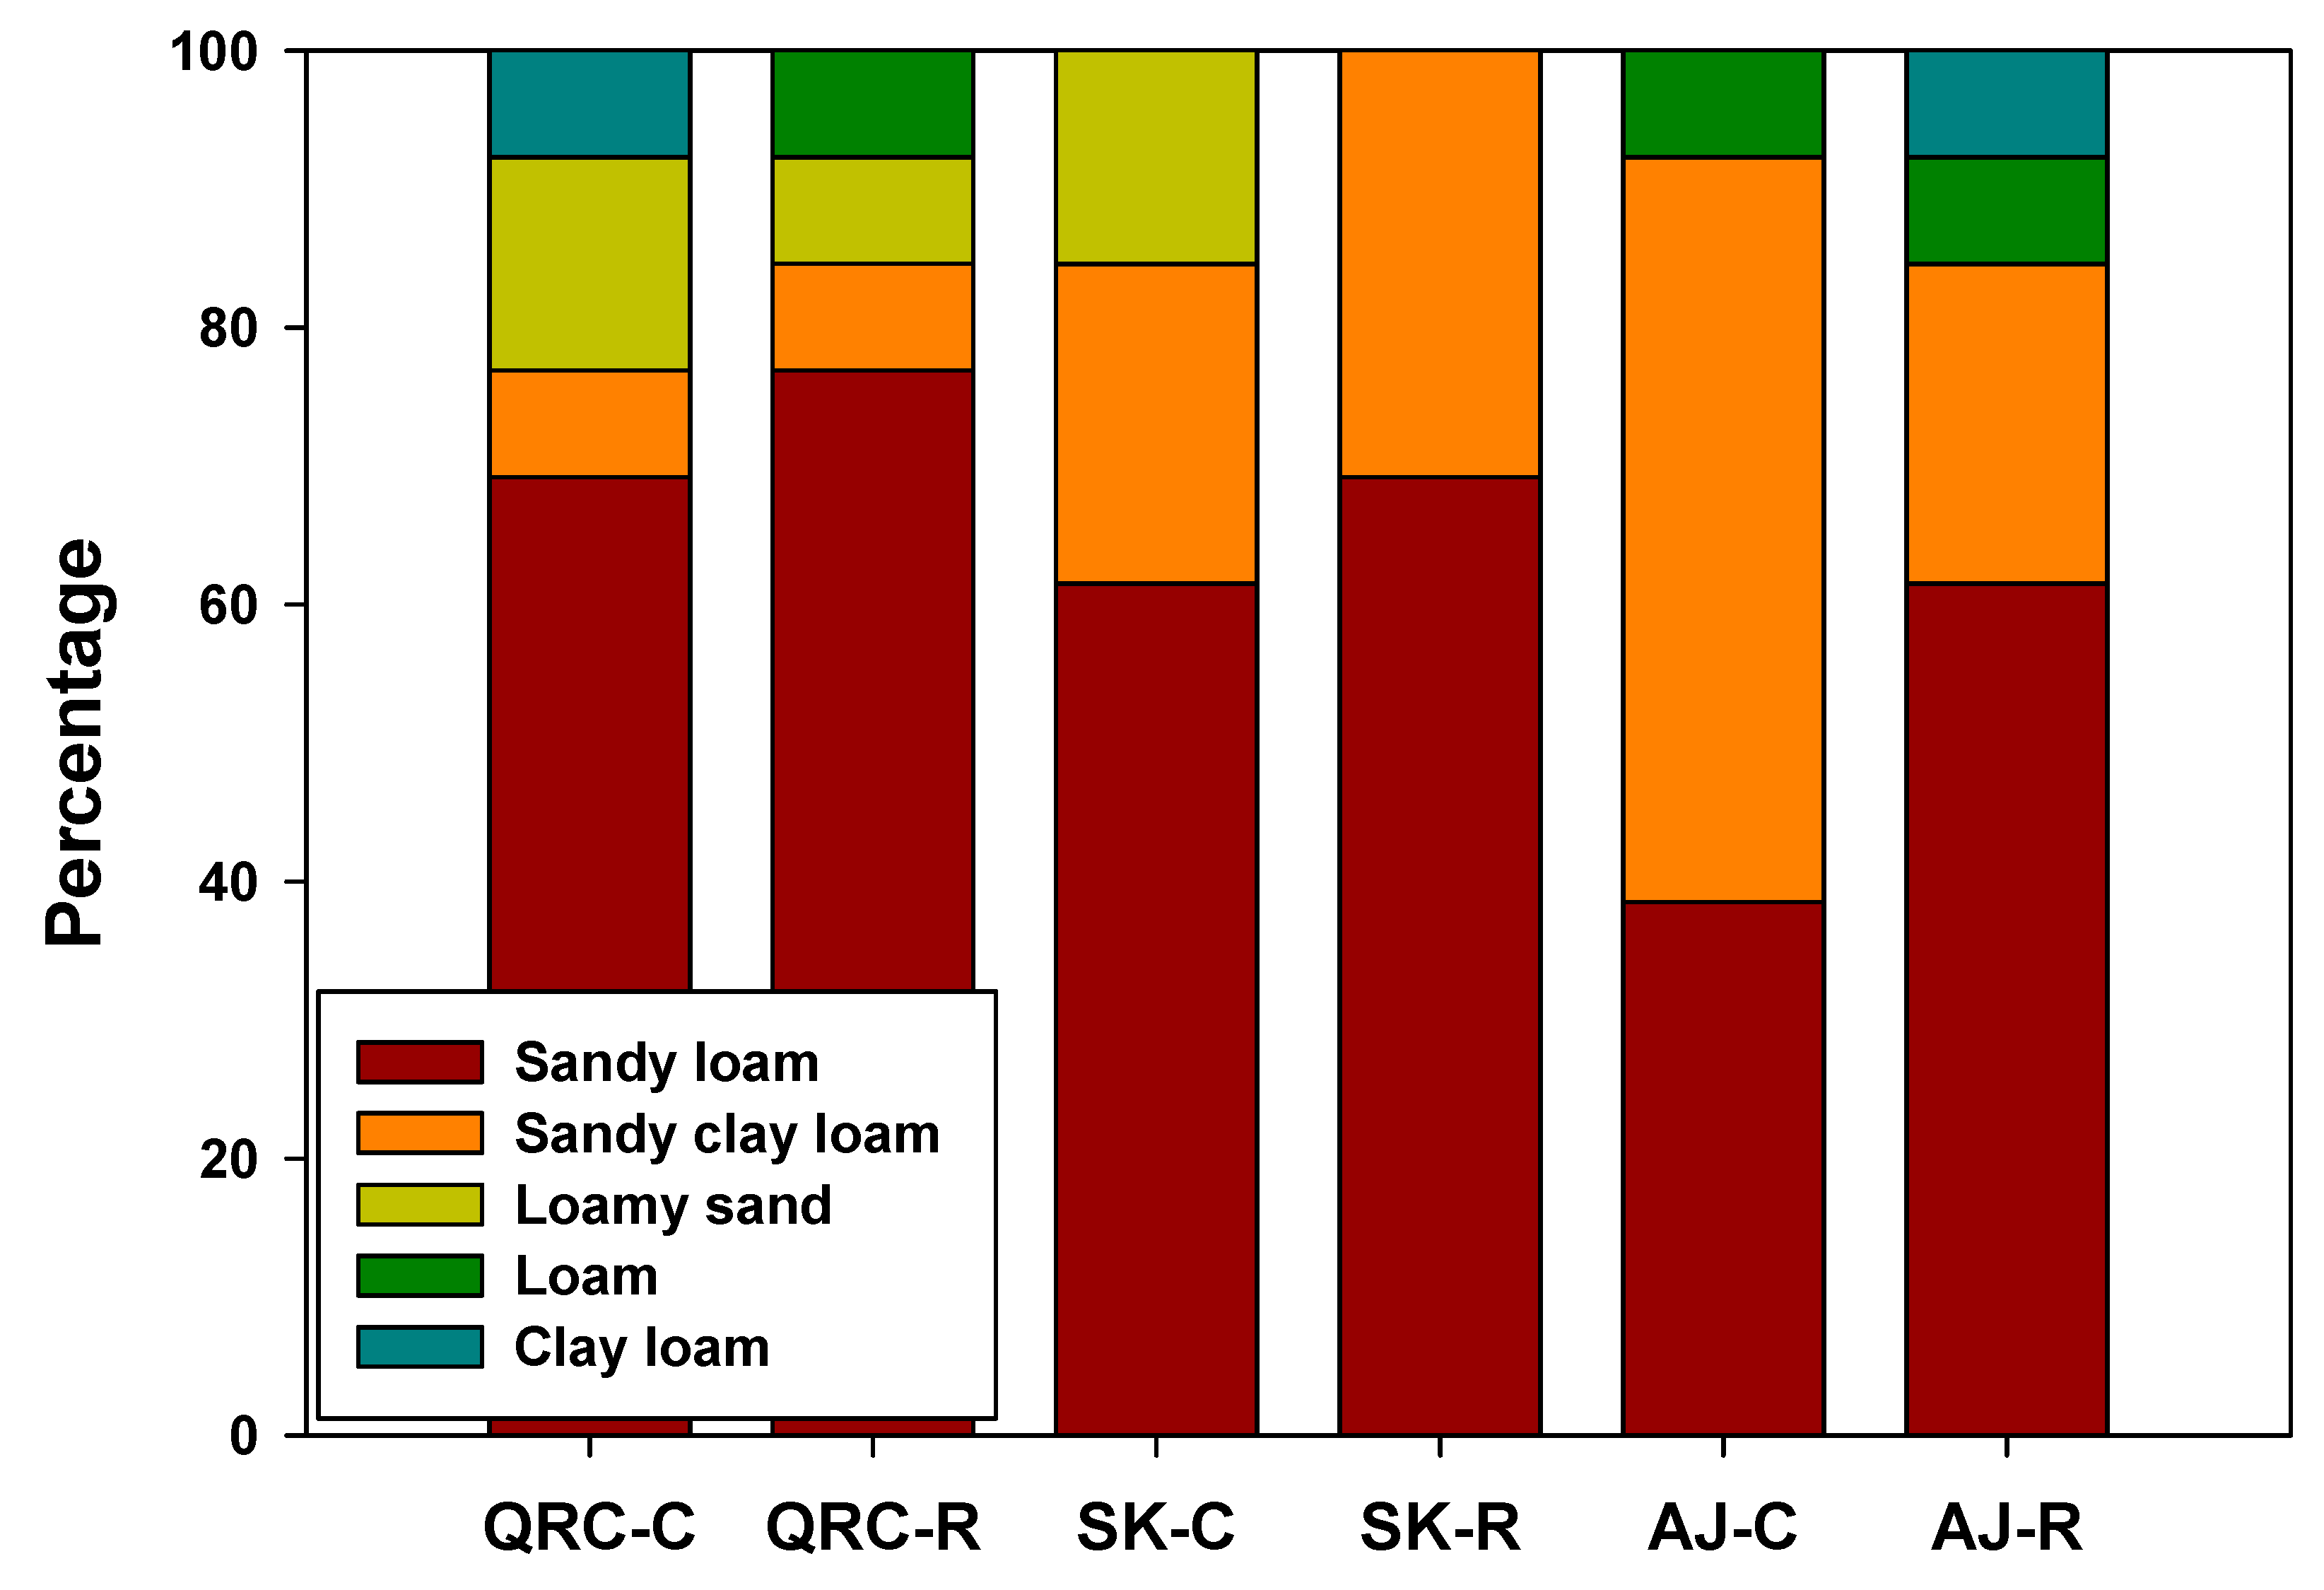
The variations in soil texture of the different soil samples collected from the control and restored areas of the studied sites are shown in
Figure 1. The results exhibited that sandy loam was the most dominant textural class in all the studied sites (~60%), followed by sandy clay loam. Overall, QRC has more samples in the sandy loam textural class, followed by SK and AJ. The loamy sand class was present in QRC-C, QRC-R, and SK-C, while absent in other collected samples.
Likewise, loam can be seen only in QRC-R, AJ-C, and AJ-R, whereas clay loam was present only in QRC-C and AJ-R. It was interesting to notice that the proportion of sandy loam soils was higher in restored areas as compared to the control areas. The restored areas of QRC showed the occurrence of loam soil, which was not present in the control areas. Likewise, clay loam soils were seen in the control of QRC, and absent in its restored areas. The control areas of SK had about 16% samples of loamy sand, which disappeared in restored areas. Similarly, clay loam soils were seen in restored areas of AJ, while these were absent in AJ-C. Therefore, variations in control and restored areas evidenced the effects of restoration efforts on the physical properties of the soils in the studied area. Owing to the significant importance of soil texture, various researchers have used it as an indicator for assessing soil quality [
20,
21]. Various agricultural practices, especially tillage and plowing, could affect the texture of soils. Likewise, natural processes, as well as irrigation, could move the clays downward and may result in their accumulation in deep soil horizons, subsequently changing the proportions of sand, silt, and clay. Therefore, soil texture is an important parameter to investigate soil type and quality [
1,
22]. The predominance of sand based texture indicated lower water holding capacity, poor soil structure, and lower nutrient retention. QRC-C and AJ-R possess relatively higher contents of clay, indicating a slightly better soil structure as compared to the rest of the soil types. Therefore, these changes in the distribution of silt, clay, and sand fractions, along with changing the land-use type and locality, indicated the difference in erosion and sedimentation rates.
3.1.2. Soil pH and EC
Soil pH plays a critical role in the dissolution and availability of nutrients as well as for proper microbial activities in soil. Similarly, soil EC is an important factor for plant nutrient availability and optimum crop growth. Therefore, soil pH and EC are considered important indicators to assess the extent of soil quality. The descriptive statistical analyses for pH and EC of the collected soil samples are shown in
Table 2. It can be seen that all the soils were slightly alkaline, with a mean pH range of 7.74 to 8.15. Overall, the mean pH values of AJ were higher (8.07–8.15), followed by SK (7.81–8.01) and QRC (7.74–7.99). Results showed that means increased from 8.07 in the control to 8.15 in restored areas and 7.74 in the control to 7.99 in restored areas in AJ and QRC, respectively, whereas, it decreased from 8.01 in the control to 7.81 in restored areas in SK. The increment in soil pH due to restoration processes could be due to the release of saline products by the plant’s branches and leaves, as more plants were grown during restoration [
23]. Additionally, the recycling of some organic components during the restoration process might have enhanced the soil pH. Contrarily, the pH of restored areas located in SK sites decreased to 7.81 from 8.01 in the control. This decrease in pH could be caused by the addition and mineralization of organic compounds due to restoration activities [
24]. This reduction in pH in SK areas after restoration could help in enhancing vegetation growth, which, in turn, could increase floral resources for honeybees. Furthermore, the decrease in pH could be owing to the uptake of exchangeable cations by plant or microorganisms in soil. The degree of variability, as indicated by CV values, was in the range of 1.99 to 3.75. All the pH data was well skewed with lower kurtosis (−1.438–−0.041), indicating a normal distribution. The differences in pH values were statistically significant, except for QRC-R and SK-C which were nonsignificantly different. The pH for AJ-R was significantly higher (8.15) as compared to all the other samples. Similarly, significant differences were also seen in EC results, where AJ-C showed the highest value (0.45 dS m
−1).
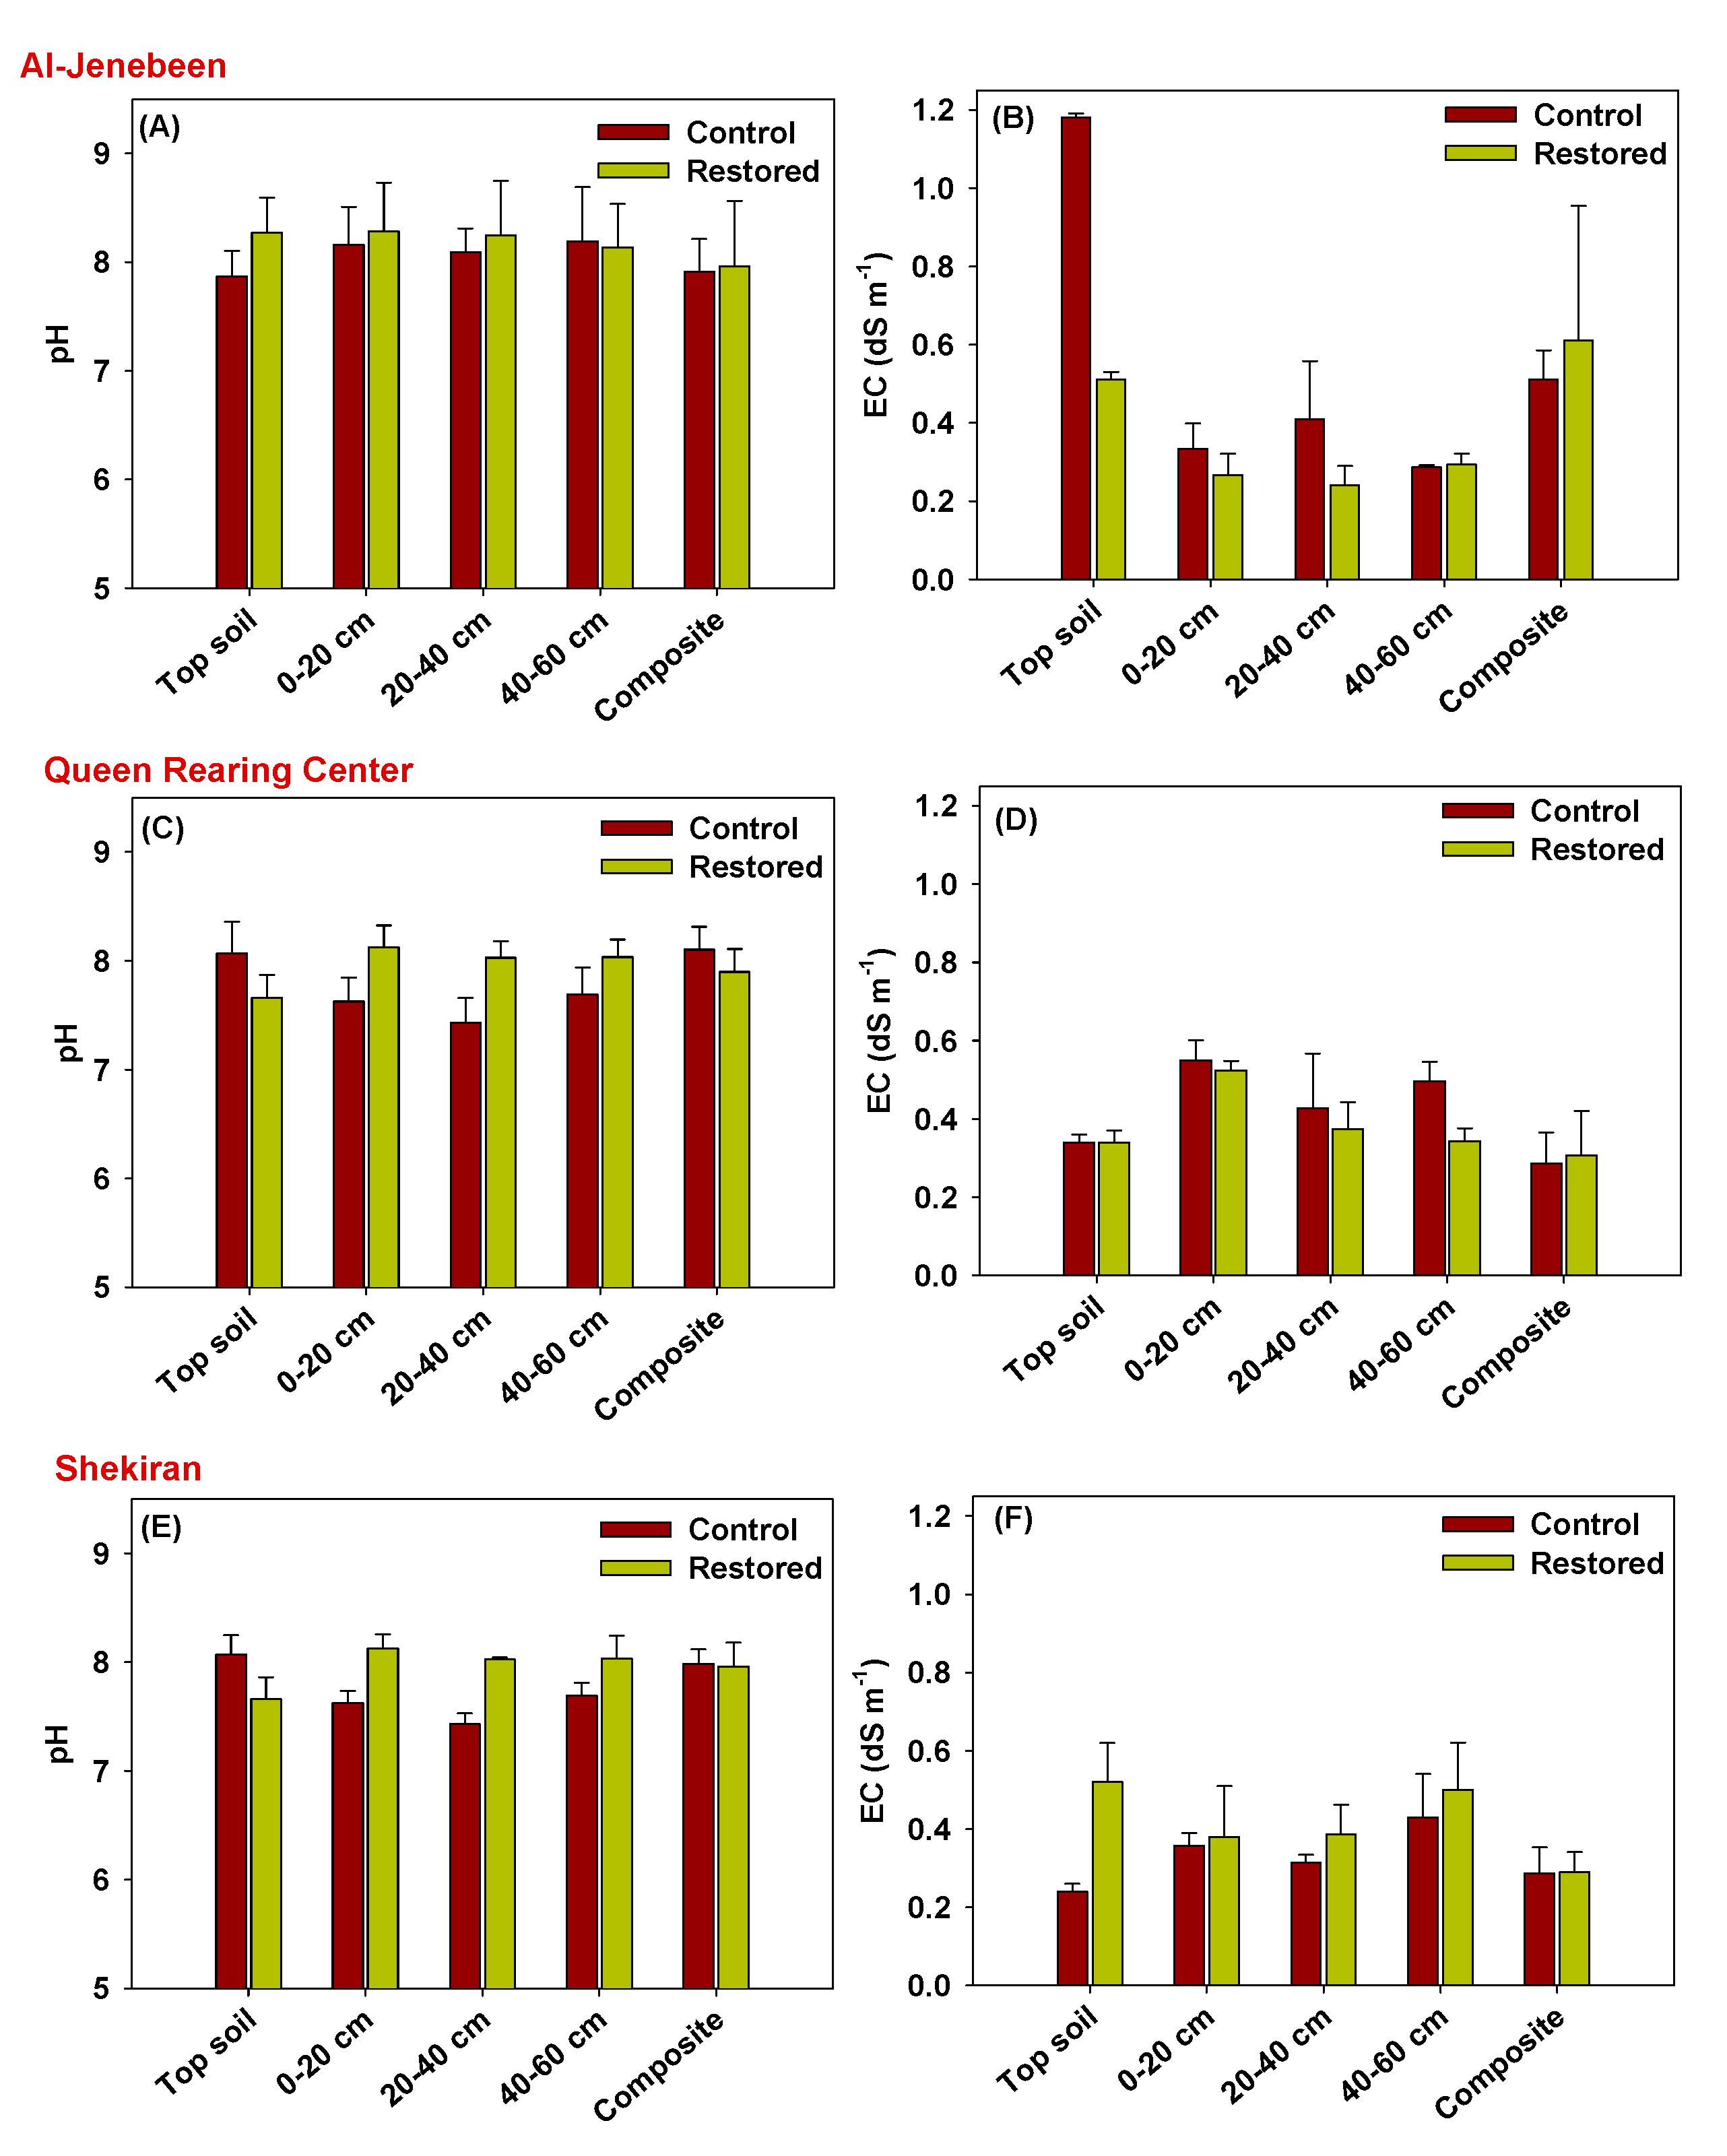
The influence of soil depth on variations in soil pH can be seen in
Figure 2A,C,E. Overall, the mean pH values of restored areas were higher than that of the controls for all three sites. However, this was the opposite in the topsoil of QRC and SK, where restored areas had lower pH values than the control areas. The trend for distribution of the soil pH with depth was not uniform. For instance, the mean pH values increased with increasing the depth in AJ-C, while it decreased with depth in QRC-C and SK-C. Meanwhile, this was exactly the opposite in restored areas, where mean pH values decreased with depth in AJ-R, and increased in QRC-R and SK-R. Similar contrasting results were also reported by different researchers. For example, a decrease in soil pH with an increase in soil depth was previously reported by Shukla et al. [
25], whereas Zhang et al. [
26] reported an increase in soil pH with an increase in the depth, suggesting that this could be due to the addition of organic amendments in the soil. Overall, the results indicated that the effects of soil depth on variations in soil pH were not significant.
Table 2 showed that the mean EC values for all the soil samples were in the range of 0.34 to 0.45 dS m
−1, suggesting that EC for all the soil samples was below salinity limits, i.e., 4 dS m
−1 [
27]. Overall, the samples collected from AJ sites had higher EC values, followed by QRC, and SK. The results exhibited that the EC of the AJ and QRC sites reduced after restoration activities, from 0.45 to 0.36 dS m
−1 and 0.43 to 0.38 dS m
−1, respectively, whereas, it increased in the case of SK, from 0.34 to 0.40 dS m
−1. The increase in soil EC could be the result of adding organic matter during restoration activities, while the reduction in EC clearly indicated the significant role of plantation on soil quality [
28]. The values of the skewness and kurtosis showed that the distribution was not normal.
Figure 2B,D,F shows variations in mean EC with soil depth. The EC values reduced with an increase in soil depth in AJ-C, while increasing with an increase in soil depth in QRC-C and SK-C. This trend was opposite in restored areas, where EC increased with soil depth in the case of AJ-R, and decreased with depth in QRC-R and SK-R. Bezborodov et al. [
29] stated that EC increases with soil depth due to the presence of salts. Therefore, the distribution and extent of soil pH and EC can effectively be used as indicators for assessing soil degradation and restoration.
3.1.3. Soil Organic Matter, Soil Organic Carbon, and CaCO3
Soil organic matter (SOM) significantly influences the chemical, physical, and biological characteristics of soils [
30]. It has been well documented that the depletion of SOM as a result of extensive agricultural practices has subsequently resulted in soil degradation [
31,
32]. Therefore, SOM is considered as one of the most promising and sensitive factors in assessing soil quality and the extent of its degradation. The descriptive statistical analyses for SOM for the samples collected from selected localities are shown in
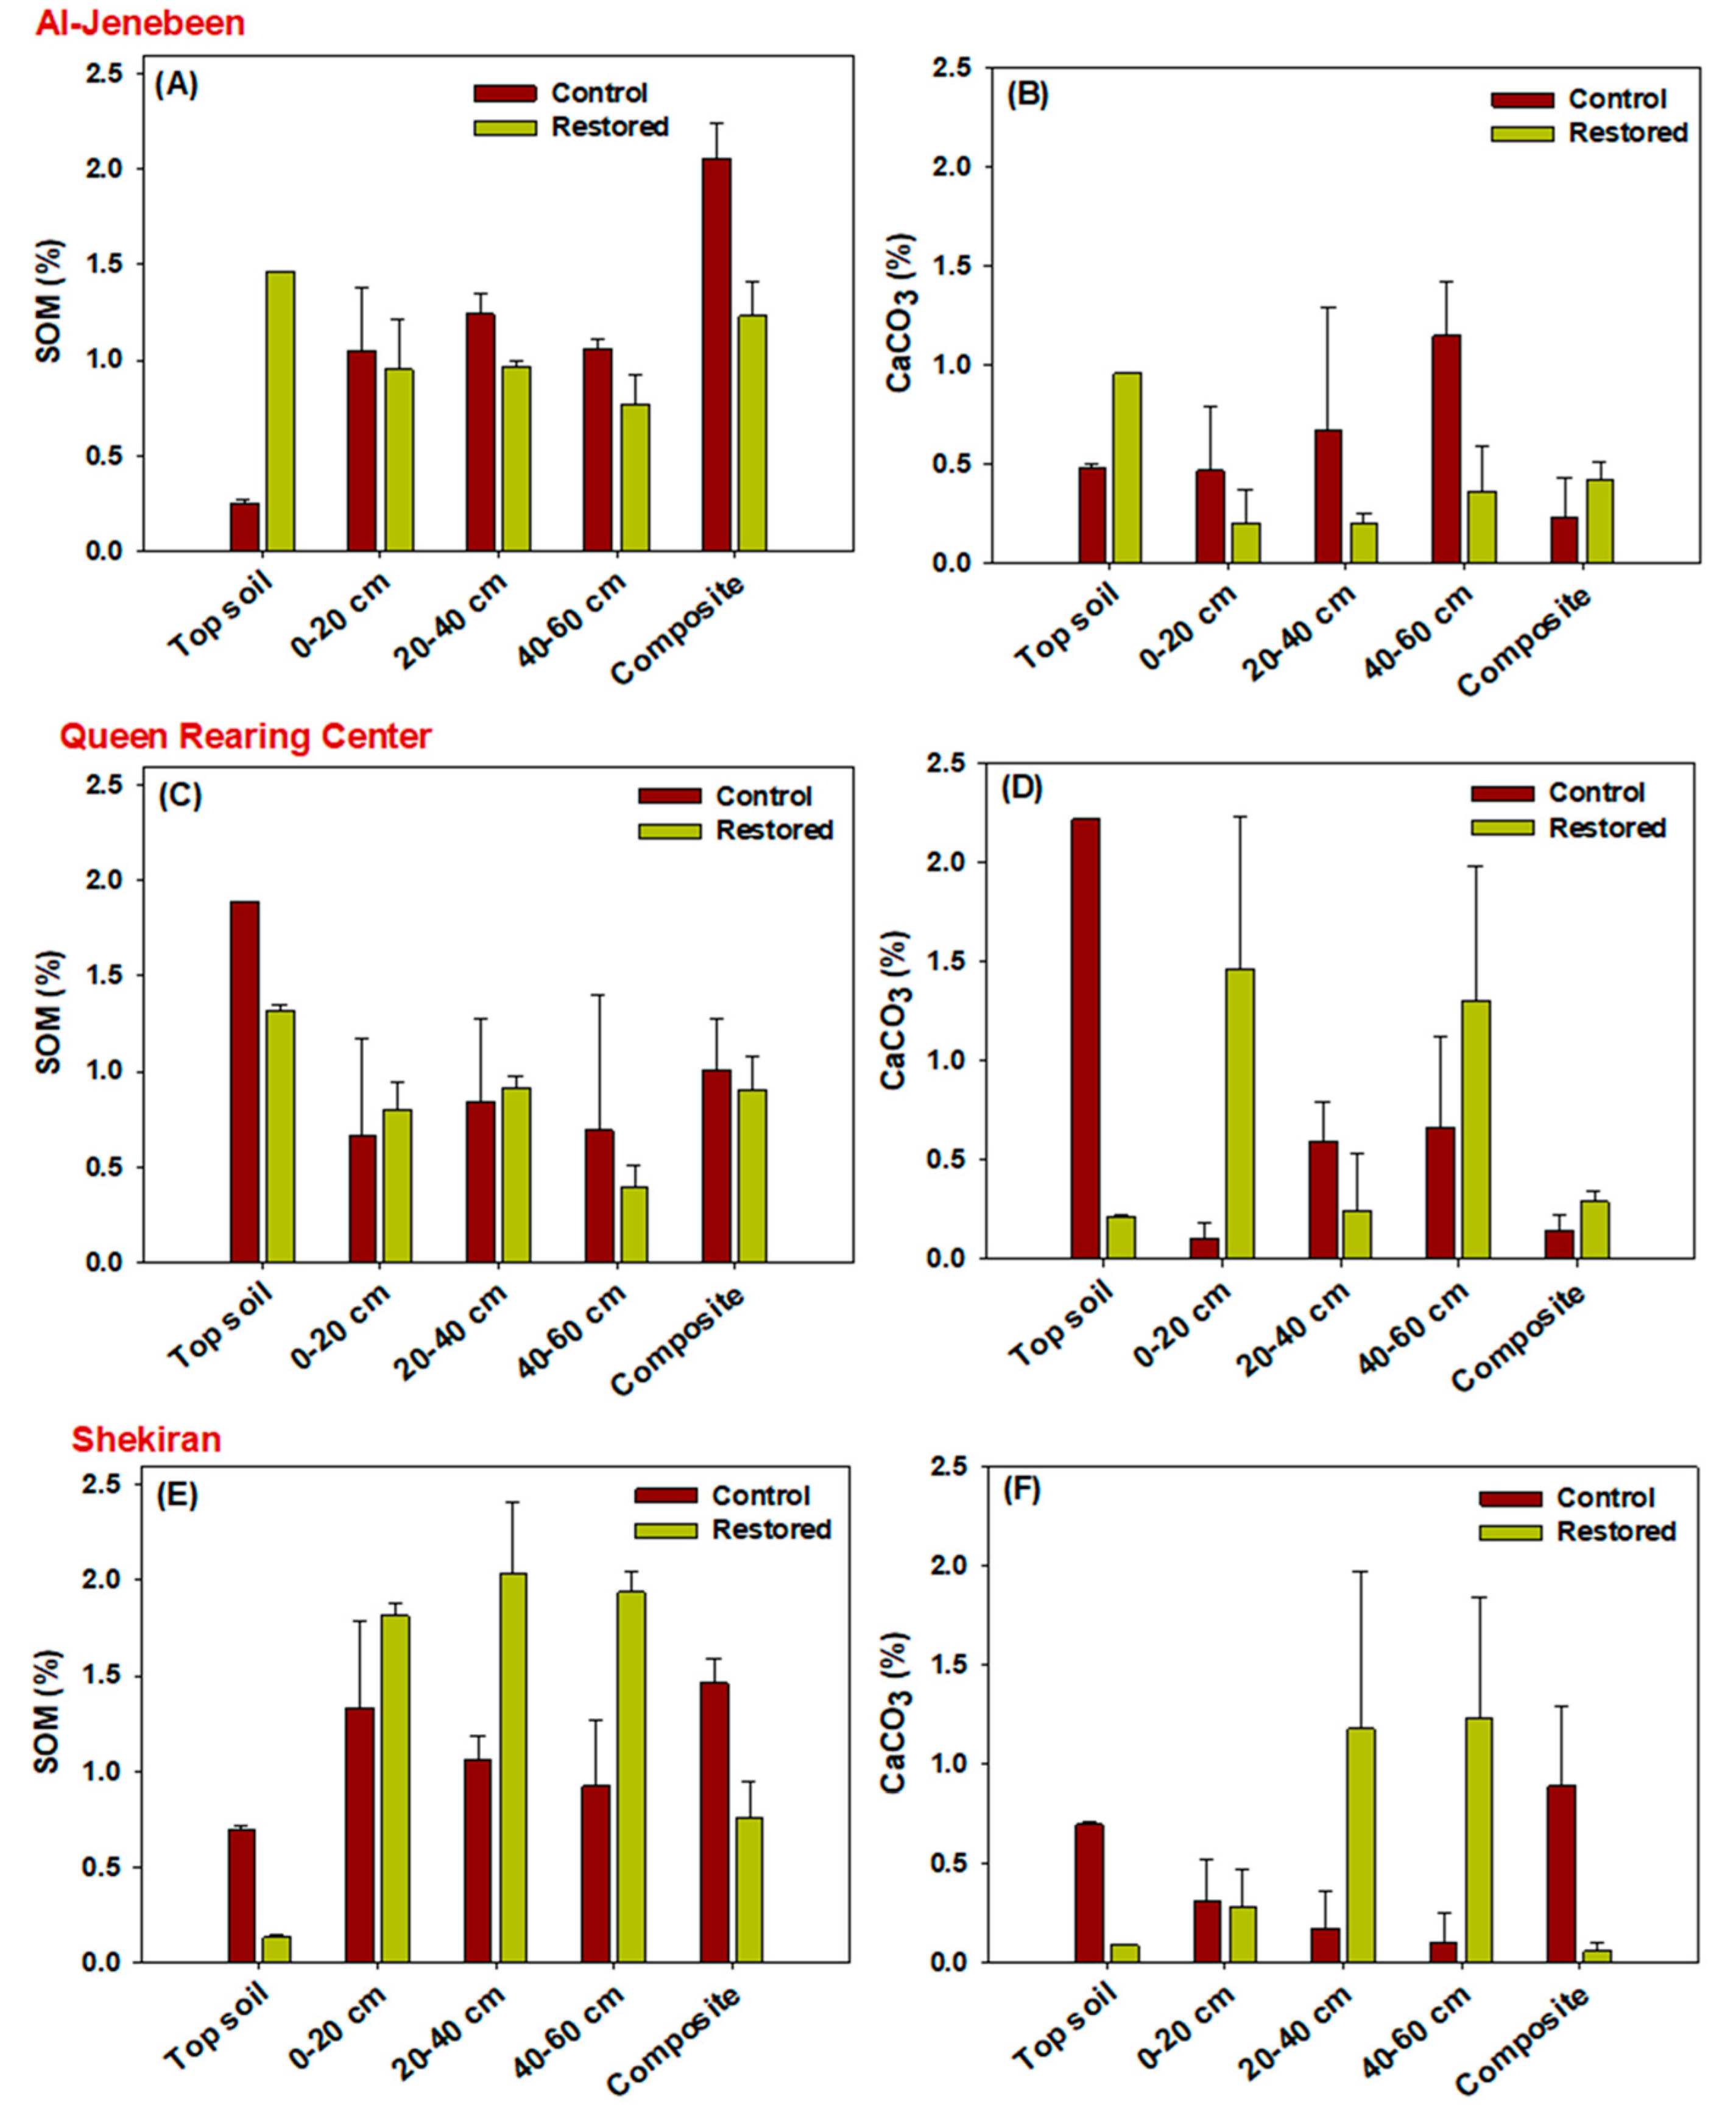
Table 3. Overall, the mean values of the contents of SOM were lower than 1.5% in all the locations. The samples collected from SK sites possessed higher SOM (0.13–2.56%), as compared to AJ (0.25–2.19%), and QRC (0.13–1.89%). It was noticed that the restoration practices resulted in reduced SOM in AJ (1.27% in AJ-C to 1.02% in AJ-R) and QRC (0.88% in QRC-C to 0.80% in QRC-R), while it increased with restoration practices in SK (1.16% in SK-C to 1.40% in SK-R). This data showed a higher variability, as shown with larger CV values (27.24–68.40). The skewness of the data was in the range of −0.316 to 0.244, while kurtosis was −1.326 to −0.304, indicating normality in the distribution of the data. Further, the changes in the contents of SOM with soil depth are shown in
Figure 3A,C,E. The variations in SOM contents with soil depth were inconsistent. For instance, the mean SOM contents increased with an increase in soil depth in AJ-C and SK-R, while reducing with soil depth in the rest of the studied soil profiles. Interestingly, the topsoil of SK (both restored and the control) and AJ-C showed relatively lower SOM contents.
The variations in SOM of the collected soil samples suggested that restoration activities had positive impacts on soil rehabilitation in SK sites, as indicated by increased SOM contents. Contrarily, the SOM contents of AJ and QRC sites reduced as a result of restoration activities. The loss of SOM during restoration activities could be due to higher sand fractions. Generally, the SOM associated with clay fractions is more resistant to degradation. However, our study demonstrated that sandy loam was the most dominant textural class for all the collected samples, indicating a higher portion of sand [
33]. Kalinina et al. [
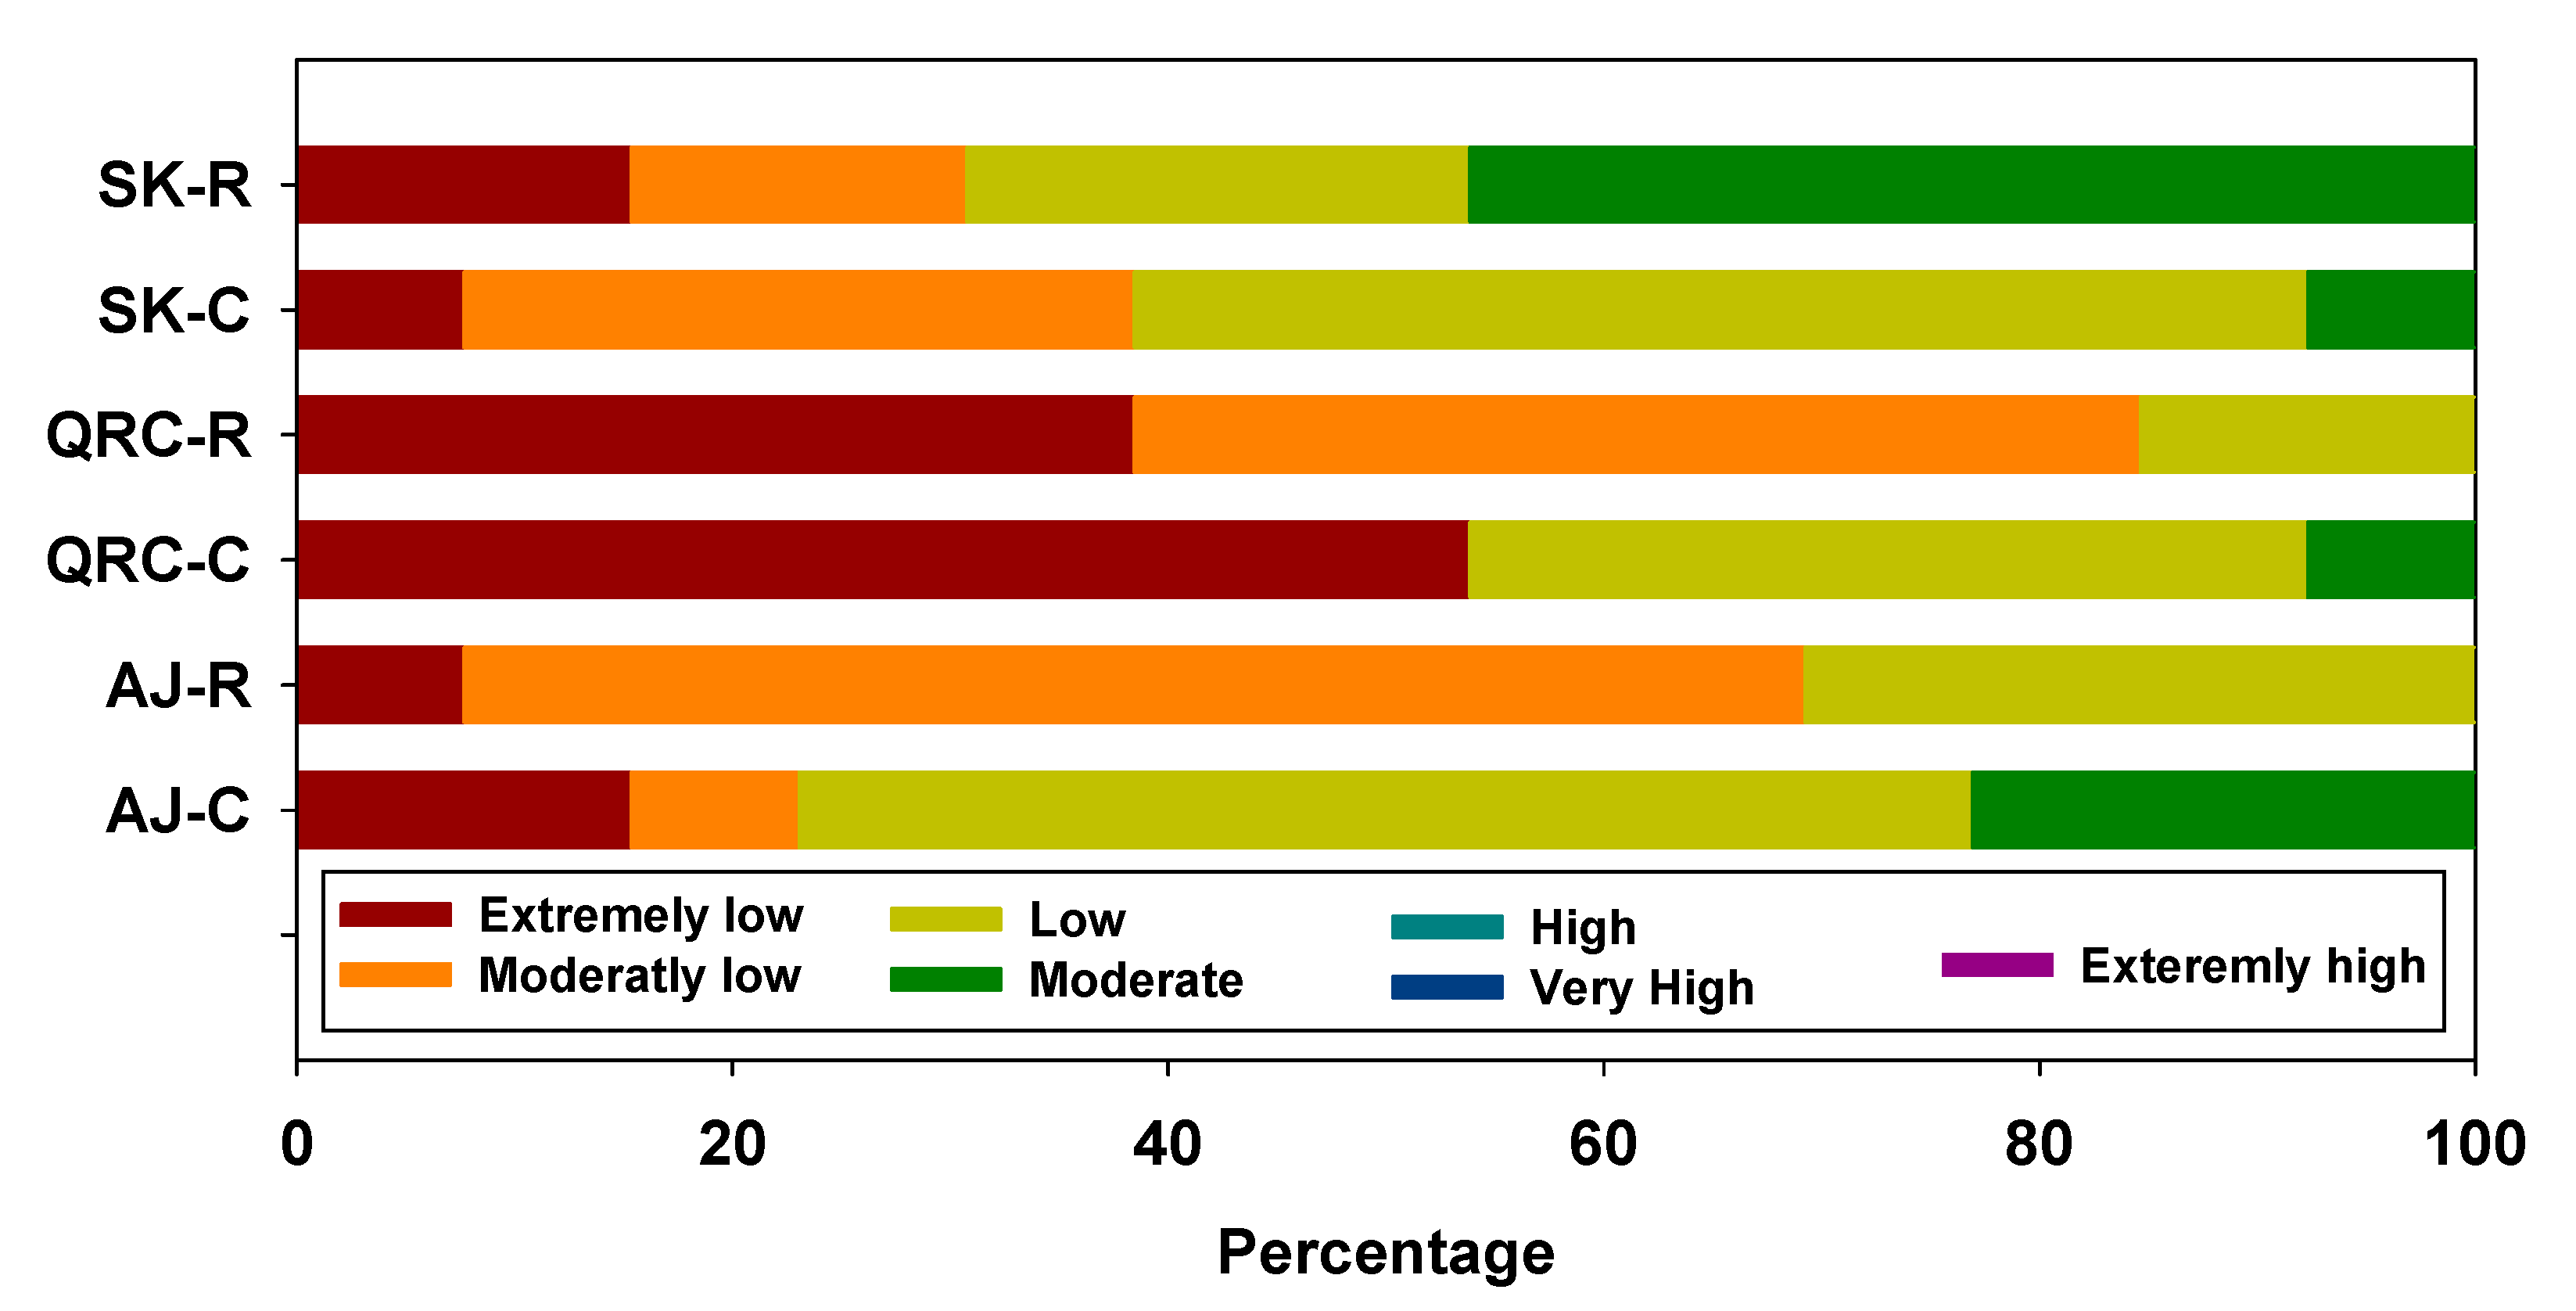
34] suggested that the loss of SOM could also be due to higher humus rich arable soils, texture, and mowing. To further understand this, the proportions of soil organic carbon (SOC), according to the soil evaluation criteria, are presented in
Figure 4. It can be seen in the figure that none of the samples were in the ranges of high, very high and extremely high SOC contents. Most of the samples were in the extremely low to moderate SOC range. The proportion of samples with moderate SOC contents was higher after restoration in the SK area, while it was reduced to zero in both AJ and QRC after restoration. On the other hand, the samples with moderately low SOC contents increased in AJ and QRC, while reducing in SK after restoration activities. This clearly indicates the loss of SOC and SOM from the soil after restoration activities. It is well known that plants cannot absorb SOM/SOC from the soil, rather, SOC helps plants to uptake nutrients in soil by altering physical, chemical and biological conditions [
35]. However, the mineralization of SOM may release nutrients into the soil solution for the plants to uptake; hence, it is an important factor to assess soil fertility. Moreover, SOM is of significant importance for soil structure, aggregate stability, and clay dispersibility [
36]. However, the cultivation of crops may disturb larger aggregates, resulting in enhanced SOM degradation. The plantation of local plants might have resulted in the loss of organic matter contents, which can deteriorate soil health and structure. Therefore, SOM needs to be maintained for the sustainable growth and development of the planted plants, so they can be used by honeybees. A recent study demonstrated that the application of SOM enhanced the visitation of bumblebee, as compared to without SOM application [
37]. In another study, it was observed that higher SOM attracted 185 pollinators, as compared to 132 pollinators attracted by the soils with lower SOM [
38]. This could possibly be due to the release of micro- and macronutrients from SOM mineralization, which improve the quality of flowers via increasing sugar contents and flower longevity, consequently attracting the pollinators towards them.
Nevertheless, due to the fact that SOC is sensitive to various factors, such as agricultural practices, climate, minerals in the soil, topography, and microbial communities, there is a higher spatial and temporal variability in its contents. This makes it difficult to compare the SOC of different sites, despite its extreme importance for soil quality topography [
39]. Overall, SK sites have shown the better results of land restoration practices, as compared to QRC and AJ. The retention of SOC in the SK area, as compared to AJ and QRC, could be due to the difference in various factors, such as altitude, slope gradient, and pH. It has been reported that altitude has a significant effect on SOC retention in [
40]. SK was a hilly area with a relatively higher altitude, thus, the development of various microhabitats might have facilitated the growth of plant communities, subsequently accumulating the higher C contents [
41]. Additionally, the chances of aboveground biomass removal are more at lower altitudes than at higher altitudes. Thus, besides other factors, the higher altitude of SK facilitated the retention of SOC in that area after restoration activities. Therefore, loss of SOC in AJ and QRC during the restoration process in the current study reflects the poor SOC accumulation ability of the soil, and lower nutrient retention due to the sand based soil texture. Hence, complete restoration of these poor textured sites would require longer periods of time under sustainable practices.
The descriptive statistical analyses for the CaCO
3 of the collected soil samples are shown in
Table 3. The mean CaCO
3 contents were in the range of 0.35% to 0.78%, suggesting the soils were not calcareous. It was noticed that CaCO
3 content reduced from 0.62% in the control to 0.35% in restored areas in the AJ sites, whereas the CaCO
3 contents increased from 0.52% and 0.39% in the control to 0.78% and 0.57% in restored areas in the QRC and SK sites, respectively. The lower CV values showed that there was little variability in the data. Likewise, the data was normal, as indicated by the values of skewness (0.533–1.777) and kurtosis (−0.910–2.279). The variations in CaCO
3 content with soil depth, as shown in
Figure 3, demonstrated different trends. The CaCO
3 content increased with an increase in soil depth in AJ-C, while decreasing in QRC-C and SK-C. On contrary, the CaCO
3 content decreased with soil depth in AJ-R, whereas it increased in the QRC-R and SK-R areas. As CaCO
3 has a significant role in the stabilization of soil aggregates and SOC, the higher CaCO
3 contents in the QRC-R and SK-R sites showed the positive impacts of restoration activities. Our results are in agreement with those reported by Rowley et al. [
42]. However, the elevated CaCO
3 contents in soils may increase the pH, subsequently hindering plant growth.


