Abstract
The magnetic field created by technical devices is a source of information. This information could be used in contactless diagnostics and predictive maintenance or for resolving problems along with standard NDT (nondestructive testing) methods, especially if we consider large, slow-speed devices, such as electromotors, transmissions, or generators. Identification of causalities of device failure processes with near magnetic field is one of the suitable NDT methods improving sustainability of systems. The measurements presented in the article were performed with the VEMA 04 fluxgate vector magnetometer with the DC-250 Hz bandwidth and 2 nT sensitivity. Postprocessing of the results was performed in the means of standard methods of discrete Fourier Transform, spectrogram creation and Wavelet Transform. The article presents data gathered during the measurement of a pair of extraction fans with power of 140 kW each and maximum revolutions up to 740 rev/min controlled by frequency converters and a single semi-Kaplan water power plant with 400 kW peak power at 1005 rev/min maximum generator speed. The measurements were performed before and after repairs of one of the ventilators in the ventilation system at 60% and 100% of maximal output power. The rotating magnetic fields of the fan electromotor stator, fan rotor revolutions, rotor slip frequency and ball-bearing frequencies were identified in frequency spectrums in the distance of 700 mm from fan electromotor axis in both cases. During the measurements on the semi-Kaplan turbine, the changes in states of mechanical and electrical components of the machine were monitored in the magnetic fields with increase of the power in the range of 0–95%, before and after phasing to the electrical grid. Standard processing methods, Discrete Fourier Transform, spectrograms and Discrete Wavelet Transform were used. In the spectrograms of the measured magnetic fields, the 1st–4th harmonics of the turbine shaft, generator shaft and also their side frequencies were identified. Significant changes of magnetic fields in time were identified in the area of 60–95% power. With the help of the Wavelet, transform intervals were identified where it is desirable to operate the turbine. The analyses of magnetic fields measurements performed on the power plant were compared with vibro-diagnostic principles.
Keywords:
magnetism; vector magnetometer; measurements; signal analysis; FFT; spectrogram; DWT; nondestructive testing 1. Introduction
The term NDT (nondestructive testing) designates a group of diagnostic methods, often contactless nowadays and thus utilizing different physical fields and their influencing with the tested objects. The NDT methods are used in a broad area of applications, from the construction engineering [1] up to the aerospace area [2,3]; however, the limiting factors are the knowledge and technical equipment. The use of the methods also depends on the development of materials, sensors, sensing principles, visualization and interpretation of the measured quantities and values [4,5,6].
Specific area of the NDT is formed around the approaches utilizing low frequency magnetic fields, properties, effects and ongoing dynamic processes. It can be stated that each object “transmits” signals carrying information about its state not only on its surface, but also about the internal structural changes. The NDT methods based on the magnetic field sensing allow us to identify this information. In general, the magnetic field can be viewed as an intermediary that is not doing work but converting one type of energy to another type. Movement of objects in the Earth’s magnetic field creates local anomalies and gradient fields that can be identified [7,8,9]. Local magnetic fields are also created around the objects working with electrical energy due to the flow of electric currents and magnetic circuitries. All the mentioned fields and their variations can be measured and evaluated providing information that can be used from the sustainability point of view, e.g., overload, indication of wearing, critical states.
In the past, the magnetic field was widely used for identification of elastic-strength properties of metallic and also composite materials containing metals. The findings included knowledge that mechanical stress and magnetization of the material are different in Earth’s magnetic field and in a strong field created by a stimulation coil [10,11]. The hysteresis loop of mechanical stress caused by magnetization is repeatable after 10 to 15 loading cycles, what was many times proven in the studies performed after the Second World War [12,13,14,15,16]. Magnetization with high mechanical stress reveals the influence of internal friction [17], changes in the dislocations’ density, microstructure and chemical composition of the material.
Figure 1 [18] illustrates the dependencies between magnetic and mechanical effects referring to the magnetostriction effects. In technical diagnostics, it is possible to utilize several magnetic effects to identify the state of a device or a process.
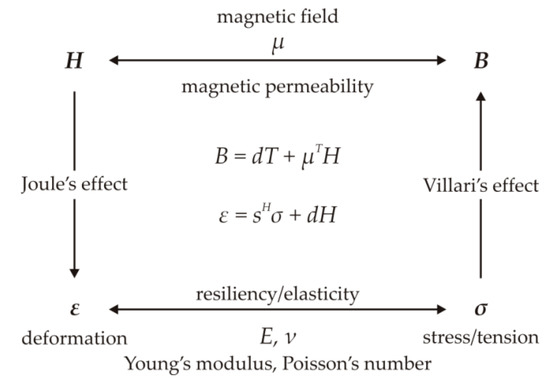
Figure 1.
Dependencies between magnetic and mechanical effects in the range of small deformations [18].
Widely used effects in NDT are Joule effect, Villari effect, Wiedemann effect, Matteucci effect, Barret effect and Nagaoka-Honda effect [19,20,21,22,23]. The Barkhausen effect [24,25,26,27] is also used besides the mentioned effects. Each of these effects is specific and with concrete application and manifestation and can be used in the NDT. Besides this group, there also exist NDT methods based on the principles of the magnetic memory of the material (MMM) [28], which in comparison to other effects allow us to determine the probable remaining service lifetime of a metal material, an important factor for predictive maintenance and thus sustainability of the system. They emerged in 1994 in the area of energetics, and they are one of the few magnetic methods covered by ISO (International Organization for Standardization) standards.
People have been intensively seeking ways to convert energy and store it effectively for many years now. The physical laws define possibilities not only in the energy forms conversion, but also the forms of the changes. The idea of restrictions in the interchanges of energy and its storing was accepted, and it created the base of applications in diagnostics including NDT. There are several facts that are usable in sensing and evaluating information in the magnetic field.
The first fact is that physical laws define the options and methods of the measurement based on the conversion of energy in the object, e.g., the relationship between mechanical energy and magnetic field. The second fact is that these changes in the physical fields differ in their speed. Therefore, if fast changes have to be identified, the speed and vector of the change have to be taken into account. The third fact is that we have to consider the density of the emitted field to an area unit or volume unit with necessary information for further processing. This allows creating tools for analysis, interpretation and visualization of the information contained in the field in the process of information identification. The fourth fact is that the energy conversion law allows performing indirect measurements. Many times, it is not possible to prove causality by using direct tools and it has to be proven indirectly. Frequency, as one of the main parameters of any type of energy field, represents the parameter allowing observation of energy conversion in the physical fields. The object does not only create/influence the magnetic field, but, for example, bad involute of the gearing also produces heat, noise and changes in the magnetic field.
The physical fields, including the magnetic field, carry the information about the state of an object and changes in it [29]. Manifested energy in the form of magnetic field represents the material and operational properties of the object. If there are emerging irreversible phenomena, they can be identified in the field. The understanding of the information in the field and its interpretation is important in the technical practice including the diagnostics [30,31].
The energy is represented by its frequency in the corresponding frequency band. If these magnetic field frequencies can be identified, measured, quantified, visualized, and presented for the purpose of the technical practice, they can be used to diagnose changes, including failures of complex devices. However, the interpretation [32] has to use existing and understandable tools in the area of technical diagnostics.
The NDT methods using MMM effects spread also into the remaining lifetime identification area, involving materials, lifting machines, pipelines, bearing structures and many similar objects. Utilizing the Villari effect, applications mainly in energetics that are based on the systematic measurement and evaluation of minor magnetization loops have been found [33]. With respect to the magnetometry utilization for simpler planar and spatial geometric objects [34], 1D and 2D geometry [35] is mostly used—the signal is sensed on the surface of the material and it is not emitted to the surroundings. The miniaturization of the sensors in the form of MEMS (micro electromechanical systems) [36] allows embedding them into the construction for online monitoring of the analyzed elastic properties of components.
In the area of mobile devices diagnostics (e.g., trains, cars), the wheels and rails were monitored [33] due to the increased safety requirements, up to the 70 km per hour speed.
The magnetic fields have been already used in diagnostics in connection with eminent sources of the fields, such as electrical energy converters and transformers, as well as furnaces with induction heating [37]. These measurements were performed for the purpose of the occupational hygiene [38,39,40] or compatibility issues [41,42,43,44]; they were mostly realized on static devices or near electric motors in case of mobile systems.
In the area of devices with the rotational components, the comparison of piezoelectric sensors and magnetic fields created by the objects has not been the subject of research. However, the possibility exists and was verified on the rotating machines [31]. The measurements of electrical parameters and mechanical oscillations were evaluated separately. In the area of cyclic oscillations of machines, the piezoelectric effect is often used to measure vibrations; however, a problem arises if the sensors have to be submersed into water or enclosed in the technological equipment permanently. The advantage of the low frequency magnetic field is that it can penetrate through different environments without the necessity of contact and thus provide contactless information. Therefore, the advantages of energetic principles in the means/patterns of the energy conversion for mechanical components of machines (oscillations/magnetic field) and for components with the electric current (electric/magnetic field) can be used. Secondary, it is possible to observe additional information in the magnetic field.
The range and applications of diagnostics, where magnetic effects are used today, are mostly in the area of energetics, where there are strong fields near the object of measurement. Some of the experiments show that there are possibilities to follow the energy flow with the help of acoustic noise [45,46], heat and mechanical oscillations [47,48,49,50]. The subjects of measurements are often stationary devices without rotating parts. Because the failure of pipelines carrying different mediums at high pressures and large flows produce significant financial losses, several mentioned physical effects can be used, whereas the MMM method is the most widely utilized. A special area is the aerospace industry, where the magnetic methods can be used in online diagnostics of the turbines of jet engines [51,52,53,54,55]. The approaches are based on the combination of the acoustic and magnetic methods and have been developed and used since the 1980s. The architecture in the meaning of construction often utilizes the Barkhausen’s effect in NDT, mainly for state checking of steel ropes and rods (can be viewed as 1D geometry); planar elements (can be viewed as 2D geometry) are monitored only for the purpose of elastic-strength properties and potential spreading of cracks [56].
Simulations and interpretations of dynamic effects (processes) included in the magnetic fields remain in the level of models [57], and there are missing measurements performed on real industrial systems in-site; the values of the magnetic fields are interpreted only as values, not as the causality–degradation processes. The utilization of analytic tools in the form of trends in spectral analysis with using bispectra [58,59] refers to the possibilities of visualization of the measured signals. However, the bispectra were modeled and not measured—the descriptions are in the theoretical level and are missing real measurements. The description of dynamic processes requires knowledge about the boundary conditions, and in case of the in-site measurements on real devices, it is necessary to interpret the causality. Therefore, the approach to analyses presented in this paper represents a different, unique approach.
Identification of failures and changes in states of machines with movable parts (rotation, translation and cycles) can be identified not only by the acoustic noise and heat, but also with magnetic properties and their change in time.
From the evaluation and interpretation view of the measured signals are widely accepted significant tools such as marching (discrete) Fourier (DFT) and Wavelet (WT) transforms [60,61]. These tools are used to solve tasks connected to sounds and pictures, but also in the area of identification of energetic fields’ special parameters. Their use is significant also in the area of mechanical systems’ oscillations because with simple DFT, some parameters of the fields, e.g., pulsation characteristics, are lost.
2. Materials and Methods
This section shortly describes the measurement device, the VEMA magnetometer, objects of measurements, the ventilation system (considered as an appliance) and the small water power plant system (considered as a source). The methodical approach using the frequency analyses is also introduced.
2.1. Measurement Device
Two VEMA magnetometers were used during the measurements. The VEMA-04 magnetometers are relax-type fluxgate vector magnetometers [62,63]. The devices were used in three-channel configurations providing orthogonal decompositions of local magnetic field vectors into their components. The sensors can be moved and placed freely and independently; therefore, nonmagnetic fixtures were used for the sensor arrangements.
The block diagram of the VEMA-04 magnetometer device that was developed at the Department of Aviation Technical Studies of the Faculty of Aeronautics is shown in Figure 2. The device utilizes the magnetic flux gating occurring due to the magnetization characteristics of the sensor’s core and operates with conversion of magnetic field measurement into measurement of the transient effects’ duration/measurement of time. Measured time intervals signals occur as the responses to periodical pulses generated by the three-state bipolar current source. The excitation is performed in all channels at the same time, the system is synchronous, and during the excitation no measurement is performed. The measured time intervals are given by the transition/relaxation signals from the states of positive or negative technical saturations to the values of the external, measured field after the excitation pulses. By the periodical saturation provided by the excitation pulses, stable initial conditions of the transition effects are provided.
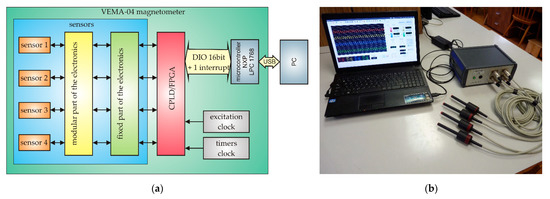
Figure 2.
VEMA magnetometer: (a) Block diagram; (b) Photography of VEMA 04 magnetometer with probes.
These signals are parametrized by the load in the form of antiparallel semiconductor diodes and their difference represents the value of the magnetic field:
where t+ and t− time intervals are relaxation times from corresponding saturations, k and q calibration constants are evaluated for each channel with the calibration process using the neural network [64]. Due to small differences among the sensors, each channel has its own constants in the memory of the microcontroller unit that provides also communication interface to the PC connected to the magnetometer. Illustration of the transfer and frequency characteristics are shown in Figure 3. The sensitivity of the VEMA-04 magnetometers used in measurements is approximately 1.7 nT/LSB (least significant bit), full-scale nonlinearity is below 0.5% in the measurement range of ±60 μT, the channels are sampled simultaneously with the rate of 1000 samples per second. The noise spectral densities of the used magnetometers were identified experimentally with long term measurements and also with method presented in [65] and are approximately 280 pT/√Hz@1 Hz and 230 pT//√Hz@10 Hz for all channels.
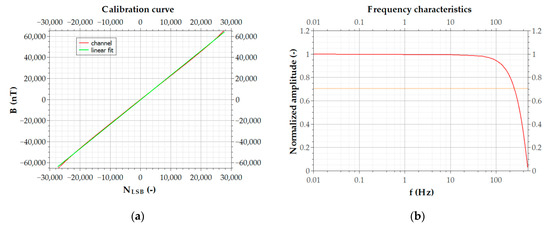
Figure 3.
Illustration of characteristics for one channel of the VEMA magnetometer: (a) sensitivity; (b) frequency characteristics.
The VEMA relax type magnetometers can have their sensors connected with over 10 m long connection cables with acceptable noise parameters, which is an advantage when the device is used in different types of measurements.
2.2. Objects of Measurement
For the experiments, two in-site slow speed electromechanical systems were chosen. The first system was the ventilation system with two ducts and identical fans (Figure 4a). The VEMA sensors were placed in orthogonal arrangements at the same place on each ventilation duct during the experiments. Each propeller with 7 nonmagnetic blades was attached to a steel shaft with the weight of 1000 kg placed in two bearings with 14 and 8 elements. The asynchronous electromotors of the fans were driven by an electrical speed controller in the range of 0–740 revolutions per minute in the frequency range of 5–50 Hz. Maximal current driving the device was 180 A.
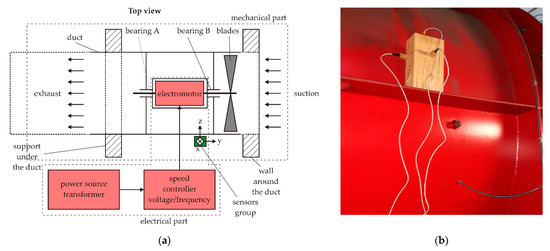
Figure 4.
The ventilation system: (a) ventilation duct diagram; (b) VEMA sensors placement.
The nonmagnetic fixture with 3 sensors was placed on a rib on the duct; the distance from the ventilation system fan was 740 mm (Figure 4b). The construction material of the duct was class 11 steel, the steel plate was 10 mm thick. The stator winding of the ventilation electromotor was at the distance 540 mm from the measurement point.
The second object of measurement was the turbine, transmission and generator system of a small water power plant (Figure 5a). The generator was asynchronous; it used the principles of induction motors to produce electric power by mechanically turning its rotor faster than the synchronous speed. The turbine was of semi-Kaplan type, so only the stator blades could be adjusted in the regulation system. The generator was placed in 90 degrees angle with reference to the turbine shaft. This type of system is common in small water power plants because of its space-saving design, simplicity, no need for special phasing procedure and cheap maintenance. The power plant had two such generators; however, due to the water level, only one generator was running during experiments.
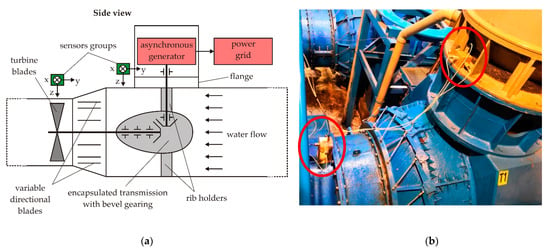
Figure 5.
The power plant system: (a) power generation system diagram; (b) VEMA sensors placement.
The VEMA sensors (Figure 5b) were placed in the axial plane near the turbine and near the transmission with the generator. The first group of the sensors over the turbine was placed at the distance 600 mm from the turbine axis. The second group of sensors was placed at 450 mm distance from the generator axis and 1150 mm from the transmission gearing.
The nominal value of the turbine’s shaft (horizontal shaft) speed is, according to the technical documentation of the system, 309 revolutions per minute corresponding to the frequency of 5.14 Hz; the nominal value of the generator shaft (vertical shaft) is 1003 rpm corresponding to the frequency of 16.72 Hz. The transmission gear ratio is 12/39 giving the tooth frequency of 200.6 Hz.
2.3. Methods
The methods used in evaluation of the recorded magnetic field data used windowing because the measurements were performed with dynamic changes/processes in the systems. We used the Hanning window with 50% overlap because this is a common technique used in practical technical diagnostics well known for technicians performing measurements on devices in-site.
The simplest method that we used was estimation of arithmetic mean and standard deviation for the recorded data. The statistical parameters were estimated by the following:
where Bch is the magnetic field for specified channel, n is a number of samples, i is the sample number in the sequence and σ is the standard deviation of the signal for the given channel. For each estimation, 10,000 samples were used. The visualization of the arithmetic mean will tell us if there are any trends in the data set, which can indicate the state of the measured system. The change in the arithmetic mean during the operation of the system can indicate the change of state of the system. In case of fixed (not rotating, not moving) systems, the arithmetic mean can indicate the structural changes inside the material, which leads to the change in induced magnetization. The evolution of standard deviation can uncover the changes in system itself, such as the increase in clearances and vibration amplitudes.
The spectral analysis is another core method for the diagnostics of systems containing rotating parts. Such system is usually diagnosed by the vibration analysis, which is a contact form of the measurement. The rotating parts cause disturbances of local magnetic field by their own magnetic moment or by induced magnetic moments. These disturbances transfer the information about the movement, either rotational or linear. Any periodical signal can be described as
where xn is the n-th value of the digital signal, Xk is the Fourier coefficient, k is the sequence number of harmonic component of the signal and N is the total number of samples. For decomposition of the signal, we can estimate the Xk coefficient as
The amplitude of Xk and the phase φk of any specific harmonic component defined by k cycles per N samples can be estimated from these coefficients as
Frequency analysis is the powerful tool for nondestructive diagnostics of dynamic systems. Each rotating part superimposes information about its movement into the magnetic field disturbances near the system. There is information such as frequencies of the rotating parts, frequencies of the vibrations and frequencies of the electric energy supply source. When analyzing the system under dynamic conditions, the windowing can be used, as mentioned before. This allows us to analyze the shortened time interval of the measurement and see the details in signals, which can be lost in the noise when analyzing the whole data set.
For the graphical interpretation of the analysis results, the spectrum can be plotted, where the dominant system frequencies can be found and analyzed. The short time duration events are not clearly visible when analyzing the whole data set. For visualization of dynamic changes in the frequency domain, the spectrogram can be plotted. In this graphical representation of a signal, the short time events can be seen, forasmuch the windowing is used for the spectrogram plotting.
Not each short-time event can be found and clearly detectable by the Fourier Transform. For impulse-like events, the Wavelet transform is often used. The result of the Wavelet Transform of one-dimensional data vector is a two-dimensional vector, which represents the information about the frequency domain of the signal and the time when detected events occurred. It can be analyzed if signal contains isolated or periodical impulse distortions as well as if the periodicity of the distortion is stable or time-varying.
Discrete Wavelet Transform is performed as the sequence of filters applied to the analyzed signal. Low-pass and high-pass filters are used in cascades. The first step is to pass the signal through the low-pass filter with impulse response g
Simultaneously, the signal is filtered by the high-pass filter with impulse response h. The outputs of the filters are subsampled by the factor 2. The result of the filtering can be described as
The output of the high-pass filter is described as the detail coefficients of the Wavelet Transform and the output of the low-pass filter presents the input into next sequence of the filters. Each sequence of the filter reduces the length of the signal samples into half and doubles the frequency resolution.
3. Results
This section presents the data from the magnetic field measurements obtained during the experiments and discusses their interpretation from the diagnostics point of view. The data were processed and visualized with scripts written in Python programming language with the help of Scipy and Matplotlib libraries; the Wavelet Transform was computed with the National Instruments LabView software. The environment temperatures did not change during the measurements; they could be considered as stationary and their influence could be neglected. The results are accompanied with discussion of their representation and usability in diagnostics to improve the sustainability of systems.
The measured value of the magnetic field is not only a “value”, but it represents the concrete result of an effect, causality. The change of this value dB/dt refers to the dynamic changes of the effect. According to the sense of Figure 1, it is therefore possible to identify and monitor the effects not only on the surfaces of the objects, but also inside their structure by the identification of the magnetic field changes. This allows us to answer not only the questions of the technical diagnostics, but also of the materials engineering. Hereinafter, the examples for the ventilation system and the power generation system with the semi-Kaplan turbine are presented.
3.1. Ventilation System
The ventilation system was powered by an asynchronous electromotor with a speed controller system with cascade voltage/frequency controller. Standard diagnostics uses, for example, 60% and 100% of the output power while monitoring the changes. For the technical diagnostics, these are important data because they are evaluated with respect to the statistics and thus aid in predictive maintenance that was well established in aerospace industry and was adopted also into other types of industries [66,67,68]. Figure 6 shows the time development of the signal of the X component of the magnetic field measured during the transition from 60% to 100% of the peak output power. The corresponding spectrogram is shown in Figure 7. The transition occurred between the times of 370 s and 390 s.

Figure 6.
The ventilation system at transition from 60% to 100% power—X component: (a) time development; (b) statistics over 10,000 samples window—mean (solid red), ±standard deviation (dashed green).
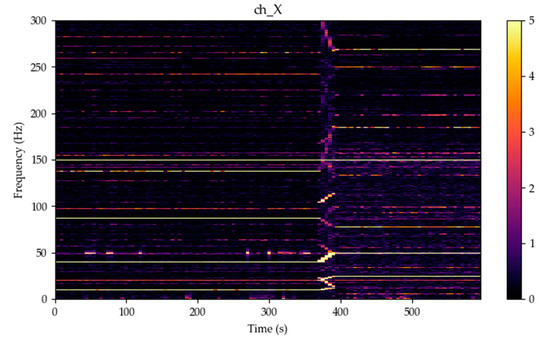
Figure 7.
The ventilation system at transition from 60% to 100% power—X component—spectrogram over 10,000 samples window, linear detrending, yellow color for amplitudes over 5 nT.
From the time development of the signal, it is seen that the magnetic field slightly gained in amplitude after the transition from 60% to 100% of the peak power. After the frequency analysis for 60% (Figure 8) and 100% (Figure 9) power, characteristic frequencies can be seen. The first harmonic of the ventilation system shaft is 8.17 Hz with the amplitude of 260 nT, second harmonic of the shaft is 16.34 Hz with the amplitude of 50 nT. The stator excitation signal produced by the speed controller at 60% power is 34.74 Hz with the amplitude 35.8 nT, what with four dipoles gives 8.68 Hz and 35.8 nT on one dipole. The frequency of 50 Hz with the amplitude 43.6 nT was created by the power grid. The slip of the rotor field behind the stator filed is given by the frequency ratios in the respective time. The value of 8.685 Hz corresponds to 521 RPM and the value of 8.17 Hz corresponds to 490 rpm, what gives the slip value of 5.9%.
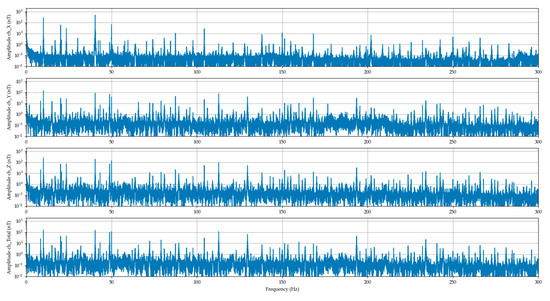
Figure 8.
The ventilation system signal spectrums (DFT) over 100,000 pure signal samples at 60% power.
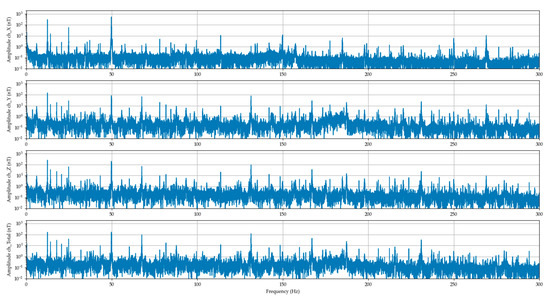
Figure 9.
The ventilation system signal spectrums (DFT) over 100,000 pure signal samples at 100% power.
By the 100%, similarly, the first harmonic of 12.43 Hz/ 341.5 nT, the second harmonic of 28.88 Hz/ 59.9 nT and stator excitation frequency of 49.78/ 51 nT could be observed. Moreover, the signals created by the bearings of the ventilation system could be observed at 100% power as harmonic multiples of the shaft frequency.
For visualization of the complex dynamic changes, the visualization in the form of a spectrogram is more suitable (Figure 7 and Figure 10). From this type of visualization all frequencies from the above-mentioned ones are clearly visible. The change in power, transition from 60% to 100% power, is significant in the electric system of the machine. The voltage/frequency converter as the speed controller with this steep cascade is expressive.
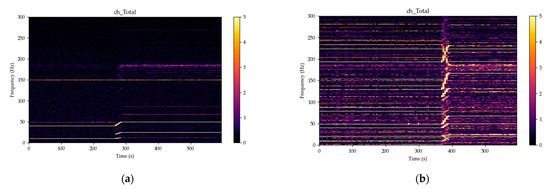
Figure 10.
The ventilation system spectrograms over 10,000 samples window at transition from 60% to 100% power—magnetic fields totals, yellow color for amplitudes over 5 nT: (a) ventilation system after repairs; (b) ventilation system before repairs.
At the 100% power, the bearings frequencies could be also observed; the bearings A and B (Figure 4) have 8 elements and 14 elements, respectively. Both frequencies, 99.46 Hz and 174 Hz, originating in the bearings, can be identified on the spectrogram.
3.2. Small Water Power Plant System
Figure 11 illustrates the time development of the magnetic fields totals from the first magnetometer placed over the turbine (VEMA no. 1), and one near the transmission and the (asynchronous) generator (VEMA no. 2). The magnetometers were positioned in identical orientations of the components. The advantage of a vector magnetometer is in the ability to keep track of each component X, Y, Z of the magnetic field because some information can be hidden in the total (consider sine in X component and cosine in Y component).
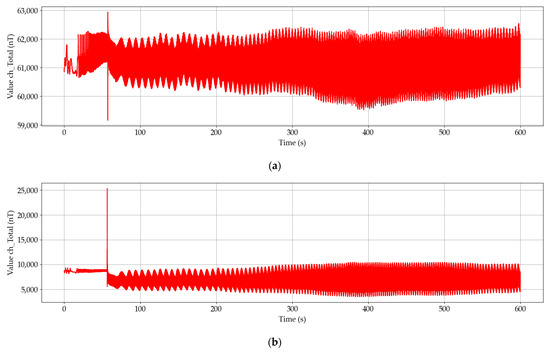
Figure 11.
Illustration of time development of the magnetic fields totals: (a) measured over the turbine; (b) measured near the generator.
Noticeable pulse occurred at the time 56 s due to the phasing of the generator to the power grid. After the connection to the power grid, the power generation system was held at its 60% power up to the time 190 s. From this point, the system slowly increased its power to 95% (time 385 s), held that value for a while and then decreased the power to 75%.
Figure 12 shows the moving window statistics in the form of the mean value ± standard deviation. The values were computed over segments with lengths of 10,000 samples, the overlapping was 50%.
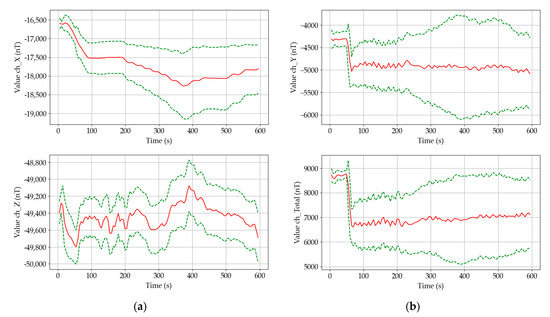
Figure 12.
Mean values (solid red) ± standard deviations (dashed green) of the measured magnetic fields, 10,000 samples in segment, 5000 samples overlap: (a) over the turbine; (b) near the generator.
The moving statistics visualization enables us to attain a quick overview mainly of the static positioning of the (magnetically visible) dominant ferromagnetic parts of the system. The standard deviations give information about the combined energies (mechanical + electrical) over the evaluated segment. The 10,000 samples in segment were chosen according to the time development of the signals.
If we consider the construction of the power generating system, one of the main contributions of using the vector fluxgate magnetometer is in its ability to measure DC and AC magnetic fields together. From this point of view, the DC fields will correspond to the displacements of the shafts, gearings and similar. The AC fields combine periodical movements of the ferromagnetic components with the fields originating in the generated power (current flow and magnetic circuitry). Considering these effects, changes in mean values of the X and Y components measured over the turbine (Figure 12) correspond to the decrease/restriction of the clearances in the system. This effect is exceptionally visible in the X magnetic field component over the turbine with noticeable stepping corresponding to the 5% increases in the power output of the system that was set in the control room of the power plant. This information would be hidden if a scalar magnetometer was used there instead of a vector magnetometer.
However, the sensitivity of the mean value to the length of the window/segment has to be taken into account as well. Considering the length of the window that corresponds to the 10 s interval, small oscillations in the mean values can be interpreted as slow fluctuations of the tension in the system. These fluctuations are caused by the elasticity of the mechanical system between the water flow with its turbulences pushing on the turbine blades on one side and by the power grid braking/accelerating the asynchronous generator on the other side. Both sides of system, the water and the power grid, are considered to be very hard sources of energy. Their forces exhibit themselves in oscillations and variations of the measured signals on the construction of the power generating system [69,70].
From Figure 12 it can be seen that the value of the standard deviation over all components rises with the increasing power delivered by the system into the power grid. This corresponds to the theory because the higher the power is produced, the higher field energies have to be created. Moreover, the power can be increased up to a certain peak level defined by the construction of the generator—noticeable frequency increase in Figure 11.
However, from the point of nondestructive diagnostics, higher frequencies are also important because higher harmonics of the frequencies are considered to be indicators of emerging degradation processes that can lead to component destruction and system failure. This is why, e.g., in vibrodiagnostics, the trends of higher harmonics over some time intervals are monitored that depend on a concrete construction of the device and also on experiences. The fluxgate magnetometer with sufficient measurement and frequency range can be a very useful additional device in nondestructive diagnostics, even though the piezoelectric sensors can measure accelerations over 10 kHz.
However, classical piezoelectric sensors do not see the mechanical and electrical energy together as it is seen by the magnetometer. From this point of view, we can look at the spectral properties of the signals through spectrograms that are shown in Figure 13. There were 10,000 samples in the segment used; Hanning window was applied with linear detrending and overlapping was set to 50%. This enabled the spectral resolution of 0.1 Hz in one segment. Some signals had very small amplitude, so the colorscale was chosen in such a way that every value that is over 5 nT is yellow. The spectrograms created from the measured signals over the turbine are at the first look less complicated (Figure 13a) because they were further away from the generator and the transmission (Figure 13b). In both cases, the phasing of the generator with the power grid is visible in the time around 56 s.
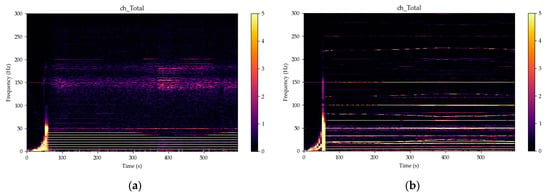
Figure 13.
Spectrograms of the magnetic fields totals, 10,000 samples in segment, 5000 samples overlap, Hanning window, linear detrending, yellow color for amplitudes over 5 nT: (a) VEMA-04 no. 1 (over the turbine); (b) VEMA-04 no. 2 (near the generator).
The system was in the motoric mode of operation up to the time of the phasing of the generator to the grid. The spin-up of the turbine by the water flow (up to the time around 50 s) is visible in both cases of the spectrogram sets. The magnetic sensors over the turbine recorded higher amplitudes at the harmonics when the power generating system was operating over 80% of its peak power. The values of harmonics shown in the spectrograms can be considered to be low; however, we were detecting spinning ferromagnetic components encapsulated in ferromagnetic casing without the necessity to dismantle something and putting it back together after the placement of the sensors. The spectrograms near the generator and transmission are containing combination of the electrical energy and mechanical energy signals.
As previously stated, the nominal values of the turbine’s shaft speed (horizontal shaft) were 309 revolutions per minute corresponding to frequency of 5.14 Hz, nominal values of the generator shaft speed (vertical shaft) were 1003 rpm corresponding to frequency of 16.72 Hz. The transmission gear ratio was 12/39 giving the tooth frequency of 200.6 Hz.
If we look closer at the signals, e.g., the X components, we can detect superpositions and amplitude modulations (Figure 14 and Figure 15). The use of two vector magnetometers allows us to distinguish between “mechanical” frequencies and “electrical” frequencies. Considering the construction (Table 1) of the power generating system, the bearing frequencies could also be detected. However, these signals are often buried in the noise, and their visibility depends on their geometry, material and the distance from the sensors. The other fact is that these frequencies do not necessarily emerge as visible all the time, but they can gain in amplitude if the power of the system, wear or clearances are increased.
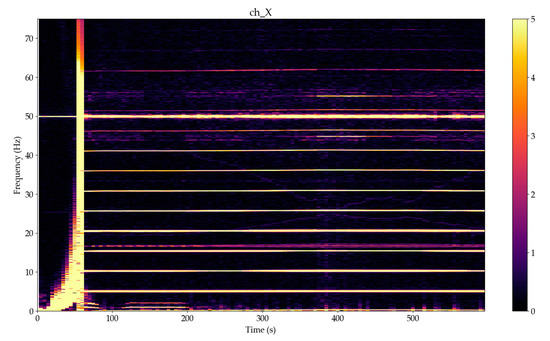
Figure 14.
Spectrograms details in frequency range 0–75 Hz of the magnetic fields X components, 10,000 samples in segment, 5000 samples overlap, Hanning window, linear detrending, yellow color for amplitudes over 5 nT for VEMA-04 no. 1 (over the turbine).
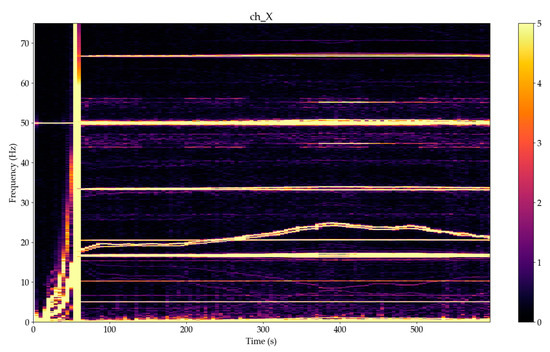
Figure 15.
Spectrogram detail in frequency range 0–75 Hz of the magnetic fields X components, 10,000 samples in segment, 5000 samples overlap, Hanning window, linear detrending, yellow color for amplitudes over 5 nT for VEMA-04 no. 2 (near the generator).

Table 1.
Bearing frequencies of the power generating system.
From Figure 14 and Figure 15, it is possible to see the change in the flow of the energy with respect to the revolutions. In the time after the phasing to the electrical grid, the turbine is loaded and several harmonics occur in comparison to the time before phasing. This is caused by the clearances that decreased after the time 200 s; the system was stiffer.
Because there were performed also control measurements with vibration sensors, we can see good correlation of the monitored effects with the output from vibration analysis (Figure 16). The sensors used were MTN/2200S from Monitran company, their standard sensitivity is 100 mV/g ± 10% nominal @ 80 Hz and their frequency response is from 2 Hz to 10 kHz ± 5% (−3 dB@0.8 Hz)
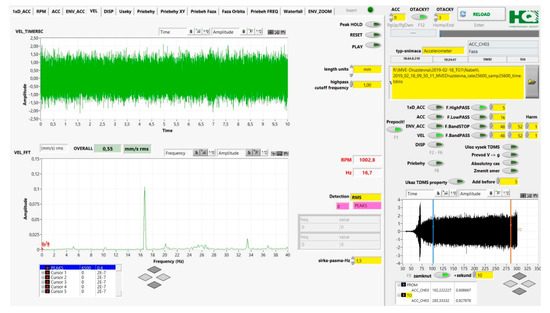
Figure 16.
Example of Fourier Transform of signal from piezoelectric accelerometer placed near the transmission.
The data can tell us about the form and transfer of the energy (with direction) at certain output power of the system. This information is similar to the spectrogram, and it can be seen where from and where to the energy shifts (at which revolutions)—that is the information of the power dissipation in the system. Considering the transmission as the component where the water flow energy and power grid energy meet, monitoring near the transmission is crucial.
One of the possibilities of how to evaluate the dynamic changes in a system is the Wavelet Transform. In comparison to the discrete Fourier Transform, the Wavelet Transform better illustrates the impulse changes in connection to the device components and their influence on the surroundings.
Figure 17 shows the magnetic field analysis with wavelet transform during the increase of the generator power. The WA Analytic Wavelet Transform VI function from National Instruments LabView was used. This function uses the complex-valued Morlet wavelet to compute the Continuous Wavelet Transform (CWT) of a 1D input signal. The Analytic Wavelet Transform (AWT) is also known as the Complex Wavelet Transform. The nominal revolutions are 1003 RPM. From the figure, the nods (areas) where the machine should not be permanently operated can be clearly identified. The first harmonic of the turbine shaft, 5.12 Hz, does not show as significant sidebands as the first harmonic of the generator, 16.72 Hz, does.
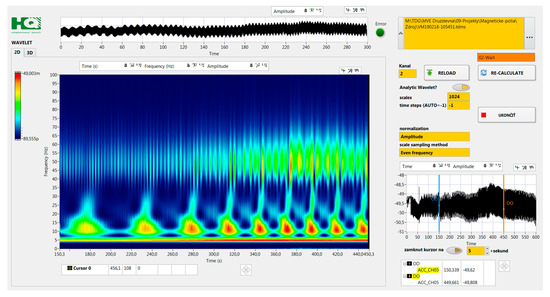
Figure 17.
Example of Wavelet Transform output from the magnetometer data from VEMA-04 magnetometer near the transmission.
The revolutions and frequencies from the system components—heavy loaded—nods are also visible. By the 95% power of the turbine, it is eminent that there is an increased influence of the mechanical oscillations on the generator, notable also in the magnetic field with increasing amplitude at 50 Hz. The period of oscillations of the system was around 55 s at the 60% power and reduced to 26 s at the 95% power. These oscillations are expressed by the increase of the amplitude of frequencies around 10 Hz with frequency peaks to 30 Hz. These long period oscillations can be caused by the dynamics of the water flow in the water duct in combination with the dynamics of the water flow control system actuators and actuators of semi-Kaplan stator vanes.
The combination of analyses through spectrograms, the Fourier Transform and Wavelet Transform allows us to determine optimal operational revolutions with respect to the requested service lifetime and sustainability also by changed conditions of the machine (load, damage of the components). However, it is necessary to have the knowledge about the machine construction to interpret the results.
The results of the performed experiments confirmed that magnetic sensors can provide interesting information from the nondestructive diagnostics point of view. The further investigation will focus on embedding microwire-based sensors into the monitored system [71,72,73,74] because their dimensions make them suitable for online monitoring of the systems. In this way, the integrated sensors could improve the control and maintenance processes of devices within their whole service lifetime and thus provide more sustainable systems. The electrical and mechanical systems, such as those in the experiments, are often equipped with different types of sensors, and magnetic sensors can be added to provide more robust redundancy. However, magnetic sensors can provide valuable information also for optimization within the cyber-physical principles within the concept of Industry 4.0.
4. Discussion
The paper presented measurements results from experiments performed in-site on two slow-speed electromechanical machines—a ventilation system and a small water power plant system. Based on the results, we can conclude that using a fluxgate vector magnetometer brings new valuable information usable in the field of nondestructive diagnostics, especially if we consider the in-site measurements for practical technical diagnostics and thus sustainability of electrical and mechanical systems. Possibility to obtain information about causality of processes from identified magnetic fields exists. This information could be also used in predictive maintenance [75] to optimize the intervals of the motors’ preventive/predictive maintenance [76], alongside other methods (Figure 18), e.g., with the diagnostics based on vibrations, because slow effects and other type of energy (electrical) can be evaluated, too.
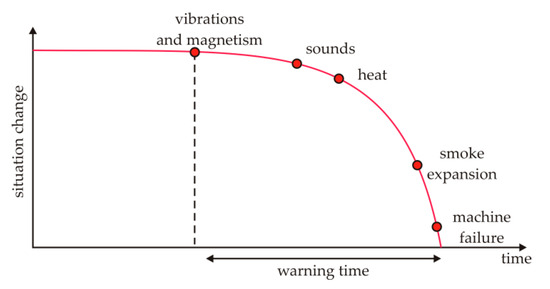
Figure 18.
Illustration of estimated warning time based on the measurable manifestation of effects.
The combination of several diagnostic principles, including the NDT magnetometry, allows us to determine the risks-based maintenance strategy for sustainability of expensive devices. The NDT magnetometry, compared to the contact sensors (e.g., piezoelectric, piezoresistive), enables quick mobile measurement solution. The information in the measured magnetic field has to be selected and interpreted correctly—in the field near the object of measurement, there are lots of signals and their interpretation is dependent on the knowledge of machine construction, measurement method and the experience of investigator.
The magnetometry provides information about the changes in observed parameters within NDT, but also allows us to advance in methods towards the elastic-strength and material characteristics of the object of measurement.
To sum up, there are several advantages of using fluxgate magnetometers and measurement of the magnetic field:
- −
- contactless measurement that is applicable also by submerged devices, e.g., water turbines;
- −
- by one simple measurement of the magnetic fields by an asynchronous motor, it is possible to identify real frequencies of the spinning components of the motor and stator excitation—effective control of the slip;
- −
- by the measurement of the real time (frequency) development of the magnetic field, it is possible to optimize the dB/dt parameter and extend the service lifetime of the device;
- −
- with three orthogonally placed sensors (Bx, By, Bz), it is possible to monitor also the displacements and the travel path of the magnetic field vector, which can be useful when the monitoring is complex, long-time and evaluates the trends;
- −
- because the DC and extremely low frequencies can be observed, the diagnostics frequency range extends;
- −
- the measurements can be also used to optimize the control of the motors (with both, scalar and vector controller types) and predictive maintenance.
With proper analyses, in the form of moving statistics, spectrums, spectrograms and evaluation of the Wavelet Transform outputs, the obtained results can be used towards all of the physical fields-based characteristics of the systems, thus providing unifying theory and approach. The spectrograms and Wavelet Transform show dB/dt, equivalent of da/dt.
The possibilities of further research with monitoring of the state changes of objects with utilization of the magnetic field refer to applications in several areas:
- −
- development of the introduced method into a full-featured method for online monitoring of rotational machines,
- −
- monitoring of cyclic fatigue of machines/systems,
- −
- tuning of the machines/systems—e.g., Figure 17 defines clearly the operating points, where the machine/system has to be operated considering the extension of the service lifetime,
- −
- selection from suitable new machines/systems with respect to the assembly flaws.
Considering the sustainability, an important factor is the relationship among design, operation, service and returns in the financial terms. From this point of view, the use of the fluxgate magnetometer with other types of sensors contributes to the modern concept Risk-Based Inspection Framework and helps to lower the operational expenses.
5. Conclusions
Based on the results of practical in-site measurements realized with vector fluxgate magnetometer, it can be seen that low-frequency magnetic fields can be used as a source of valuable information usable in nondestructive and technical diagnostics. These data can be further analyzed in conjunction with vibration sensors generally used in diagnostics. However, the magnetic field sensors can also be combined with other types of sensors, e.g., acoustic sensors, to extend the analyses possibilities from the sustainability perspective.
The advantage of processing data obtained with fluxgate magnetometers is that the data include information about both mechanical and electrical parts, without the necessity to disassemble the device under test/evaluation and therefore allowing to perform the measurements in-site in normal operational conditions. This helps in predictive maintenance and thus improves the sustainability of the systems.
Author Contributions
Conceptualization, M.O. and P.L.; methodology, M.O., P.L. and M.Š.; software, P.L.; validation, M.O., M.W., J.K. and P.A.; formal analysis, P.L. and P.A.; investigation, M.O., P.L., M.Š., M.W., J.K. and P.A.; data curation, P.L., M.Š. and P.A.; writing—original draft preparation, M.O., P.L. and M.W.; writing—review and editing, M.O., P.L. and J.K.; visualization, P.L. and M.Š.; supervision, M.O.; project administration, M.O., P.L. All authors have read and agreed to the published version of the manuscript.
Funding
This research was funded by the Slovak Research and Development Agency, grants numbers APVV-17-0184, APVV-18-0248 and APVV-19-0367, the Research Agency, ITMS code number 313011T557.
Institutional Review Board Statement
Not applicable.
Informed Consent Statement
Not applicable.
Conflicts of Interest
The authors declare no conflict of interest.
References
- El Masri, Y.; Rakha, T. A scoping review of non-destructive testing (NDT) techniques in building performance diagnostic inspections. Constr. Build. Mater. 2020, 265, 1–12. [Google Scholar] [CrossRef]
- Deane, S.; Avdelidis, N.P.; Ibarra-Castanedo, C.; Zhang, H.; Nezhad, H.Y.; Williamson, A.A.; Mackley, T.; Davis, M.J.; Maldague, X.; Tsourdos, A. Application of NDT thermographic imaging of aerospace structures. Infrared Phys. Technol. 2019, 97, 456–466. [Google Scholar] [CrossRef] [Green Version]
- Šmelko, M.; Draganová, K.; Lipovský, P.; Semrád, K.; Blišťanová, M.; Kašper, P. Non-Destructive testing of aircraft structures using microwire-based tensile stress sensor. Appl. Sci. 2020, 10, 8218. [Google Scholar] [CrossRef]
- Praslička, D.; Blažek, J.; Šmelko, M.; Hudák, J.; Čverha, A.; Mikita, I.; Varga, R.; Zhukov, A. Possibilities of measuring stress and health monitoring in materials using contact-less sensor based on magnetic microwires. IEEE Trans. Magn. 2013, 49, 128–131. [Google Scholar] [CrossRef]
- Xu, X.; Liu, M.; Zhang, Z.; Jia, Y. A novel high sensitivity sensor for remote field eddy current non-destructive testing based on orthogonal magnetic field. Sensors 2014, 14, 24098–24115. [Google Scholar] [CrossRef] [Green Version]
- He, D. PT-Level high-sensitivity magnetic sensor with amorphous wire. Sensors 2020, 20, 161. [Google Scholar] [CrossRef] [Green Version]
- Šmelko, M.; Lipovský, P.; Draganová, K.; Novotňák, J.; Oravec, M.; Šolc, M.; Andoga, R.; Rozenberg, R. Low frequency magnetic fields and safety. Acta Phys. Pol. A 2020, 137, 693–696. [Google Scholar] [CrossRef]
- Szulim, P.; Gontarz, S. Extraction of magnetic field features to determine the degree of material strain. Materials 2021, 14, 1576. [Google Scholar] [CrossRef]
- Pačaiová, H.; Oravec, M.; Šmelko, M.; Lipovský, P.; Forraj, F. Extra low frequency magnetic fields of welding machines and personal safety. J. Electr. Eng. 2018, 69, 493–496. [Google Scholar] [CrossRef] [Green Version]
- Burrows, C.W. Correlation of the magnetic and mechanical properties of steel. Sci. Pap. Bur. Stand. 1916, 13, 173–209. [Google Scholar] [CrossRef]
- Sandford, R.L. Effect of stress on the magnetic properties of steel wire. Sci. Pap. Bur. Stand. 1924, 19, 681–697. [Google Scholar] [CrossRef] [Green Version]
- Birss, R.R.; Faunce, C.A. Stress-Induced magnetization in small magnetic fields. J. Phys. Paris 1971, 32, 686–688. [Google Scholar] [CrossRef]
- Altherton, D.L.; Jiles, D.C. Effects of stress on magnetization. NDT Int. 1986, 19, 15–19. [Google Scholar] [CrossRef]
- Robertson, I.M. Magneto-Elastic Behaviour of Steels for Naval Applications; MRL Technical Report, MRL-TR-90-27; DSTO Materials Research Laboratory: Melbourne, Australia, 1991. [Google Scholar]
- Dapino, M.J. Nonlinear and Hysteretic Magnetomechanical Model for Magnetostrictive Transducers. Ph.D. Thesis, Iowa State University, Ames, IA, USA, 1999. [Google Scholar]
- Viana, A.; Rouve, L.; Cauffet, G.; Coulomb, J. Analytical model for external induction variations of a ferromagnetic cylinder undergoing high mechanical stresses in a low magnetic field of any orientation. IEEE Trans. Magn. 2011, 47, 1366–1369. [Google Scholar] [CrossRef]
- Blanter, M.S.; Golovin, I.S.; Neuhäuser, H.; Sinning, H. Internal Friction on Metallic Materials, 1st ed.; Springer: Berlin/Heidelberg, Germany, 2007. [Google Scholar] [CrossRef]
- Newham, R.E. Properties of Materials: Anisotropy, Symmetry, Structure; Oxford University Press: Oxford, UK, 2004. [Google Scholar] [CrossRef]
- Blitz, J. Electrical and Magnetic Methods of Non-destructive Testing, 2nd ed.; Springer: Dordrecht, The Netherlands, 1997; p. 271. [Google Scholar]
- Jiles, D.C. Review of magnetic methods for nondestructive evaluation. NDT Int. 1988, 21, 311–319. [Google Scholar] [CrossRef]
- Weng, G.; Wang, J.; Liu, Y.; Zhu, X.; Dai, J. Magnetic stress sensing system for nondestructive stress testing of structural steel and steel truss components based on existing magnetism. Sensors 2020, 20, 4043. [Google Scholar] [CrossRef]
- Szumiata, T.; Hibner, K.; Dziewiecki, K.; Mazur, Z.; Gockiewicz, A.; Gzik-Szumiata, M.; Górka, B.; Witoś, M. Stress monitoring in steel elements via detection of AC magnetic permeability changes. Acta Phys. Pol. A 2017, 133, 719–721. [Google Scholar] [CrossRef]
- Iwaniec, M.; Witoś, M.; Roskosz, M.; Gontarz, S. Diagnosis of supporting structures of HV lines using magneto-mechanical effects. Solid State Phenom. 2013, 208, 70–85. [Google Scholar] [CrossRef]
- Gauthier, J.; Krause, T.W.; Atherton, D.I. Measurement of residual stress in steel using the magnetic Barkhausen noise technique. NDT E Int. 1998, 31, 23–31. [Google Scholar] [CrossRef]
- Dobman, G.; Altpeter, I.; Wolter, B.; Kern, R. Physical basics and industrial application of 3MA-micromagnetic multiparameter microstructure and stress analysis. In Electromagnetic Nondestructive Evaluation (XI); Tamburrino, A., Melikhov, Y., Chen, Z., Eds.; IOS Press: Amsterdam, The Netherlands, 2008; pp. 18–25. [Google Scholar] [CrossRef]
- Neslušan, M.; Minárik, P.; Grenčík, J.; Trojan, K.; Zgútová, K. Non-destructive evaluation of the railway wheel surface damage after long-term operation via Barkhausen noise technique. Wear 2019, 420–421, 195–206. [Google Scholar] [CrossRef]
- Neslušan, M.; Trško, L.; Minárik, P.; Čapek, J.; Bronček, J.; Pastorek, F.; Čížek, J.; Moravec, J. Non-Destructive evaluation of steel surfaces after severe plastic deformation via the Barkhausen noise technique. Metals 2018, 8, 1029. [Google Scholar] [CrossRef] [Green Version]
- Moonesan, M.; Kashefi, M. Effect of sample initial magnetic field on the metal magnetic memory NDT result. J. Magn. Magn. Mater. 2018, 460, 285–291. [Google Scholar] [CrossRef]
- Oravec, M.; Kulikov, A.; Jurc, D.; Kulikova, O.; Vahovsky, J.; Abraham, M. Analysis of the effect of non-ionizing radiation in the area of magnetism under the limit of 1Hz generated by means of transport from the perspective of neurobehavioral effects. In Proceedings of the IEEE 17th World Symposium on Applied Machine Intelligence and Informatics (SAMI), Herlany, Slovakia, 24–26 January 2019; pp. 89–94. [Google Scholar] [CrossRef]
- Industrial Property Office of the Slovak Republic–WebRegisters, Utility Model No. 8860. Available online: https://wbr.indprop.gov.sk/WebRegistre/UzitkovyVzor/Detail/50040-2019 (accessed on 12 February 2021).
- Industrial Property Office of the Slovak Republic–WebRegisters, Utility Model No. 9099. Available online: https://wbr.indprop.gov.sk/WebRegistre/UzitkovyVzor/Detail/50084-2019 (accessed on 12 February 2021).
- Singh, G.P.; Udpa, S. The role of digital signal processing in NDT. NDT Int. 1986, 19, 125–132. [Google Scholar] [CrossRef]
- Pohl, R.; Erhard, A.; Montag, H.J.; Thomas, H.M.; Wüstenberg, H. NDT techniques for railroad wheel and gauge corner inspection. NDT E Int. 2004, 37, 89–94. [Google Scholar] [CrossRef]
- Zhang, S.; Zhou, J.; Zhou, Y.; Zhang, H.; Chen, J. Cable tension monitoring based on the elasto-magnetic effect and the self-induction phenomenon. Materials 2019, 12, 2230. [Google Scholar] [CrossRef] [Green Version]
- Villegas-Saucillo, J.J.; Díaz-Carmona, J.J.; Cerón-Álvarez, C.A.; Juárez-Aguirre, R.; Domínguez-Nicolás, S.M.; López-Huerta, F.; Herrera-May, A.L. Measurement system of metal magnetic memory method signals around rectangular defects of a ferromagnetic pipe. Appl. Sci. 2019, 9, 2695. [Google Scholar] [CrossRef] [Green Version]
- Valadeiro, J.; Cardoso, S.; Macedo, R.; Guedes, A.; Gaspar, J.; Freitas, P.P. Hybrid integration of magnetoresistive sensors with MEMS as a strategy to detect ultra-low magnetic fields. Micromachines 2016, 7, 88. [Google Scholar] [CrossRef] [Green Version]
- Oravec, M.; Draganová, K.; Lipovský, P.; Witoś, M.; Šmelko, M. Nízkofrekvenčné Magnetické Pole-Prístroje, Merania, Nové Technológie Low Frequency Magnetic Field–Devices, Measurements, New Technologies, 1st ed.; SPBI: Ostrava, Czech Republic, 2020; p. 194. [Google Scholar]
- Belyaev, I.; Dean, A.; Eger, H.; Hubmann, G.; Jandrisovits, R.; Kern, M.; Kundi, M.; Moshammer, H.; Lercher, P.; Müller, K.; et al. EUROPAEM EMF Guideline 2016 for the prevention, diagnosis and treatment of EMF-related health problems and illnesses. Rev. Environ. Health 2016, 31, 363–397. [Google Scholar] [CrossRef]
- Gajšek, P.; Ravazzani, P.; Grellier, J.; Samaras, T.; Bakos, J.; Thuróczy, G. Review of studies concerning electromagnetic field (EMF) exposure assessment in Europe: Low frequency fields (50 Hz–100 kHz). Int. J. Environ. Res. Public Health 2016, 13, 875. [Google Scholar] [CrossRef] [Green Version]
- Stam, R. The revised electromagnetic fields directive and worker exposure in environments with high magnetic flux densities. Ann. Occup. Hyg. 2014, 58, 529–541. [Google Scholar] [CrossRef] [Green Version]
- Baltag, O.; Costandache, D.; Rau, M.; Iftemie, A.; Rau, I. Dynamic shielding of the magnetic fields. Adv. Electr. Comput. Eng. 2010, 10, 135–142. [Google Scholar] [CrossRef]
- Bassen, H. Low frequency magnetic emissions and resulting induced voltages in a pacemaker by iPod portable music players. Biomed. Eng. Online 2008, 7, 7. [Google Scholar] [CrossRef] [Green Version]
- Ghnimi, S.; Gharsallah, A. The potential effect of low-frequency EM fields on the human body. J. Electr. Syst. 2020, 16, 134–145. [Google Scholar]
- Budnik, K.; Machczynski, W. Magnetic field of complex helical conductors. Arch. Electr. Eng. 2013, 62, 533–540. [Google Scholar] [CrossRef] [Green Version]
- Campbell, E.A.; Kantor, J.; Kantorová, L.; Svobodová, Z.; Wosch, T. Tactile low frequency vibration in dementia management: A scoping review protocol. Int. J. Environ. Res. Public Health 2021, 18, 1904. [Google Scholar] [CrossRef] [PubMed]
- Martínez, I.M.E.; de Córdoba, F.P.; Antonino-Daviu, J.A.; Conejero, J.A. Detection of adjacent and non-adjacent bar breakages in induction motors based on power spectral subtraction and second order statistics of sound signals. Appl. Sci. 2020, 10, 6641. [Google Scholar] [CrossRef]
- Duan, X.; Zhao, T.; Liu, J.; Zhang, L.; Zou, L. Analysis of winding vibration characteristics of power transformers based on the finite-element method. Energies 2018, 11, 2404. [Google Scholar] [CrossRef] [Green Version]
- Huerta-Rosales, J.R.; Granados-Lieberman, D.; Amezquita-Sanchez, J.P.; Camarena-Martinez, D.; Valtierra-Rodriguez, M. Vibration signal processing-based detection of short-circuited turns in transformers: A nonlinear mode decomposition approach. Mathematics 2020, 8, 575. [Google Scholar] [CrossRef]
- Ullah, Z.; Hur, J. A comprehensive review of winding short circuit fault and irreversible demagnetization fault detection in PM type machines. Energies 2018, 11, 3309. [Google Scholar] [CrossRef] [Green Version]
- Maraaba, L.; Al-Hamouz, Z.; Abido, M. An efficient stator inter-turn fault diagnosis tool for induction motors. Energies 2018, 11, 653. [Google Scholar] [CrossRef] [Green Version]
- Tavrin, Y.; Siegel, M.; Hinken, J. Standard method for detection of magnetic defects in aircraft engine discs using a HTS SQUID gradiometer. IEEE Trans. Appl. Supercond. 1999, 9, 3809–3812. [Google Scholar] [CrossRef]
- Le Bihan, Y.; Joubert, P.Y.; Placko, D. Eddy current technique applied to the nondestructive evaluation of turbine blade wall thickness. In Nondestructive Evaluation of Aging Aircraft, Airports and Aerospace Hardware IV; SPIE: Bellingham, WA, USA, 2000; Volume 3994, pp. 145–153. [Google Scholar] [CrossRef]
- Rossini, N.S.; Dassisti, M.; Benyounis, K.Y.; Olabi, A.G. Methods of measuring residual stresses in components. Mater. Des. 2012, 35, 572–588. [Google Scholar] [CrossRef] [Green Version]
- Rao, B.P.C. Non-destructive testing and damage detection. In Aerospace Materials and Material Technologies; Prasad, N.E., Wanhill, R.J.H., Eds.; Springer: Singapore, 2017; Volume 2, pp. 209–228. [Google Scholar] [CrossRef]
- Rumiche, F.; Indacochea, J.E.; Wang, M.L. Early corrosion detection in structural carbon steels using electromagnetic sensors. In Smart Structures and Materials 2006: Sensors and Smart Structures Technologies for Civil, Mechanical and Aerospace Systems; Tomizuka, M., Yun, C.B., Giurgiutiu, V., Eds.; SPIE: Bellingham, WA, USA, 2006; Volume 6174, pp. 1–2. [Google Scholar] [CrossRef]
- Cui, L.; Xu, H.; Ge, J.; Cao, M.; Xu, Y.; Xu, W.; Sumarac, D. Use of bispectrum analysis to inspect the non-linear dynamic characteristics of beam-type structures containing a breathing crack. Sensors 2021, 21, 1177. [Google Scholar] [CrossRef]
- Li, G.; Gu, F.; Wang, T.; You, J.; Ball, A. Investigation into the vibrational responses of cylinder liners in an IC engine fueled with biodiesel. Appl. Sci. 2017, 7, 717. [Google Scholar] [CrossRef] [Green Version]
- Zhang, R.; Gu, X.; Gu, F.; Wang, T.; Ball, A.D. Gear wear process monitoring using a sideband estimator based on modulation signal bispectrum. Appl. Sci. 2017, 7, 274. [Google Scholar] [CrossRef]
- Huang, B.; Feng, G.; Tang, X.; Gu, J.X.; Xu, G.; Cattley, R.; Gu, F.; Ball, A.D. A performance evaluation of two bispectrum analysis methods applied to electrical current signals for monitoring induction motor-driven systems. Energies 2019, 12, 1438. [Google Scholar] [CrossRef] [Green Version]
- Rodriguez, N.; Cabrera, G.; Lagos, C.; Cabrera, E. Stationary wavelet singular entropy and kernel extreme learning for bearing multi-fault diagnosis. Entropy 2017, 19, 541. [Google Scholar] [CrossRef] [Green Version]
- Kwaśniewski, J. Application of the wavelet analysis to inspection of compact ropes using a high-efficiency device. Arch. Min. Sci. 2013, 58, 159–164. [Google Scholar] [CrossRef]
- Hudák, J.; Blažek, J.; Praslička, D.; Mikita, I.; Lipovský, P.; Gonda, P. Sensitivity of VEMA-04.1 magnetometer. J. Eelectr. Eng. 2013, 61 (Suppl. 7), 28–31. [Google Scholar]
- Lipovský, P.; Šmelko, M.; Fil’ko, M.; Draganová, K.; Blažek, J.; Hudák, J.; Andoga, R.; Szabo, S. Relax-Type magnetometer with direct optocoupler relaxation. Acta Phys. Pol. A 2020, 137, 681–683. [Google Scholar] [CrossRef]
- Kliment, T.; Praslička, D.; Lipovský, P.; Draganová, K.; Závodský, O. Calibration of magnetometer for small satellites using neural network. Acta Phys. Pol. A 2017, 131, 1129–1131. [Google Scholar] [CrossRef]
- Praslička, D.; Lipovský, P.; Hudák, J.; Šmelko, M. Estimation of multichannel magnetometer noise floor in ordinary laboratory conditions. Acta Phys. Pol. A 2017, 131, 1123–1125. [Google Scholar] [CrossRef]
- Zieja, M.; Woch, M.; Tomaszewska, J. Reliability of the aircraft in the Polish operational aviation. In Safety and Reliability–Safe Societies in a Changing World, 1st ed.; CRC Press: Leiden, The Netherlands, 2018; pp. 2277–2283. ISBN 978-0-8153-8682-7. [Google Scholar]
- Woch, M.; Zieja, M.; Tomaszewska, J. The impact of input parameters on the reliability of aircraft. In Proceedings of the 3rd International Conference on System Reliability and Safety (ICSRS), Barcelona, Spain, 23–25 November 2018; pp. 210–214. [Google Scholar] [CrossRef]
- Żurek, J.; Tomaszewska, J. Analysis of the equipment operation system in terms of availability. J. KONBiN 2017, 40, 5–20. [Google Scholar] [CrossRef] [Green Version]
- Dehkharqani, A.S.; Cervantes, M.J.; Aidanpaa, J.O. Numerical analysis of fluid-added parameters for the torsional vibration of a Kaplan turbine model runner. Adv. Mech. Eng. 2017, 9, 1687814017732893. [Google Scholar] [CrossRef]
- Dehkharqani, A.S.; Aidanpaa, J.O.; Engstrom, F.; Cervantes, M.J.; Aidanpaa, J.O. Fluid added polar inertia and damping for the torsional vibration of a Kaplan turbine model runner considering multiple perturbations. IOP Conf. Ser. Earth Environ. Sci. 2019, 240, 062007. [Google Scholar] [CrossRef]
- Richter, K.; Varga, R.; Kovac, J.; Zhukov, A. Controlling the domain wall dynamics by induced anisotropies. IEEE Trans. Magn. 2012, 48, 1266–1268. [Google Scholar] [CrossRef]
- Vahovsky, O.; Thiaville, A.; Varga, R.; Richter, K. Manipulation of domain wall shape in thin magnetic wire by current annealing. Acta Phys. Pol. A 2020, 137, 821–823. [Google Scholar] [CrossRef]
- Zhukova, V.; Corte-Leon, P.; Ipatov, M.; Blanco, J.M.; Gonzalez-Legarreta, L.; Zhukov, A. Development of magnetic microwires for magnetic sensor applications. Sensors 2019, 19, 4767. [Google Scholar] [CrossRef] [PubMed] [Green Version]
- Corte-Leon, P.; Zhukova, V.; Chizhik, A.; Blanco, J.M.; Ipatov, M.; Gonzalez-Legarreta, L.; Zhukov, A. Magnetic microwires with unique combination of magnetic properties suitable for various magnetic sensor applications. Sensors 2020, 20, 7203. [Google Scholar] [CrossRef]
- Stodola, P.; Stodola, J. Model of predictive maintenance of machines and equipment. Appl. Sci. 2020, 10, 213. [Google Scholar] [CrossRef] [Green Version]
- Pačaiová, H.; Andrejiová, M.; Balažiková, M.; Tomašková, M.; Gazda, T.; Chomová, K.; Hijj, J.; Salaj, L. Methodology for complex efficiency evaluation of machinery safety measures in a production organization. Appl. Sci. 2021, 11, 453. [Google Scholar] [CrossRef]
Publisher’s Note: MDPI stays neutral with regard to jurisdictional claims in published maps and institutional affiliations. |
© 2021 by the authors. Licensee MDPI, Basel, Switzerland. This article is an open access article distributed under the terms and conditions of the Creative Commons Attribution (CC BY) license (https://creativecommons.org/licenses/by/4.0/).