Article

Co-Digestion of Extended Aeration Sewage Sludge with Whey, Grease and Septage: Experimental and Modeling Determination

LOCIE UMR CNRS 5271, Polytech Annecy, Chambéry, USMB, INES (Institut National de l’Energie Solaire), Campus Scientifique Savoie Technolac, Avenue du Lac Leman, F-73376 Le Bourget du Lac, France
*
Authors to whom correspondence should be addressed.
Sustainability 2021, 13(16), 9199; https://doi.org/10.3390/su13169199
Submission received: 23 July 2021 / Revised: 10 August 2021 / Accepted: 13 August 2021 / Published: 16 August 2021
(This article belongs to the Section Sustainable Engineering and Science)

Abstract

:
The potential of co-digestion mixing thickened secondary sludge (TS) from extended aeration wastewater treatment plant and locally available substrates (whey, grease and septage) has been studied in this work, using three steps. The first step was a batch test to determine the biological methane potential (BMP) of different mixtures of the three co-substrates with TS. The second step was carried out with lab-scale reactors (20 L), simulating anaerobic continuous stirred tank reactors, fed by three mixtures of co-substrates that were determined according to the previous step results. Modeling was applied in the third step, using ADM1 as a mechanistic model to help understand the co-digestion process. According to the BMP step, septage used as a co-substrate has a negative effect on performance, and the addition of 10–30% grease or whey would lead to a gain of around 60–70% in the production of methane. The results from the reactor tests did not validate the positive effects observed with the BMP assay but confirmed good biodegradation efficiency (> 85%). The main purpose of co-digestion in this scenario is to recover energy from waste and effluents that would require even more energy for their treatment. The protein and lipid percentages of particulate biodegradable COD are important variables for digester stability and methane production, as predicted by modeling. The results of simulations with the ADM1 model, adapted to co-digestion, confirmed that this model is a powerful tool to optimize the process of biogas production.

1. Introduction

The activated sludge process is the one most widely applied to treat domestic wastewater, due to its well-known facility design and operation parameters. Among diverse activated sludge processes, the extended aeration activated sludge system (EAASS) is the most widely employed technique for the treatment of domestic wastewater in France, with more than 60% of domestic wastewater treatment plants (WWTP) and a capacity greater than the 2000 person-equivalent (PE) volume [1]. The extended aeration process is often better at handling organic loading and flow fluctuations and has a relatively low sludge production due to a long sludge age, as there is a greater detention time for the substrate to be assimilated by microorganisms [2]. Anaerobic digestion is an efficient method to reduce and valorize waste activated sludge [3]. In France, 97 WWTP were equipped with anaerobic digestion units in 2018, out of the nearly 20,000 WWTP in France at the time [4]. Almost half of the 97 installations equipped with digesters are activated sludge units with extended aeration. These facilities treat the effluent of about 30 million PE, close to 30% of the total PE in France. The biogas produced was mainly used on-site (boiler) and for the cogeneration of electricity. Sewage sludge from an activated sludge extended aeration treatment is less fermentable than primary sludge and, therefore, has a naturally lower methanogenic power [5]. However, we feel that it is important to characterize the performance achieved in digestion with this kind of sludge.
The co-digestion of extended aeration activated sludge (EAAS) with other organic waste that has a higher biological methane potential (BMP) is one possible way to enhance biogas production and the percentage of CH4 [6,7]. Digesters are also usually oversized, and the addition of co-substrates can help to enhance gas and electricity production for little additional expense [8]. The extra power produced may cover the energy needs of wastewater treatment at a reasonable cost [9]. In France, although the operators sometimes add fats to the mixture, co-digestion is still rarely used due to regulatory constraints.
Anaerobic digestion is a complex process, one that is relatively slow, quite sensitive to variations in loads applied, and with a microflora that is also quite fragile in the presence of toxicants. The co-digestion of substrates of different natures amplifies its complexity, the relative fragility of the digestion process, and the qualitative and quantitative variability of the biogas produced. Co-digestion, when applied to EAAS, presents several advantages. Sludge can be mixed with different types of organic waste, both in order to enhance biogas production and to valorize the co-substrates via biogas production. By adding co-substrates, a gain ranging from 13 to 176% in the methane yield was accomplished compared to the mono-digestion process [10]. This gain concerns the rate of methane production, which will make the co-digestion process competitive for industrial adoption, depending on the local context. Indeed, some of the co-substrates cannot always be easily treated on their own, such as septage from septic tanks, grease from grease traps, or whey from cheesemakers. Severe environmental pollution in many countries is caused by the discharge of large quantities of these compounds [11].
Many studies on co-digestion have been conducted with agricultural or municipal organic waste [10,12,13] but there are very few dealing with EAAS to the best of our knowledge. The study of this kind of co-substrate will be useful to validate the current results.
The objective of this study was to assess the potential of co-digestion, mixing thickened secondary sludge from extended aeration wastewater treatment plants with locally available substrates, using the wet mesophilic anaerobic digestion process. The first step consisted of batch-testing to determine the methane potential of different mixtures of co-substrates, in order to find the most favorable proportions and to characterize biodegradation kinetics and biogas production. The second step was carried out with lab-scale reactors simulating anaerobic continuous still-tank reactors, fed by three mixtures of co-substrates, determined according to previous test results. Simulation using ADM1 as a mechanistic model was applied in a third step to help our understanding of the co-digestion process and, more precisely, to help identify the best ratio for “organic couples” that provide a synergetic digestion performance. This approach, combining a BMP test, a dynamic study with lab-scale reactors, and modeling with mechanistic models, is still used very little at present.
To date, in order to simulate the anaerobic digestion process and, more particularly, the kinetics of the various reactions, the most advanced mechanistic model is ADM1 (anaerobic digestion model number one), published by the IWA Task Group for the Mathematical Modeling of Anaerobic Digestion Processes [14,15]. More simple models could be used [16], but the choice of the mechanistic model ADM1 is justified by infrequency data, erroneous data, or data that is hard to obtain [17]. For this study, we did not make any particular extensions to the ADM1 initial model, but we have adapted it by incorporating parameter data and inputs that are specific to co-digestion.

2. Materials and Methods

2.1. BMP Test

A BMP test was carried out according to the main conditions defined in [18], using glass bottles with a volume of 1075 mL, closed by a septum, with a reaction volume of 470 mL and an overhead gas volume of 605 mL. The bottles were kept at 37 °C in a thermostatically controlled chamber. Stirring was carried out by magnetic stirrers. The inoculum consisted of extended aeration sludge from a local WWTP of 19,500 PE (Haute-Savoie, France) and was pre-incubated for 3 to 5 days to deplete the residual biodegradable compounds. The added volume of inoculum was 30 mL/bottle. The dilution of substrates was realized with a buffered nutrient solution (pH 7) [19]. Biogas production has been determined by pressure variation over time using a manometric method with classical thermodynamic conversion in volume. At the beginning and end of the test (end of biogas production), Dry matter (DM), volatile solids (VS), and chemical oxygen demand COD were measured using standardized methods [20]. Biogas composition (CO2, N2 and CH4) was determined by gas chromatography, using a katharometer as a detector (Shimadzu GC-2014, with a Supelco stainless steel column: 60/80 Carboxen 1000, 15ft x 1/8in).
The kinetic parameters of biogas production have been calculated using a modified Gompertz equation, which is useful when the lag phase is present [21]. This equation (Equation (1)), which represents sigmoidal curves, allows us to assess the lag time. To take into account two successive phases that may correspond to the consumption of two substrates sequentially, Equation (1) has been modified (Equation (2)):
X g = K · e e ( k K · e λ t + 1 ) )
X g = K 1 · e e ( k 1 K 1 · e λ 1 t + 1 ) ) + ( K 2 K 1 ) · e e ( k 2 K 2 · e λ 2 t + 1 ) )
where Xg is biogas production (Lbiogas gVS−1 or COD−1); Ki is ultimate biogas production (Lbiogas gVS−1 or gCOD−1); ki is the maximum rate of biogas production (t−1); λi is the lag phase (t).
Three parameters are significant for the kinetics of biogas production (Xg): the ultimate potential for the production of biogas (Ki); the maximum rate of biogas production (ki); and the lag phase (λi).
The ultimate potentials were estimated from the average of the last values of the cumulative biogas production curves. The kinetic parameters were estimated using the solver function of the spreadsheet by maximizing the coefficient of determination (R2) between experimental data and calculated ones.
In order to quantify the synergy in anaerobic co-digestion, kinetics parameters obtained for the different mixture assays were normalized by the parameters from the mono-digestion test with TS according to Equation (3):
N p = P m i x P T S 1
where Np represents the normalized parameter; Pmix, the parameter value of the BMP co-digestion assay; and PTS, the parameter value of the reference TS BMP assay.
Four co-substrates have been tested: extended aeration thickened sludge (TS), grease (G), septage from a septic tank (SP) and whey (W) (Table 1). The results were compared to a blank (inoculum + acetate or cellulose). Thickened sludge and grease (produced during the pre-treatment for the process) had previously been collected at the local wastewater treatment plant, septage was collected from the septic tanks of individual houses near the local wastewater treatment plant, and the whey came from the cheese factory of the agricultural school of La Motte-Servolex, (Savoie, France).
The experimental plan adopted was determined by the proportion of COD, expressed as a percentage of thickened sludge/co-substrate: 90/10; 70/30; 50/50. For each proportion, the test was performed in triplicate. The nominal COD content was equal to 6.4 g for each bottle.
The initial substrate-over-inoculum ratio (S/I), expressed in COD, was equal to 4.

2.2. Bioreactor’s Test

The reactors were cylindrical tanks with a volume of 15 L and a headspace volume of 5 L (Figure S1 in Supplementary Materials). Bioreactors were run as continuously stirred tank reactors (CSTRS) without biomass recycling so that the sludge retention time (SRT) was equal to the hydraulic retention time (HRT).
The HRT was fixed at 15 days, providing a minimum acceptable SRT, according to the results of previous BMP tests and recommendations in the literature [3,22,23]. Reactors were mixed by continuous pumping (2 L/min). Reactors were heated by an external thermostatic water bath, maintained to 35 °C. Sludge was fed at regular intervals every day to help maintain steady-state conditions in the digester.
The substrates and co-substrates had the same origin as for the BMP test.
Biogas production was determined by a volumetric pulse meter comprising 2 chambers filled with water in communication, regulated by a solenoid valve. Each pulse corresponded to a volume of 20 mL of water, displaced by the increase in pressure inside the reactor. Biogas production was also determined by measuring the pressure inside the reactor, using an accurate 0.1 mbar pressure gauge.
The contents of dry matter (DM), volatiles (VS), total COD (CODt), particulate COD (CODp) and soluble COD (CODs) were carried out according to standardized methods (APHA, 1998), 3 times on average per week.
The pH and temperature were measured continuously using a specific probe inside the reactor.
The VFA contents and the composition of the biogas were measured by gas chromatography, approximately once every ten days. The analysis conditions are detailed in Table S1 (cf. Supplementary Materials).

2.3. Statistical Analysis

Statistical analysis was performed using the StatEL® software (ad Science, Paris, France).
Statistical analysis was conducted using parametric (one-way and two-way ANOVA) or non-parametric (Friedman analysis) tests, and the difference between reactors was expressed as significant, at a significance level of p < 0.05. The p-value is the estimated probability of rejecting the null hypothesis (hypothesis of “no difference” of the test when that hypothesis is true).
Post-hoc tests (Newman and Keuls tests) were conducted in order to decide which groups were significantly different from each other, based on the F-test for Ryan’s test (ANOVA), and based upon the average rank differences of the groups for the Friedman test.
The non-parametric statistical test was carried out when data did not meet the criteria for a parametric test (normally distributed, equal variance).

2.4. Modeling and Simulation

The ADM1 model takes into account two extracellular steps (the disintegration and hydrolysis of substrates) and three steps of microbial anaerobic metabolism (acidogenesis, acetogenesis and methanogenesis). These reactions are carried out by seven groups of microorganisms and three types of enzymes. The model assumes constant stoichiometry coefficients, with the inhibition of the degradation of volatile fatty acids by hydrogen. The model also considers the inhibition of the growth of microorganisms by pH, and the inhibition of acetoclastic methanogenesis by hydrogen and ammonium [19]. The ionic balance and the gas-liquid exchanges are also integrated. This model considers the mortality of bacterial cells and their recycling into biomass.
The ADM1 model has been implemented in AQUASIM 2.0 by the IWA Task Group for the Mathematical Modeling of Anaerobic Digestion Processes. AQUASIM 2.0 is an open-source software developed in 1998 for the identification and simulation of aquatic systems [24]. Furthermore, AQUASIM allows researchers to conduct sensitivity analysis and establish estimation parameters, being divided into variables, processes, compartments and link interfaces.
The modeling approach is based on the material balance, assuming a continuous stirred tank reactor with output levels equal to those at all areas inside the reactor.
For this study, the ADM1 model was implemented in AQUASIM as a differential and algebraic equation (DAE) and used an ideal CSTR compartment.
The model was solved as a system, with the biochemical reactions integrated explicitly as a system of 26 differential equations (7 groups of bacteria and archaea, 19 catalyzing processes), 3 physico-chemical liquid phase processes, 15 equations for the mechanisms of inhibition, and 8 implicit algebraic variables (per reactor). This approach is a tool to overcome the inherent “stiffness” problem, due to the fast hydrogen and pH dynamics (now explicitly algebraically calculated), which results in some numerical solvers encountering difficulty when solving the system of ODEs [17].
The values and the sensitivity of the parameters were determined by statistical fitting of the experimental data, observed in steady-state using AQUASIM 2.0, which is able to perform linear sensitivity analysis with respect to a set of selected parameters and to perform parameter estimation using the weighted least-squares method [24,25].
Our approach to adapting the ADM1 model to co-digestion was to characterize the actual feed mix with the stoichiometric composition of composite particulate chemical oxygen demand (CODp), i.e., carbohydrates (Xch), proteins (Xpr), lipids (Xli), and inerts (Xi). This approach was successful in terms of model predictions [26] and was similar to the input model for fractionation of COD, described by Arnell et al. [27]. As described by Feucken et al. [28], ADM1 was modified by introducing three state variables for fractionated particulate COD (Xch, Xpr, and Xli), and three corresponding hydrolysis processes (first-order hydrolysis). In AQUASIM, the stoichiometric composition of substrate mix has been determined by repeating the corresponding characterization using dynamic inputs.
The biodegradable part of particulate COD has been considered, based on COD analysis during the experiment. The ultimate methane potential and the hydrolysis parameter (khyd) are estimated by fitting to BMP data using the defined model (Equation (1) or (2)).
Specifically, to take into account the mixture composition feeding, the fractionation of COD, based on substrates proportion, has been applied to the inputs. For example, with a TS/W mixture at 70/30, the soluble amino acids input has been calculated from the following equation:
(0.7faa-TS + 0.3faa-W). CODs
where faa-TS is the percentage of amino acids in thickened sludge; faa-W is the percentage of amino acids in whey; and CODs is soluble COD in g/L.
The missing input state variables required for ADM1 have been found from a dataset containing the characterization and fractionation of organic substrates, taken from the literature [29].
Certain kinetic rate equations have been modified to take into account the inhibition linked to substrate concentration. Non-competitive substrate inhibition has been modeled using the Andrews–Haldane equation (Equation (5)).
m u X = m u m a x X · S x K s + S x + S x 2 K i
where mumaxX is the degradation rate constant in kg COD kg COD−1 d−1; Sx is the substrate concentration in kg COD m−3; Ks is the half-saturation constant in kg COD m−3; and Ki is the inhibition constant in kg COD m−3.

3. Results

3.1. BMP Test

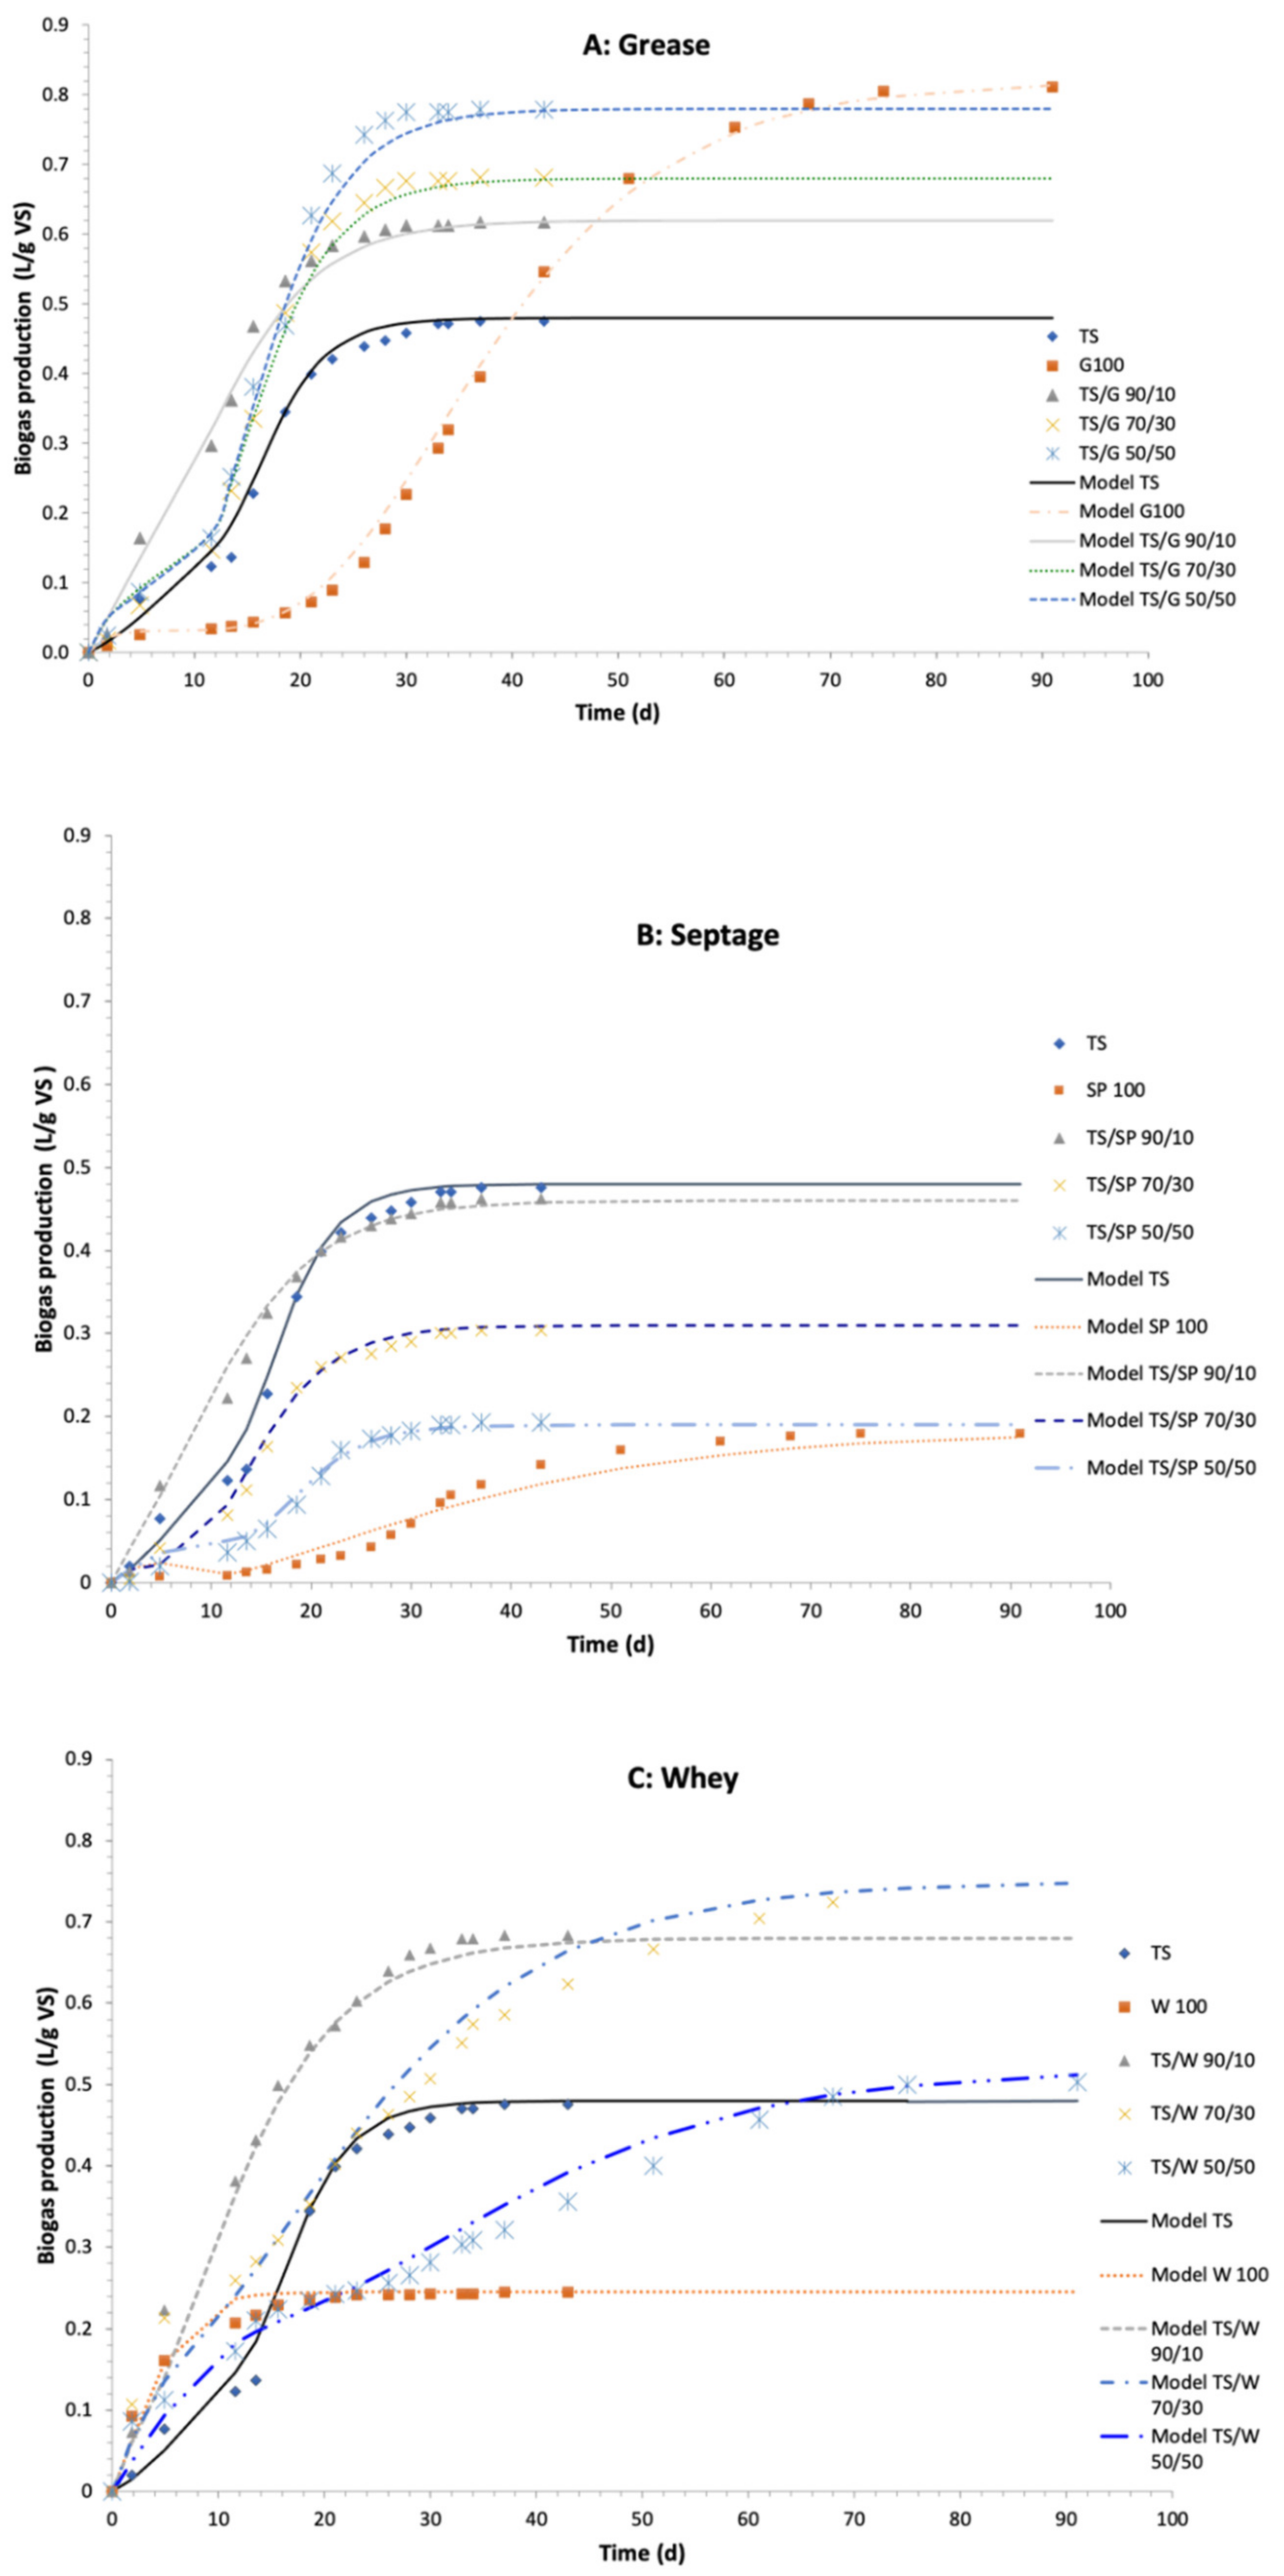
3.1.1. Thickened Sludge and Grease Mixtures

The first phase of biogas production, with a very visible plateau, was observed with 100% grease and became less and less visible, depending on the decrease in the proportion of grease in the mixture (Figure 1A). This behavior has been observed in BMP tests carried out with the solid fat waste, with a comparable S/I ratio [30], or with grease trap sludge mixed with sewage sludge [31]. The presence of 10% grease accelerated the production of biogas and greatly increased the methane potential by a factor of approximately 1.5, compared to thickened sludge alone (Table 2).
The mixture of thickened sludge and grease in equal parts led to the same biogas production as the fat alone, but with a shorter lag phase. Note that the increase in the ultimate production of biogas was not directly proportional to the increase of the share of grease, which translates as a phenomenon of inhibition.

3.1.2. Thickened Sludge and Septage Mixtures

With more than 10% of sewage matter in the mixture of sludge and septage, a very strong negative effect on the production of biogas was observed (Figure 1B). The mixture with 30% of septage led to an inhibition of about 36% of the potential of the sludge alone, and of about 60% for the mixture with 50% of septage.
With 10% septage, there was a positive effect on the first phase of production but not for the second phase (Table 2). As modeling two-phase kinetics is not adequate to describe the shape of the curve exactly, a kinetic with three successive phases was tested, the last with a lag phase of about 25 days.

3.1.3. Thickened Sludge and Whey Mixtures

The mixtures of 10% and 30% whey accelerated and increased the potential for biogas production per gram of VS (Figure 1C) compared to sludge alone.
The equal-part mixing led to the same potential as the sludge alone, but the second phase started later, with a latency time of more than 14 days (Table 2). The production of biogas was lower with pure whey as the substrate.
Modeling by the modified Gompertz model was satisfactory, with coefficients of determination between the observed and estimated values of around or above 0.99 (Table 2). This allowed us to quantify the parameters of the specific production kinetics of biogas per gram of volatile matter in the mixtures. The mixtures of 10% grease and 10–30% whey with the sludge thus appear to be very interesting in terms of co-digestion.
The values of kinetic parameters and biogas production per removed VS have been standardized, taking into account the TS test as a reference and applying Equation (3) (Table 3).
A score was determined, corresponding to the calculated average value of NP, taking a positive value for lag phases. This score is used to compare and rank the results. Taking into account the importance of some parameters, and considering the residence time in the digester, the parameter lag phase 2, K1 and k1 must be considered as essential, and should be assigned a greater weight, i.e., lag phase 2, K1 and k2 multiplied by 2.
Looking at the different scores, the addition of 10–30% grease or 10% whey would be the most preferable. Septage used as a co-substrate had a negative effect.

3.1.4. VS Removal Ratio

Looking at the removal of volatile solids, for all the tests, they were on average higher than 60% and were in line with the observed kinetics (Figure S2 in Supplementary Materials).

3.1.5. Methane Production

Significant variability in the proportion of methane in the biogas produced was observed for most of the mixtures tested (Table 4). This variability was very low for mixtures with 10% co-substrates for grease and septage.
Grease and whey alone produced low quantities of methane. This was due to an inhibition of the methanogenic flora, and only the hydrolysis–acetogenesis phase was carried out.
The 10% mixture of grease produced more methane than the thickened sludge alone and confirms its significance for co-digestion.
These results show the possibility of using grease and whey as substrates for the anaerobic co-digestion of thickened WWTP sludge. The level of 10–30% COD of the total load should not be exceeded, according to the S/I (in VS) ratios tested. These proportions would lead to a higher production of biogas and an increased methane content.
However, it is not advisable to mix more than 10% of septage as a proportion of the total COD load. For this proportion, there would be no increase in biogas production, but the methane concentration would be higher.
The second phase of the study with the CSTR reactors was carried out according to these conclusions concerning used ratios. The co-substrate septage from the septic tank has not been tested in this experiment.

3.2. Bioreactor Test

The volumetric loading rates before mixing with the co-substrates were 1.1 ± 0.22 g VS L−1 d−1 and 1.8 g ± 0.7 COD L−1 d−1. During the period of co-substrate addition, the loading rates were in the same range of values (Table 5).
The ratios expressed in COD between the substrate and the co-substrate were nominally fixed in VS at 80/20 for the TS/W mixture and 60/40 for the TS/G mixture.
The COD, VS and DM measurements made it possible to calculate the real average ratios between the substrate and co-substrate. The nominal ratios have been respected, but only for DM. For VS and COD, the ratios are 70/30 for TS/W and are close to 50/50 for TS/G.

3.2.1. Biogas Production

The observed production of biogas was of the same order as expected values for a well-conducted digester with waste activated sludge, i.e., 0.8 to 1.1 L g VSremoved−1 d−1, under the same conditions of loadings [32].
By expressing the daily production of biogas per gram of biomass (VS) in the reactor, the results show that it was the highest for the mixture with whey and the lowest for the mixture with grease. Mean values were, respectively, equal to 0.43 ± 0.11 L d−1 gVS−1 (TS/W), 0.29 ± 0.05 (TS), and 0.11 ± 0.05 (TS/G). The differences are significant at p <0.01 for the values of the mixtures, in comparison with the values for TS (Dunnett’s test, n = 33).

3.2.2. Qualitative Analysis of Biogas

The proportions of CH4 and CO2 were similar between the three feeding conditions (Table 6).
The Kruskal–Wallis test does not allow the H0 hypothesis to be rejected, with the risk of error p < 0.05. No reactor stood out significantly from the others.

3.2.3. VS and COD Removal

Analysis of the data over the entire period of the test showed a smaller reduction of volatiles and COD between the input and output for mixing with grease, while removal was greater than 80% for the other reactors (Table S2 in Supplementary Materials). This difference is statistically highly significant, at p < 0.000001. The dispersion of the data around the mean value was also greater for the mixture with grease, with a coefficient of variation of nearly 30%.
It can be observed that soluble COD had a lower removal yield than particulate COD, as total COD yield was higher than soluble COD.
The VS removal efficiency has evolved linearly over the applied load for TS and TS/W mixtures but is less clear for the TS/G mixture (Figure S3 in Supplementary Materials).
The mixture with grease was visually inhomogeneous, and deposits of grease were observed in various areas of the reactor; this could explain the poorer efficiency of this mixture for co-digestion.

3.2.4. VFA Measurements

We observed a tendency for the accumulation of volatile fatty acids over time, and more particularly for acetate (Figure 2). The total VFA concentration between day 35 and day 70 did not exceed 0.6 g L−1, except for the TS reactor at day 70, due to an accumulation of acetate. The Kruskal–Wallis test does not allow hypothesis H0 to be rejected, at the risk of error of p < 0.05, and there were, therefore, no significant differences.

3.3. Modeling with ADM1

3.3.1. Biogas Production Per Reactor

One of the greatest areas of interest in modeling is to simulate biogas production, according to variations of feeding, with the estimation of the biogas composition. The comparison of biogas production per reactor between the simulated and experimental values shows that the simulation with thickened sludge presents a satisfactory adjustment (R2 = 0.704) but includes a slight underestimation. With the whey mixture, the amplitude of the variations observed experimentally was not correctly simulated (R2 = 0.321), and for the mixture with grease, there is a slight underestimation (R2 = 0.643) (Figure 3).
The fractionation of the organic matter into its elementary substrate (amino acids, long-chain fatty acids, sugars), adjusted to the different mixtures and consideration of biodegradability of particulate matter, is insufficient to achieve a complete simulation of the real phenomenon. With the grease mixture, Monod’s equations were modified by the inhibition equation (Equation (5)) using parameter estimation to determine the value of the inhibition coefficient.
Before the addition of the co-substrate, real biogas production per reactor was slightly higher (statistically different at p < 0.00005) for the reactor with TS_W (Table 7). This higher production was shown in the simulation but was without a statistically significant difference.
The addition of whey as a co-substrate did not influence the average biogas production per reactor significantly, both in the experiment and in the simulation. The addition of grease showed a similar behavior between experiment and simulation. This influence was statistically different at p < 0.00001 for the experiment, and p < 0.005 for the simulation. In the case of the experiment, the average production was lower (9.82 L d−1 VS 11.6 L d−1 for TS) and was also lower regarding the simulation (9.11 L d−1 VS 10.01 L d−1 for TS).

3.3.2. Biogas Composition

The simulated composition of the biogas did not show any effect from the addition of the co-substrate (Figure S4 in Supplementary Materials). This confirms the observations of the experimental values.

3.3.3. pH

Simulations showed the relative stability of the pH (Figure 4), with correct adjustment to experimental values for thickened sludge, an underestimation for the mixture with grease, and an overestimation for the mixture with whey.
It was not possible to adjust the modeling using realistic parameters that were responsible for the change in pH.

3.3.4. Microbial Degraders and Population Distribution Profiles Obtained from the Simulation with ADM1

Experimental microbial population analysis has not been realized in this study, but it is possible to simulate with ADM1 the growth rate and decay of the different microorganisms involved in anaerobic digestion.
The microbial degrader population distribution obtained from the simulation shows that on each day corresponding to the addition of co-substrates, profiles were similar between the three reactors (Figure 5). On day 70, at the end of the simulation period for both experiment and simulation, the profiles were different. The main differences were observed for long-chain fatty acid degraders, sugar degraders and acetic acid degraders.

4. Discussion

Among the process parameters impacting heavily on the quantity and quality of biogas production, co-digestion that is directly linked to feedstock type is one of the main variables [33].
The results obtained with the BMP tests confirmed the positive effects of co-digestion, as has been reported in the literature, with compounds that do not inhibit anaerobic digestion [34,35].
These positive effects, especially those on biogas production and methane, are dependent on their proportions when mixed with thickened extended-aeration sludge. The results of the reactor dynamic test showed less evidence of the positive effects observed with the BMP tests and indicate mainly that co-digestion in this case had no adverse effects.
The feed-degradable COD percentage is very important, as previously shown [27,36,37], and can explain the differences observed in the BMP test and reactor test, especially for less biodegradable substrates like septage and grease.
The protein and lipid percentages of particulate biodegradable COD are important stated variables for digester stability and methane production, as predicted by the simulation [27] and confirmed in this study.
Concerning lipid percentages, laboratory- and pilot-scale anaerobic digesters have shown larger increases in gas production with the addition of readily available high-strength organic wastes, such as fats, oils, and grease (FOG) [34,38]. Co-digestion of mixed municipal sludge (primary and thickened sludge) with concentrated external organic wastes, such as FOG, can result in significantly high methane production at higher organic loading rates, and lower digester HRT/SRT values, as long as COD and VS destruction do not drop below an acceptable lower value [39]. However, the anaerobic digestion of high lipid wastes has been reported to cause the inhibition of acetoclastic and methanogenic bacteria, substrate, and product transport limitation, sludge flotation, digester foaming, blockages of pipes and pumps, and clogging of gas collection and handling systems.
The limit for FOG (grease interceptor waste) addition, leading to an inhibited digestion process, was identified to be between 20 and 40% (v/v) or 65.5 and 83.5% (w/w) of VS as added [40]. This inhibition has been observed with the BMP test and reactor test in this experiment.
Increased FOG levels extended the lag phase and eventually displayed strong or complete inhibition. Operating anaerobic digesters with FOG levels in the concentration range of 0.1–1.5% (v/v) enhanced biomethane production, resulting in a 2- to 19-fold increase. The highest biomethane production was observed at 1% FOG (19-fold increase), with a lag phase of 25 days. LCFAs were degraded by 80–90% during anaerobic digestion, following a 0.5–1.5% FOG loading. The addition of either 2% or 3% FOG permanently inhibited biomethane production, due to high VFA accumulation (17–19 g/L) and low LCFA reduction (29 and 18%), respectively. Under optimum biomethane production (1–1.5% FOG), Syntrophomonas and Fermentimonas were abundant, indicating their role in LCFA degradation and acetogenesis [41].
To avoid inhibition during high FOG loadings, this would require microbial acclimatization or substrate pretreatment [8,42,43].
Concerning whey addition, and dairy wastewater by extension, it is important to assume an organic matter load that is compatible with a CSTR process to avoid any failure of this non-adapted model in a high-strength load process [44,45]. Indeed, whey has a high C/N ratio, a low pH, and is rich in easily degradable sugars (mainly lactose), which could lead to rapid acidification in the digester and, thereby, process inhibition [46,47]. A correlation study was made on a whey/TS mixture reactor, among pH, COD load, and the production of biogas, in an attempt to explain the significant variations observed. We did not obtain any significant correlations between these parameters. The highest level shown is between the pH and the production of biogas, with a coefficient of determination R2 of only 0.44 (r = 0.66 at p = 0.00001). The pH reduction observed with this reactor seems not due to the accumulation of VFAs from the acidogenesis step, as shown by chemical analysis, but instead is probably because of the weak buffering capacity of the mixture due to acidification, as whey has a low pH. Indeed, if the change in pH reflects the excess VFA, it may also be a sign of the high production of NH4 (protein hydrolysis). It is therefore necessary to adapt the organic load to the buffering capacity of the reaction medium; the recommended VFA/alkalinity ratio is 0.2–0.5 [48].
To enhance the nutrient balance with improved pH buffering, and to optimize the production of methane, a C/N ratio of about 15–30/1 is required [12,33], and this can be reached by deploying co-digestion. Co-digestion of 10% to 30% whey with thickened sludge has shown a synergistic effect on biogas production in this study, as also observed when mixing with poorly degradable substrates [49,50].
The results of simulations with the ADM1 model adapted to co-digestion confirm that this model is a powerful tool to optimize the process of biogas production. Numerous publications have been noted, indicating that the disintegration and hydrolysis steps are limiting factors of the co-digestion process [51].
To improve ADM1 simulation with whey co-substrate, it may be possible to consider the uptake of lactate and incorporate it in the biochemical process [52]. This does not seem necessary in our case, both because of the simulation results obtained and also an overly low concentration of lactic acid in the digester when the proportions of the mixture of whey is less than 20–30%. However, in the presence of significant lactate concentration, it would be advisable to add the metabolic pathway of the transformation into methane, which can lead to complete conversion [53]:
2 lactate + 3 CO2    3 acetate    3 CH4.
Therefore, it seems important overall to respect the C/N ratios recommended for the whey/thickened sludge mixture, or other co-substrates that are rich in nitrogen to avoid excess nitrogen causing ammonia formation, together with an increase in pH, and consequently a drop in methane yield or, at the opposite end of the spectrum, nitrogen availability depletion, resulting in incomplete methanogenesis and reduced biogas productivity.
If the results obtained with the BMP test could lead to a significant increase in production, as observed in the literature for dairy whey and grease sludge [54], biomethane and, therefore, energy, the reactor tests did not validate this hypothesis satisfactorily. Process instability was observed in semi-continuous mode, with beverage wastewater as the co-substrate, which was not predicted by the BMP test [55]. BMP can be used to screen an array of substrates but is not suitable for predicting continuous performance.
As extended aeration plants necessitate high operational costs, due to high energy needs, 0.903 ± 0.509 kWh m−3 [56] additional power via co-digestion should not be considered too much to cover the energy needs. However, reactor tests confirmed good biodegradation efficiency, and the main purpose of co-digestion, in this case, is to recover energy from waste and effluents that would require even more energy to treat with this type of extended aeration process.

5. Conclusions

The results obtained confirm that it is possible to add local organic waste to the anaerobic digesters of an extended aeration wastewater treatment plant to treat the thickened sludge. This addition is even positive, as a way to valorize these effluents into biogas. To identify good practice for the procedure of co-digestion, it is necessary to abide by the designed daily volume or mass loads, as well as the residence time required for good degradation of the co-substrates. Adapted modeling using ADM1 makes it possible to estimate the proportions of the mixture to be applied, based on data from BMP tests from the literature or from specific tests, if necessary. This type of approach, combining batch testing (BMP), dynamic laboratory study, and mechanistic modeling, is to be favored. It can also be easily adapted for the study of pretreatment if necessary. It is also possible with this approach to generate the relevant data to test different technical, environmental and economic scenarios, in order to define competitive processes for industrial adoption.

Supplementary Materials

The following are available online at https://www.mdpi.com/article/10.3390/su13169199/s1, Table S1: Main characteristics for VFA and biogas analysis; Table S2: VS and COD removal; Figure S1: Diagram of a reactor; Figure S2: VS removal ratios with BMP assays; Figure S3: VS removed vs VS loads for TS, TS/W and TS/G; Figure S3: Comparison between experiments and modelling for biogas composition.

Author Contributions

Conceptualization, G.M.; methodology, G.M. and J.O; modeling, G.M.; chemical analysis, J.O.; writing—original draft preparation, G.M. and J.O; writing—review and editing, G.M., J.O. and H.B; supervision, H.B. All authors have read and agreed to the published version of the manuscript.

Funding

This research was funded in part by Veolia Recherche et Innovation, Le Chrysalis-2–4, Avenue des Canuts 69120, Vaulx-en-Velin, France.

Institutional Review Board Statement

Not applicable.

Informed Consent Statement

Informed consent was obtained from all subjects involved in the study.

Data Availability Statement

Not applicable.

Conflicts of Interest

The authors declare no conflict of interest. The funders had no role in the collection, analyses, or interpretation of data and in the writing of the manuscript.

References

  1. GREENBIRDIE; CRIGEN. Evaluation du Potentiel de Production de Biométhane à Partir des Boues Issues des Stations D’épuration des Eaux Usées Urbaines. 2015, p. 93. Available online: https://www.ademe.fr/sites/default/files/assets/documents/potentiel-production-biomethane-boues-steu-201409-rapport-final.pdf (accessed on 1 June 2021).
  2. Hreiz, R.; Latifi, M.A.; Roche, N. Optimal design and operation of activated sludge processes: State-of-the-art. Chem. Eng. J. 2015, 281, 900–920. [Google Scholar] [CrossRef] [Green Version]
  3. Appels, L.; Baeyens, J.; Degrève, J.; Dewil, R. Principles and potential of the anaerobic digestion of waste-activated sludge. Prog. Energy Combust. Sci. 2008, 34, 755–781. [Google Scholar] [CrossRef]
  4. Falipou, E.; Gillot, S.; Canler, J.P.; Perret, J.M. Anaerobic digestion of sewage sludge: State of the art for France. WRRF TSM 2020, 9, 57–69. [Google Scholar] [CrossRef]
  5. Agence de L’eau. Rhône Méditerranée Corse Méthanisation des Boues de Station D’épuration: Règle de L’art et Etat des Lieux sur les Bassins Rhône-Méditerranée et Corse; Decembre 2012; p. 56, report. Available online: https://www.eaurmc.fr/jcms/dma_40468/fr/methanisation-des-boues-de-stations-regle-de-l-art-et-etat-des-lieux-sur-les-bassins-rhone-mediterranee-et-corse (accessed on 1 May 2021).
  6. Sosnowski, P.; Wieczorek, A.; Ledakowicz, S. Anaerobic co-digestion of sewage sludge and organic fraction of municipal solid wastes. Adv. Environ. Res. 2003, 7, 609–616. [Google Scholar] [CrossRef]
  7. Edelmann, W.; Engeli, H.; Gradenecker, M. Co-digestion of organic solid waste and sludge from sewage treatment. Water Sci. Technol. 2000, 41, 213–221. [Google Scholar] [CrossRef]
  8. Grosser, A.; Neczaj, E.; Singh, B.R.; Almås, Å.R.; Brattebø, H.; Kacprzak, M. Anaerobic digestion of sewage sludge with grease trap sludge and municipal solid waste as co-substrates. Environ. Res. 2017, 155, 249–260. [Google Scholar] [CrossRef]
  9. Soni, M.N. Investigating the Inhibitory Effects of Fats, Oils and Grease Addition on Fatty Acids Degradation during Anaerobic Co-Digestion. Ph.D. Thesis, Clemson University, Clemson, SC, USA, 2018. Available online: https://tigerprints.clemson.edu/all_theses/2881 (accessed on 1 May 2021).
  10. Chow, W.L.; Chong, S.; Lim, J.W.; Chan, Y.J.; Chong, M.F.; Tiong, T.J.; Chin, J.K.; Pan, G.-T. Anaerobic Co-Digestion of Wastewater Sludge: A Review of Potential Co-Substrates and Operating Factors for Improved Methane Yield. Processes 2020, 8, 39. [Google Scholar] [CrossRef] [Green Version]
  11. Awe, O.W.; Zhao, Y.; Nzihou, A.; Minh, D.P.; Lyczko, N. Anaerobic co-digestion of food waste and FOG with sewage sludge—Realising its potential in Ireland. Int. J. Environ. Stud. 2018, 75, 496–517. [Google Scholar] [CrossRef]
  12. Yang, Q.; Wu, B.; Yao, F. Biogas production from anaerobic co-digestion of waste activated sludge: Co-substrates and influencing parameters. Rev. Environ. Sci. Biotechnol. 2019, 18, 771–793. [Google Scholar] [CrossRef]
  13. Dar, R.A.; Parmar, M.; Dar, E.A.; Sani, R.K.; Phutela, U.G. Biomethanation of agricultural residues: Potential, limitations and possible solutions. Renew. Sustain. Energy Rev. 2021, 135, 110217. [Google Scholar] [CrossRef]
  14. Batstone, J.; Keller, J.; Angledaki, I.; Kalyuzhnyi, V.S.; Pavlostathis, G.; Rozzi, A.; Sanders, W.T.M.; Siegrist, H.; Vavilin, V.A. The IWA Anaerobic Digestion Model No 1 (ADM1). Water Sci. Technol. 2002, 45, 65–73. [Google Scholar] [CrossRef] [PubMed]
  15. Rosén, C.; Jeppsson, U. Aspects on ADM1 Implementation within the BSM2 Framework; Department of Industrial Electrical Engineering and Automation, Lund Institute of Technology: Lund, Sweden, 2005; (TEIE.; Volume 7224); Available online: http://www.iea.lth.se/publications/Reports/LTH-IEA-7224.pdf (accessed on 1 March 2021).
  16. Hidaka, T.; Wang, F.; Tsumori, J. Comparative evaluation of anaerobic digestion for sewage sludge and various organic wastes with simple modeling. Waste Manag. 2015, 43, 144–151. [Google Scholar] [CrossRef]
  17. Wade, M.J. Not Just Numbers: Mathematical Modelling and Its Contribution to Anaerobic Digestion Processes. Processes 2020, 8, 888. [Google Scholar] [CrossRef]
  18. Holliger, V.; Alves, M.; Andrade, D.; Angelidaki, I.; Astals, S.; Baier, U.; Bougrier, C.; Buffière, P.; Carballa, M.; De Wilde, V.; et al. Towards a standardization of biomethane potential tests. Water Sci. Technol. 2016, 74, 2515–2522. [Google Scholar] [CrossRef] [PubMed]
  19. Angelidaki, I.; Sanders, W. Assessment of the anaerobic biodegradability of macropollutants. Envir. Sci. Biotech. 2004, 3, 117–129. [Google Scholar] [CrossRef]
  20. APHA. Standard Methods for the Examination of Water and Waste Water; American Public Health Association: Washington, DC, USA, 1998; 874p. [Google Scholar]
  21. Filer, J.; Ding, H.H.; Chang, S. Biochemical Methane Potential (BMP) Assay Method for Anaerobic Digestion Research. Water 2019, 11, 921. [Google Scholar] [CrossRef] [Green Version]
  22. Grady, C.L., Jr.; Daigger, G.T.; Love, N.G.; Filipe, C.D. Biological Wastewater Treatment, 3rd ed.; CRC: Boca Raton, FL, USA, 2011. [Google Scholar]
  23. Metcalf & Eddy; Abu-Orf, M.; Bowden, G.; Burton, F.L.; Pfrang, W.; Stensel, H.D.; Tchobanoglous, G.; Tsuchihashi, R.; AECOM (Firm). Wastewater Engineering: Treatment and Resource Recovery, 5th ed.; McGraw-Hill Education: New York, NY, USA, 2014. [Google Scholar]
  24. Reichert, P.; Schulthess, R.V.; Wild, D. The use of AQUASIM for estimating parameters of activated sludge models. Water Sci. Technol. 1995, 31, 135–147. [Google Scholar] [CrossRef]
  25. Reichert, P. AQUASIM 2.0 User Manual; EAWAG Report; Swiss Federal Institute for Environmental Science and Technology: Dübendorf, Switzerland, 1998. [Google Scholar]
  26. Derbal, K.; Bencheikh-Lehocine, M.; Cecchi, F.; Meniai, A.-H.; Pavan, P. Application of the IWA ADM1 model to simulate anaerobic co-digestion of organic waste with waste activated sludge in mesophilic condition. Bioresour. Technol. 2009, 100, 1539–1543. [Google Scholar] [CrossRef] [PubMed]
  27. Arnell, M.; Astals, S.; Åmand, L.; Batstone, D.J.; Jensen, P.D.; Jeppsson, U. Modelling anaerobic co-digestion in Benchmark Simulation Model No. 2: Parameter estimation, substrate characterisation and plant-wide integration. Water Res. 2016, 98, 138–146, ISSN 0043-1354. [Google Scholar] [CrossRef] [Green Version]
  28. Keucken, A.; Habagil, M.; Batstone, D.; Jeppsson, U.; Arnell, M. Anaerobic Co-Digestion of Sludge and Organic Food Waste—Performance, Inhibition, and Impact on the Microbial Community. Energies 2018, 11, 2325. [Google Scholar] [CrossRef] [Green Version]
  29. Fisgativa, H.; Zennaro, B.; Charnier, C.; Richard, C.; Accarion, G.; Béline, F. Comprehensive determination of input state variables dataset required for anaerobic digestion modelling (ADM1) based on characterisation of organic substrates. Data Brief 2020, 29, 105212, ISSN 2352-3409. [Google Scholar] [CrossRef] [PubMed]
  30. Champagne, C.; Li, P.; Anderson, B.C. Enhanced biogas production from anaerobic co-digestion of municipal wastewater treatment sludge and fat, oil and grease (FOG) by a modified two-stage thermophilic digester system with selected thermo-chemical pre-treatment. Renew. Energy 2015, 83, 474–482, ISSN 0960-1481. [Google Scholar]
  31. Luostarinen, S.; Luste, S.; Sillanpää, M. Increased biogas production at wastewater treatment plants through co-digestion of sewage sludge with grease trap sludge from a meat processing plant. Bioresour. Technol. 2009, 100, 79–85. [Google Scholar] [CrossRef] [PubMed]
  32. Moletta, R. La Methanisation, 3rd ed.; Editions Lavoisier: Paris, France, 2015; 513p. [Google Scholar]
  33. Sarker, S.; Lamb, J.J.; Hjelme, D.R.; Lien, K.M. A Review of the Role of Critical Parameters in the Design and Operation of Biogas Production Plants. Appl. Sci. 2019, 9, 1915. [Google Scholar] [CrossRef] [Green Version]
  34. Long, J.H.; Aziz, T.N.; Francis, L., III; Ducoste, J.J. Anaerobic co-digestion of fat, oil, and grease (FOG): A review of gas production and process limitations. Process. Saf. Environ. Prot. 2012, 90, 231–245. [Google Scholar] [CrossRef]
  35. Poulsen, T.G.; Adelard, L. Improving biogas quality and methane yield via co-digestion of agricultural and urban biomass wastes. Waste Manag. 2016, 54, 118–125. [Google Scholar] [CrossRef] [PubMed]
  36. Solon, K.; Flores-Alsina, X.; Gernaey, K.V.; Jeppsson, U. Effects of influent fractionation, kinetics, stoichiometry and mass transfer on CH4, H2 and CO2 production for (plant-wide) modeling of anaerobic digesters. Water Sci. Technol. 2015, 71, 870–877. [Google Scholar] [CrossRef] [PubMed] [Green Version]
  37. Galí, A.; Benabdallah, T.; Astals, S.; Mata-Alvarez, J. Modified version of ADM1 model for agro-waste application. Bioresour. Technol. 2009, 100, 2783–2790. [Google Scholar] [CrossRef]
  38. Amha, Y.M.; Sinha, P.; Lagman, J.; Gregori, M.; Smith, A.L. Elucidating microbial community adaptation to anaerobic co-digestion of fats, oils, and grease and food waste. Water Res. 2017, 123, 277–289. [Google Scholar] [CrossRef]
  39. Tandukar, M.; Pavlostathis, S.G. Co-digestion of municipal sludge and external wastes for enhanced biogas production under realistic plant constraints. Water Res. 2015, 87, 432–445. [Google Scholar] [CrossRef]
  40. Wang, L.; Aziz, T.N.; de los Reyes, F.L. Determining the limits of anaerobic co-digestion of thickened waste activated sludge with grease interceptor waste. Water Res. 2013, 47, 3835–3844. [Google Scholar] [CrossRef] [PubMed]
  41. Usman, M.; Zha, L.; Abomohra, A.E.; Li, X.; Zhang, C.; Salama, E.S. Evaluation of animal- and plant-based lipidic waste in anaerobic digestion: Kinetics of long-chain fatty acids degradation. Crit. Rev. Biotechnol. 2020, 40, 733–749. [Google Scholar] [CrossRef] [PubMed]
  42. Merlin, G.; Boileau, H. Anaerobic digestion of agricultural waste: State of the art and future trends. In Anaerobic Digestion: Types, Processes and Environmental Impact; Torres, A., Ed.; Nova Science Publishers, Inc.: New York, NY, USA, 2013. [Google Scholar]
  43. Merlin, G.; Kohler, F.; Bouvier, M.; Lissolo, T.; Boileau, H. Importance of heat transfer in an anaerobic digestion plant in a continental climate context. Bioresour. Technol. 2012, 124, 59–67. [Google Scholar] [CrossRef] [PubMed]
  44. Elalami, D.; Carrere, H.; Monlau, F.; Abdelouahdi, K.; Oukarroum, A.; Barakat, A. Pretreatment and co-digestion of wastewater sludge for biogas production: Recent research advances and trends. Renew. Sustain. Energy Rev. 2019, 114, 109287. [Google Scholar] [CrossRef]
  45. Fang, C.; Boe, K.; Angelidaki, I. Biogas production from potato-juice, a byproduct from potato-starch processing, in upflow anaerobic sludge blanket (UASB) and expanded granular sludge bed (EGSB) reactors. Bioresour. Technol. 2011, 102, 5734–5741. [Google Scholar] [CrossRef] [PubMed]
  46. Traversi, D.; Bonetta, S.; Degan, R.; Villa, S.; Porfido, A.; Bellero, M.; Carraro, E.; Gilli, G. Environmental advances due to the integration of food industries and anaerobic digestion for biogas production: Perspectives of the italian milk and dairy product Sector. Bioenergy Res. 2013, 6, 851–863. [Google Scholar] [CrossRef]
  47. Hagen, L.H.; Vivekanand, V.; Linjordet, R.; Pope, P.B.; Eijsink, V.G.; Horn, S.J. Microbial community structure and dynamics during co-digestion of whey permeate and cow manure in continuous stirred tank reactor systems. Bioresour. Technol. 2014, 171, 350–359. [Google Scholar] [CrossRef]
  48. Siciliano, A.; Limonti, C.; Curcio, G.M.; Calabrò, V. Biogas Generation through Anaerobic Digestion of Compost Leachate in Semi-Continuous Completely Stirred Tank Reactors. Processes 2019, 7, 635. [Google Scholar] [CrossRef] [Green Version]
  49. Hublin, A.; Zelić, B. Modelling of the whey and cow manure co-digestion process. Waste Manag. Res. 2013, 31, 353–360. [Google Scholar] [CrossRef]
  50. Vivekanand, D.; Mulat, G.; Eijsink, V.G.H.; Horn, S.J. Synergistic effects of anaerobic co-digestion of whey, manure and fish ensilage. Bioresour. Technol. 2018, 249, 35–41. [Google Scholar] [CrossRef]
  51. Hagos, K.; Zong, J.; Li, D.; Liu, C.; Lu, X. Anaerobic co-digestion process for biogas production: Progress, challenges and perspectives. Renew. Sustain. Energy Rev. 2017, 76, 1485–1496, ISSN 1364-0321. [Google Scholar] [CrossRef]
  52. García-Gen, S.; Lema, J.M.; Rodríguez, J. Generalised modelling approach for anaerobic co-digestion of fermentable substrates. Bioresour. Technol. 2013, 147, 525–533. [Google Scholar] [CrossRef]
  53. Yang, S.T.; Tang, I.C. Methanogenesis from lactate by a co-culture of Clostridium formicoaceticum and Methanosarcina mazei. Appl. Microbiol. Biotechnol. 1991, 35, 119–123. [Google Scholar] [CrossRef]
  54. Donoso-Bravo, A.; Ortiga, V.; Lesty, Y.; Vanden Bossche, H.; Olivares, D. Addressing the synergy determination in anaerobic co-digestion and the inoculum activity impact on BMP test. Water Sci. Technol. 2019, 80, 387–396. [Google Scholar] [CrossRef]
  55. Donoso-Bravo, A.; Ortega, V.; Lesty, Y.; Vanden Bossche, H.; Olivares, D. Assessing the stability of anaerobic co-digestion in the context of a WWTP with thermal pre-treatment of sewage sludge. Case study in Chile. Waste Manag. 2019, 100, 240–248. [Google Scholar] [CrossRef] [PubMed]
  56. Siatou, A.; Manali, A.; Gikas, P. Energy Consumption and Internal Distribution in Activated Sludge Wastewater Treatment Plants of Greece. Water 2020, 12, 1204. [Google Scholar] [CrossRef]
Figure 1. Cumulated biogas production for different mixtures in BMP assays. (A) Grease; (B) Septage; (C) Whey. TS: Thickened sludge; G: grease; SP: septage; W: whey. The numbers represent the mixture ratio in their respective percentages. Lines correspond to modeling using Equations (1) or (2).
Sustainability 13 09199 g001
Figure 2. VFA concentrations on different days. TS: thickened sludge; TS/W: thickened sludge/whey; TS/G: thickened sludge/grease.
Sustainability 13 09199 g002
Figure 3. Comparison of biogas flow between experiments (dots) and modeling (dotted lines). (A) TS: thickened sludge; (B) TS_W: thickened sludge/whey; (C) TS_G: thickened sludge/grease.
Sustainability 13 09199 g003aSustainability 13 09199 g003b
Figure 4. Comparison for pH evolution between experiments (dots) and modeling (lines). TS: thickened sludge; TS_W: thickened sludge/whey; TS_G: thickened sludge/grease.
Sustainability 13 09199 g004
Figure 5. Biomass degrader distribution profiles obtained from the simulation with ADM1. Xaa: amino-acid biomass; Xpro: propionic biomass; Xac: acetic acid biomass; Xc4: valeric/butyric biomass; Xfa: long-chain fatty acid biomass; Xsu: sugar biomass; h2: hydrogen biomass.
Sustainability 13 09199 g005
Table 1. Main characteristics of BMP substrates and inoculum (Average ± SD).
InoculumThickened SludgeGreaseSeptageWhey
DM (g·L−1)36.5 ± 0.536.8 ± 3.244.8 ± 0.542.3 ± 3.355.8 ± 3.8
VS (g·L−1)22.2 ± 0.325.6 ± 0.337.2 ± 0.326.3 ± 0.448 ± 0.5
COD (g·L−1)42.4 ± 265.9 ± 2.872.5 ± 12.923.2 ± 1.1269.4 ± 4
COD/VS1.92.571.950.881.45
DM: Dry matter; VS: volatile solids; COD: chemical oxygen demand.
Table 2. Kinetic parameters and biogas production rates per removed VS of BMP assays.
* BMP
Reactor
λ1
(d)
λ2
(d)
k1
(LgVS−1d−1)
k2
(LgVS−1d−1)
K1
(LgVS−1)
K2
(LgVS−1)
R2
TS 1001.5130.0150.0510.20.480.993
G 1000210.0120.0250.030.820.998
TS/G 90/1006.50.0270.040.180.620.993
TS/G 70/30010.40.0270.0540.10.680.997
TS/G 50/50010.40.0280.0580.090.780.996
SP 100180.0040.0170.220.050.977
TS/SP 90/1006.50.020.0260.240.460.993
TS/SP 70/3008.20.010.0230.020.310.993
TS/SP 50/50014.10.0080.0170.050.190.995
W 1000NaN0.034NaN0.245NaN0.975
TS/W 90/101NaN0.035NaN0.68NaN0.993
TS/W 70/30040.0210.0210.10.750.991
TS/W 50/50016.30.0190.0120.20.520.985
* TS: Thickened sludge; G: grease; SP: septage; W: whey. The numbers represent the mixture ratio in its respective percentages.
Table 3. Normalized parameters, taking into account TS as a reference.
* BMP Reactorλ1λ2k1k2K1K2Score
TS 1000.000.000.000.000.000.000.00
G 100−1.000.62−0.20−0.51−0.850.71−0.12
TS/G 90/10−1.00−0.500.80−0.22−0.100.290.39
TS/G 70/30−1.00−0.200.800.06−0.500.420.30
TS/G 50/50−1.00−0.200.870.14−0.550.630.35
SP 100−0.33−0.38−0.73−0.670.10−0.90−0.26
TS/SP 90/10−1.00−0.500.33−0.490.20−0.040.25
TS/SP 70/30−1.00−0.37−0.33−0.55−0.90−0.35−0.21
TS/SP 50/50−1.000.08−0.47−0.67−0.75−0.60−0.35
W 100−1.00NaN1.27NaN0.23NaN0.58
TS/W 90/10−0.33NaN1.33NaN2.40NaN1.39
TS/W 70/30−1.00−0.690.40−0.59−0.500.560.29
TS/W 50/50−1.000.250.27−0.760.000.080.04
* TS: Thickened sludge; G: grease; SP: septage; W: whey. The numbers represent the mixture ratio in its respective percentages.
Table 4. Methane production with BMP assays.
% CH4normoL CH4 gVSr−1
BMP ReactorAverageSDAverageSD
TS 10062.139.30.4160.085
G 10034.4014.90.3270.171
TS/G 90/1069.851.60.6690.082
TS/G 70/3067.864.60.6570.041
TS/G 50/5062.3417.30.6990.109
SP 10041.2514.40.1400.053
TS/SP 90/1069.162.20.4530.114
TS/SP 70/3070.020.60.2470.023
TS/SP 50/5065.3812.20.1600.038
W 1004.261.60.0160.003
TS/W 90/1062.065.90.7190.258
TS/W 70/3055.05130.6580.030
TS/W 50/5043.952.10.2960.028
Note: TS: thickened sludge; G: grease; SP: septage; W: whey. The numbers represent the mixture ratio in its respective percentages.
Table 5. Volumetric loading rates during the period of co-substrate mixing.
Volumetric Loading RatesTSTS/WTS/G
COD2.5 ± 0.62.5 ± 0.62.6 ± 0.6
VS1.1 ± 0.31.3 ± 0.51.3 ± 0.2
DM1.8 ± 0.41.8 ± 0.41.7 ± 0.2
Mean values ± SD in g L−1 d−1; DM: dry matter; VS: volatile solids; COD: chemical oxygen demand; TS: thickened sludge; TS/W: thickened sludge/whey; TS/G: thickened sludge/grease.
Table 6. Proportions of CH4 and CO2 in biogas.
Biogas Composition (%)TSTS/WTS/G
CH471.3 ± 1.369.7 ± 5.468.7 ± 1.5
CO228.7 ± 1.330.3 ± 5.431.3 ± 1.5
TS: thickened sludge; TS/W: thickened sludge/whey; TS/G: thickened sludge/grease.
Table 7. Comparison between experimental and modeling results for daily biogas production per reactor.
Experimental Results
(L d−1)
Modeling Results (L d−1)
TSTS_WTS_GTSTS_WTS_G
Before co-substrate additionAverage7.328.81 *7.025.746.754.71
±SD1.320.980.502.012.641.61
Median6.509.006.905.105.583.91
After co-substrate additionAverage11.6111.949.82 *10.0110.189.11 *
±SD1.522.702.051.741.961.47
Median11.8012.309.9010.7910.439.17
* Statistically different; TS: thickened sludge; TS_W: thickened sludge/whey; TS_G: thickened sludge/grease.
Publisher’s Note: MDPI stays neutral with regard to jurisdictional claims in published maps and institutional affiliations.

