1. Introduction
The four domains of sustainability, as defined by the Food and Agriculture Organ- ization (FAO) in 2010 [
1] are health, economics, society, and the environment. For each domain, there exist context-specific metrics and measures [
2]. The healthfulness—or more correctly—the nutritional value of individual foods and habitual food patterns has been measured using nutrient profiling methods [
3]. Economic access to food has been measured in terms of food price and food affordability, the latter calculated as the relation between food prices and the prevailing wages or incomes [
4,
5]. Social aspects of sustainable food systems have been measured using any number of constructs, from consumer preferences, attitudes, and behaviors to labor issues and the perceived value of food systems to society [
6,
7]. Finally, the environmental cost of food systems has been measured in terms of energy, water, and land uses that are associated with food production, distribution, retail, consumption, disposal and waste [
8,
9].
The present focus is on the economic dimension of sustainability as it applies to food and nutrition security globally. Nutrition security has been conceptualized in terms of sufficient calories, adequate nutrients, or the diversity of food sources [
10,
11]. Here, we need to distinguish between the availability of foods that are merely adequate in 44 calories and those foods that are healthy, in the sense of being both energy-sufficient and nutrient-rich. Nutrition security requires both calories and nutrients. The next important distinction is between nutrient density, as measured by nutrient profiling methods, and affordable nutrient density, as indexed by a favorable relation between a food’s monetary cost and its nutritional value [
12]. Sustainable healthy diets, in FAO terminology, are built of affordable nutrient-rich foods. Dietary diversity, often assessed using short dietary screeners, is an additional proxy measure of dietary adequacy, especially in lower-income nations.
The affordability of healthy foods is an economic indicator that is directly relevant to the concept of food security, also promoted by the FAO [
13]. The four components of food security are food availability, food access, utilization, and stability, the latter referring to the absence of social and economic shocks. Of these, food access is most closely linked to affordable nutrient density, that is the ability to acquire health sustainable diets. The FAO report defined food cost as “the price per unit for each food item multiplied by the quantity of the food item” and described the monetary value of the diet as “the sum of the value of all the food items that make up the diet” [
11]. By contrast, the affordability of diet was defined as the monetary value of the diet relative to individual or population income [
11]. The concept of affordable nutrient density, recently launched by the FAO, draws on the health and economic domains of sustainability, and has additional implications for measuring the environmental cost of food production.
2. Economic Indicators of Food Access
2.1. Food Prices
Governments monitor food prices as part of routine economic surveillance. For example, the Consumer Price Index in the USA and UK, provide benchmarks for the food prices at retail [
14,
15]. Typically these indices are based on a representative market basket of foods and beverages with prices that are systematically sampled over time. For economic surveillance to become nutrition surveillance, food prices need to be linked with the nutrient composition of foods. Food cost per calorie or per nutrient then becomes an economic indicator of diet quality and population health.
Nutrition-relevant price comparisons become possible if the market basket were to be stratified by food group [
16]. This allows the comparison of e.g., retail prices for fruits and vegetables with retail prices for processed snack foods or prices of sugar-sweetened beverages with those for 100% fruit juice and milk. Between-group comparisons can provide insights into the economics of food choice behavior and may help explain why consumers often select lower-cost, unhealthy foods as opposed to healthier alternatives.
To allow price comparisons across food groups, food prices need to be standardized in some way. The monetary cost of food has been measured in several ways [
17]. As shown in
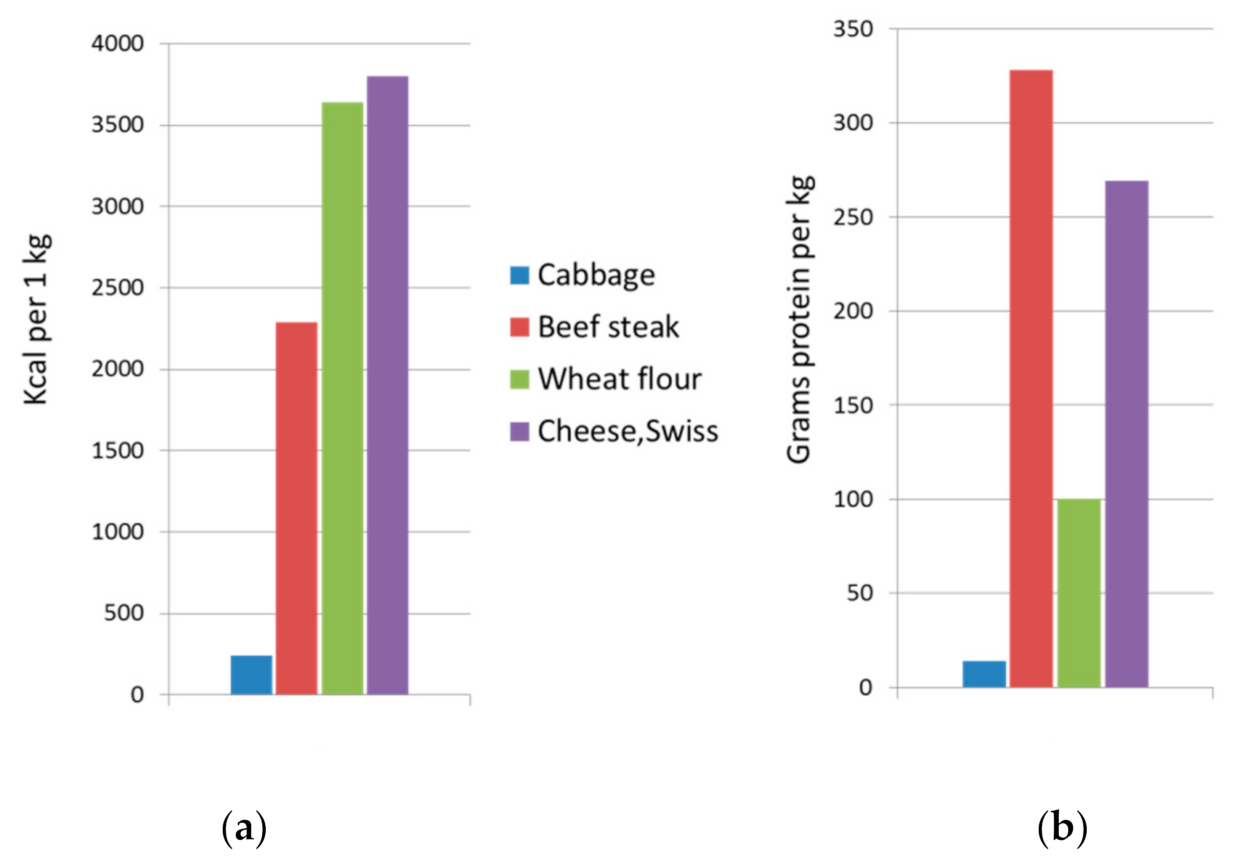
Table 1, food can be priced per kilogram of weight, per 1000 kcal, per standard serving, or per the amount of some essential nutrient such as high-quality protein. The choice of the denominator has implications for nutrition economics. As shown in
Figure 1, one kilogram of cabbage is very different from one kilogram of beef steak, wheat flour, and Swiss cheese in both energy and protein content. First, low-cost cabbage is 90% water. While water contributes to food weight and so determines energy density (kcal/g), it provides no nutrients and no calories. The low price of cabbage (per kilogram) can be misleading when it comes to the relation between food price and its nutritional value.
Calculations of affordability that are based on food weight tend to produce different cost estimates from those that are based on food energy or food nutrient content. depending on the food’s energy density that is largely driven by its moisture or water content [
18].
Table 2 below shows the relative prices of cabbage, bread, ground beef and whole milk calculated per 100 g, 100 kcal or per 100% Daily Value of protein.
Table 3 shows corresponding calculations for the environmental cost of foods in terms of greenhouse gas emissions.
There are ongoing debates regarding the appropriate standardization of food prices [
17,
18]. Fruit and vegetables are eminently affordable when priced by weight; less so when priced per 2000 kcal energy ration. Food affordability can vary depending on whether prices are calculated per calorie or per nutrient. While expensive as sources of calories, fruits are low-cost sources of vitamin C, whereas milk and dairy products are low-cost sources of calcium. But when it comes to essential nutrients, high quality protein is the nutrient of most interest. Among its lowest-cost sources in the US are eggs, milk, and dairy [
13].
Interestingly, greenhouse gas emissions and water use that are associated with agricultural production are typically calculated per kilogram of food or beverage [
20]. The notion that fruits and vegetables, including green, leafy vegetables, have a low carbon footprint owes a great deal to the current method of calculating the environmental cost of food production on a kilogram basis. Arguably, calculating the monetary or environmental costs of food per kilogram is not relevant to food access, to nutrition security, or to population health. Calculating the environmental cost of planet-friendly cabbage per 2000 kcal or per 1 kg of high-quality protein could produce results that are drastically different from what is commonly reported [
22].
2.2. Affordability of Food and Diet
By some measures, the United States has the most affordable food supply in the world. In 2019, American households spent an average of 9.5% of their disposable incomes on food [
19], a percentage that has held remarkably steady over the last 20 years. This is a deviation from much of history, when households spent upwards of 50% of their incomes on sustenance, and stands in contrast low- and middle-income countries, where food expenditures still make up between 30% and 40% of incomes.
For Americans and other residents of high-income countries, the relatively small percentage of income required for the purchase of food has been celebrated as a triumph of innovation and productivity and maintaining an affordable food supply is a policy objective. Farm bureaus around the US promote the message of affordable food supply each year in the so-called “Food Checkout Week”, the week during the year (typically in February) when American households have earned enough to cover their food expenses for the entire year [
20]. The Canadian Federation of Agriculture promotes a similar point in their “Food Freedom Day” [
21].
Even with an affordable food supply, diet quality in the US and in other high-income countries follow a socioeconomic gradient. Historically, being poor meant being hungry. This is still largely true in low- and middle-income countries, where an estimated 690 million people are chronically hungry [
25]. With hunger come various forms of malnutrition: Globally, 462 million adults are underweight and 149 million children are stunted, primarily in low- and lower-middle income countries [
26]. However, the advent of low-cost dietary energy from refined grains, added sugars and vegetable oils has made it possible to obtain “empty” calories at a relatively low cost. Poverty and other socioeconomic disadvantages still limit the affordability of healthy nutrient rich diet. However, calories have become affordable even if nutrients are not [
27]. Obesity, once mostly observed in high-income countries, has become increasingly prevalent in low-income countries [
28].
More nuanced indicators of affordability, linked to the prices of different food groups can predict dietary risks and poor health outcomes. Generally, on a per calorie basis, healthier foods and healthier diets cost more [
29]. The cost differential between healthy foods and starchy staples can predict prevalence of underweight and obesity [
30]. The low cost of “empty” calories from sugar and refined grains provides an economic reason why obesity and non-communicable diseases are becoming prevalent among the world’s poor. Limited access to healthy foods and healthy diets leads lower-income groups toward more low cost processed foods and to worse health outcomes [
27,
29].
In general, higher-quality diets have been associated with higher estimated diet cost and with higher reported food expenditures. Not surprisingly, some diets that were specifically designed to be healthy turned out to be beyond the economic reach of the global poor [
30]. For example, the estimated cost of the EAT-Lancet food plan, designed as the planetary benchmark for healthy eating, was well above the global poverty line. Despite its reliance on planet friendly plant foods, the EAT-Lancet food plan was deemed not affordable to more than 3 billion people [
30]. There is an urgent need to assure affordable nutrient density for all as noted in a recent FAO report [
11]. The present goal is to outline some economic indicators of food security and access to healthy foods.
3. Food Insecurity in the US and Globally
Food insecurity refers to limited or uncertain ability to acquire safe and acceptable foods. Here the major distinction is between low food security and very low food security, sometimes referred to as food insecurity with hunger [
31]. Low food security refers to reduced variety, quality, and appeal of food, without a reduction in energy intakes. Very low food security involves a reduction in energy intakes and a disruption of eating patterns, usually for economic reasons. Food insufficiency, a term used in federal surveys in the US means that households sometimes or often did not have enough to eat [
31].
The concept of affordability links food prices to wages and incomes. The current hierarchy of food prices in the US and elsewhere is such that energy-dense foods of minimal nutritional value typically cost less (per 2000 kcal) than do the recommended healthier and more “prudent” foods. Not surprisingly, diet quality has been linked to the household purchasing power and other indices of socio-economic status. Yet the prevailing view in the US, reinforced by the USDA [
18] is that households across all economic strata are equally able to afford a healthy diet. However, it is well known that food expenditures vary with social class. Percent of disposable income that a household spends on food is a very reliable index of socioeconomic status. Consistent with Engel’s Law, higher-income households (and higher income countries) spend more money but a lower proportion of their income on food.
4. From Nutrient-Based to Food-Based Dietary Guidance
National dietary guidelines globally have become increasingly food-based as op- posed to nutrient-based. However, the current emphasis on healthy foods and healthy food patterns in the Dietary Guidelines for Americans (DGAs) is not without economic consequences. Without forgetting about dietary adequacy and moderation, the 2020 DGAs were largely formulated in terms of healthy food patterns and desirable food groups [
32].
It is worth noting that the current research trend away from individual nutrients and toward the evaluation of habitual food patterns marks a paradigm shift in nutritional epidemiology. At one time, studies tried to link the consumption of a given nutrient to a specific health outcome, adjusting for all possible covariates, including presumed indices of socioeconomic status [
33,
34]. In many such studies, socioeconomic status was either missing, incomplete, or was represented by proxy variables, such as smoking or physical activity [
35]. In general, research showed that more expensive (and more nutrient-rich) diets consumed by better educated and wealthier people were indeed associated with more favorable health outcomes. Relatively few studies have addressed food prices or diet costs in relation to diet quality or population health [
36,
37,
38,
39,
40].
Individual nutrients can be cheap or expensive, depending on their food source [
40]. Much of the very early research conducted by the US Department of Agriculture centered on identifying those foods that provided calories, protein, and essential nutrients for the lowest cost [
12]. The goal was to provide affordable calories and affordable nutrients to low-income Americans. Protein in a given diet can come from salmon and steak or from less expensive rice and beans. More costly fresh spinach and inexpensive white potatoes and are both rich sources of potassium. Vitamin C can come from fresh berries and from frozen orange juice [
12].
One of the main advantages of the nutrient-based approach to dietary guidance was that consumers could be steered toward nutritious but lower-cost food choices. The Thrifty Food Plan, essentially a mathematical optimization model, was intended to satisfy nutrient requirements at minimum cost [
41]. Protein, for example, was supplied by frozen ground turkey, and vitamin C by frozen orange juice from concentrate. These lower cost options become less viable as the dietary guidelines become increasingly food based. The cost dimension becomes ever more important as the dietary guidance calls for specific foods that are fresh, unprocessed, local, or organic.
Now that the DGAs specifically recommend consuming more seafood, whole fruit, and leafy green vegetables, the question of substituting lower-cost food sources of some key nutrients becomes moot. As noted below, each progressive edition of the DGAs seems to favor the inclusion of more expensive foods in the habitual diet. Yet high food prices are among the key barriers to accessing sufficient, safe and nutritious foods, especially among lower-income groups [
27].
5. The Healthy Eating Index in Relation to Diet Cost
The HEI (Healthy Eating Index) measures adherence to the DGAs [
42]. The initial HEI issued in 1995 was a 100-point scale based on subcomponents that were built around dietary adequacy, moderation, and variety [
43]. The HEI is revised every 5 years, with each successive edition attempting to capture the intent of the dietary guidelines [
43]. As the DGA began to feature more costly foods, the HEI scores followed suit.
For example, vegetables were split into leafy green and deep orange vegetables while lower cost potatoes (a vegetable) were grouped with starches. Fruit group was separated into less expensive juice and more costly whole fruit. Seafood was added as category. Negative scores were awarded to low-cost refined grains and to foods containing added sugars and saturated fats. Giving higher HEI scores to diets composed of more costly (and more nutrient rich) foods reportedly improved the observed association with health outcomes. However, there was also the potential for a greater confounding with diet cost and with consumer socioeconomic status. As documented before, adherence to dietary guidelines in the US and UK does have economic consequences [
36].
The USDA has created Healthy Eating Patterns primarily to show how the DGAs could be met in a variety of ways. The three Healthy Patterns were Healthy Vegetarian; Healthy US Style and Healthy Mediterranean eating patterns [
44]. A recent analyses of food pattern cost showed that each of the healthy patterns was of higher quality but also more expensive than the current US diet [
45]. The USDA Healthy Food Patterns were lower in solid fats, sugars, and sodium but higher in protein, fiber, vitamins, and minerals. However, the recommended US-Style Pattern cost
$8.27/d, the Vegetarian Pattern cost
$5.90/d, and the Mediterranean Pattern cost
$8.73/d. By comparison, the existing US diets, as observed from NHANES data, cost much less: the estimated were
$5.47/d for Hispanics,
$5.48/d for African-Americans,
$5.94/d for Whites and
$6.57/d for Asians [
45]. Unequal access to healthy foods affects food security and is one cause of the observed societal inequities in diet quality and health.
Given that the availability and access to healthy foods are often limited by socio-economic factors, food insecurity in the US has been linked to prevalent overweight. Even though healthier diets generally cost more, there is also a great deal of individual variability in estimated cost for same-quality diets. People who achieve healthier diets at relatively low cost have been identified as being “nutrition resilient” [
46]. Being able to nutrition resilient may have to do (in the US) with ethnic food patterns, plant-based diets, and the ability to prepare meals at home. There are ongoing studies to identify the social characteristics of resilient people and the chief components of their diets.
6. Nutrient Profiling and Food Prices
The main purpose of nutrient profiling models is to help implement dietary guidelines and to address issues of public health concern. Among high-income countries, limiting excess calories, fat, sugar, and salt was the issue of public health concern. By contrast, low- and middle-income countries still face problems of undernutrition and micronutrient inadequacies. The definition of what constitutes a healthy food is context specific and depends on population needs.
There are differences, but also similarities, between food-based dietary guidelines and the existing nutrient profiling (NP) models. Whereas dietary guidelines apply to food patterns and to total diets, NP models were specifically designed to assess nutrient density of individual foods. Whereas dietary guidelines have emphasized foods and food patterns, most NP models remain wholly nutrient based. Although some NP models award extra scores depending on the food’s content of fruits, vegetables, legumes or nuts, priority is given to energy density and nutrients of public health concern: fat, sugar and sodium.
NP models are generally designed to separate energy dense foods from those that are nutrient dense or nutrient rich. Whereas energy density of foods is defined as kcal/100 g, nutrient density is typically defined in terms of nutrient content per reference amount of food—100 g, 100 kcal, or per serving. That separation has immediate economic consequences. One problem is that dietary energy from refined grains, added sugars and vegetable oils is relatively inexpensive; by contrast most nutrient rich foods cost more, especially those that are unprocessed, fresh and/or organic. As a result, foods identified as “healthy” by NP models are not only nutrient rich, but also tend to be more expensive. Energy density and nutrient density tend to be inversely linked.
Nutrient density is often conceptualized as the partial or total absence from foods of fat, sugar, and salt. These are known as nutrients to limit. In many NP models, foods are penalized for excessive amounts of saturated fat, total or added sugar and sodium and sometimes for excessive calories. However, the concept of nutrient density can also include beneficial positive nutrients, known as nutrients, to encourage. In NP models, nutrients to encourage typically include protein, fiber and a range of vitamins and minerals. The vitamins and minerals are selected for inclusion in NP models depending on public health objectives and local or regional nutrition needs at the population level.
In past studies, we have added affordability measures to NP methods [
12]. Every NP model that separates energy dense foods from those that are nutrient rich also shows that nutrients are expensive—empty calories are cheap. Dividing nutrients per serving by cost per serving gives a measure of cost per nutrient. This can be expressed in different ways, notably in relation to prevailing incomes in different countries or areas.
7. Conclusions
The definition of food security as promoted by the FAO emphasizes having uninterrupted economic access to sufficient, safe, and nutritious food to meet both food preferences and dietary needs. Affordable nutrient density, is an indicator of individual or population access to acquiring a healthy and nutritious diet. Availability is more linked to food production whereas utilization refers to non-food inputs in the pathway to better health.
The FAO has also noted that diets need to be both healthy and sustainable. Although many exceptions apply, healthier food patterns not only cost more but also have a higher carbon footprint. Future studies on the monetary and environmental cost of sustainable healthy diets will require an interdisciplinary approach that joins epidemiology with social sciences, economics, and the study of the environment. In particular, there is a pressing need to develop a toolbox of social and economic indicators that are related to the affordability and environmental cost of sustainable healthy diets [
47]. Policy makers need to recognize that the four domains of sustainability are nutrient density, economics, society, and the environment.
Author Contributions
Conceptualization, A.D. and N.D.; methodology, A.D. and P.M.; writing—original draft preparation, A.D.; writing—review and editing, A.D., N.D., P.M. All authors have read and agreed to the published version of the manuscript.
Funding
This research was funded by Dairy Management Inc.
Institutional Review Board Statement
Not applicable.
Informed Consent Statement
Not applicable.
Data Availability Statement
Not applicable.
Conflicts of Interest
A.D. has received grants, contacts, and honoraria from public agencies, nonprofit organizations, and private entities with an interest in nutrient profiling and in assessing the nutrient density of food patterns and the total diet. P.M. and N.D. declare no conflict of interest. The funders had no role in the design of the study; in the collection, analyses, or interpretation of data; in the writing of the manuscript, or in the decision to publish the results.
References
- Burlingame, B.; Dernini, S. Sustainable Diets and Biodiversity Directions and Solutions for Policy, Research and Action; FAO: Rome, Italy, 2012. [Google Scholar]
- Drewnowski, A.; Finley, J.; Hess, J.M.; Ingram, J.; Miller, G.; Peters, C. Toward healthy diets from sustainable food systems. Curr. Dev. Nutr. 2020, 4, nzaa083. [Google Scholar] [CrossRef]
- Fulgoni, V.L., III; Keast, D.R.; Drewnowski, A. Development and validation of the nutrient-rich foods index: A tool to measure nutritional quality of foods. J. Nutr. 2009, 139, 1549–1554. [Google Scholar] [CrossRef] [Green Version]
- Herforth, A.; Bai, Y.; Venkat, A.; Mahrt, K.; Ebel, A.; Masters, W.A. Cost and affordability of healthy diets across and within countries. In Background Paper for the State of Food Security and Nutrition in the World 2020; FAO: Rome, Italy, 2020. [Google Scholar]
- Bai, Y.; Alemu, R.; Block, S.A.; Headey, D.; Masters, W.A. Cost and affordability of nutritious diets at retail prices: Evidence from 177 countries. Food Policy 2021, 99, 101983. [Google Scholar] [CrossRef]
- Johnston, J.L.; Fanzo, J.C.; Cogill, B. Understanding sustainable diets: A descriptive analysis of the determinants and processes that influence diets and their impact on health, food security, and environmental sustainability. Adv. Nutr. 2014, 5, 418–429. [Google Scholar] [CrossRef] [Green Version]
- Nicholls, E.; Ely, A.; Birkin, L.; Basu, P.; Goulson, D. The contribution of small-scale food production in urban areas to the sustainable development goals: A review and case study. Sustain. Sci. 2020, 15, 1–15. [Google Scholar] [CrossRef] [Green Version]
- Perignon, M.; Vieux, F.; Soler, L.-G.; Masset, G.; Darmon, N. Improving diet sustainability through evolution of food choices: Review of epidemiological studies on the environmental impact of diets. Nutr. Rev. 2017, 75, 2–17. [Google Scholar] [CrossRef] [PubMed] [Green Version]
- Gazan, R.; Brouzes, C.M.C.; Vieux, F.; Maillot, M.; Lluch, A.; Darmon, N. Mathematical optimization to explore tomorrow’s sustainable diets: A narrative review. Adv. Nutr. 2018, 9, 602–616. [Google Scholar] [CrossRef] [PubMed]
- Fanzo, J.; Drewnowski, A.; Blumberg, J.; Miller, G.; Kraemer, K.; Kennedy, E. Nutrients, foods, diets, people: Promoting healthy eating. Curr. Dev. Nutr. 2020, 4, nzaa069. [Google Scholar] [CrossRef] [PubMed] [Green Version]
- FAO; IFAD; UNICEF; WFP; WHO. The State of Food Security and Nutrition in the World 2020: Transforming Food Systems for Affordable Healthy Diets; FAO: Rome Italy, 2020. [Google Scholar]
- Drewnowski, A. The cost of US foods as related to their nutritive value. Am. J. Clin. Nutr. 2010, 92, 1181–1188. [Google Scholar] [CrossRef] [PubMed] [Green Version]
- Cuesta, J.; Htenas, A.; Tiwari, S. Monitoring global and national food price crises. Food Policy 2014, 49, 84–94. [Google Scholar] [CrossRef]
- USDA ERS—Consumer and Producer Price Indexes. Available online: https://www.ers.usda.gov/topics/food-markets-prices/consumer-and-producer-price-indexes/ (accessed on 16 June 2021).
- Food Statistics in Your Pocket: Prices and Expenditure—GOV.UK. Available online: https://www.gov.uk/government/statistics/food-statistics-pocketbook/food-statistics-in-your-pocket-prices-and-expenditure (accessed on 16 June 2021).
- Christian, T.; Rashad, I. Trends in US food prices, 1950–2007. Econ. Hum. Biol. 2009, 7, 113–120. [Google Scholar] [CrossRef]
- Jones, N.R.V.; Monsivais, P. Comparing Prices for Food and Diet Research: The Metric Matters. J. Hunger Environ. Nutr. 2016, 11, 370–381. [Google Scholar] [CrossRef]
- Carlson, A.; Frazão, E. Are Healthy Foods Really More Expensive? It Depends on How You Measure the Price; USDA-ERS: Washington, DC, USA, 2012.
- USDA ERS—Interactive Charts: Food Expenditures. Available online: https://www.ers.usda.gov/data-products/food-expenditure-series/interactive-charts-food-expenditures/ (accessed on 16 June 2021).
- Florida Farm Bureau. Available online: https://www.floridafarmbureau.org/fcoweek/ffbf_foodcheckoutweek_2020_socialmedia_posts_2/ (accessed on 16 June 2021).
- Food Freedom Day CFA-FCA. Available online: https://www.cfa-fca.ca/programs-and-projects/food-freedom-day/ (accessed on 17 June 2021).
- Poore, J.; Nemecek, T. Reducing food’s environmental impacts through producers and consumers. Science 2018, 360, 987–992. [Google Scholar] [CrossRef] [Green Version]
- Vieux, F.; Soler, L.-G.; Touazi, D.; Darmon, N. High nutritional quality is not associated with low greenhouse gas emissions in self-selected diets of French adults. Am. J. Clin. Nutr. 2013, 97, 569–583. [Google Scholar] [CrossRef] [PubMed] [Green Version]
- FoodData Central. Available online: https://fdc.nal.usda.gov/index.html (accessed on 29 June 2021).
- World Hunger: Key Facts and Statistics Action against Hunger. 2021. Available online: https://www.actionagainsthunger.org/world-hunger-facts-statistics (accessed on 17 June 2021).
- Fact Sheets—Malnutrition. Available online: https://www.who.int/news-room/fact-sheets/detail/malnutrition (accessed on 17 June 2021).
- Drewnowski, A.; Specter, S.E. Poverty and obesity: The role of energy density and energy costs. Am. J. Clin. Nutr. 2004, 79, 6–16. [Google Scholar] [CrossRef] [PubMed]
- World Hunger Is Still Not Going Down after Three Years and Obesity Is Still Growing—UN Report. Available online: https://www.who.int/news/item/15-07-2019-world-hunger-is-still-not-going-down-after-three-years-and-obesity-is-still-growing-un-report (accessed on 17 June 2021).
- Headey, D.D.; Alderman, H.H. The relative caloric prices of healthy and unhealthy foods differ systematically across income levels and continents. J. Nutr. 2019, 149, 2020–2033. [Google Scholar] [CrossRef]
- Hirvonen, K.; Bai, Y.; Headey, D.; Masters, W.A. Affordability of the EAT–Lancet reference diet: A global analysis. Lancet Glob. Health 2019, 8, e59–e66. [Google Scholar] [CrossRef] [Green Version]
- USDA ERS—Definitions of Food Security. Available online: https://www.ers.usda.gov/topics/food-nutrition-assistance/food-security-in-the-us/definitions-of-food-security/ (accessed on 16 June 2021).
- Dietary Guidelines for Americans, 2020–2025 and Online Materials. Available online: https://www.dietaryguidelines.gov/resources/2020-2025-dietary-guidelines-online-materials (accessed on 15 June 2021).
- Willett, W.C.; Hunter, D.J.; Stampfer, M.J.; Colditz, G.; Manson, J.E.; Spiegelman, D.; Rosner, B.; Hennekens, C.H.; Speizer, F.E. Dietary Fat and Fiber in Relation to Risk of Breast Cancer: An 8-Year Follow-up. JAMA 1992, 268, 2037–2044. [Google Scholar] [CrossRef]
- Enstrom, J.E.; Kanim, L.E.; Klein, M.A. Vitamin C intake and mortality among a sample of the United States population. Epidemiology 1992, 3, 194–202. [Google Scholar] [CrossRef]
- Michels, K.B.; Giovannucci, E.; Chan, A.T.; Singhania, R.; Fuchs, C.S.; Willett, W.C. Fruit and vegetable consumption and colorectal adenomas in the Nurses’ Health Study. Cancer Res. 2006, 66, 3942–3953. [Google Scholar] [CrossRef] [Green Version]
- Rehm, C.D.; Monsivais, P.; Drewnowski, A. Relation between diet cost and healthy eating index 2010 scores among adults in the United States 2007–2010. Prev. Med. 2015, 73, 70–75. [Google Scholar] [CrossRef] [Green Version]
- Jones, N.R.; Tong, T.Y.; Monsivais, P. Meeting UK dietary recommendations is associated with higher estimated consumer food costs: An analysis using the National Diet and Nutrition Survey and consumer expenditure data, 2008–2012. Public Health Nutr. 2017, 21, 948–956. [Google Scholar] [CrossRef] [PubMed] [Green Version]
- Timmins, K.A.; Hulme, C.; Cade, J.E. The monetary value of diets consumed by British adults: An exploration into sociodemographic differences in individual-level diet costs. Public Health Nutr. 2015, 18, 151–159. [Google Scholar] [CrossRef] [PubMed] [Green Version]
- Morris, M.A.; Hulme, C.; Clarke, G.P.; Edwards, K.L.; Cade, J.E. What is the cost of a healthy diet? Using diet data from the UK Women’s Cohort Study. J. Epidemiol. Community Health 2014, 68, 1043–1049. [Google Scholar] [PubMed] [Green Version]
- Hess, J.M.; Cifelli, C.J.; Agarwal, S.; Fulgoni, V.L. Comparing the cost of essential nutrients from different food sources in the American diet using NHANES 2011–2014. Nutr. J. 2019, 18, 68. [Google Scholar] [CrossRef] [PubMed] [Green Version]
- Babb, A.M.; Knudsen, D.C.; Robeson, S.M. A critique of the objective function utilized in calculating the Thrifty Food Plan. PLoS ONE 2019, 14, e0219895. [Google Scholar] [CrossRef] [Green Version]
- Comparing the HEI-2015, HEI–2010 & HEI–2005 EGRP/DCCPS/NCI/NIH. Available online: https://epi.grants.cancer.gov/hei/comparing.html (accessed on 15 June 2021).
- Healthy Eating Index (HEI) USDA-FNS. Available online: https://www.fns.usda.gov/healthy-eating-index-hei (accessed on 15 June 2021).
- USDA Food Patterns. USDA-FNS. Available online: https://www.fns.usda.gov/usda-food-patterns (accessed on 16 June 2021).
- Fulgoni, V., III; Drewnowski, A. An economic gap between the recommended healthy food patterns and exisiting diets of minority groups in the US National Health and Nutrition Examination Survey 2013–14. Front. Nutr. 2019, 6, 37. [Google Scholar] [CrossRef] [Green Version]
- Aggarwal, A.; Rehm, C.D.; Monsivais, P.; Drewnowski, A. Importance of taste, nutrition, cost and convenience in relation to diet quality: Evidence of nutrition resilience among US adults using National Health and Nutrition Examination Survey (NHANES) 2007–2010. Prev. Med. 2016, 90, 184–192. [Google Scholar] [CrossRef] [Green Version]
- Monsivais, P.; Scarborough, P.; Lloyd, T.; Mizdrak, A.; Luben, R.; Mulligan, A.A.; Wareham, N.J.; Woodcock, J. Greater accordance with the dietary approaches to stop hypertension dietary pattern is associated with lower diet-related greenhouse gas production but higher dietary costs in the United Kingdom. Am. J. Clin. Nutr. 2015, 102. [Google Scholar] [CrossRef] [Green Version]
| Publisher’s Note: MDPI stays neutral with regard to jurisdictional claims in published maps and institutional affiliations. |
© 2021 by the authors. Licensee MDPI, Basel, Switzerland. This article is an open access article distributed under the terms and conditions of the Creative Commons Attribution (CC BY) license (https://creativecommons.org/licenses/by/4.0/).


