
Estimating the Cost of the Spanish Sustainable Food Basket through the Reference Budgets Approach

 ,
, 
Abstract
:1. Introduction
2. Materials and Methods
2.1. Translation of Food-Based Dietary Guidelines into a Concrete List of Foods
2.2. Experts’ Consultation for the Sustainable Acquisition of the List of Foods
2.3. Determination of the Food Acquisition for the Three Levels SSFRB and Pricing of the Baskets
3. Results
4. Discussion
Supplementary Materials
Author Contributions
Funding
Institutional Review Board Statement
Informed Consent Statement
Data Availability Statement
Acknowledgments
Conflicts of Interest
References
- Stanaway, J.D.; Afshin, A.; Gakidou, E.; Lim, S.S.; Abate, D.; Abate, K.H.; Abbafati, C.; Abbasi, N.; Abbastabar, H.; Abd-Allah, F.; et al. Global, regional, and national comparative risk assessment of 84 behavioural, environmental and occupational, and metabolic risks or clusters of risks for 195 countries and territories, 1990-2017: A systematic analysis for the Global Burden of Disease Study 2017. Lancet 2018, 392, 1923–1994. [Google Scholar] [CrossRef] [Green Version]
- Afshin, A.; Sur, P.J.; Fay, K.A.; Cornaby, L.; Ferrara, G.; Salama, J.S.; Mullany, E.C.; Abate, K.H.; Abbafati, C.; Abebe, Z.; et al. Health effects of dietary risks in 195 countries, 1990–2017: A systematic analysis for the Global Burden of Disease Study 2017. Lancet 2019, 393, 1958–1972. [Google Scholar] [CrossRef] [Green Version]
- Karanikolos, M.; Heino, P.; McKee, M.; Stuckler, D.; Legido-Quigley, H. Effects of the global financial crisis on health in high-income OECD countries: A narrative review. Int. J. Health Serv. 2016, 46, 208–240. [Google Scholar] [CrossRef] [PubMed]
- Heggebø, K.; Tøge, A.G.; Dahl, E.; Berg, J.E. Socioeconomic inequalities in health during the Great Recession: A scoping review of the research literature. Scand. J. Public Health 2019, 47, 635–654. [Google Scholar] [CrossRef] [PubMed]
- Bambra, C.; Riordan, R.; Ford, J.; Matthews, F. The COVID-19 pandemic and health inequalities. J. Epidemiol. Community Health 2020. [Google Scholar] [CrossRef]
- Marmot, M.; Allen, J. COVID-19: Exposing and amplifying inequalities. Lancet 2020, 395, 1243–1244. [Google Scholar] [CrossRef]
- Hub, E.S. EU Science Hub Health Inequalities: Dietary and Physical Activity-Related Determinants. Available online: https://ec.europa.eu/jrc/en/health-knowledge-gateway/societal-impacts/inequalities# (accessed on 24 November 2019).
- WHO. Obesity and Inequalities; WHO: Geneva, Sweden, 2014. [Google Scholar]
- Robertson, A.; Lobstein, T.; Knai, C.; Robertson, A.; Lobstein, T.; Knai, C. Obesity and Socio-Economic Groups in Europe: Evidence Review and Implications for Action November 2007; European Commission: Brussels, Belgium, 2007. [Google Scholar]
- Chang, Y.; Kim, J.; Chatterjee, S. The Effect of Food Price on Food Insecurity and Diet Quality: Exploring Potential Moderating Roles of SNAP and Consumer Competency; University of Kentucky Center for Poverty Research: Lexington, KY, USA, 2016. [Google Scholar]
- Penne, T.; Goedemé, T. Can low-income households afford a healthy diet? Insufficient income as a driver of food insecurity in Europe. Food Policy 2021, 99, 101978. [Google Scholar] [CrossRef]
- Carrillo-Álvarez, E.; Penne, T.; Boeckx, H.; Storms, B.; Goedemé, T. Food Reference Budgets as a Potential Policy Tool to Address Food Insecurity: Lessons Learned from a Pilot Study in 26 European Countries. Int. J. Environ. Res. Public Health 2018, 16, 32. [Google Scholar] [CrossRef] [Green Version]
- Goedemé, T.; Storms, B.; Stockman, S.; Penne, T.; Van den Bosch, K. Towards cross-country comparable reference budgets in Europe: First results of a concerted effort. Eur. J. Soc. Secur. 2015, 17, 3–31. [Google Scholar] [CrossRef]
- Storms, B.; Goedemé, T.; Van den Bosch, K.; Penne, T.; Schuerman, N.; Stockman, S. Pilot Project for a Development of a Common Methodology on Reference Budgets in Europe. Review of Current State of Play on Reference Budget Practices at National, Regional and Local Level. Available online: http://www.referencebudgets.eu/ (accessed on 25 July 2014).
- Goedemé, T.; Penne, T.; Hufkens, T.; Karakitsios, A.; Bernát, A.; Franziskus, A.; Simonovits, B.; Carrillo-Alvarez, E.; Veli-Matti, R.; Kanavitsa, E.; et al. What Does it Mean to Live on the Poverty Threshold? Lessons From Reference Budgets. In Decent Incomes for the Poor? Improving Policies in Europe.; Cantillon, B., Goedemé, T., Hills, J., Eds.; Oxford University Press: Oxford, UK, 2019. [Google Scholar]
- Laín, B.; Riutort, S.; Julià, A. The B-MINCOME project. Municipal innovation on guaranteed minimum incomes and active social policies. Barc. Soc. 2019, 23, 1–18. [Google Scholar]
- Penne, T.; Cornelis, I.; Storms, B. All we need is…: Reference Budgets as an EU Policy Indicator to Assess the Adequacy of Minimum Income Protection. Soc. Indic. Res. 2020, 147, 991–1013. [Google Scholar] [CrossRef] [Green Version]
- Preuße, H. Reference budgets for counselling on how to manage private household finance—Requirements and patterns based on international experience. Int. J. Consum. Stud. 2012, 36, 602–610. [Google Scholar] [CrossRef]
- Cornellis, I.; Vandervoort, B. LEKKER & GEZOND, Meer Smaak Met Minder Centen; Borgerhoff & Lamberigst: Gent, Belgium, 2011. [Google Scholar]
- Carrillo-Álvarez, E.; Cussó-Parcerisas, I.; Anguera-Salvatella, M.; Muñoz-Martinez, J.; Riera-Romaní, J. Guia per a una Alimentació Saludable i de Mínim Cost per a Famílies amb Infants; Ajuntament de Barcelona: Barcelona, Spain, 2020. [Google Scholar]
- FAO; WHO. Sustainable Healthy Diets; FAO & WHO: Rome, Italy, 2019; ISBN 9789251318751. [Google Scholar]
- Nelson, M.E.; Hamm, M.W.; Hu, F.B.; Abrams, S.A.; Griffin, T.S. Alignment of Healthy Dietary Patterns and Environmental Sustainability: A Systematic Review. Adv. Nutr. Int. Rev. J. 2016, 7, 1005–1025. [Google Scholar] [CrossRef] [Green Version]
- Willett, W.; Rockström, J.; Loken, B.; Springmann, M.; Lang, T.; Vermeulen, S.; Garnett, T.; Tilman, D.; DeClerck, F.; Wood, A.; et al. Food in the Anthropocene: The EAT–Lancet Commission on healthy diets from sustainable food systems. Lancet 2019, 393, 447–492. [Google Scholar] [CrossRef]
- Johnston, J.L.; Fanzo, J.C.; Cogill, B. Understanding Sustainable Diets: A Descriptive Analysis of the Determinants and Processes That Influence Diets and Their Impact on Health, Food Security, and Environmental Sustainability; Oxford University Press (OUP): Oxford, UK, 2014; Volume 5, pp. 418–429. [Google Scholar]
- Corrin, T.; Papadopoulos, A. Understanding the attitudes and perceptions of vegetarian and plant-based diets to shape future health promotion programs. Appetite 2017, 109, 40–47. [Google Scholar] [CrossRef] [PubMed]
- Schleenbecker, R.; Hamm, U. Consumers’ perception of organic product characteristics. A review. Appetite 2013, 71, 420–429. [Google Scholar] [CrossRef] [PubMed]
- Jacobson Vann, J.C.; Finkle, J.; Ammerman, A.; Wegner, S.; Skinner, A.C.; Benjamin, J.T.; Perrin, E.M. Use of a tool to determine perceived barriers to children’s healthy eating and physical activity and relationships to health behaviors. J. Pediatr. Nurs. 2011, 26, 404–415. [Google Scholar] [CrossRef] [PubMed] [Green Version]
- Munt, A.E.; Partridge, S.R.; Allman-Farinelli, M. The barriers and enablers of healthy eating among young adults: A missing piece of the obesity puzzle: A scoping review. Obes. Rev. 2017, 18, 1–17. [Google Scholar] [CrossRef]
- Ashton, L.M.; Hutchesson, M.J.; Rollo, M.E.; Morgan, P.J.; Collins, C.E. Motivators and Barriers to Engaging in Healthy Eating and Physical Activity: A Cross-Sectional Survey in Young Adult Men. Am. J. Mens. Health 2017, 11, 330–343. [Google Scholar] [CrossRef]
- Zorbas, C.; Palermo, C.; Chung, A.; Iguacel, I.; Peeters, A.; Bennett, R.; Backholer, K. Factors perceived to influence healthy eating: A systematic review and meta-ethnographic synthesis of the literature. Nutr. Rev. 2018, 76, 861–874. [Google Scholar] [CrossRef] [Green Version]
- Sanchez-Sabate, R.; Sabaté, J. Consumer attitudes towards environmental concerns of meat consumption: A systematic review. Int. J. Environ. Res. Public Health 2019, 16, 1220. [Google Scholar] [CrossRef] [Green Version]
- Van Loo, E.J.; Diem, M.N.H.; Pieniak, Z.; Verbeke, W. Consumer attitudes, knowledge, and consumption of organic yogurt. J. Dairy Sci. 2013, 96, 2118–22129. [Google Scholar] [CrossRef]
- Kushwah, S.; Dhir, A.; Sagar, M.; Gupta, B. Determinants of organic food consumption. A systematic literature review on motives and barriers. Appetite 2019, 143, 104402. [Google Scholar] [CrossRef] [PubMed]
- Giampietri, E.; Koemle, D.; Yu, X.; Finco, A. Consumers’ sense of farmers’ markets: Tasting sustainability or just purchasing food? Sustainability 2016, 8, 1157. [Google Scholar] [CrossRef] [Green Version]
- Macdiarmid, J.I. Seasonality and dietary requirements: Will eating seasonal food contribute to health and environmental sustainability? Proc. Nutr. Soc. 2014, 73, 368–375. [Google Scholar] [CrossRef] [PubMed] [Green Version]
- Sharma, S.; Chatterjee, S. Microplastic pollution, a threat to marine ecosystem and human health: A short review. Environ. Sci. Pollut. Res. 2017, 24, 21530–21547. [Google Scholar] [CrossRef] [PubMed]
- Li, W.C.; Tse, H.F.; Fok, L. Plastic waste in the marine environment: A review of sources, occurrence and effects. Sci. Total Environ. 2016, 566, 333–349. [Google Scholar] [CrossRef]
- Rhodes, C.J. Plastic pollution and potential solutions. Sci. Prog. 2018, 101, 207–260. [Google Scholar] [CrossRef]
- Barilla Center & The Economist Intelligence Unit. Fixing Food 2018. Best Practices towards the Sustainable Development Goals; Barilla Center for Food & Nutrition: Parma, Italy, 2018. [Google Scholar]
- Reynolds, C.J.; Horgan, G.W.; Whybrow, S.; Macdiarmid, J.I. Healthy and sustainable diets that meet greenhouse gas emission reduction targets and are affordable for different income groups in the UK. Public Health Nutr. 2019, 22, 1503–1517. [Google Scholar] [CrossRef] [Green Version]
- Rayner, M.; Scarborough, P.; Hird, V. SDC Setting the Table: Advice to Government on Priority Elements of Sustainable Diets; Sustainable Development Commission: London, UK, 2009. [Google Scholar]
- Bradbear, C.; Friel, S. Integrating climate change, food prices and population health. Food Policy 2013, 43, 56–66. [Google Scholar] [CrossRef]
- Dixon, J.; Isaacs, B. Why sustainable and “nutritionally correct” food is not on the agenda: Western Sydney, the moral arts of everyday life and public policy. Food Policy 2013, 43, 67–76. [Google Scholar] [CrossRef]
- EFSA DRV Finder. Available online: https://efsa.gitlab.io/multimedia/drvs/index.htm (accessed on 3 August 2021).
- Aranceta Bartrina, J.; Arija Val, V.V.; Maíz Aldalur, E.; Martínez de Victoria Muñoz, E.; Ortega Anta, R.M.; Pérez-Rodrigo, C.; Quiles Izquierdo, J.; Rodríguez Martín, A.; Román Viñas, B.; Salvador Castell, G.; et al. Dietary Guidelines for the Spanish population (SENC, diciembre 2016); the new graphic icon of healthy food. Nutr. Hosp. 2016, 33, 1–48. [Google Scholar] [CrossRef] [Green Version]
- Carrillo, E.; Cussó-Parcerisas, I.; Riera, J.; Carrillo Álvarez, E.; Cussó-Parcerisas, I.; Riera-Romaní, J. Development of the Spanish Healthy Food Reference Budget for an adequate social participation at the minimum. Public Health Nutr. 2016, 19, 3232–3244. [Google Scholar] [CrossRef] [PubMed] [Green Version]
- Gezondheidsraad, H. Maten en Gewichten: Handleiding voor een Gestandaardiseerde Kwantificering van Voedingsmiddelen. [Measures and Weights: Manual for Standardized Quantification of Foods.]; Belgische Hoge Gezondheidsraad: Brussels, Belgium, 2005. [Google Scholar]
- Hasson, F.; Keeney, S.; McKenna, H. Research guidelines for the Delphi survey technique. J. Adv. Nurs. 2000, 32, 1008–1015. [Google Scholar] [CrossRef] [Green Version]
- Goedemé, T.; Storms, B.; Penne, T.; Van den Bosch, K. Pilot Project for the Development of a Common Methodology on Reference Budgets in Europe. Final Report; European Commission: Antwerp, Belgium, 2015; ISBN 9789279540912. [Google Scholar]
- ¿Cuáles son los supermercados más baratos? Estudio de supermercados de OCU 2019. Available online: https://www.ocu.org/consumo-familia/supermercados/noticias/supermercados-mas-baratos-2019 (accessed on 1 August 2021).
- OECD. Food Supply Chains and COVID-19: Impacts and Policy Lessons. Available online: http://www.oecd.org/coronavirus/policy-responses/food-supply-chains-and-covid-19-impacts-and-policy-lessons-71b57aea/ (accessed on 30 August 2020).
- INE Índice de Precios de Consumo (IPC). Julio 2020; Instituto Nacional de Estadística: Madrid, Spain, 2020. [Google Scholar]
- FAO. Fishing Areas for Statistical Purposes|Coordinating Working Party on Fishery Statistics (CWP)|Food and Agriculture Organization of the United Nations. Available online: http://www.fao.org/cwp-on-fishery-statistics/handbook/general-concepts/fishing-areas-for-statistical-purposes/en/ (accessed on 31 January 2021).
- Organización de Consumidores y Usuarios Calendario de Frutas y Verduras de Temporada|OCU. Available online: https://www.ocu.org/alimentacion/alimentos/calculadora/calendario-de-frutas-y-verduras (accessed on 31 January 2021).
- Departament d’Agricultuera, Ramaderia Pesca i Alimentació Soy de Temporada. Available online: https://soydetemporada.es/ (accessed on 31 January 2021).
- Departament d’Agricultura. Peix i Marisc. Available online: http://agricultura.gencat.cat/ca/actualitat/productes-temporada/productes-tipus/peix-marisc/ (accessed on 31 January 2021).
- Greenpeace Pescado de Temporada. Available online: http://pescadodetemporada.org/ (accessed on 31 January 2021).
- Bai, Y.; Alemu, R.; Block, S.A.; Headey, D.; Masters, W.A. Cost and affordability of nutritious diets at retail prices: Evidence from 177 countries. Food Policy 2020, 99, 101983. [Google Scholar] [CrossRef]
- Partearroyo, T.; de Samaniego-Vaesken, M.L.; Ruiz, E.; Aranceta-Bartrina, J.; Gil, Á.; González-Gross, M.; Ortega, R.M.; Serra-Majem, L.; Varela-Moreiras, G. Current food consumption amongst the spanish anibes study population. Nutrients 2019, 11, 2663. [Google Scholar] [CrossRef] [PubMed] [Green Version]
- Mercasa Alimentación en España 2019. Producción, Industria, Distribución y Consumo. Available online: https://www.mercasa.es/media/publicaciones/262/AEE_2019_WEB.pdf (accessed on 31 January 2021).
- Fresán, U.; Martínez-González, M.A.; Sabaté, J.; Bes-Rastrollo, M. Global sustainability (health, environment and monetary costs) of three dietary patterns: Results from a Spanish cohort (the SUN project). BMJ Open 2019, 9, e021541. [Google Scholar] [CrossRef] [Green Version]
- Germani, A.; Vitiello, V.; Giusti, A.M.; Pinto, A.; Donini, L.M.; Del Balzo, V. Environmental and economic sustainability of the Mediterranean diet. Int. J. Food Sci. Nutr. 2014, 65, 1008–1012. [Google Scholar] [CrossRef]
- Fresán, U.; Errendal, S.; Craig, W.J. Influence of the Socio-Cultural Environment and External Factors in Following Plant-Based Diets. Sustainability 2020, 12, 9093. [Google Scholar] [CrossRef]
- De Schutter, O. Food Towards a Common Food Policy for the European Union the Policy Reform and Realignment That Is Required to Build Sustainable Food Systems in Europe Report; iPES FOOD: Brussels, Belgium, 2019. [Google Scholar]
- Waterlander, W.E.; Jiang, Y.; Nghiem, N.; Eyles, H.; Wilson, N.; Cleghorn, C.; Genç, M.; Swinburn, B.; Mhurchu, C.N.; Blakely, T. The effect of food price changes on consumer purchases: A randomised experiment. Lancet Public Health 2019, 4, e394–e405. [Google Scholar] [CrossRef] [Green Version]
- Broeks, M.J.; Biesbroek, S.; Over, E.A.B.; Van Gils, P.F.; Toxopeus, I.; Beukers, M.H.; Temme, E.H.M. A social cost-benefit analysis of meat taxation and a fruit and vegetables subsidy for a healthy and sustainable food consumption in the Netherlands. BMC Public Health 2020, 20, 643. [Google Scholar] [CrossRef]
- Ruiz, E.; Ávila, J.M.; Valero, T.; Del Pozo, S.; Rodriguez, P.; Aranceta-Bartrina, J.; Gil, Á.; González-Gross, M.; Ortega, R.M.; Serra-Majem, L.; et al. Energy intake, profile, and dietary sources in the spanish population: Findings of the ANIBES study. Nutrients 2015, 7, 4739–4762. [Google Scholar] [CrossRef]
- Clonan, A.; Roberts, K.E.; Holdsworth, M. Socioeconomic and demographic drivers of red and processed meat consumption: Implications for health and environmental sustainability. Proc. Nutr. Soc. 2016, 75, 367–373. [Google Scholar] [CrossRef] [PubMed] [Green Version]
- Schwingshackl, L.; Knüppel, S.; Michels, N.; Schwedhelm, C.; Hoffmann, G.; Iqbal, K.; De Henauw, S.; Boeing, H.; Devleesschauwer, B. Intake of 12 food groups and disability-adjusted life years from coronary heart disease, stroke, type 2 diabetes, and colorectal cancer in 16 European countries. Eur. J. Epidemiol. 2019, 34, 765–775. [Google Scholar] [CrossRef] [PubMed] [Green Version]
- Tobler, C.; Visschers, V.H.M.; Siegrist, M. Eating green. Consumers’ willingness to adopt ecological food consumption behaviors. Appetite 2011, 57, 674–682. [Google Scholar] [CrossRef]
- BEUC. One Bite at a Time: Consumers and the Transition to Sustainable Food Analysis of a survey of European Consumers on Attitudes towards Sustainable Food; European Consumer Organisation Bureau Européen des Unions de Consommateurs: Brussels, Belgium, 2020. [Google Scholar]
- Goulding, T.; Lindberg, R.; Russell, C.G. The affordability of a healthy and sustainable diet: An Australian case study. Nutr. J. 2020, 19, 109. [Google Scholar] [CrossRef]
- Milan Urban Food Policy Pact The Milan Pact. Available online: https://www.milanurbanfoodpolicypact.org/ (accessed on 28 March 2021).
- European Union Sustainable Develpment in the European Union. Monitoring Report on Progress towards the SDGs in an EU Context; Publications Office of the European Union: Luxembourg, 2020. [Google Scholar]
- Eurostat People at Risk of Poverty and Social Exclusion by Age and Sex. Available online: https://ec.europa.eu/eurostat/databrowser/view/ilc_peps01/default/table?lang=en (accessed on 19 March 2021).
- Entitats Catalanes d’Acció Social Informe INSOCAT per a la Millora de L’acció Social. Una Societat Entre Crisis, 12; ECAS: Barcelona, Spain, 2020. [Google Scholar]
- Bartoll, X.; Pérez, K.; Borrell, C. Les desigualtats en salut segons pobresa i renda. Barcelona Soc. 2019, 23, 121–128. [Google Scholar]

| Food Groups | EAT-Lancet | SENC 2004 | SENC 2016 | SHFRB Level 0 | SSFRB Levels 1–2–3 | SSFRB Levels 1–2–3 Weekly-Daily Distribution | ||
|---|---|---|---|---|---|---|---|---|
| g/Day | g/Day | g/Day | g/Day | g/Day | PT Size (g) | PT /Week | PT/Day | |
| Whole grain 1 | 232 | 333–680 | 250–566 | 276 2 | 232 | 80 | 20 | 3 |
| Tubercle | 50 (0–100) | 114 | 100 | 150 | 5 | |||
| Vegetables | 300 (200–600) | 300–400 | 300–400 | 400 | 400 | 200 | 14 | 2 |
| Fruits | 200 (100–300) | 360–600 | 360–600 | 450 | 360 | 150 | 17 | 2 |
| Dairy products | 250 (0–500) | 260–685 3 | 260–685 3 | 605 | 500 | 250 | 14 | 2 |
| Red meat 4 | 14 (0–28) | Occasional | Occasional | 50 | 30 | 150 | 1 | |
| Poultry | 29 (0–58) | 43–71 | 43–71 | 54 | 29 | 100 | 2 | |
| Eggs | 13 (0–25) | 27–36 | 27–45 | 60 | 27 | 63 | 3 | |
| Fish | 28 (0–100) | 54–86 | 36–64 | 94 | 64 | 150 | 3 | |
| Pulses | 75 (0–150) | 17–46 | 17–34 | 17 | 46 | 80 | 4 | |
| Nuts and seeds | 50 (0–75) | 9–30 | 25 | 20 | 25 | 30 | 7 | |
| Added fat 5 | 40 (20–80) | 30–60 (mL) | - | 40 | 40 | 10 | 42 | |
| Added sugar | 31 (0–31) | Occasional | 0–50 | 50 6 | 31 6 | |||
| Food Categories | Purchase Locations | Non-Restrained Scenario | Budget Scenario | ||||||
|---|---|---|---|---|---|---|---|---|---|
| Strongly Disagree | Disagree | Agree | Strongly Agree | Strongly Disagree | Disagree | Agree | Strongly Agree | ||
| FRUITS | Market | 1/6 | - | 2/6 | 3/6 | 1/6 | - | 4/6 ↑ | 2/6 ↓ |
| Direct sale from the farmer | - | - | 2/6 | 4/6 | - | - | 2/6 | 4/6 | |
| Cooperatives | - | - | 2/6 | 4/6 | - | - | 2/6 | 4/6 | |
| Supermarket | 3/6 | 3/6 | - | - | 3/6 | 3/6 | - | - | |
| VEGETABLES | Market | 1/6 | - | 2/6 | 3/6 | 1/6 | - | 4/6 ↑ | 2/6 ↓ |
| Direct sale from the farmer | - | - | 2/6 | 4/6 | - | - | 2/6 | 4/6 | |
| Cooperatives | - | - | 2/6 | 4/6 | - | - | 2/6 | 4/6 | |
| Community or family gardens | - | - | 2/6 | 4/6 | - | - | 1/6 ↓ | 5/6 ↑ | |
| Supermarket | 3/6 | 3/6 | - | - | 3/6 | 3/6 | - | - | |
| STARCH | Bulk stores | - | - | 2/6 | 4/6 | - | - | 4/6 ↑ | 2/6 ↓ |
| Market | 1/6 | - | 4/6 | 1/6 | ↓ | - | 5/6 ↑ | 1/6 | |
| Cooperatives | - | - | 3/6 | 3/6 | - | - | 2/6 ↓ | 4/6 ↑ | |
| Supermarket | 3/6 | 3/6 | - | - | 3/6 | 2/6 ↓ | 1/6 ↑ | - | |
| Specialty stores | - | - | 5/6 | 1/6 | - | - | 5/6 | 1/6 | |
| Not possible to achieve both criteria | - | - | - | - | 6/6 ↑ | - | - | - | |
| DAIRY | Specialty stores | 1/6 | - | 3/6 | 2/6 | 1/6 | 1/6 ↑ | 4/6 ↑ | ↓ |
| Market | 1/6 | - | 4/6 | 1/6 | 1/6 | 1/6 ↑ | 4/6 | ↓ | |
| Cooperatives | 1/6 | - | 3/6 | 2/6 | 1/6 | - | 2/6 ↓ | 3/6 ↑ | |
| Supermarket | 4/6 | 2/6 | - | - | 3/6 ↓ | 3/6 ↑ | - | - | |
| Direct sale from the farmer | 1/6 | - | 1/6 | 4/6 | 1/6 | 1/6 ↑ | 1/6 | 3/6 ↓ | |
| MEAT | Butcher shop | 1/6 | - | 3/6 | 2/6 | 1/6 | 1/6 ↑ | 2/6 ↓ | 2/6 |
| Butcher at the local market | 1/6 | - | 2/6 | 3/6 | 1/6 | 1/6 ↑ | 1/6 ↓ | 3/6 | |
| Cooperatives | 1/6 | - | 2/6 | 3/6 | 1/6 | - | 2/6 | 3/6 | |
| Supermarket | 4/6 | 1/6 | 1/6 | - | 3/6 ↓ | 3/6 ↑ | ↓ | - | |
| Supermarket in glass package | - | - | - | - | 1/6 ↑ | 2/6 ↑ | 3/6 ↑ | - | |
| FISH | Fish shop | 1/6 | - | 2/6 | 3/6 | 1/6 | 1/6 ↑ | 2/6 | 2/6 ↓ |
| Fish shop at the local market | 1/6 | - | 1/6 | 4/6 | 1/6 | 1/6 ↑ | 1/6 | 3/6 ↓ | |
| Supermarket | 4/6 | 1/6 | 1/6 | - | 3/6 ↓ | 2/6 ↑ | 1/6 | - | |
| Fish shop (choosing the most economic species) | - | - | - | - | 1/6 ↑ | - | 1/6 ↑ | 4/6 ↑ | |
| NUTS | Bulk stores | - | - | 2/6 | 4/6 | - | - | 4/6 ↑ | 2/6 ↓ |
| Fruit and vegetable grocery shops | - | 1/6 | 5/6 | - | - | 1/6 | 5/6 | - | |
| Market local | - | 2/6 | 2/6 | 2/6 | - | 1/6 ↓ | 4/6 ↑ | 1/6 ↓ | |
| Cooperatives | - | - | 3/6 | 3/6 | - | - | 2/6 ↓ | 4/6 ↑ | |
| Supermarket | 3/6 | 3/6 | - | - | 3/6 | 2/6 ↓ | 1/6 ↑ | - | |
| SPECIES 1 | Bulk stores | - | 1/6 | 1/6 | 4/6 | - | 1/6 | 2/6 ↑ | 3/6 ↓ |
| Market local | 1/6 | 1/6 | 2/6 | 2/6 | ↓ | 1/6 | 4/6 ↑ | 1/6 ↓ | |
| Cooperatives | - | 1/6 | 2/6 | 3/6 | - | 1/6 | 2/6 | 3/6 | |
| Supermarket | 3/6 | 3/6 | - | - | 3/6 | 3/6 | - | - | |
| Warehouse with retail sale | - | - | - | - | - | 1/6 ↑ | 5/6 ↑ | - | |
| OTHERS 2 | Bulk stores | 1/6 | 2/6 | - | 3/6 | ↓ | ↓ | ↓ | ↓ |
| Coffee shop | 2/6 | 1/6 | 1/6 | 2/6 | 2/6 | 1/6 | 2/6 ↑ | 1/6 ↓ | |
| Market | 2/6 | 1/6 | 2/6 | 1/6 | ↓ | ↓ | ↓ | ↓ | |
| Cooperatives | 1/6 | 1/6 | 1/6 | 3/6 | ↓ | ↓ | ↓ | ↓ | |
| Supermarket | 3/6 | 3/6 | - | - | 3/6 | 2/6 ↓ | 1/6 ↑ | - | |
| Warehouse with retail sales | - | - | - | - | 1/6 ↑ | 1/6 ↑ | 4/6 ↑ | - | |
| Levels of Sustainability | Level 0 (Baseline) SHFRB-L0 | Level 1 SSFRB-L1 | Level 2 SSFRB-L2 | Level 3 SSFRB-L3 |
|---|---|---|---|---|
| Specific Criteria | ||||
| Food amounts | SENC 2004 | EAT-Lancet culturally adapted through SENC 2016 FBDG | EAT-Lancet culturally adapted through SENC 2016 FBDG | EAT-Lancet culturally adapted through SENC 2016 FBDG |
| Seasonality | All available | All available | In season | In season |
| Packaging | All available | All available | Minimally packed fresh food | Minimally packed fresh food |
| Origin of fresh product | All available | All available | Preferably Spain, also closer countries (Portugal, Morocco) | Preferably Catalonia, also Spain and closer countries (Portugal, Morocco) |
| Pricing | Widespread food retailer | Widespread food retailer | Widespread food retailer | Local distributors |
| Wholegrain bread and pasta | Origin | Spain | Fresh vegetables 1 | Origin | Spain |
| Packaging | Minimum | Packaging | Minimum | ||
| Seasonality | Not considered | Seasonality | February–May | ||
| Wholegrain rice | Origin | Spain | Frozen vegetables | Origin | Spain |
| Packaging | Minimum | Packaging | Minimum | ||
| Seasonality | Not considered | Seasonality | Not considered | ||
| Potatoes | Origin | Spain | Fresh fruits | Origin | Spain, Portugal, Morocco |
| Packaging | Minimum | Packaging | Minimum | ||
| Seasonality | Not considered | Seasonality | February–May | ||
| Legumes | Origin | Spain | Fresh fish 1 | Origin | FAO fishing areas 27, 34, 37 |
| Packaging | Minimum | Packaging | Minimum | ||
| Seasonality | Not considered | Seasonality | February–May | ||
| Charcuterie | Origin | Spain | Frozen fish | Origin | FAO fishing areas 27, 34, 37 |
| Packaging | Minimum | Packaging | Minimum | ||
| Seasonality | Not considered | Seasonality | Not considered | ||
| Lean and fatter meat | Origin | Spain | Canned fish | Origin | Spain and Morocco |
| Packaging | Minimum | Packaging | Minimum | ||
| Seasonality | Not considered | Seasonality | Not considered |
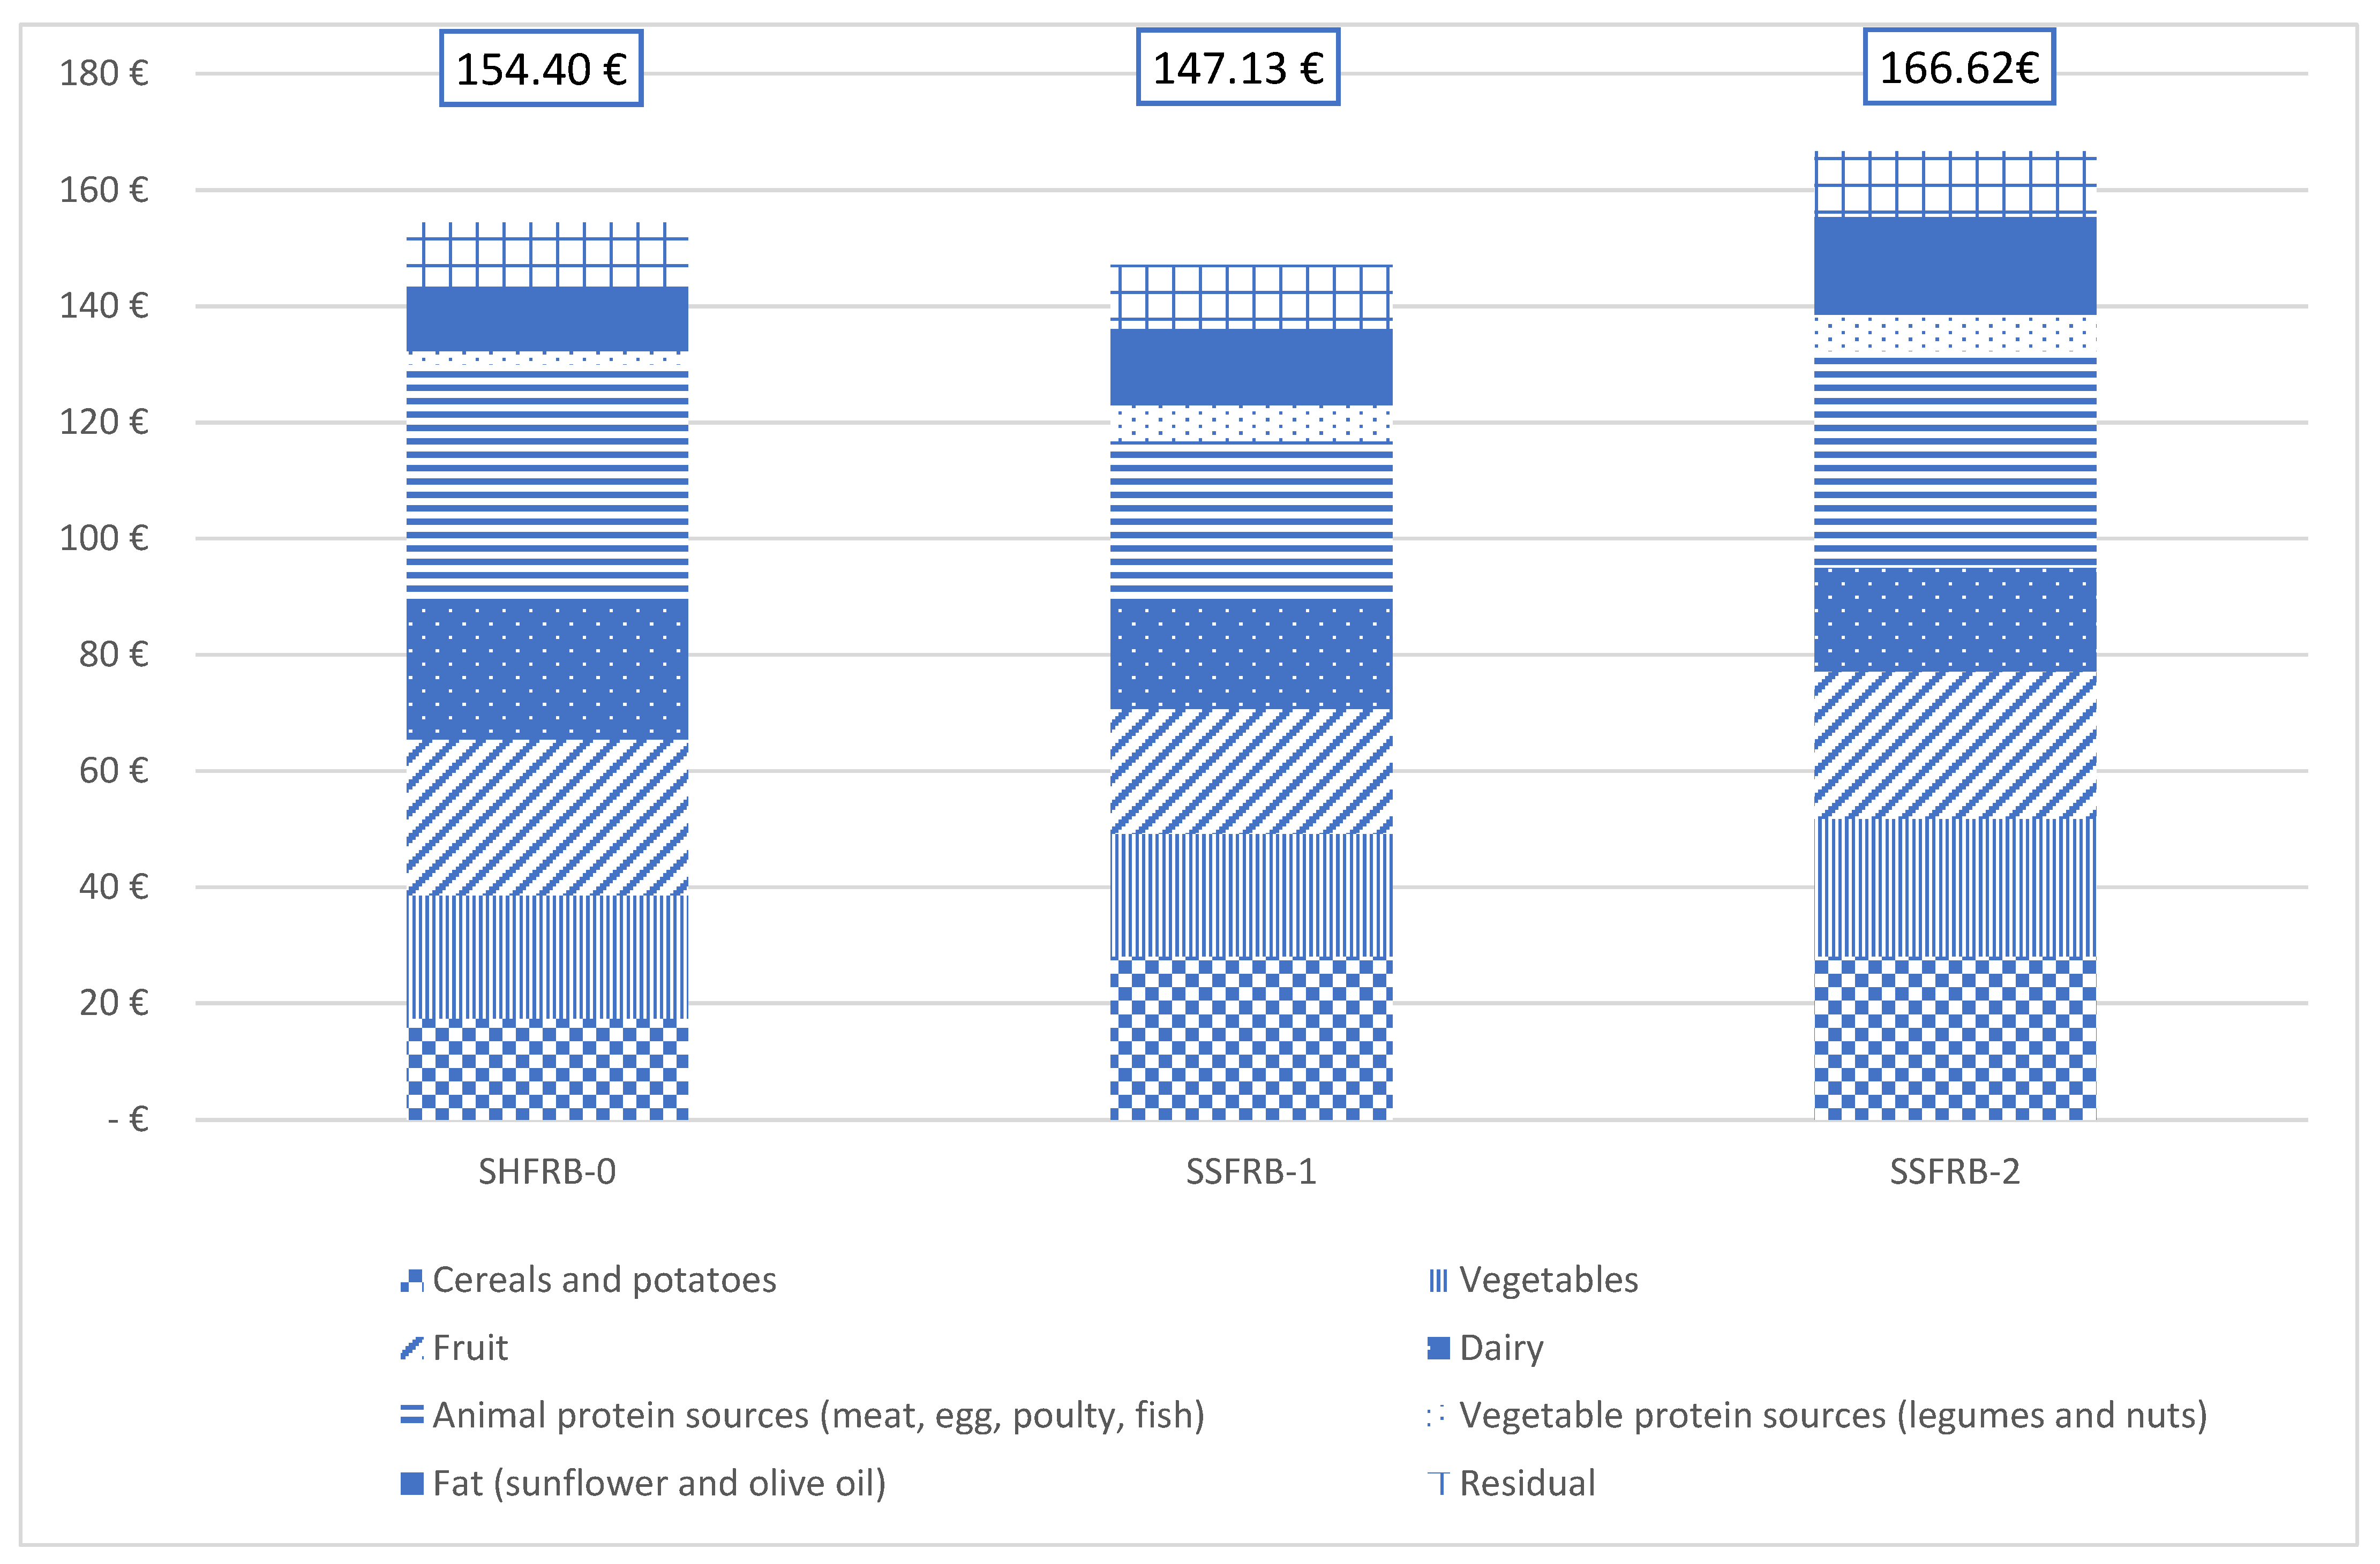
| FOOD CATEGORIES | SHFRB-0 | SSFRB-1 | SSFRB-2 | |||||||
|---|---|---|---|---|---|---|---|---|---|---|
| Amount (g/Day) | Cost (EUR/Month) | Amount (g/Day) | Cost (EUR/Month) | Change Amount L1–0 (g/Day) | Change Cost L0–1 (EUR/Month) | Amount (g/Day) | Cost (EUR/Month) | Change Amount L2–L1 (g/Day) | Change Cost L2–L1 (EUR/Month) | |
| Cereals and potatoes | 390.35 | 17.49 | 332.27 | 28.06 | ↓ 58 | ↑ 10.57 | 332.27 | 28.06 | 0 | 0 |
| Fruit | 448.77 | 26.78 | 359.01 | 21.43 | ↓ 90 | ↓ 5.35 | 359.01 | 25.35 | 0 | ↑ 3.92 |
| Vegetables | 398.90 | 21.13 | 398.91 | 21.13 | 0 | 0 | 398.91 | 23.74 | 0 | ↑ 2.61 |
| Dairy | 604.45 | 24.11 | 501.42 | 17.90 | ↓ 103.03 | ↓ 6.21 | 501.42 | 17.90 | 0 | 0 |
| Animal protein sources 1 | 227.95 | 40.46 | 149.95 | 28.24 | ↓ 78 | ↓ 12.22 | 149.95 | 37.25 | 0 | ↑ 9.01 |
| Vegetable protein 2 sources | 71.24 | 9.87 | 163.00 | 15.82 | ↑ 91.76 | ↑ 5.95 | 163.00 | 19.58 | 0 | ↑ 3.76 |
| Fat (sunflower and olive oil) | 39.89 | 3.57 | 39.89 | 3.57 | 0 | 0 | 39.89 | 3.57 | 0 | 0 |
| Residual | 97.97 | 11.01 | 97.97 | 10.98 | 0 | 0.03 | 97.97 | 11.17 | 0 | ↑ 0.19 |
| Total | 2279.52 | 154.40 | 2042.42 | 147.13 | - | - | 2042.42 | 166.62 | - | - |
Publisher’s Note: MDPI stays neutral with regard to jurisdictional claims in published maps and institutional affiliations. |
© 2021 by the authors. Licensee MDPI, Basel, Switzerland. This article is an open access article distributed under the terms and conditions of the Creative Commons Attribution (CC BY) license (https://creativecommons.org/licenses/by/4.0/).
Share and Cite
Carrillo-Álvarez, E.; Muñoz-Martínez, J.; Salinas-Roca, B.; Cussó-Parcerisas, I. Estimating the Cost of the Spanish Sustainable Food Basket through the Reference Budgets Approach. Sustainability 2021, 13, 9401. https://doi.org/10.3390/su13169401
Carrillo-Álvarez E, Muñoz-Martínez J, Salinas-Roca B, Cussó-Parcerisas I. Estimating the Cost of the Spanish Sustainable Food Basket through the Reference Budgets Approach. Sustainability. 2021; 13(16):9401. https://doi.org/10.3390/su13169401
Chicago/Turabian StyleCarrillo-Álvarez, Elena, Júlia Muñoz-Martínez, Blanca Salinas-Roca, and Irene Cussó-Parcerisas. 2021. "Estimating the Cost of the Spanish Sustainable Food Basket through the Reference Budgets Approach" Sustainability 13, no. 16: 9401. https://doi.org/10.3390/su13169401