Abstract
A prevailing assumption in research on remanufactured products is “the cheaper, the better”. Customers prefer prices that are as low as possible. Customer price preference is modeled as a linear function with the minimal price at customers’ willingness to pay (WTP), which is assumed to be homogeneous and constant in the market. However, this linearity assumption is being challenged, as recent empirical studies have testified to customer heterogeneity in price perception and demonstrated the existence of too-cheap prices (TC). This study is the first attempt to investigate the validity of the linearity assumption for remanufactured products. A Monte Carlo simulation was conducted to estimate how the average market preference changes with the price of the remanufactured product when TC and WTP are heterogeneous across individual customers. Survey data from a previous study were used to fit and model the distributions of TC and WTP. Results show that a linear or monotonically decreasing relationship between price and customer preference may not hold for remanufactured products. With heterogeneous TC and WTP, the average price preference revealed an inverted U shape with a peak between the TC and WTP, independent of product type and individual customers’ preference function form. This implies that a bell-shaped or triangular function may serve as a better alternative than a linear function can when modeling market-price preference in remanufacturing research.
1. Introduction
As the circular economy is emerging as a new paradigm for sustainable production and consumption, remanufacturing, a vital component of the circular economy, is attracting increasing attention from both academia and industry [1,2,3,4,5]. Remanufacturing is the process of restoring used products to a like-new state by reconditioning or replacing certain parts [6,7,8]. This process contributes to a circular economy by extending a product’s lifespan. Remanufactured products provide the same quality and performance as those of brand-new products at a fraction of the original cost, with minimal resource depletion and waste generation by reusing repairable parts [8,9,10,11].
The success of remanufacturing is contingent upon customer acceptance of the remanufactured products [12]. Therefore, a deep understanding of customer preferences for remanufactured products is a prerequisite for decision making in remanufacturing. In particular, understanding customer price preference for remanufactured products is critical, as the price (or price discount from the corresponding new product price) significantly influences customers’ purchase intention [12,13,14,15].
A prevailing assumption on customer price perception in remanufacturing research is “the cheaper, the better”. This means that customers accept only a price cheaper than their willingness to pay (WTP), and prefer a price that is as low as possible. Here, the WTP indicates the maximal acceptable price, above which the price is considered to be too expensive, resulting in the customer being unwilling to buy the product. The existing literature assumes the WTP to be homogeneous and constant across consumers [16,17]. Accordingly, it is a common practice to model price preference as a monotonically decreasing function with a minimum at a constant WTP [7,18,19]. A linear function is frequently used in many studies, including in [8,18,19,20,21].
However, recent empirical evidence has raised concerns about the validity of the “the cheaper, the better” assumption for remanufactured products. The concerns are twofold. First, consumers’ price preferences may not be homogeneous. Abbey et al. [19] raised this issue and empirically showed that the WTP is not constant across customers. Second, the linear relationship between price (or price discount) and preference may not hold. For example, in the study by Ovchinnikov [22], the maximal price preference was observed at a 60% discount and not at the maximal discount. As consumers may judge the quality of the product from its price, overdiscounting or cheap prices may signal inferior quality, leading to a lowered preference [22,23]. Similarly, Lee and Kwak [5] recently reported empirical evidence highlighting the existence of a too-cheap price (TC), that is, the minimal acceptable price below which a customer does not purchase the product due to concerns over product quality. Their survey demonstrated that customers have both a WTP and a TC for remanufactured products. Furthermore, TC and WTP price points differ across customers.
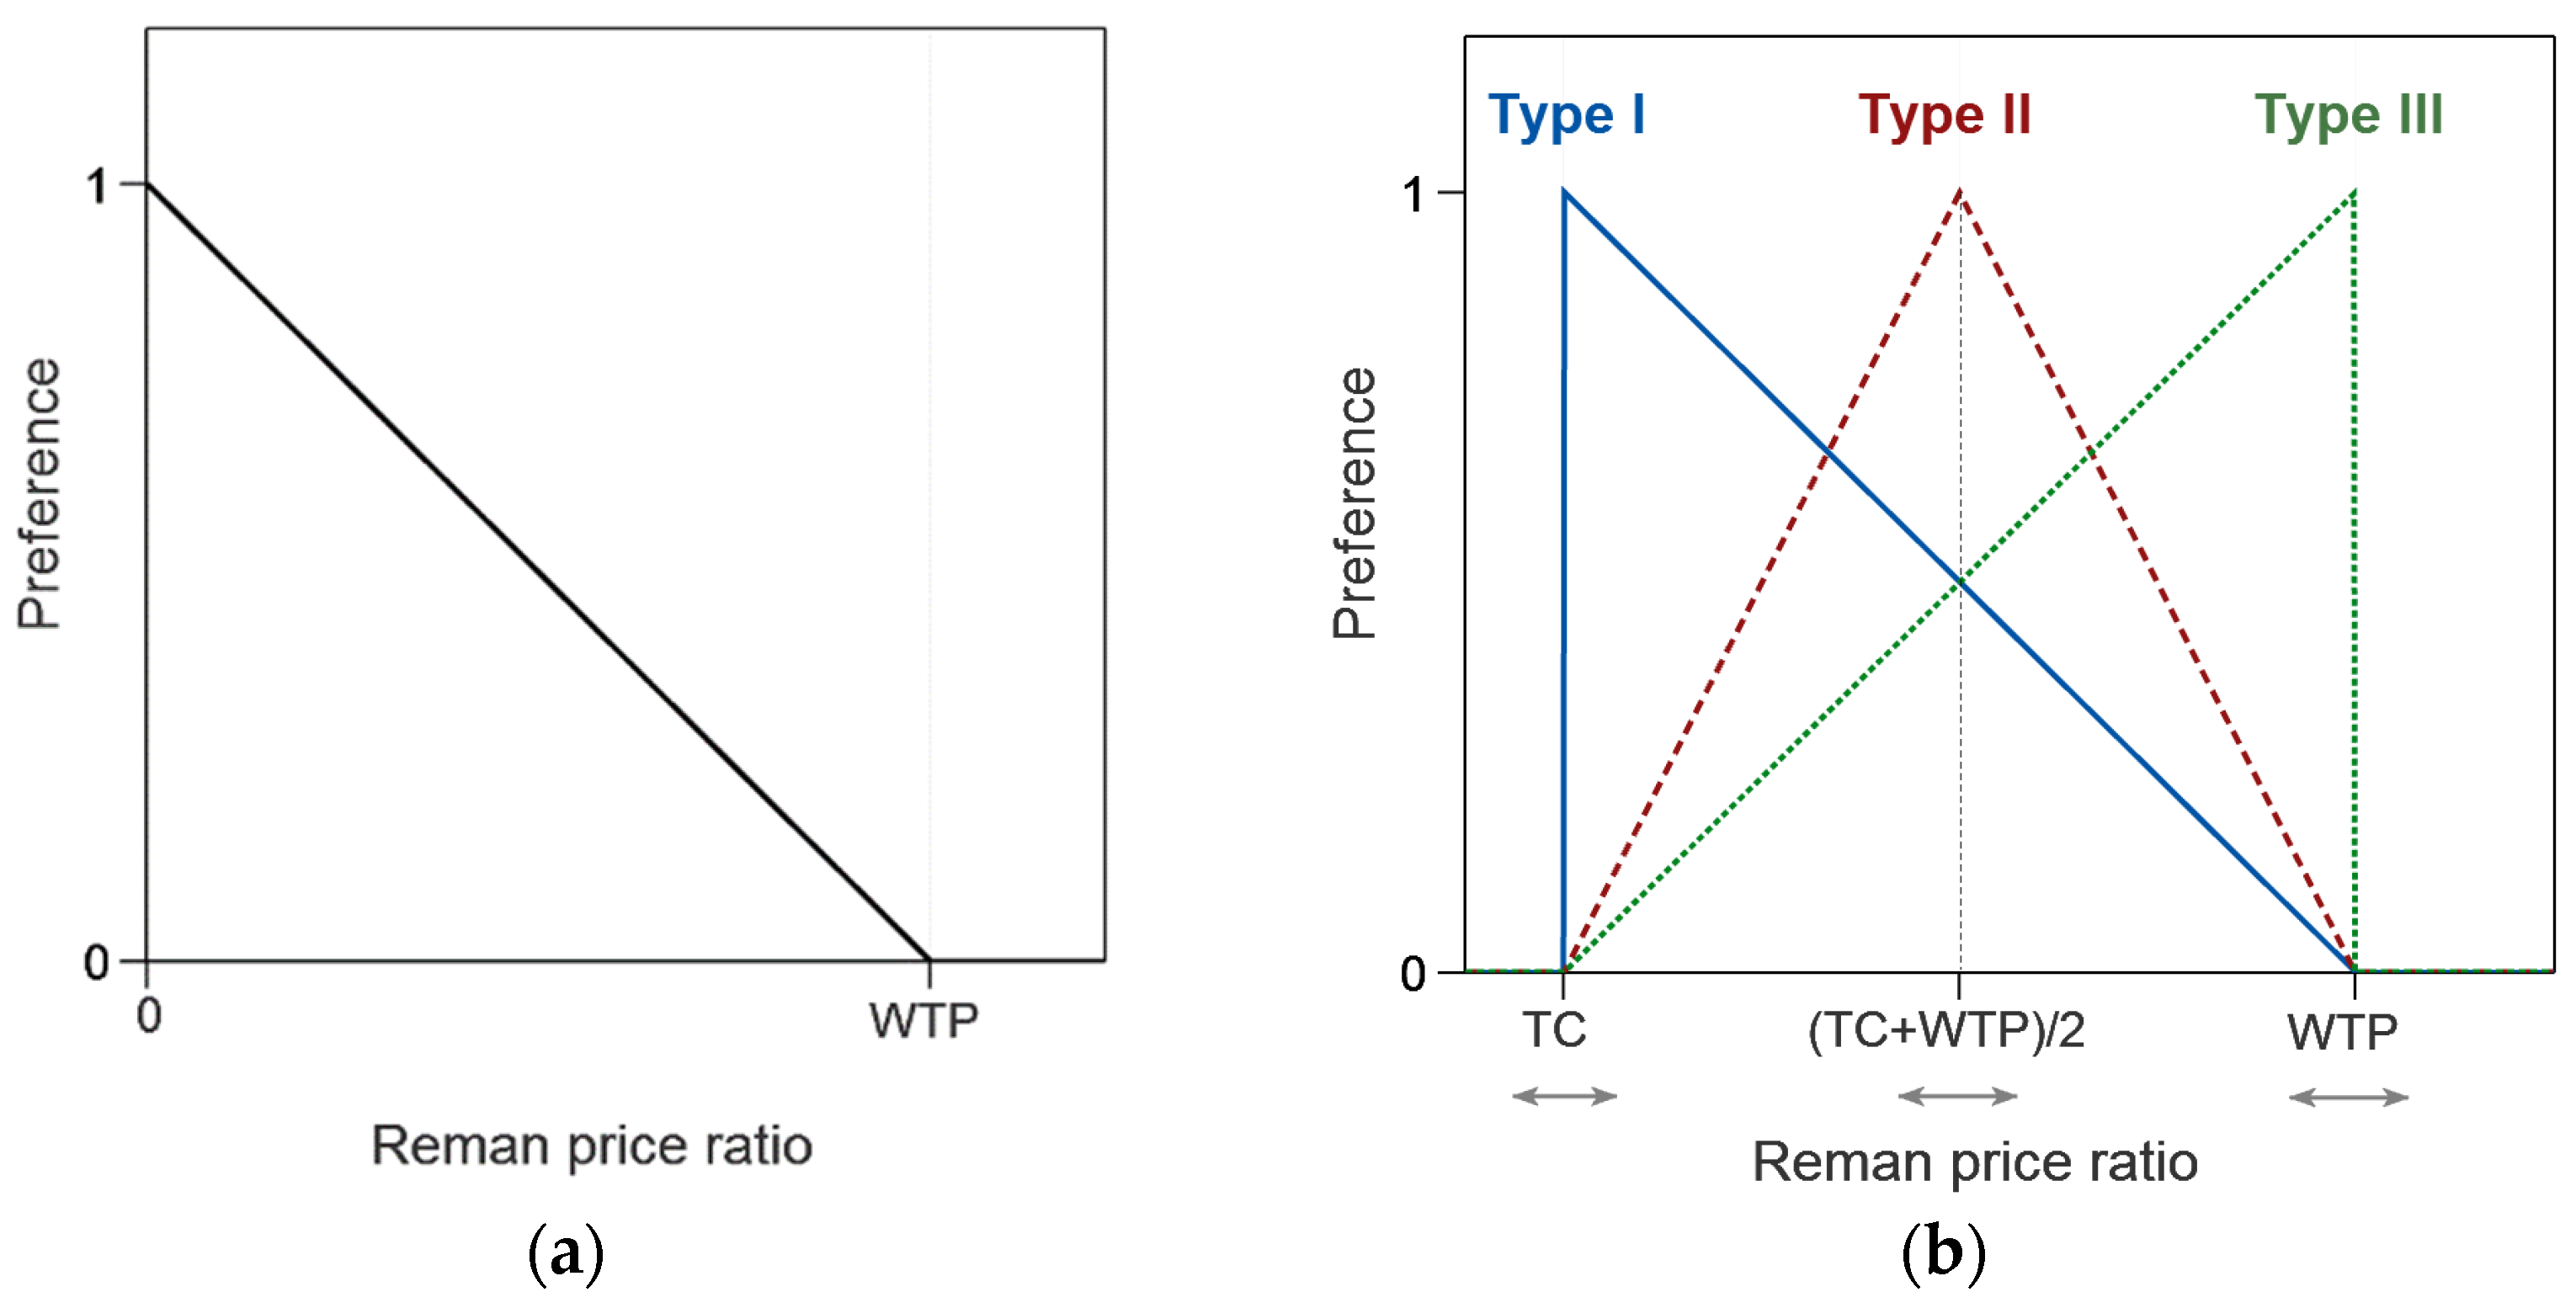
With recent evidence on heterogeneous TC and WTP, the assumption of the linear price–preference function in remanufacturing research has been challenged, which highlighted the need to validate the linearity assumption. Therefore, this study used Monte Carlo simulation to investigate the assumption appropriateness and fill in this research gap. The Monte Carlo simulation examined how the average market preference changes with the price of the remanufactured product. Unlike most previous studies that included a constant WTP (see Figure 1a), this study considered the effect of both TC and WTP, and their heterogeneity across customers (see Figure 1b). Additionally, to reflect the potential variability in individual customers’ preference functions between TC and WTP, this study incorporated three representative preference function forms [24,25]: a decreasing vector model (Type I), ideal-point model (Type II), and increasing vector model (Type III).
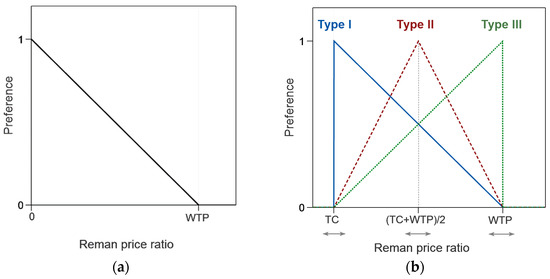
Figure 1.
Assumptions on an individual customer’s price preference for a remanufactured product: (a) Linear price preference (prevailing assumption in previous studies); (b) three price-preference functions with heterogeneous TC and WTP (assumption in this study).
To the best of the author’s knowledge, this study is the first attempt to highlight the effect of heterogeneous TCs on price preference for a remanufactured product. This study highlights that a linear or monotonically decreasing relationship between price and customer preference may not hold at an aggregate level. This implies that an inverted U- or bell-shaped, or triangular function may explain the average price preference better in the remanufacturing market. The prevailing “the cheaper, the better” or the linearity assumption should be carefully revisited in light of heterogeneous TC as the market preference can be overestimated, especially for low prices.
The remainder of this paper is organized as follows. Section 2 describes the data and the model setup for the simulation. Section 3 presents the simulation results, and Section 4 discusses the implications of the results. Section 5 provides the conclusions, limitations, and future research directions.
2. Data and Model Setup for Monte Carlo Simulation
2.1. Data and Random Variables
A Monte Carlo simulation was conducted to estimate the average price preference for a remanufactured product when customers have heterogeneous TC and WTP. For the simulation, the distributions of TC and WTP were first identified. Survey data from Lee and Kwak [5] were adopted to fit and model TC and WTP.
In their empirical study on the relative value of remanufactured products, Lee and Kwak conducted a survey to test whether and how product categories and business models (ownership and rental) affect the consumer valuation and acceptance of remanufactured products. Their survey comprised three sets of questions asking the participants about their perception, purchase intention, and acceptable prices for remanufactured products. A group of 95 students from a Korean university participated in the survey. All participants offered answers regarding their perception and purchase intention, but only the participants with a positive purchase intention were asked to provide their acceptable prices.
This study focused on participants’ responses regarding their acceptable prices. On the basis of Van Westendorp’s price-sensitivity measure approach [26], Lee and Kwak collected data on four types of acceptable prices from the participants. These included too-cheap, cheap, expensive, and too-expensive prices, each representing the boundary price at which the participant begins to think a remanufactured product is too cheap, cheap, expensive, and too expensive, respectively. These prices are given in the form of a price ratio by dividing them by the new product price (i.e., the price of the equivalent new product having the same design and warranty). The survey data corresponded to multiple product types, including laptops, smartphones, and printers.
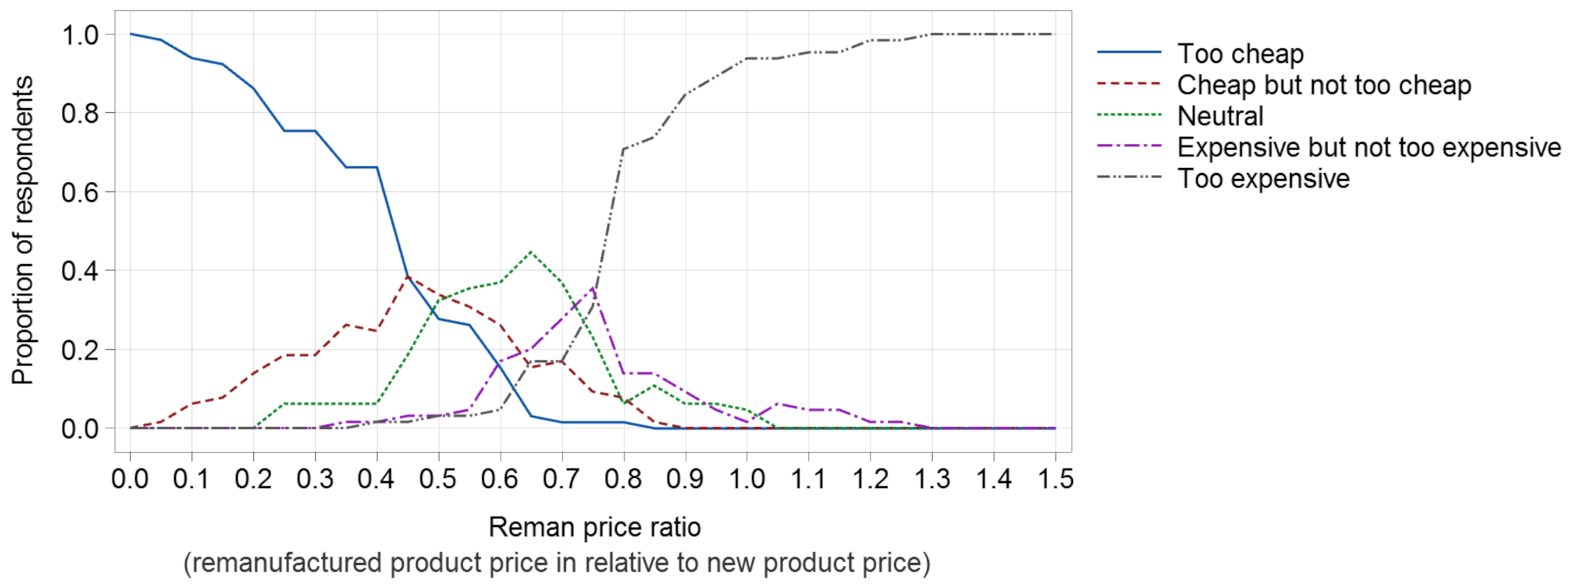
The survey data explain how each participant perceives a certain price of a remanufactured product and how price perception varies across participants. Considering the example of smartphones, Figure 2 depicts how individual customers can differently perceive the same price of the same remanufactured smartphone. For instance, when a remanufactured smartphone is priced at 45% of the new product price, about 40% of the customers perceived it as too cheap (so they would not buy it), 40% thought it was cheap but not too cheap, and about 20% considered it to be not cheap or expensive. A very small portion of respondents thought it was expensive or too expensive. Figure 2 provides evidence of customer heterogeneity in their price perception. The solid blue line and dotted gray line in Figure 2 indicate heterogeneous TC and WTP, respectively, which is the main assumption of this study.
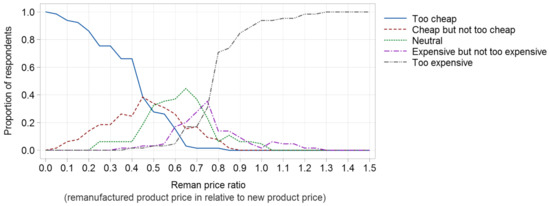
Figure 2.
Customers’ perception towards the price of remanufactured smartphones (drawn on the basis of data from Lee and Kwak [5]).
Table 1 summarizes the data used in this study. Here, α represents the ratio of the WTP to TC, a newly introduced variable for the simulation. As the survey data comprised pairs of TC and WTP obtained from the same participant, it was possible to calculate α for each participant. By definition, a customer’s WTP should always be greater than or equal to their TC. This was also confirmed by the data, as the minimal α was greater than 1 for all three product types. This study defines WTP as a function of α and TC to maintain the relative magnitude between TC and WTP during the simulation, as shown in Equation (1):
where TC and α were defined as random input variables in the simulation, and WTP was modeled as the outcome of TC and α.

Table 1.
Data summary: TC and WTP in ratio to the price of equivalent new products [5].
2.2. Distribution Fitting and Correlation Analysis
For input variables TC and α, truncated normal and lognormal distributions were assumed, respectively. To determine the distribution type and parameters (mean and standard deviation) for TC and α, distribution fitting and goodness-of-fit tests were conducted using Analytic Solver Simulation V2020, a tool for distribution fitting and Monte Carlo simulation, created by Frontline Systems Inc. Since TC and α were continuous data, the chi-squared, Kolmogorov–Smirnov, and Anderson–Darling tests were performed to rank fitted distributions (indepth description of each test is beyond the scope of this study; more details can be found in [27,28]). Due to the small sample sizes (Table 1), statistical significance was not achieved. However, normal and lognormal distributions were among the best-fit distributions for TC and α, respectively.
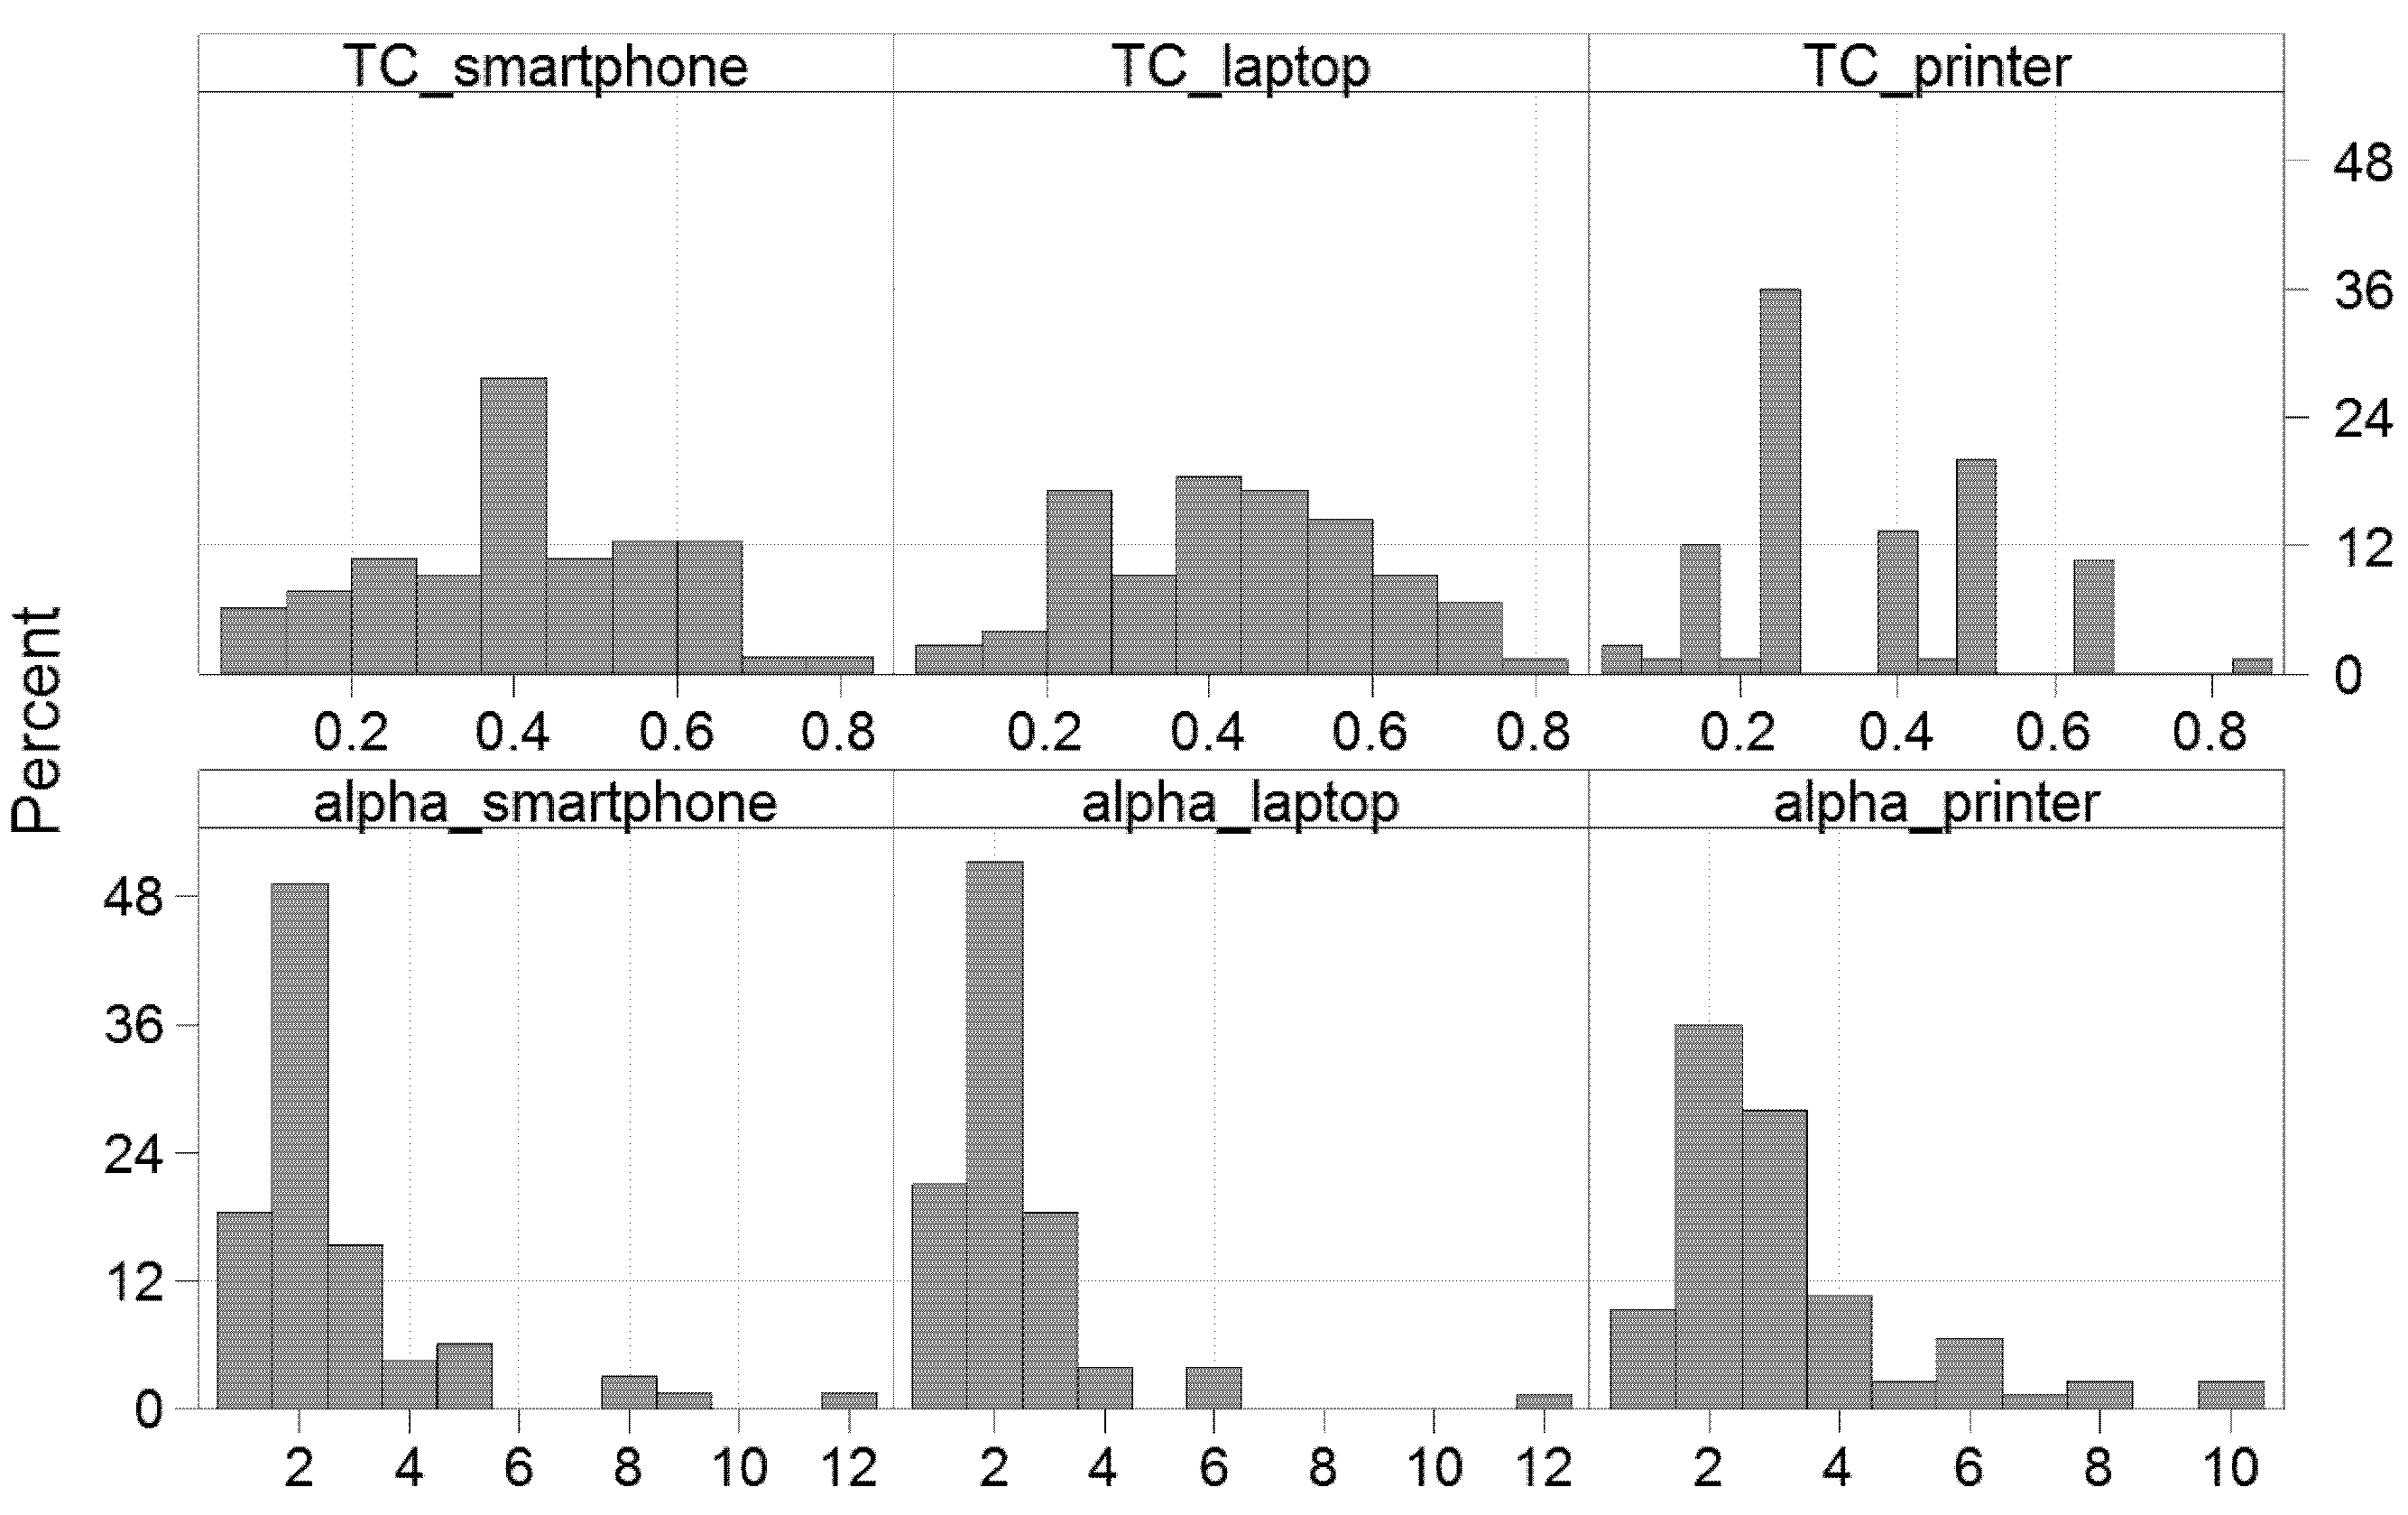
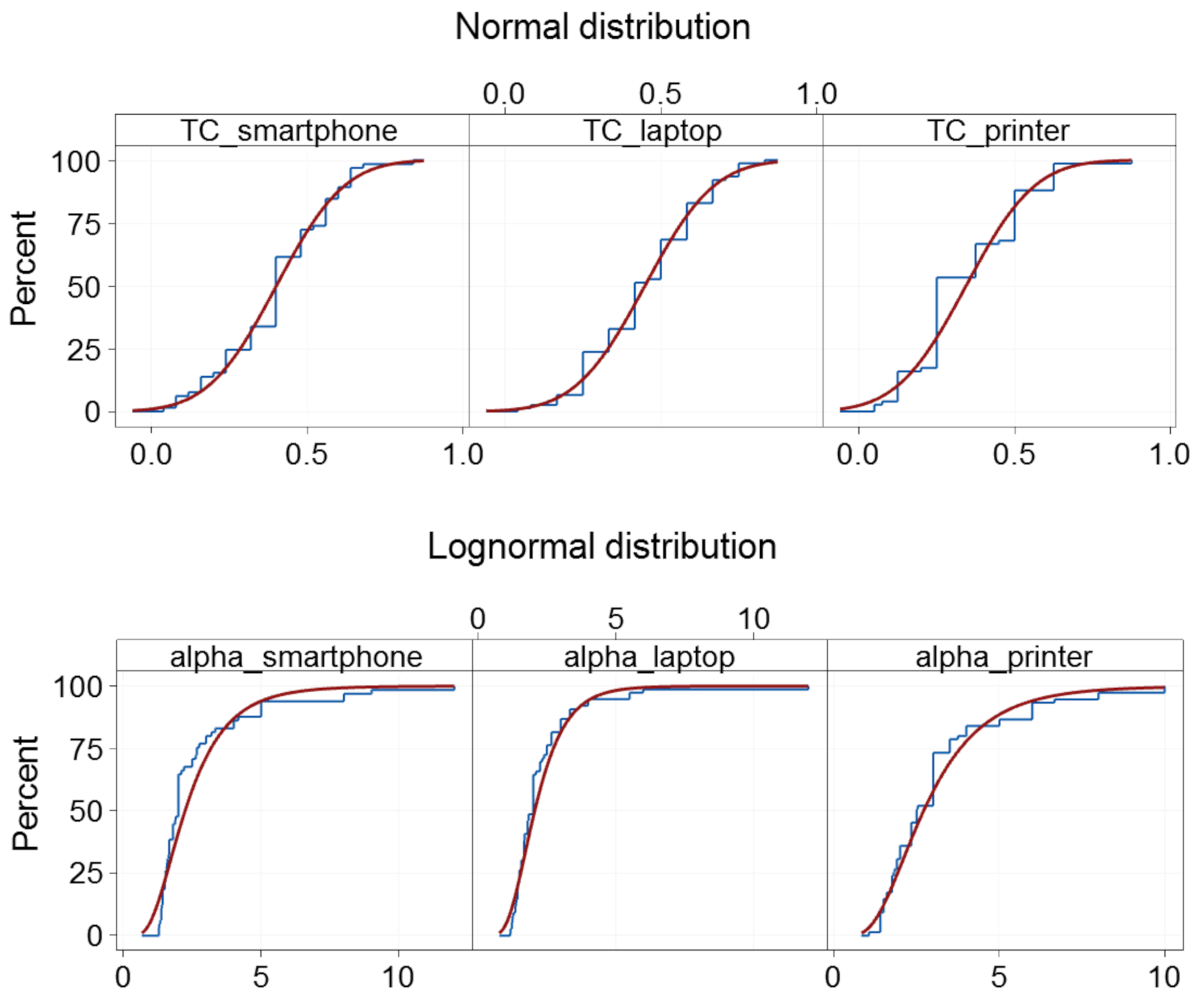
Truncation of distributions was conducted on the basis of the definition of TC and α. As TC is a price, it should always be non-negative (i.e., TC ≥ 0); furthermore, α should always be ≥1, as defined in Equation (1) (such magnitude conditions are also confirmed by the data in Table 1). The distributions of TC and α were truncated below at TC = 0 and above at α = 1, respectively, so that their samples satisfied the magnitude conditions. The histograms in Figure 3 and the empirical cumulative distribution function plots in Figure 4 also implied that TC and α fit well with truncated normal and truncated lognormal distributions, respectively.
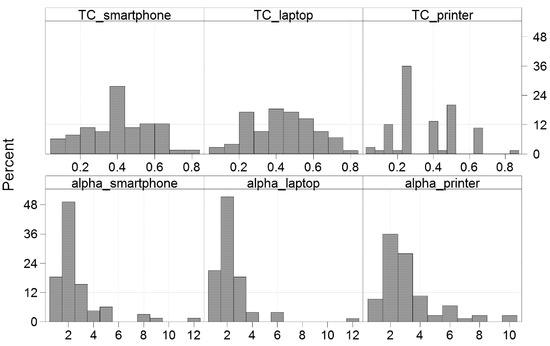
Figure 3.
Histograms of TC and α for three product types (smartphone, laptop, and printer).
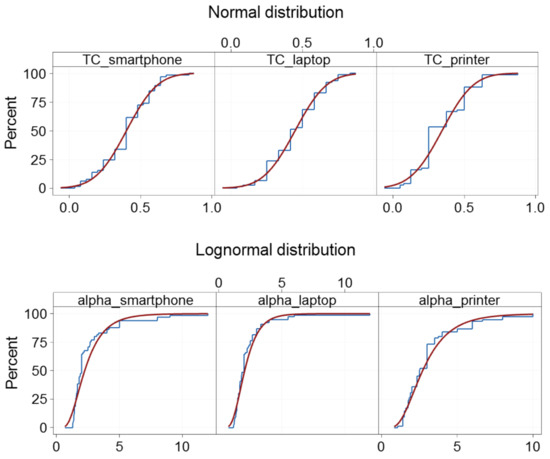
Figure 4.
Empirical cumulative distribution function plots of TC (normal distribution) and α (lognormal distribution) for three product types (smartphone, laptop, and printer).
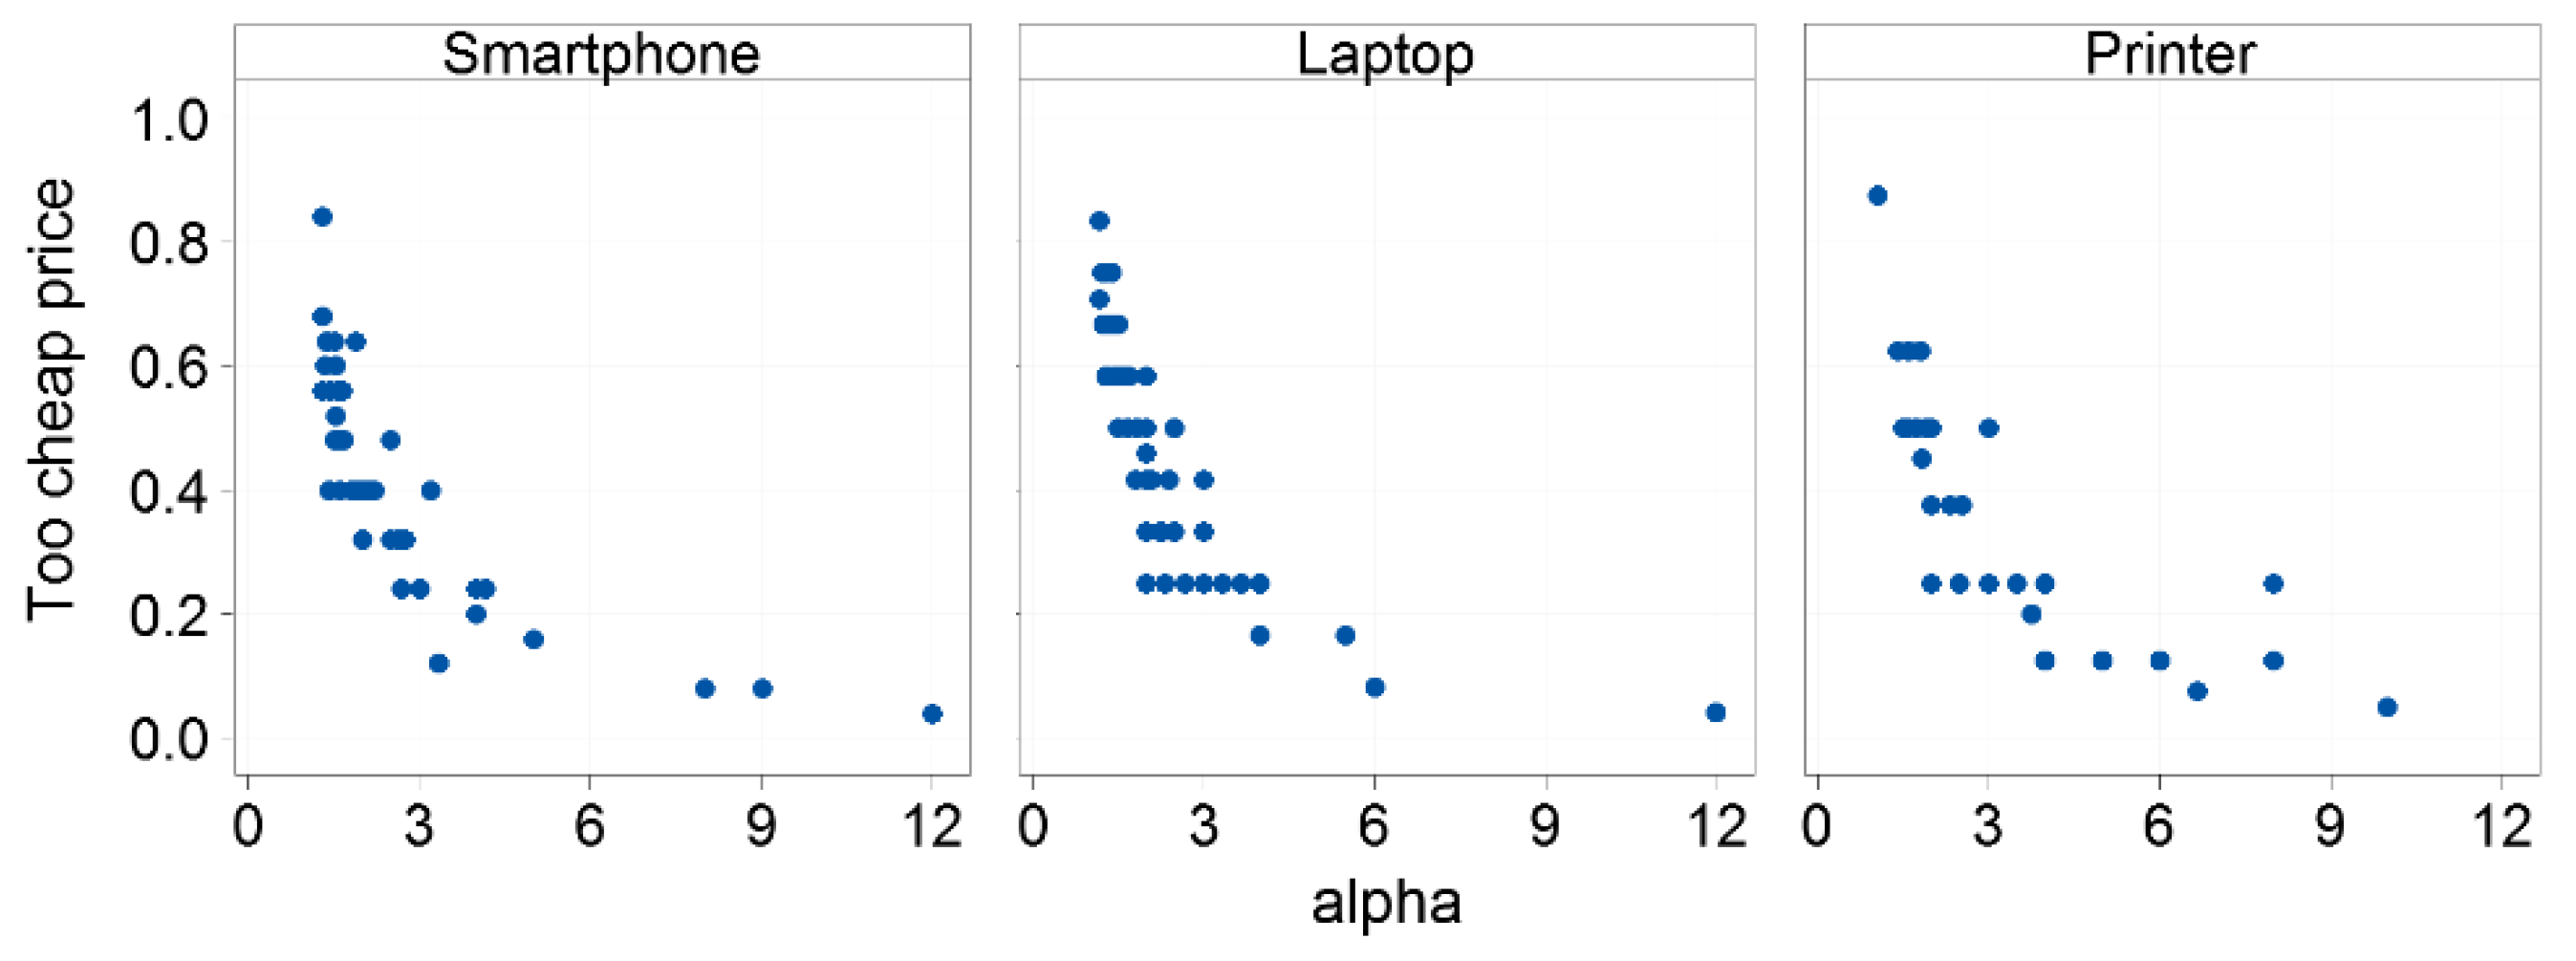
Correlation among input variables is an important factor to consider in the Monte Carlo simulation. Scatter plots in Figure 5 show that TC and α had a strong negative nonlinear relationship. Therefore, correlation analysis was conducted using the Analytic Solver Simulation V2020, and the rank correlation between TC and α was reflected during sampling in the Monte Carlo simulation. Table 2 summarizes in detail the results of the distribution fitting and correlation analyses.
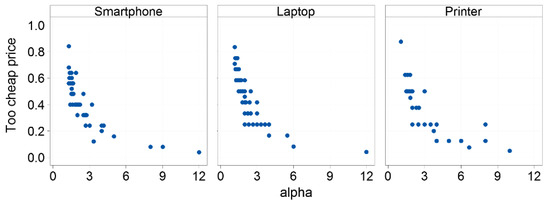
Figure 5.
Scatter plots of TC and alpha.
Table 2.
Fitted distribution and correlation setup results.
2.3. Preference Function Form of Individual Customers
An individual customer’s price preference below TC or above WTP is zero. However, how the preference changes between TC and WTP remains to be clarified. The increasing or decreasing vector model and ideal-point model are among the representative function forms in preference modeling [24,25]. In this study, three simple function forms (i.e., Types I, II, and III; see Figure 1b) were considered to represent an individual’s price preference by adopting the vector and ideal-point models.
Type I represents a decreasing vector model (linear function) that reaches the maximal preference (=1) at TC and the minimal preference (=0) at WTP. This may be the form closest to the preference function that adheres to traditional laws of price and demand, and it is used in most of the existing literature [8,18,19,20,21]. Type II represents an ideal-point preference model that reaches the maximal preference at the middle of the TC and WTP, that is, (TC + WTP)/2. The preference decreases linearly to zero as the price approaches either TC or WTP. An empirical study [22] provided an example of such an ideal-point preference model, where customers associated the price with product quality and accepted trade-offs between price and quality. Type III represents an increasing vector model maximized at WTP and minimized at TC, opposite to Type I. It is a hypothetical form assumed for a product for which customers have a strong price–quality association, and give high priority for quality [29] or a Veblen good (usually a luxury product) for which demand increases as the price increases [30,31].
Equations (2)–(4) describe the preference function f (x) for Types I, II, and III, respectively, where x denotes the reman price ratio, that is, the ratio of the price of a remanufactured product the corresponding price of a new product.
3. Simulation Results
Multiple Monte Carlo simulations were conducted to estimate how the average price preference changes with the reman price ratio by changing the ratio from 0 to 1.5 at increments of 0.05. Analytic Solver Simulation V2020 was used for the simulation in this study. Ten thousand trials were conducted per simulation (per each ratio). Algorithm 1 shows the pseudocode of the Monte Carlo simulations.
| Algorithm 1: Pseudocode of the Monte Carlo simulations |
|
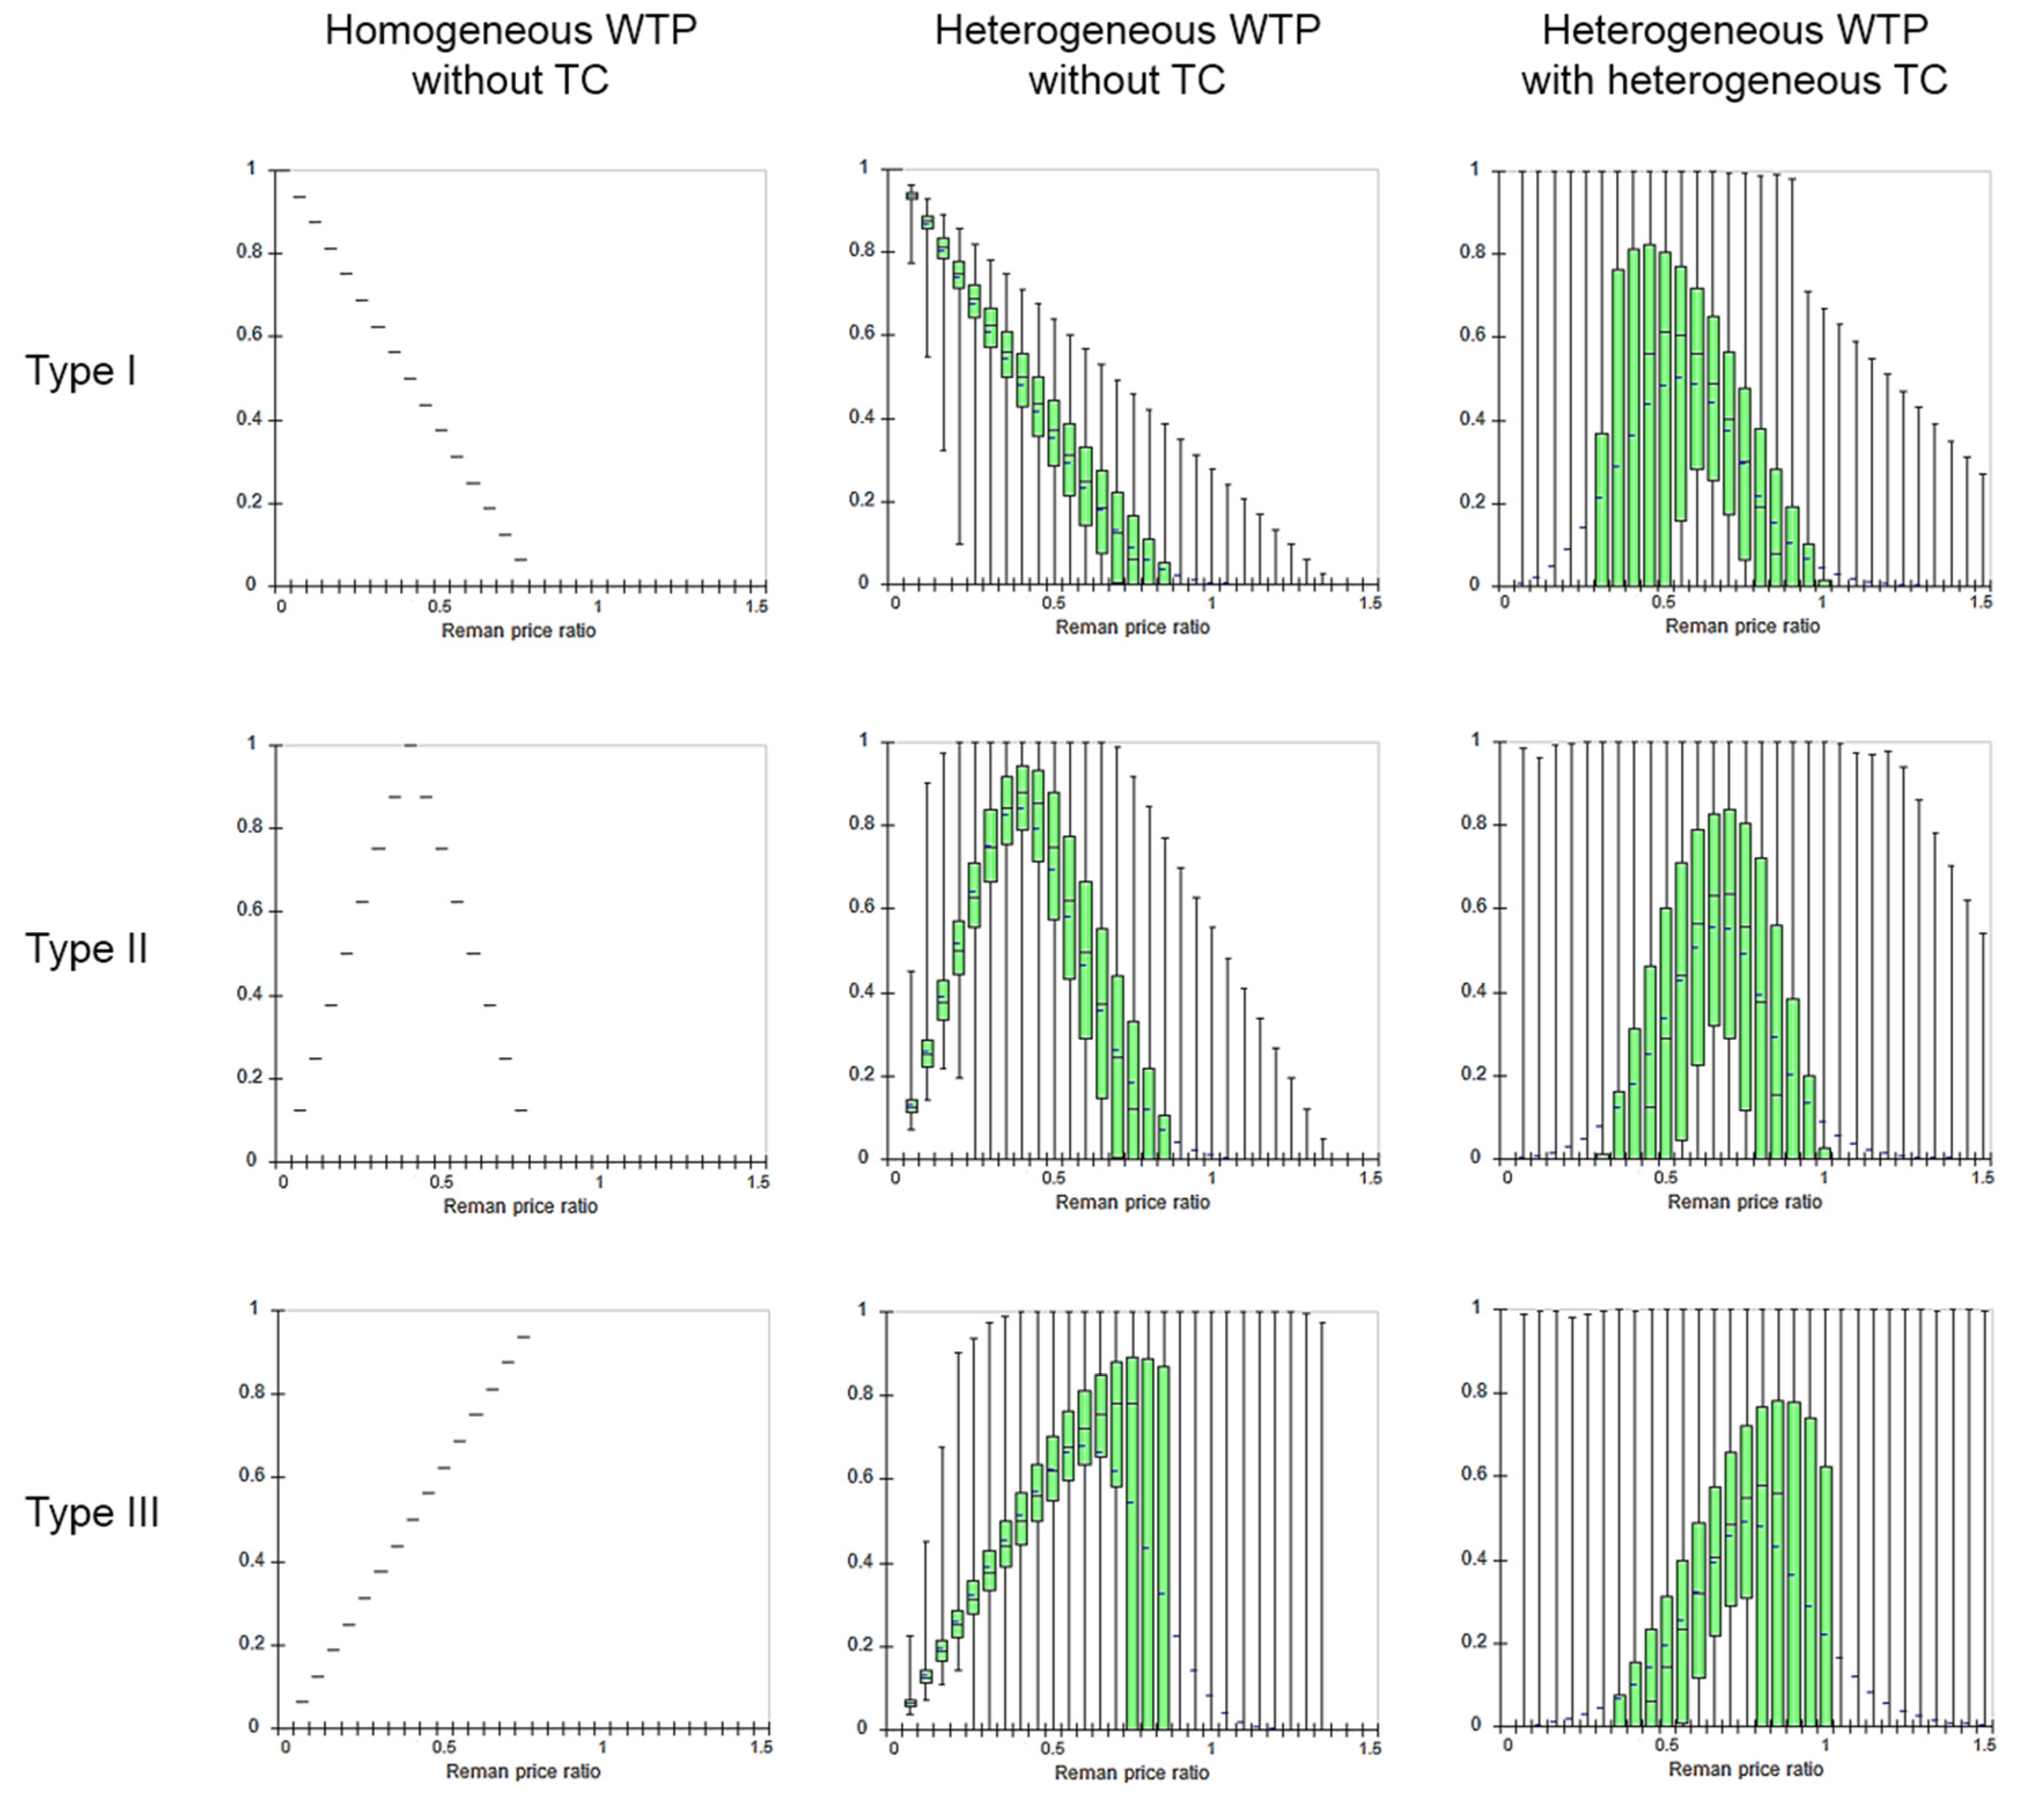
This study focused on the case where both WTP and TC are heterogeneous in the market. However, to clarify the effect of heterogeneous TC and WTP, two other cases were considered together: homogeneous WTP without TC, and heterogeneous WTP without TC. The first case represents the prevailing assumption in most of the existing literature, where WTP is homogeneous, and there is no TC (or TC is 0) for a remanufactured product. The WTP was set on the basis of the sample mean WTP. The second case reflects a case considered in a few recent studies discussing the heterogeneity of WTP without considering a TC. The WTP was fitted to a normal distribution, similar to that of the TC.
Figure 6 compares the simulation results of the three different cases using box plots taking the smartphone as an example. When no TC is involved, the average price preference is identical or very similar to the corresponding individual preference function. In particular, for the lower range of the reman price ratios, the average price preference (both mean and median) creates an almost linear function, supporting the previous linearity assumption. However, when a heterogeneous TC is involved, a significant change occurs. Regardless of the individual preference function, the average preference at the aggregate level shows an inverted U-shape.
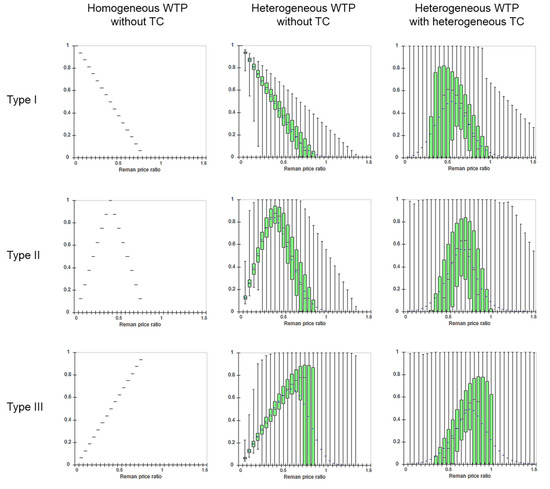
Figure 6.
Box plot of simulation results (smartphone): Impact of different assumptions on heterogeneity of TC and WTP.
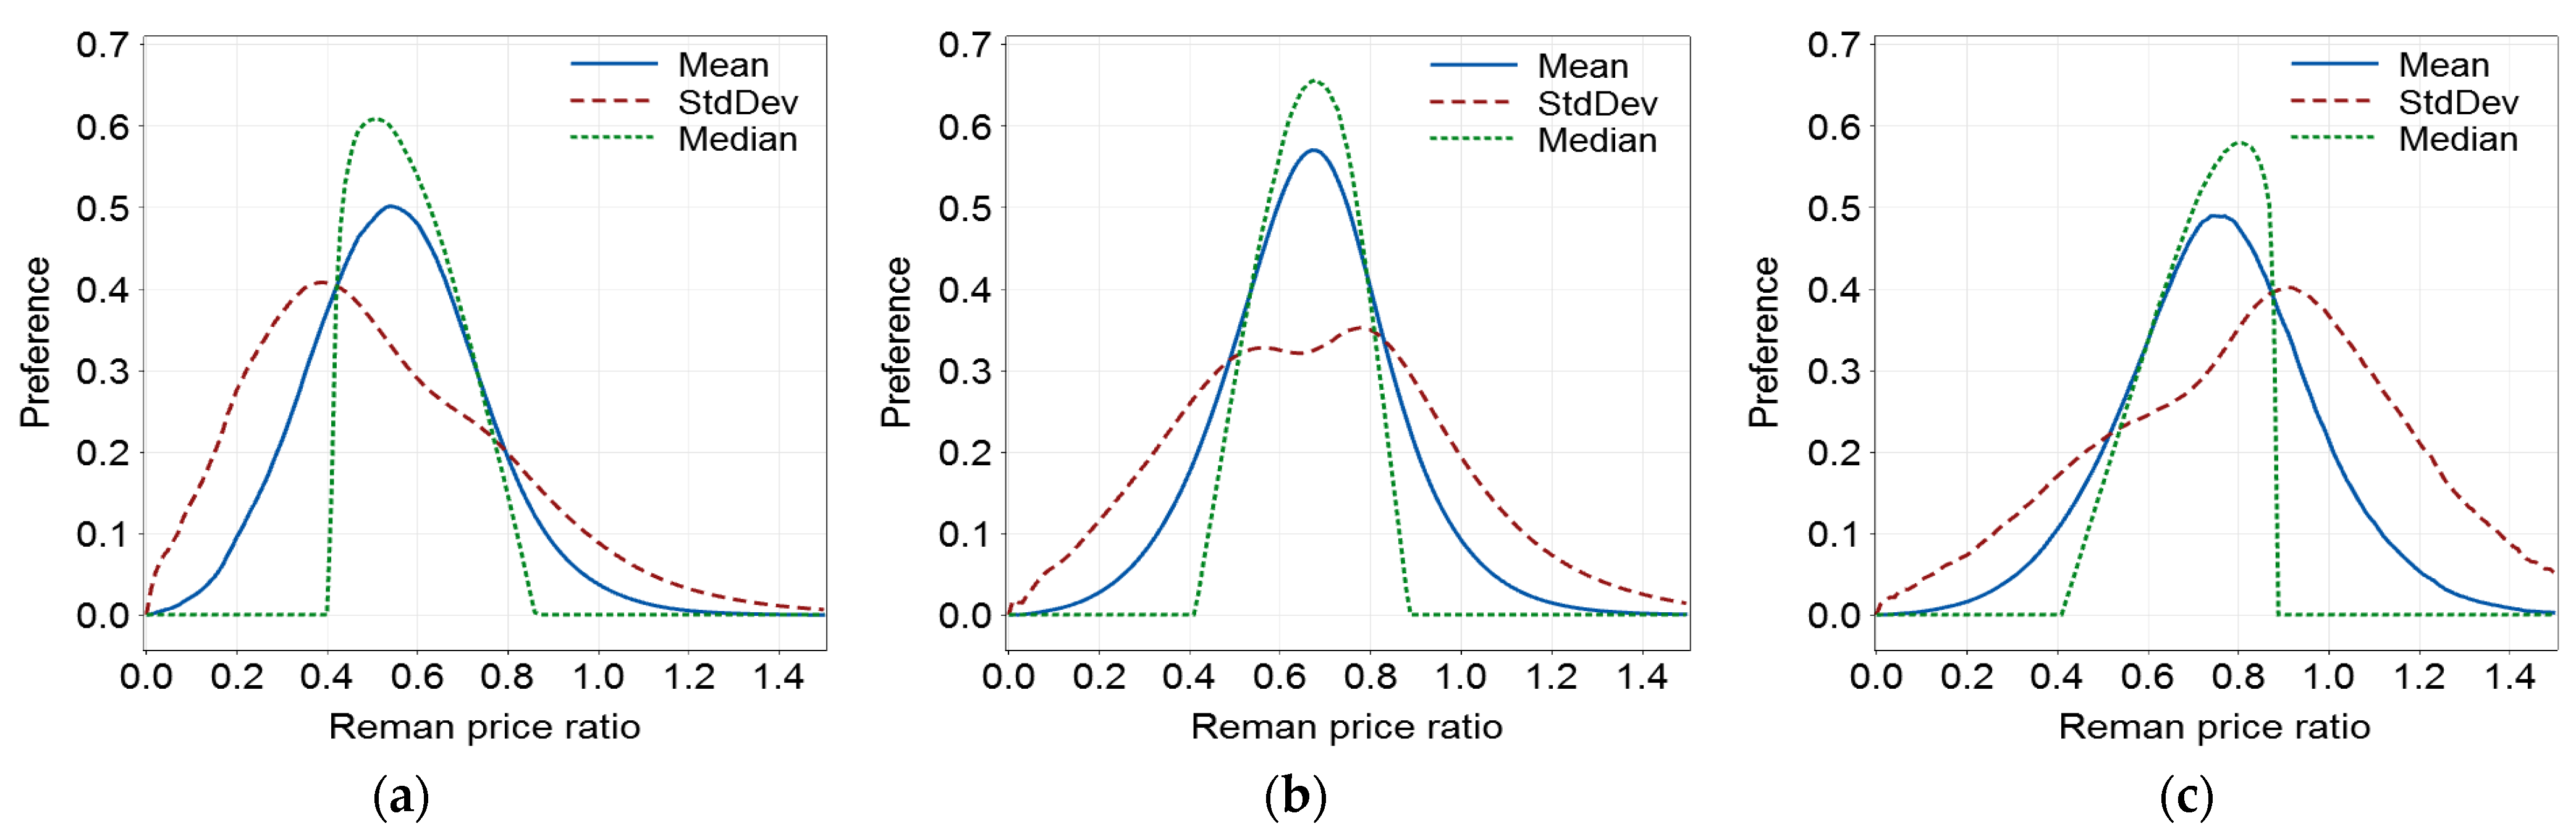
Focusing on the case of heterogeneous TC and WTP, Figure 7 shows a summary of the simulation results using the smartphone example. The mean and median drew different lines due to trials with extreme preference values, and the median showed a more skewed and narrow distribution. However, both showed a unimodal function with a peak between the mean TC and mean WTP.
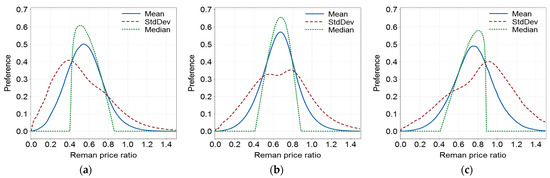
Figure 7.
Statistical summary of simulation results (smartphone): mean, standard deviation (StdDev), and median of price preference for different levels of reman price ratio: (a) Type I; (b) Type II; (c) Type III.
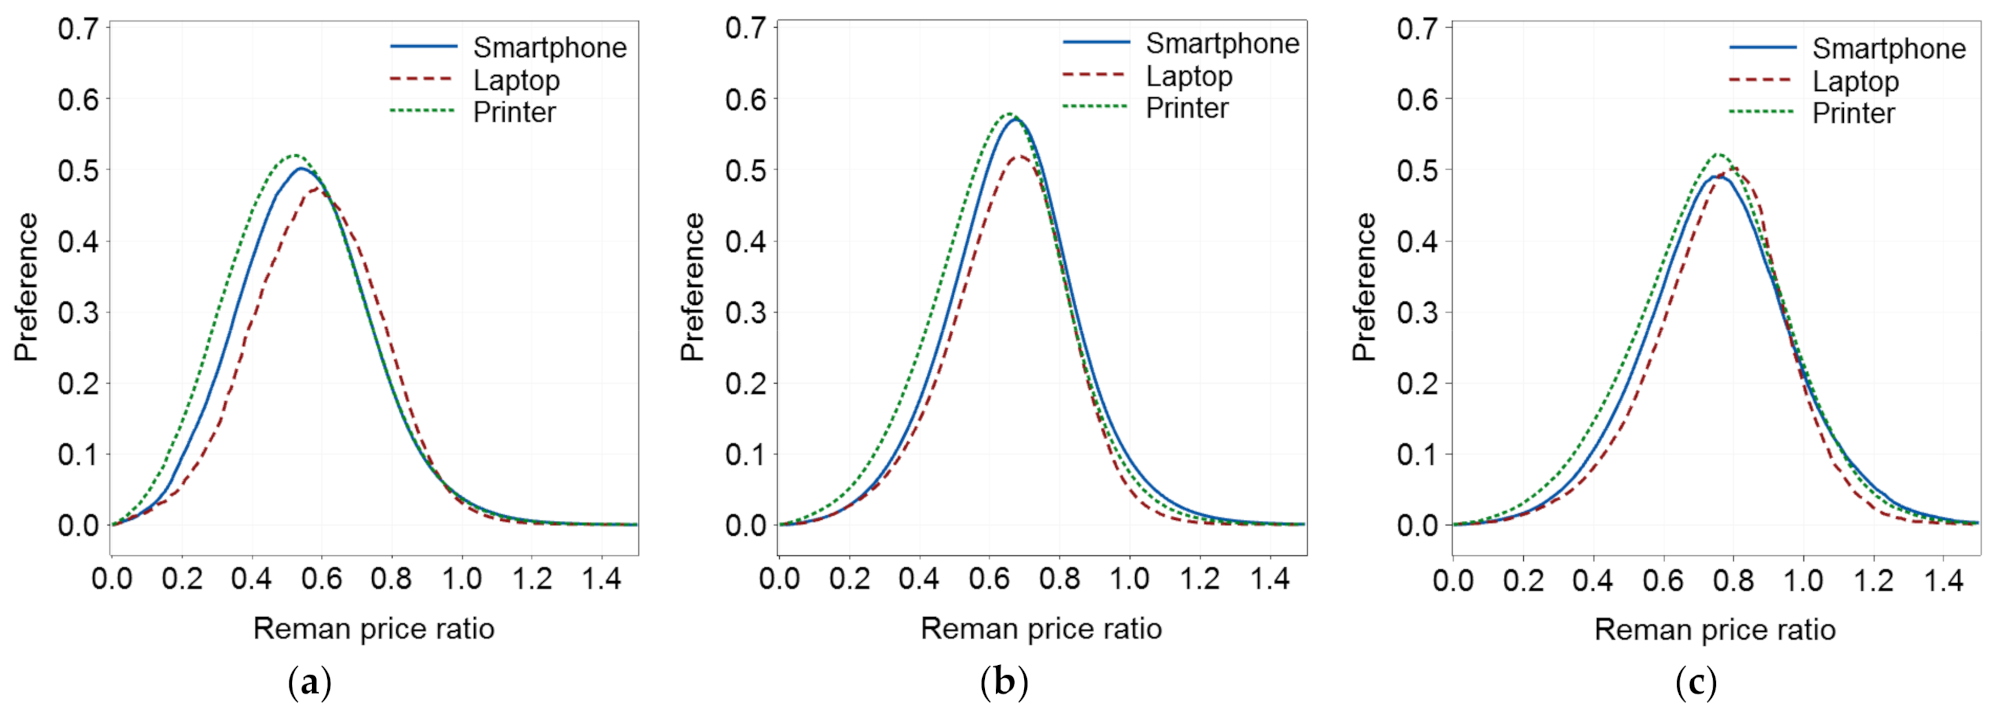
Figure 8 shows the mean price-preference results for all three product types. An inverted U- or bell-shaped curve was observed for all product types, regardless of the form of the customers’ price preferences.
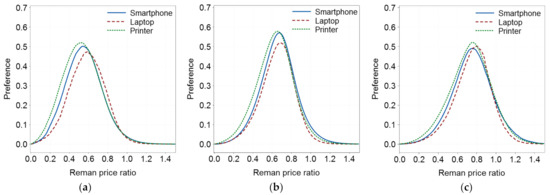
Figure 8.
Mean price preference for different product types: (a) Type I; (b) Type II; (c) Type III.
4. Discussion and Implications
The relationship between price and customer preferences is one of the most critical inputs in various decision-making processes in remanufacturing businesses. Despite its importance, however, there is a lack of investigation into the price–preference relationship itself.
Regarding price-preference modeling, previous studies have adopted two assumptions: first, a decreasing vector preference model (linear function) connecting the two (x, y) points, (0, 1) and (WTP, 0); and second, a constant WTP in a market. Although several recent studies addressed WTP heterogeneity, a linear function is still commonly used in most existing remanufacturing research. The simulation results in Figure 6 also support the linearity assumption. When there is only WTP in the market (first two columns in Figure 6) and individual customers are characterized by the decreasing vector preference model (Type I), the average price preference seems to follow a linear pattern, exactly (in the case of a constant WTP) or at least approximately (in the case of a heterogeneous WTP).
One concern is that customers in the remanufacturing market may have both heterogeneous WTP and TC. Simulation results demonstrated that the prevailing linearity assumption may not be applicable for remanufactured products if customers show heterogeneity in TC and WTP. The average price preference creates an inverted U- or bell-shaped curve, maximized between TC and WTP.
The inverted U shape was observed regardless of product type and individual customers’ preference function form. The average price preference for smartphones, laptops, and printers showed a similar inverted U shape, although the mean and standard deviation values were different. The three preference function forms, namely, Types I, II, and III that differ greatly at an individual level, led to a similar inverted U-shaped function at an aggregate level.
While previous studies on remanufacturing highlighted the importance of the optimal pricing and production planning of remanufactured products, price-preference assumptions in decision making have not been empirically validated. The simulation results in this study indicated that the previous linearity assumption should be carefully applied considering the existence and distribution of TC and WTP in the market. The average price preference is greatly affected by the TC and WTP of customers. Researchers and practitioners first need to consider if customers in the target market have TC and WTP for remanufactured products, and if so, whether the TC and WTP are homogeneous or heterogeneous.
If the target market is characterized by heterogeneous TC and WTP, linear approximation in price-preference modeling should be decided with caution. If a linear function is assumed, the market preference can be overestimated, especially at low price levels. One option for the decision maker is to divide the target market into more homogeneous segments in terms of TC and WTP, so as to make the linearity assumption valid at the segment level. The other option is to adopt different function forms instead of a linear one. In this case, a bell-shaped or triangular function is expected to better explain the market price preference. Although it was left out of the scope of this study, curve fitting with nonlinear regression can be used with Monte Carlo simulation to identify the detailed function of the average market price preference.
5. Conclusions
To investigate the validity of the prevailing linearity or “the cheaper, the better” assumption for remanufactured products, this study conducted a Monte Carlo simulation to examine the effect of TC and WTP on the average price preference for a remanufactured product. Simulation results demonstrated that the linearity assumption may not be applicable for remanufactured products for which customers show heterogeneity in TC and WTP. With heterogeneous TC and WTP, the average price preference revealed an inverted U shape, independent of the product type and individual customers’ preference function form. Results implied that a bell-shaped or triangular function may serve as a better choice than a linear function can when modeling market price preference for remanufactured products.
To the best of the author’s knowledge, this study is the first to address the effect of heterogeneous TCs on the market price preference regarding a remanufactured product. Incorporating different function forms for individual customers’ price preference is another contribution of this study. However, this also study has limitations. It is based on secondary survey data with a small sample size, and it considered only three product categories. The survey data demonstrate potential heterogeneity in TC and WTP across customers, and the simulation can show the potential effect of heterogeneous TC and WTP. However, it may be difficult to generalize the results of this study to all markets and all product categories. Additionally, the TC and WTP of the participants are stated answers and may be different from their actual behaviors. To obtain a general idea about the existence and distribution of WTP and TC, future research should involve a larger sample and consider including data on actual purchase behavior. The validity and variability of individual customer preference function forms should also be further investigated. Additionally, the market composition of the preference function forms and the distribution of the weight given to price should be studied to model the market-level price preference for remanufactured products.
In the future, it is necessary and promising to study the effect of customers’ personal profiles on TC and WTP. Personal profile characteristics, such as age, income level, education, prior knowledge and experiences, and the level of involvement for a product category, are expected to significantly influence TC and WTP. Product characteristics and business models (e.g., ownership, rental, lease, sharing) are other potential factors affecting the TC and WTP for remanufactured products. Clarifying the effect of product or business model characteristics (e.g., initial cost required, product reliability, design specifications, frequency and purpose of use, and relevance to hygiene) on TC and WTP provides useful implications for a better understanding of customer price preferences for remanufactured products.
Funding
This work was supported by the Basic Science Research Program through the National Research Foundation of Korea (NRF) funded by the Ministry of Science, ICT, and Future Planning (NRF-2019R1F1A1041099).
Institutional Review Board Statement
Not applicable.
Informed Consent Statement
Not applicable.
Data Availability Statement
Publicly available datasets were analyzed in this study. This data can be found here: [http://www.mdpi.com/2071-1050/12/18/7581/s1 (accessed on 10 August 2021)].
Conflicts of Interest
The author declares no conflict of interest. The funders had no role in the design of the study; in the collection, analyses, or interpretation of data; in the writing of the manuscript, or in the decision to publish the results.
References
- Barros, M.V.; Salvador, R.; do Prado, G.F.; de Francisco, A.C.; Piekarski, C.M. Circular Economy as a Driver to Sustainable Businesses. Clean. Environ. Syst. 2021, 2, 100006. [Google Scholar] [CrossRef]
- Velenturf, A.P.M.; Purnell, P. Principles for a Sustainable Circular Economy. Sustain. Prod. Consum. 2021, 27, 1437–1457. [Google Scholar] [CrossRef]
- Hazen, B.T.; Mollenkopf, D.A.; Wang, Y. Remanufacturing for the Circular Economy: An Examination of Consumer Switching Behavior. Bus. Strat. Env. 2017, 26, 451–464. [Google Scholar] [CrossRef]
- Kwak, M. Optimal Line Design of New and Remanufactured Products: A Model for Maximum Profit and Market Share with Environmental Consideration. Sustainability 2018, 10, 4283. [Google Scholar] [CrossRef] [Green Version]
- Lee, S.; Kwak, M. Consumer Valuation of Remanufactured Products: A Comparative Study of Product Categories and Business Models. Sustainability 2020, 12, 7581. [Google Scholar] [CrossRef]
- Ijomah, W. A Model-Based Definition of the Generic Remanufacturing Business Process. Ph.D. Thesis, University of Plymouth, Plymouth, UK, 2002. [Google Scholar]
- Abbey, J.D.; Meloy, M.G.; Blackburn, J.; Guide, V.D.R. Consumer Markets for Remanufactured and Refurbished Products. Calif. Manag. Rev. 2015, 57, 26–42. [Google Scholar] [CrossRef]
- Kwak, M.; Kim, H. Green Profit Maximization through Integrated Pricing and Production Planning for a Line of New and Remanufactured Products. J. Clean. Prod. 2017, 142, 3454–3470. [Google Scholar] [CrossRef] [Green Version]
- Rizova, M.I.; Wong, T.C.; Ijomaj, W. A Systematic Review of Decision-Making in Remanufacturing. Comput. Ind. Eng. 2020, 147, 106681. [Google Scholar] [CrossRef]
- Fleischmann, M.; Bloemhof-Ruwaard, J.M.; Dekker, R.; Van Der Laan, E.; Van Nunen, J.; VanWassenhove, L.N. Quantitative Models for Reverse Logistics: A Review. Eur. J. Oper. Res. 1997, 103, 1–17. [Google Scholar] [CrossRef] [Green Version]
- Hatcher, G.D.; Ijomah, W.L.; Windmill, J.F.C. Design for Remanufacture: A Literature Review and Future Research Needs. J. Clean. Prod. 2011, 19, 2004–2014. [Google Scholar]
- Singhal, D.; Tripathy, S.; Jena, S.K. Acceptance of Remanufactured Products in the Circular Economy: An Empirical Study in India. Manag. Decis. 2019, 57, 953–970. [Google Scholar] [CrossRef]
- Singhal, D.; Jena, S.K.; Tripathy, S. Factors Influencing the Purchase Intention of Consumers towards Remanufactured Products: A Systematic Review and Meta-Analysis. Int. J. Prod. 2019, 57, 7289–7299. [Google Scholar] [CrossRef]
- Wang, Y.; Hazen, B.T.; Mollenkopf, D.A. Consumer Value Considerations and Adoption of Remanufactured Products in Closed-Loop Supply Chains. Ind. Manag. Data Syst. 2018, 118, 480–498. [Google Scholar] [CrossRef]
- Pisitsankkhakarn, R.; Vassanadumrongdee, S. Enhancing Purchase Intention in Circular Economy: An Empirical Evidence of Remanufactured Automotive Product in Thailand. Resour. Conserv. Recycl. 2020, 156, 104702. [Google Scholar] [CrossRef]
- Abbey, J.D.; Kleber, R.; Souza, G.C.; Voigt, G. Remanufacturing and Consumers’ Risky Choices: Behavioral Modeling and the Role of Ambiguity Aversion. J. Oper. Manag. 2019, 65, 4–21. [Google Scholar] [CrossRef]
- Kleber, R.; Reimann, M.; Souza, G.C.; Zhang, W. On the Robustness of the Consumer Homogeneity Assumption with Respect to the Discount Factor for Remanufactured Products. Eur. J. Oper. Res. 2018, 269, 1027–1040. [Google Scholar] [CrossRef] [Green Version]
- Abbey, J.D.; Blackburn, J.D.; Guide, V.D.R. Optimal Pricing for New and Remanufactured Products. J. Oper. Manag. 2015, 36, 130–146. [Google Scholar] [CrossRef]
- Abbey, J.D.; Kleber, R.; Souza, G.C.; Voigt, G. The Role of Perceived Quality Risk in Pricing Remanufactured Products. Prod. Oper. Manag. 2017, 26, 100–115. [Google Scholar] [CrossRef]
- Linton, J.D. Assessing the Economic Rationality of Remanufacturing Products. J. Prod. Innov. Manag. 2008, 25, 287–302. [Google Scholar] [CrossRef]
- Kim, J.; Kim, H.M. Impact of Generational Commonality of Short Life Cycle Products in Manufacturing and Remanufacturing Processes. J. Mech. Des. 2021, 142, 122001. [Google Scholar] [CrossRef]
- Ovchinnikov, A. Revenue and Cost Management for Remanufactured Products. Prod. Oper. Manag. 2011, 20, 824–840. [Google Scholar] [CrossRef]
- Abbey, J.D.; Meloy, M.G.; Guide, V.D.R.; Atalay, S. Remanufactured Products in Closed-Loop Supply Chains for Consumer Goods. Prod. Oper. Manag. 2015, 24, 488–503. [Google Scholar] [CrossRef]
- Orme, B.K. Getting Started with Conjoint Analysis, 2nd ed.; Research Publishers LLC: Madison, WI, USA, 2010; pp. 169–170. [Google Scholar]
- Kotri, A. Analyzing Customer Value Using Conjoint Analysis: The Example of a Packaging Company. In University of Tartu—Faculty of Economics and Business Administration Working Paper Series 46; Faculty of Economics and Business Administration, University of Tartu: Tartu, Estonia, 2016; pp. 3–33. [Google Scholar]
- Van Westendorp, P.H. NSS Price Sensitivity Meter (PSM)—A New Approach to Study Consumer Perception of Prices. In Proceedings of the 29th ESOMAR Congress, Venice, Italy, 5–9 September 1976; pp. 5–9. [Google Scholar]
- Frontline Solvers Reference Guide. Available online: https://www.solver.com/files/FrontlineSolversReferenceGuide.pdf (accessed on 10 August 2021).
- NIST/SEMATECH e-Handbook of Statistical Methods. Available online: http://www.itl.nist.gov/div898/handbook/ (accessed on 10 August 2021).
- When High Prices Attract Consumers and Low Prices Repel Them. Available online: https://www.psychologytoday.com (accessed on 15 July 2021).
- Bagwell, L.S.; Bernheim, B.D. Veblen Effects in a Theory of Conspicuous Consumption. Am. Econ. Rev. 1996, 86, 349–373. [Google Scholar]
- Veblen, T. The Theory of the Leisure Class: An Economic Study of Institutions; Thrift, D., Ed.; Dover Publications: New York, NY, USA, 1994. [Google Scholar]
Publisher’s Note: MDPI stays neutral with regard to jurisdictional claims in published maps and institutional affiliations. |
© 2021 by the author. Licensee MDPI, Basel, Switzerland. This article is an open access article distributed under the terms and conditions of the Creative Commons Attribution (CC BY) license (https://creativecommons.org/licenses/by/4.0/).