
Simulation and Analysis of Land Use Changes Applying Cellular Automata in the South of Quito and the Machachi Valley, Province of Pichincha, Ecuador


Abstract
:1. Introduction
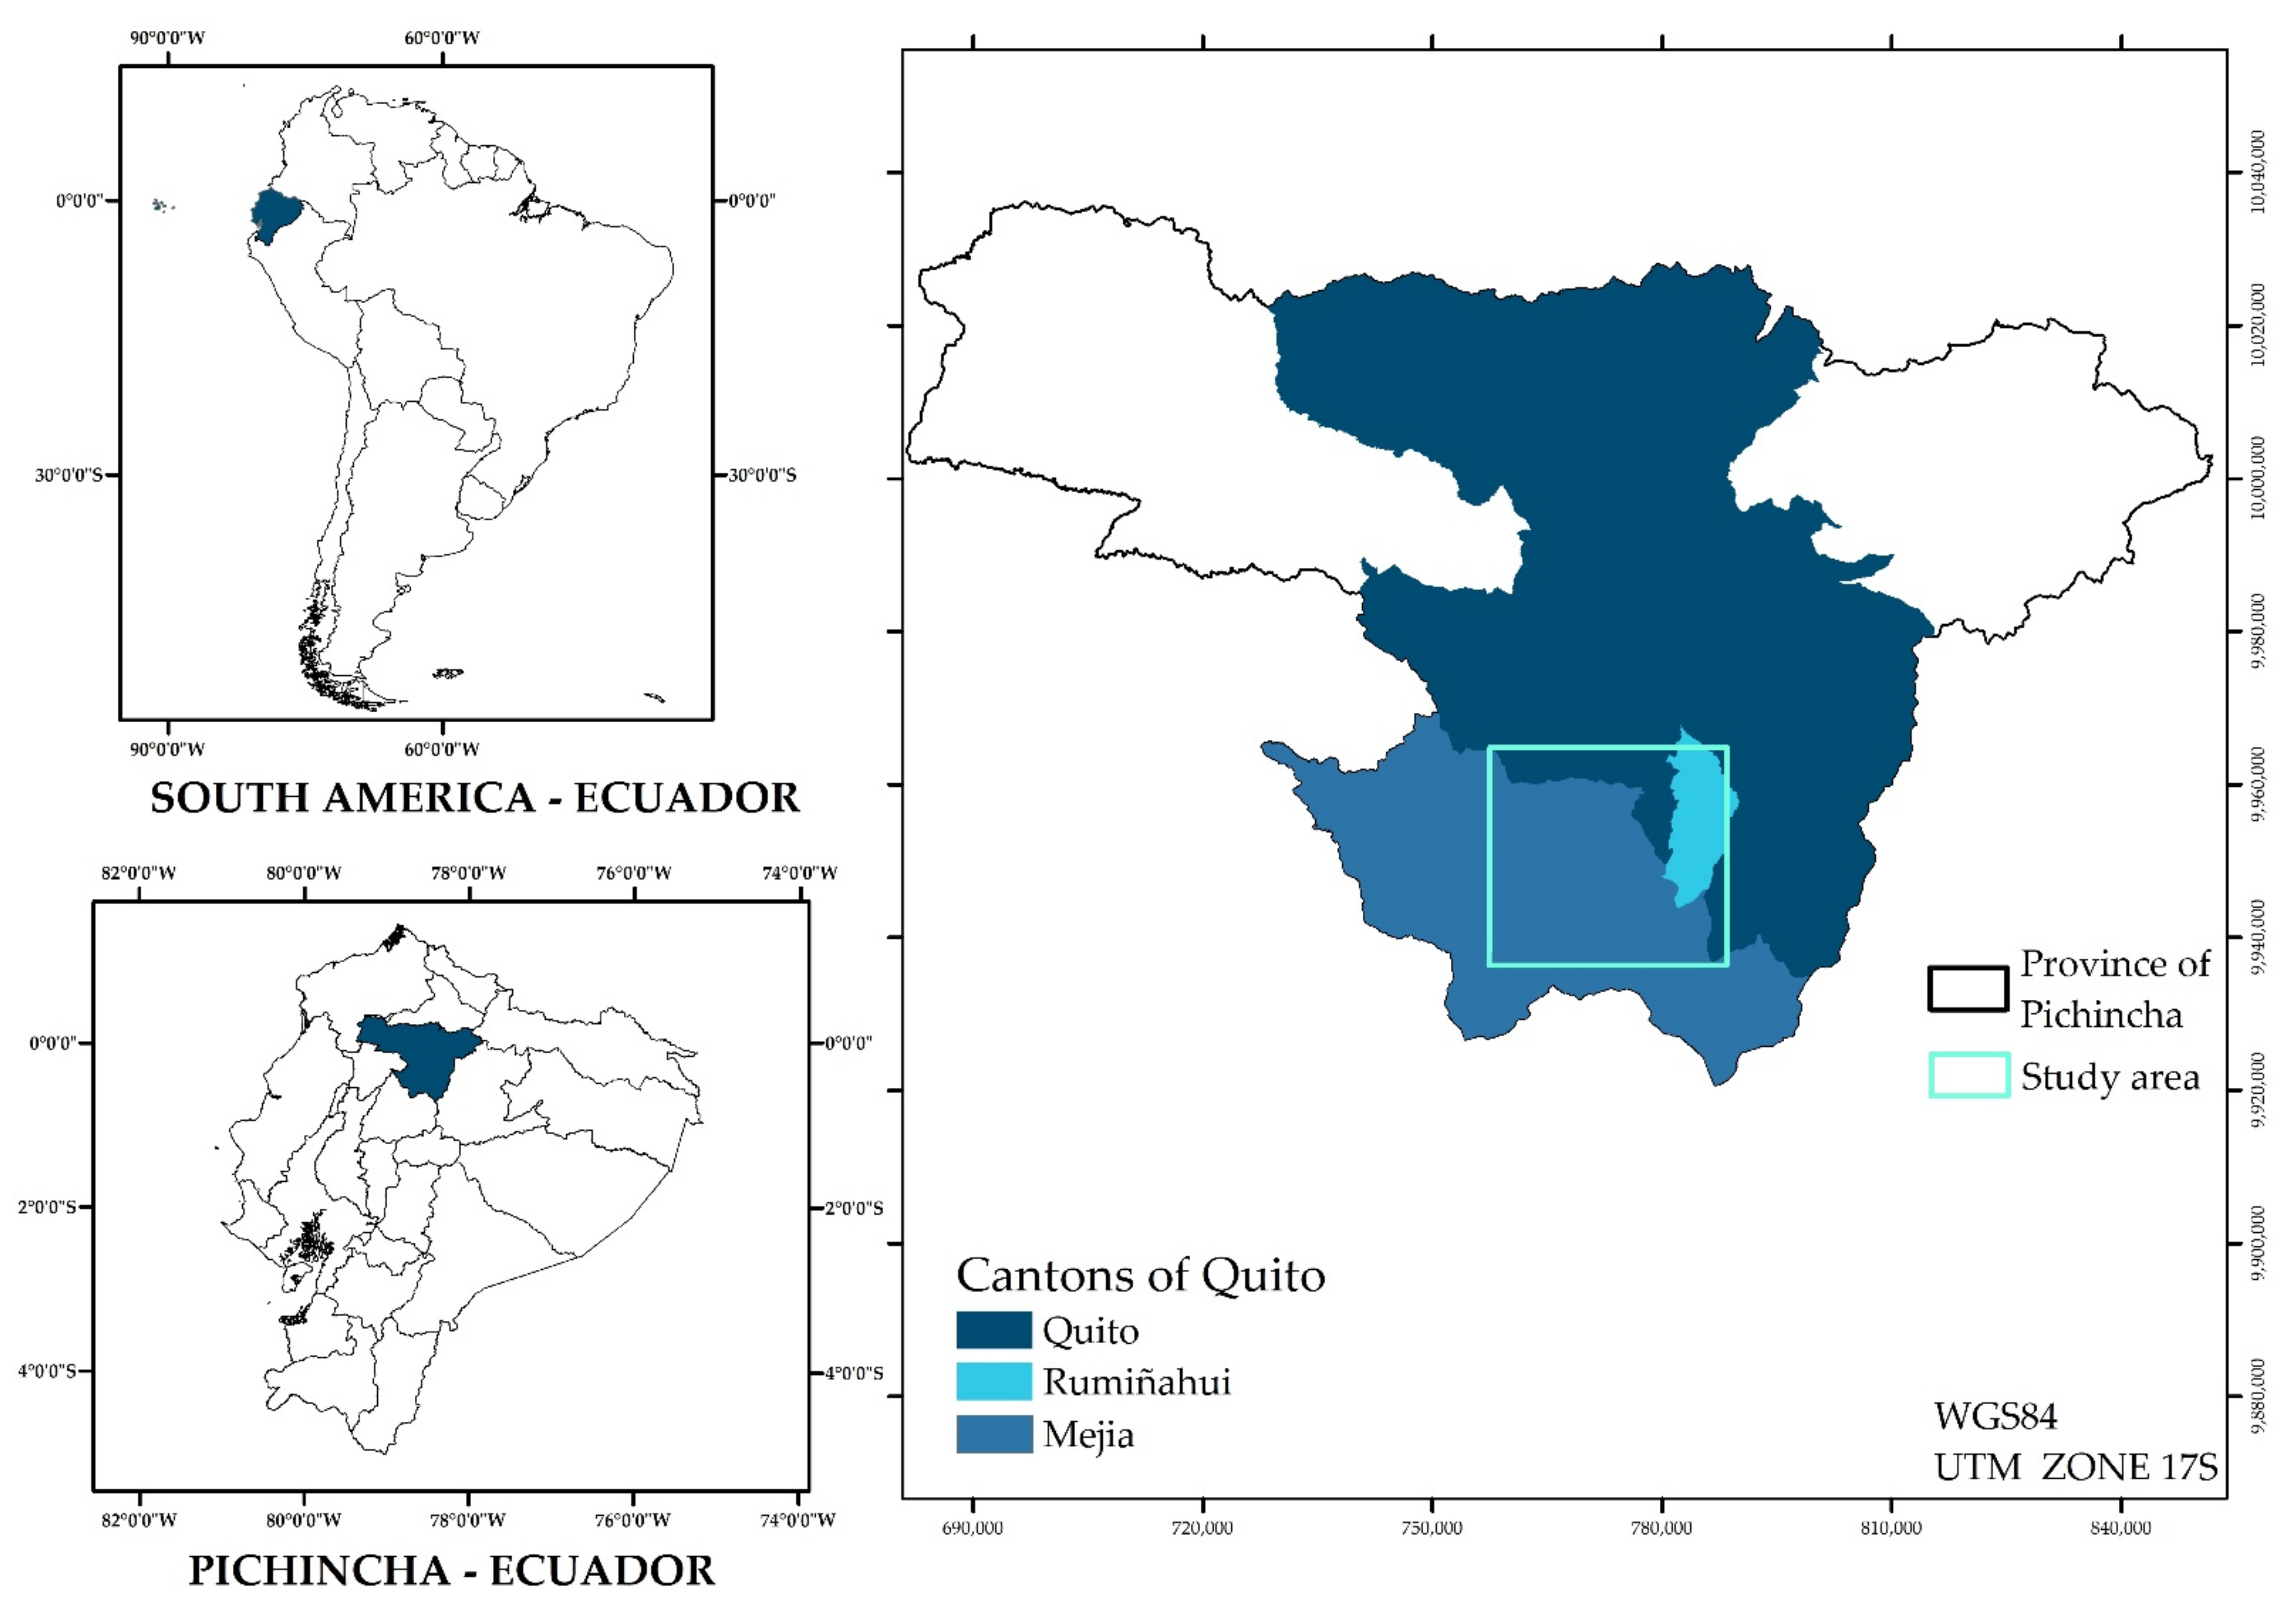
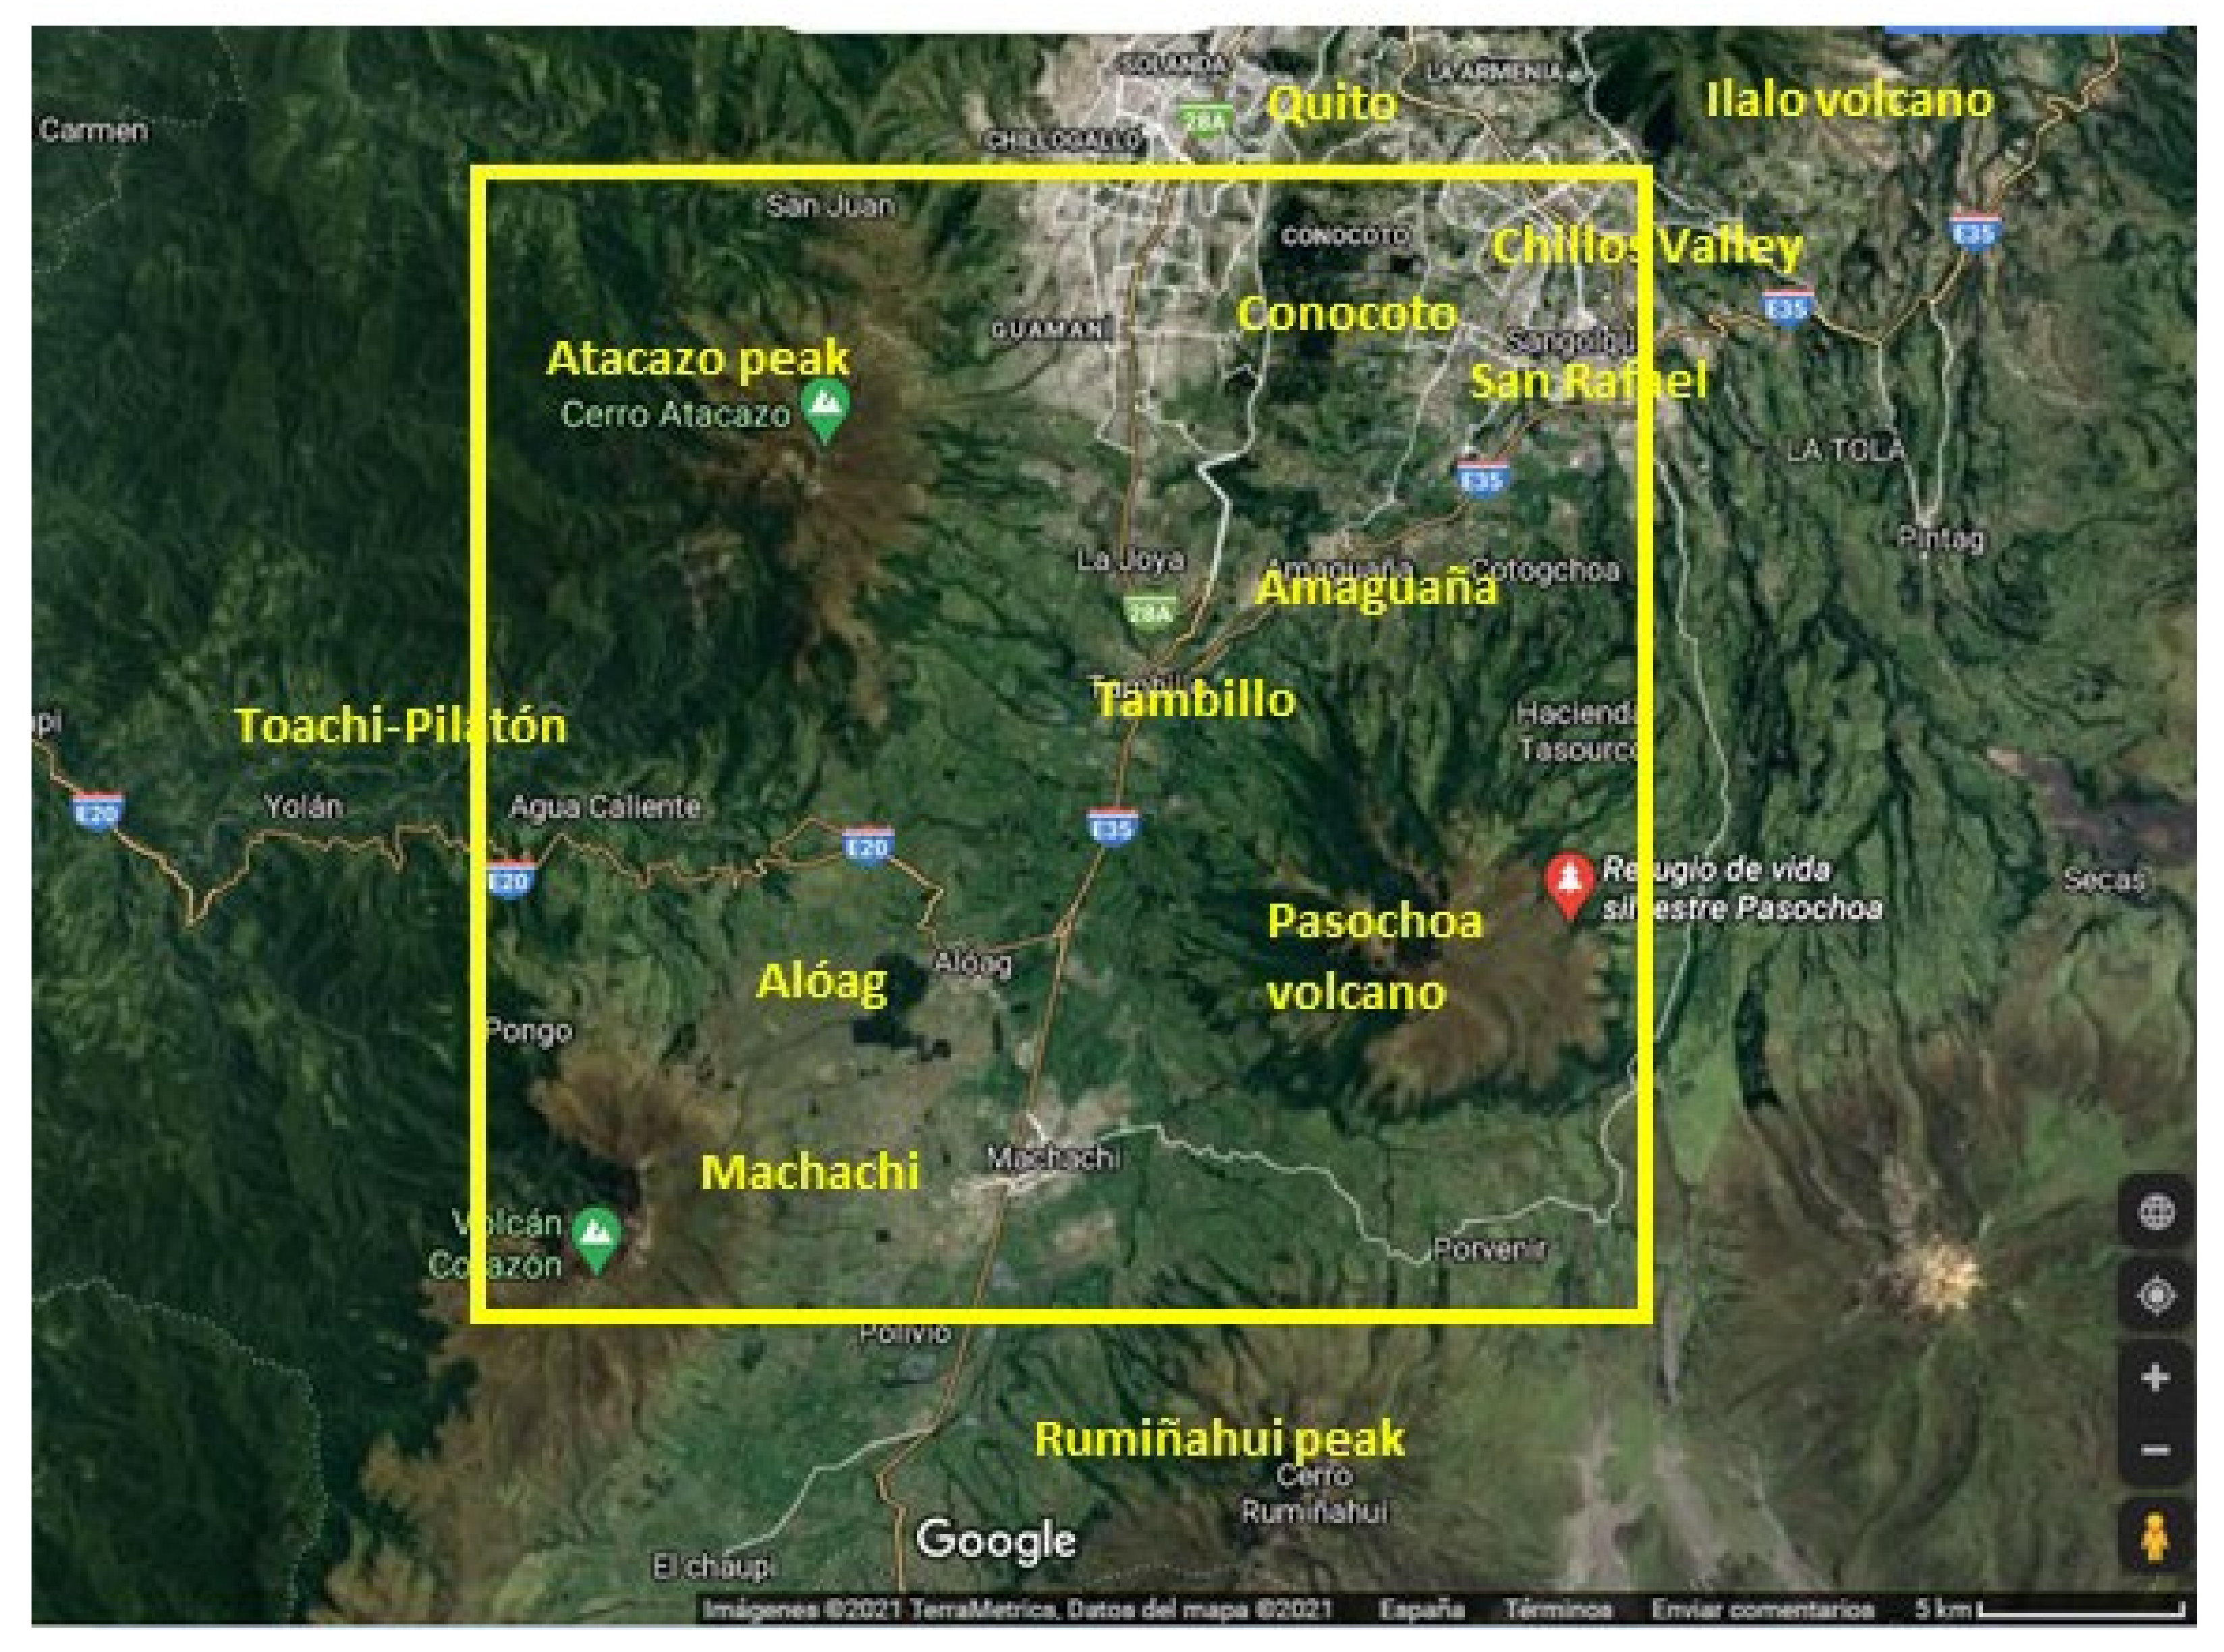
2. Study Area
3. Methodology
3.1. Stage 1: Data Preparation
3.2. Stage 2: Model Calibration
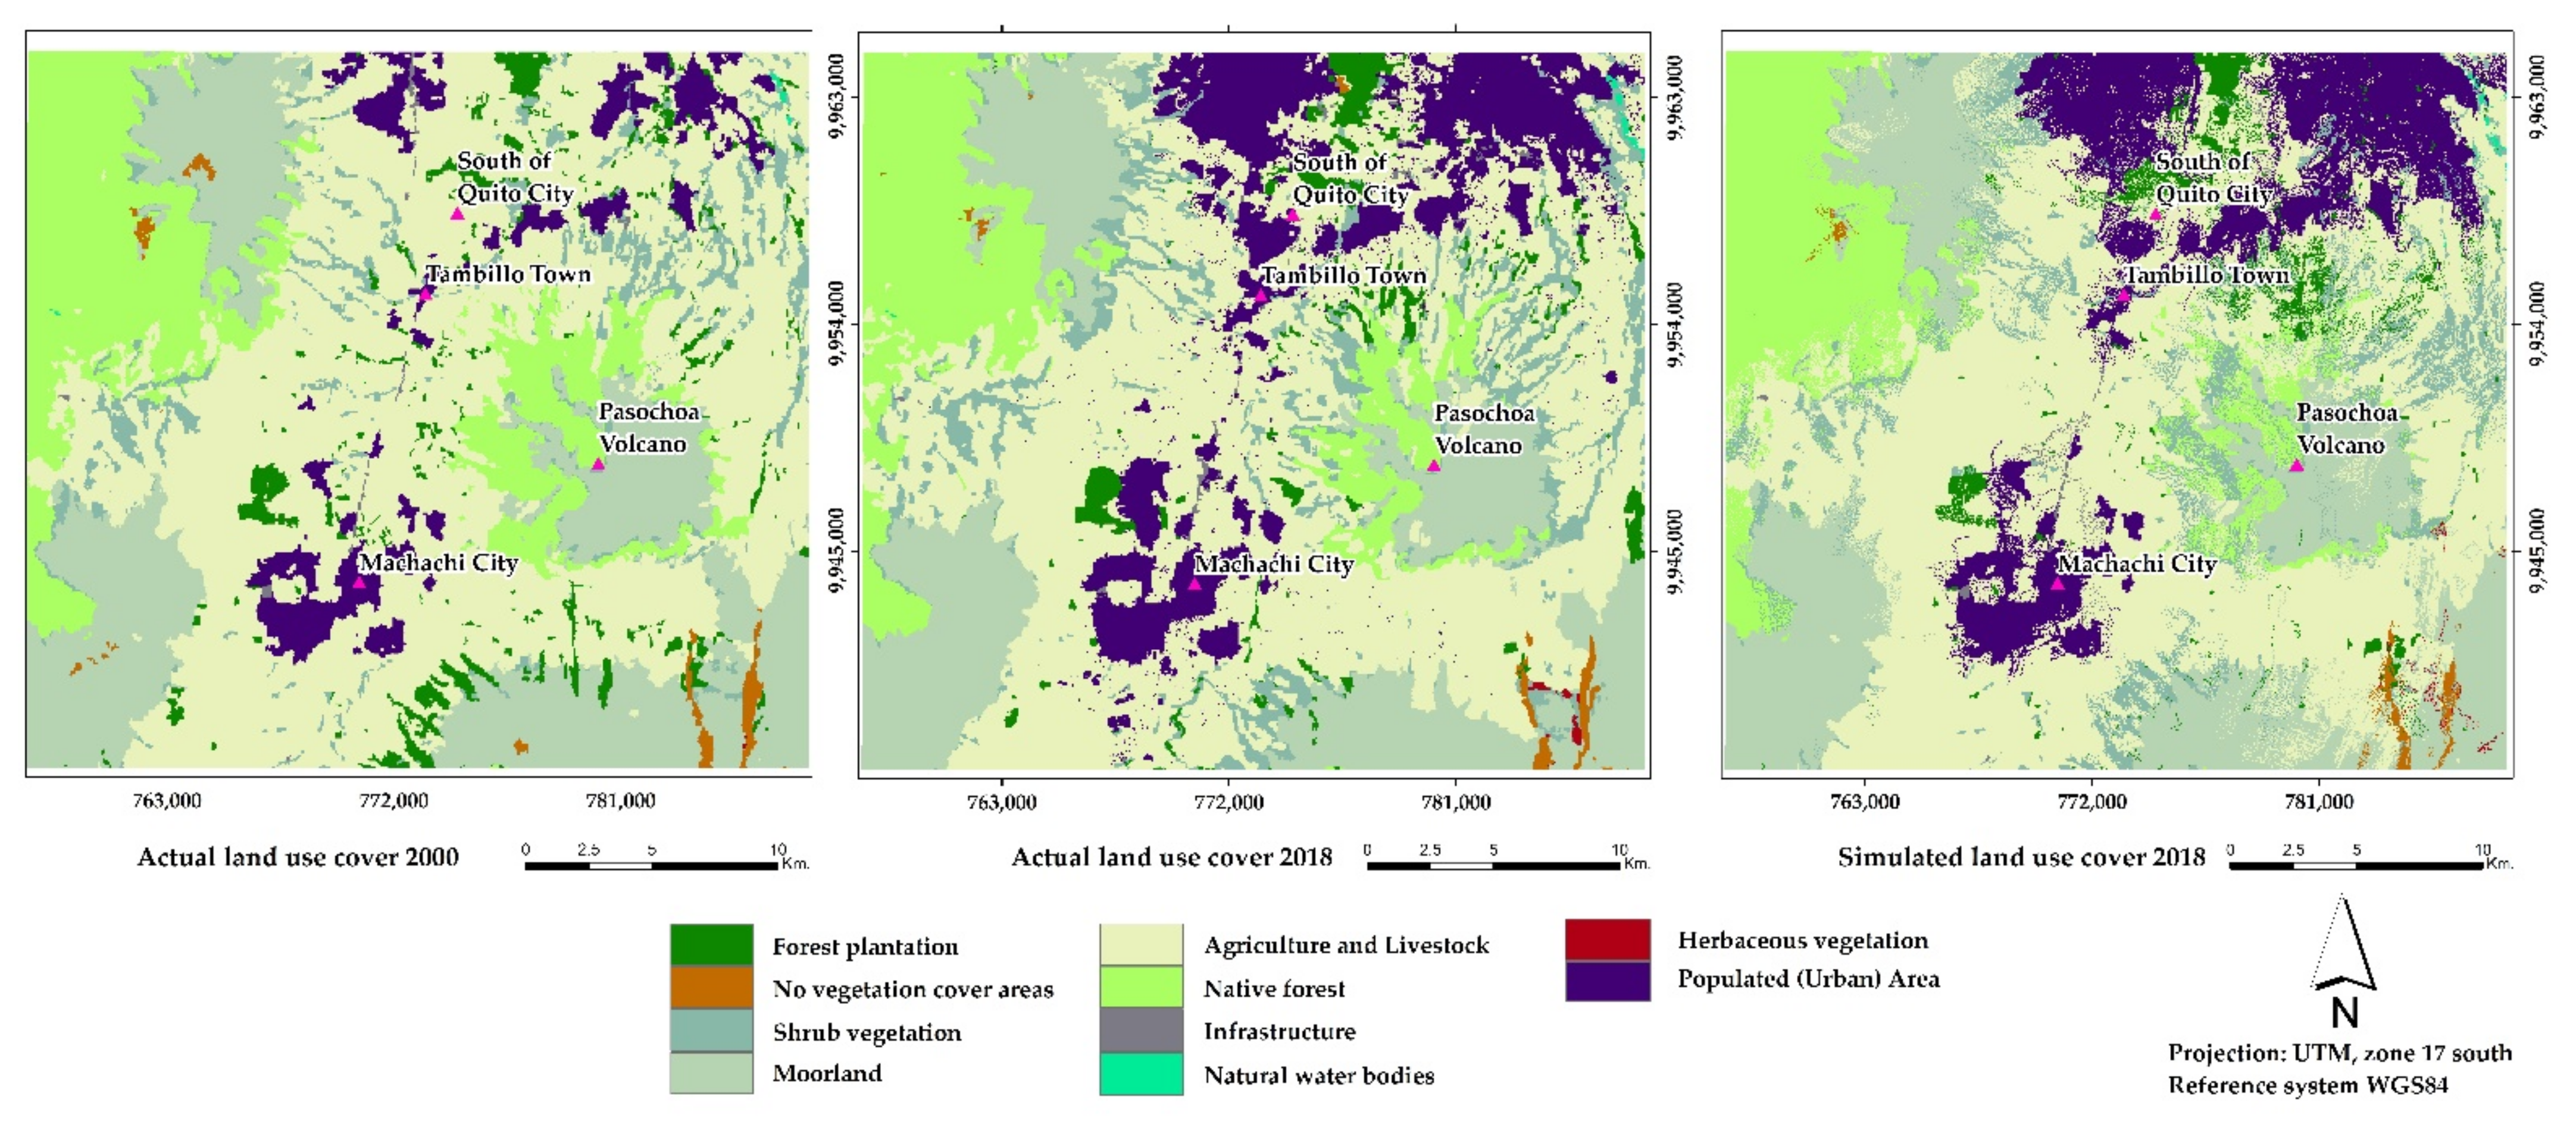
3.3. Stage 3: Simulation of Land Use Change Maps and Validation
3.4. Stage 4: Future Scenarios
4. Results
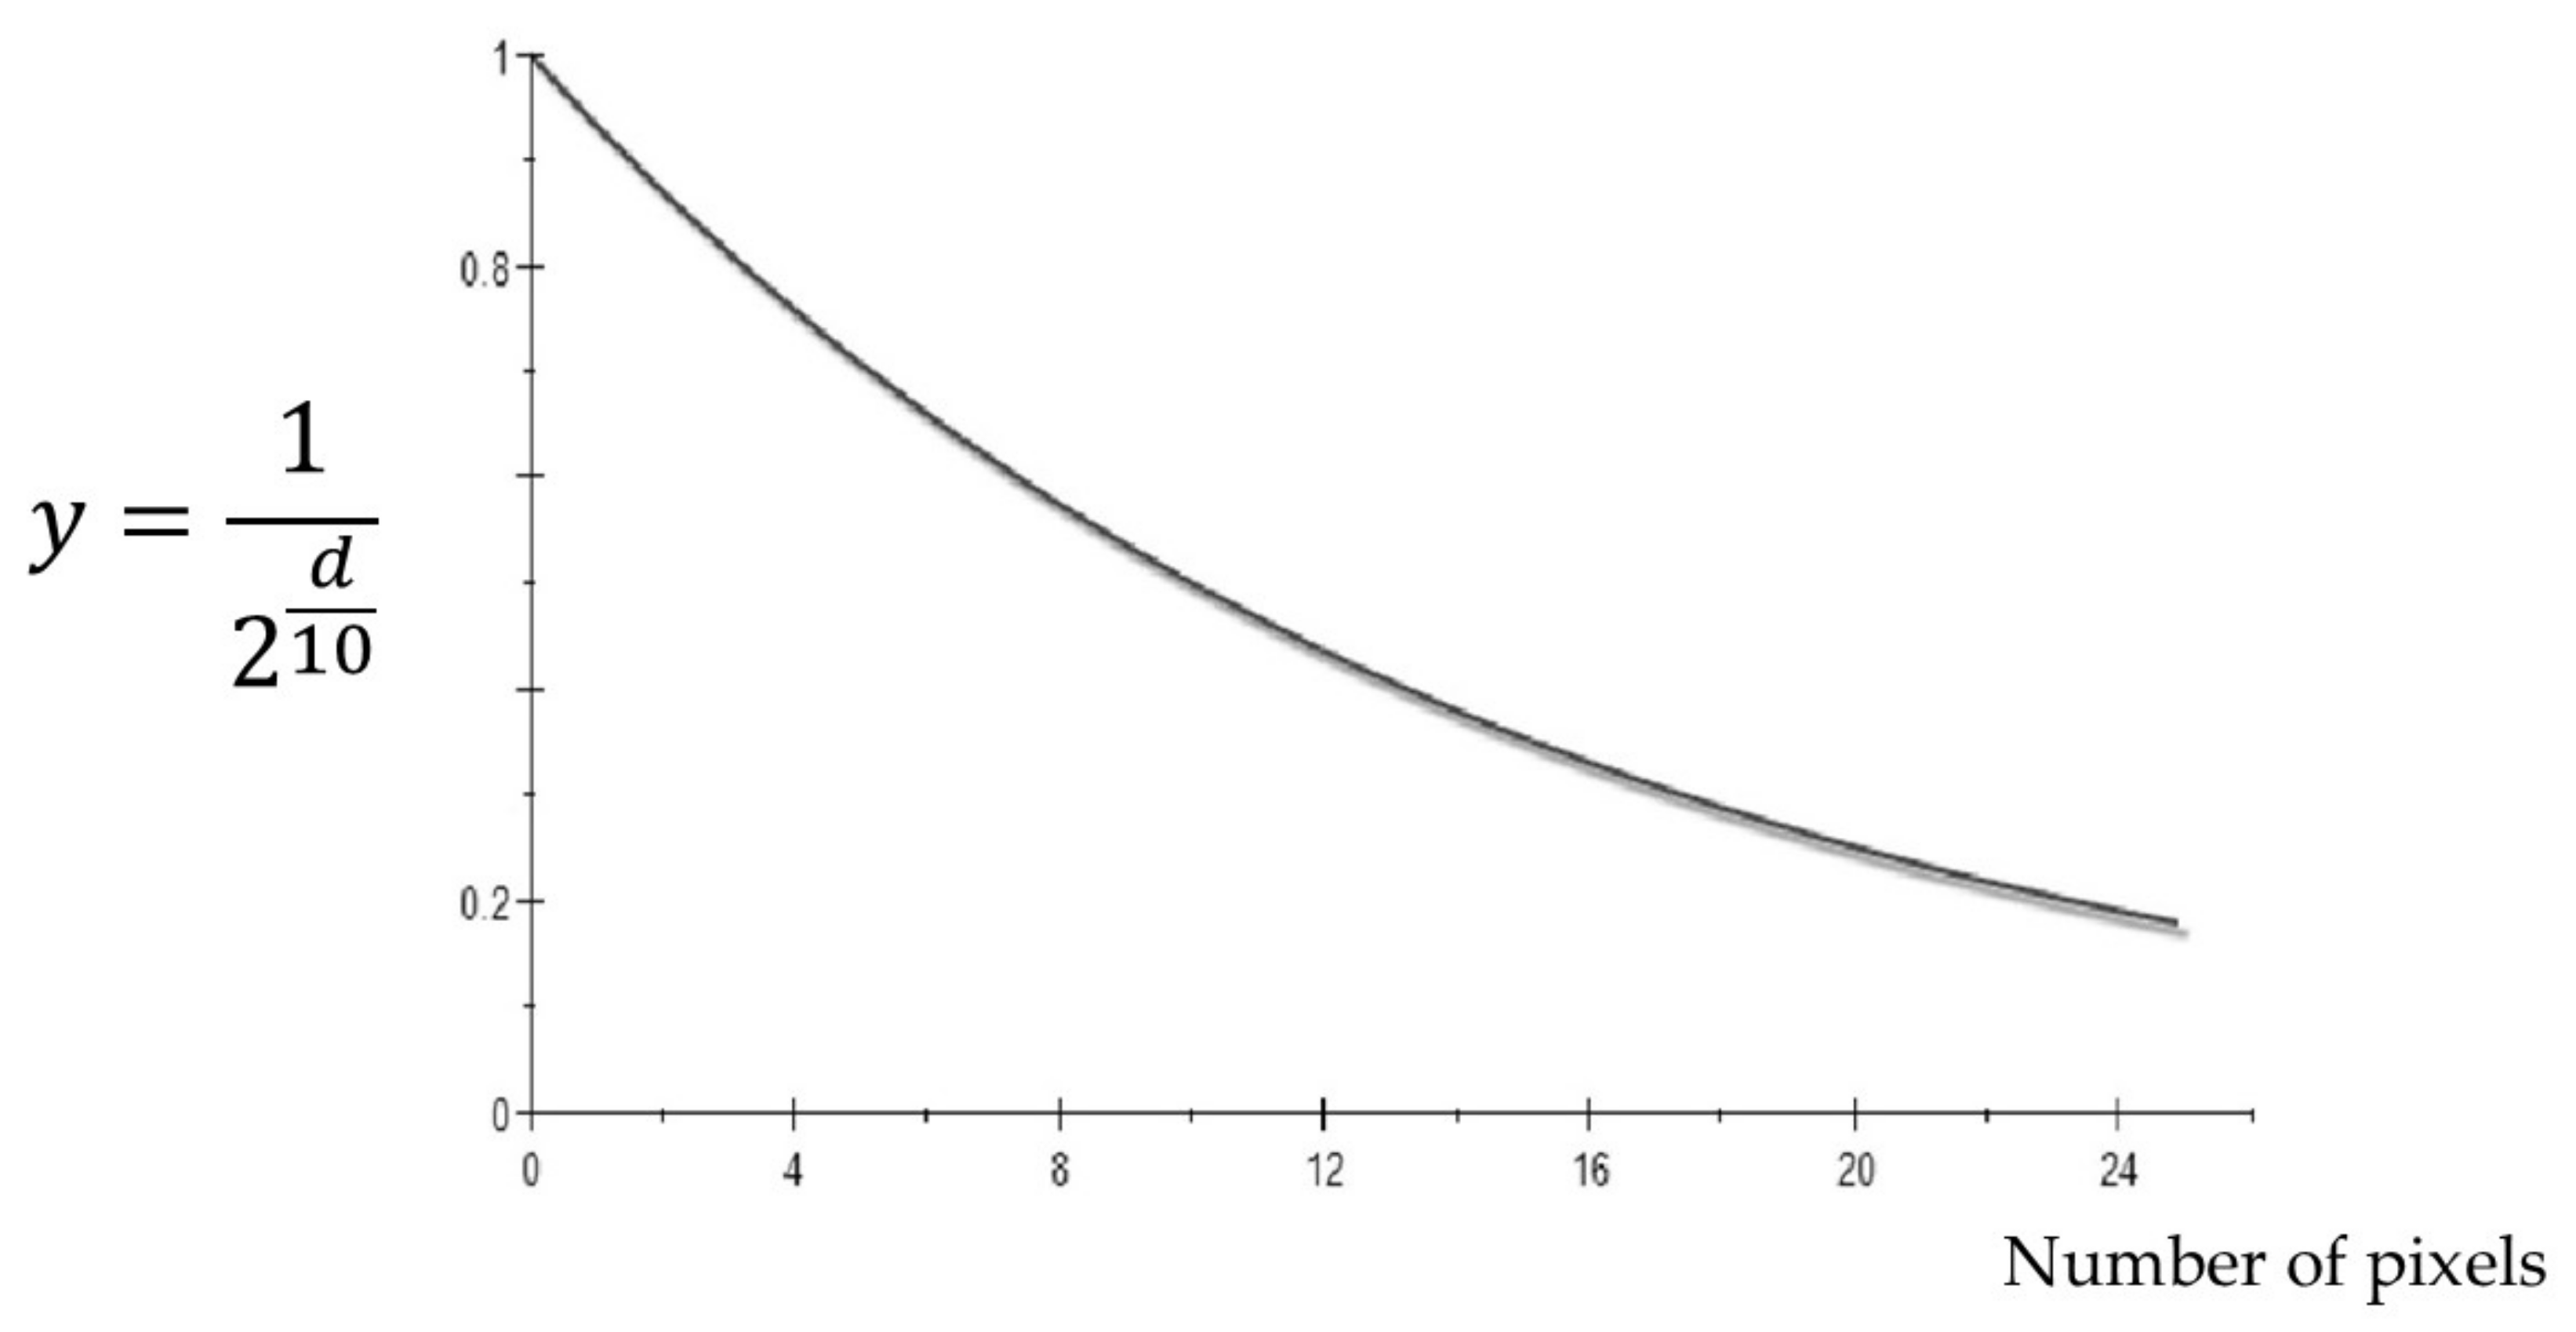
4.1. Validation
4.2. Simulated Scenarios
5. Discussion
6. Conclusions
Author Contributions
Funding
Institutional Review Board Statement
Informed Consent Statement
Data Availability Statement
Acknowledgments
Conflicts of Interest
References
- Schulp, C.J.E.; Levers, C.; Kuemmerle, T.; Tieskens, K.F.; Verburg, P.H. Mapping and modelling past and future land use change in Europe’s cultural landscapes. Land Use Policy 2019, 80, 332–344. [Google Scholar] [CrossRef]
- Department of Economic and Social Affairs. World Urbanization Prospects: The 2018 Revision: Final Report; United Nations: New York, NY, USA, 2019; p. 126. [Google Scholar]
- Department of Economic and Social Affairs. World Urbanization Prospects. The 2011 Revision: Final Report; United Nations: New York, NY, USA, 2012; p. 318. [Google Scholar]
- Seto, K.C.; Güneralp, B.; Hutyra, L.R. Global forecasts of urban expansion to 2030 and direct impacts on biodiversity and carbon pools. Proc. Natl. Acad. Sci. USA 2012, 109, 16083–16088. [Google Scholar] [CrossRef] [Green Version]
- Angel, S.; Parent, J.; Civco, D.L.; Blei, A.; Potere, D. The dimensions of global urban expansion: Estimates and projections for all countries, 2000-2050. Prog. Plan. 2011, 75, 53–107. [Google Scholar] [CrossRef]
- Van Ginkel, H. Urban future. Nature 2008, 456, 32–33. [Google Scholar] [CrossRef]
- Mandelas, E.A.; HAtzichristos, T.; Prastacos, P.A. Fuzzy cellular automata based Shell for modelling Urban Growth: A Pilot Application in Mesogia Area. In Proceedings of the 10th AGILE International Conference on Geographic Information Science 2007, Aalborg, Denmark, 8–11 May 2007; Monica Wachowicz, M., Bodum, L., Eds.; Association of Geographic Information Laboratories in Europe: Aalborg, Denmark, 2007. [Google Scholar]
- Al-Darwish, Y.; Ayad, H.; Taha, D.; Saadallah, D. Predicting the future urban growth and its impacts on the surrounding environment using urban simulation models: Case study of Ibb city, Yemen. Alex. Eng. J. 2018, 57, 2887–2895. [Google Scholar] [CrossRef]
- McKinney, M.L. Effects of urbanization on species richness: A review of plants and animals. Urban Ecosyst. 2008, 11, 161–176. [Google Scholar] [CrossRef]
- McDonald, R.I.; Kareiva, P.; Forman, R.T.T. The implications of current and future urbanization for global protected areas and biodiversity conservation. Biol. Conserv. 2008, 141, 1695–1703. [Google Scholar] [CrossRef]
- Pimm, S.L.; Raven, P. Biodiversity. Extinction by numbers. Nature 2000, 403, 843–845. [Google Scholar] [CrossRef]
- Song, X.P.; Hansen, M.C.; Stehman, S.V.; Potapov, P.V.; Tyukavina, A.; Vermote, E.F.; Townshend, J.R. Global land change from 1982 to 2016. Nature 2018, 560, 639–643. [Google Scholar] [CrossRef]
- Hutyra, L.R.; Byungman, Y.; Hepinstall-Cymerman, J.; Alberti, M. Carbon consequences of land cover change and expansion of urban lands: A case study in the Seattle metropolitan region. Landsc. Urban Plan 2011, 103, 83–93. [Google Scholar] [CrossRef]
- Fusco Girard, L.; Cerreta, M.; De Toro, P.; Forte, F. The Human Sustainable City: Values, Approaches and Evaluative Tools. In Sustainable Urban Development, 1st ed.; Mark Deakin, M., Mitchell, G., Nijkamp, P., Vreeker, R., Eds.; Taylor and Francis Group: London, UK, 2007; Volume 2, pp. 65–93. [Google Scholar]
- IPBES. Ipbes global assessment on biodiversity and ecosystem services. In Intergovernmental Science-Policy Platform on Biodiversity and Ecosystem Services; IPBES: Paris, France, 2019. [Google Scholar]
- Thapa, R.; Murayama, Y. Scenario based urban growth allocation in Kathmandu Valley, Nepal. Landsc. Urban Plan 2012, 105, 140–148. [Google Scholar] [CrossRef]
- Lattes, A.E.; Rodríguez, J.; Villa, M. Population dynamics and urbanization in Latin America: Concepts and data limitations. In New Forms of Urbanization: Beyond the Urban-Rural Dichotomy, 1st ed.; Champion, T., Ed.; Routledge: London, UK, 2004; pp. 85–107. [Google Scholar] [CrossRef]
- United Nations Human Settlements Program (UN_HABITAT). World Cities Report 2020 The Value of Sustainable Urbanization; UN-Habitat: New York, NY, USA, 2020; p. 418. [Google Scholar]
- Carrión, F.; Erazo Espinosa, J. La forma urbana de Quito: Una historia de centros y periferias. Bull. Inst. Franç. Etudes Andin. 2012, 41. [Google Scholar] [CrossRef] [Green Version]
- Pinos Arévalo, N.J. Prospectiva del uso de suelo y cobertura vegetal en el ordenamiento territorial—Caso cantón Cuenca. Estoa 2016, 5. [Google Scholar] [CrossRef] [Green Version]
- Burgess, R.; Jenks, M. Compact Cities: Sustainable Urban Forms for Developing Countries, 1st ed.; Spon Press: London, UK, 2000. [Google Scholar]
- Calbi, M.; Clerici, N.; Borsch, T.; Brokamp, G. Reconstructing Long Term High Andean Forest Dynamics Using Historical Aerial Imagery: A Case Study in Colombia. Forests 2020, 11, 788. [Google Scholar] [CrossRef]
- Taubenböck, H.; Esch, T.; Felbier, A.; Wiesner, M.; Roth, A.; Dech, A. Monitoring urbanization in mega cities from space. Remote Sens. Environ. 2012, 117, 162–176. [Google Scholar] [CrossRef]
- Wu, Y.; Zhang, X.; Skitemore, M.; Song, Y.; Hui, E.C.M. Industrial land price and its impact on urban growth: A Chinese case study. Land Use Policy 2014, 36, 199–209. [Google Scholar] [CrossRef] [Green Version]
- Kong, F.; Yin, H.; Nakagoshi, N.; James, P. Simulating urban growth processes incorporating a potential model with spatial metrics. Ecol. Indic. 2012, 20, 82–91. [Google Scholar] [CrossRef]
- Salazar, E.; Henríquez, C.; Sliuzas, R.; Qüense, J. Evaluating Spatial Scenarios for Sustainable Development in Quito, Ecuador. ISPRS Int. J. Geo-Inf. 2020, 9, 141. [Google Scholar] [CrossRef] [Green Version]
- Couclelis, H. Where has the Future Gone? Rethinking the Role of Integrated Land-Use Models in Spatial Planning. Environ. Plann. A 2005, 37, 1353–1371. [Google Scholar] [CrossRef]
- Schlüter, M.; Baeza-Castro, A.; Dressler, G.; Frank, K.; Groeneveld, J.; Jager, W.; Janssen, M.; McAllister, R.R.J.; Müller, B.; Orach, K.; et al. A framework for mapping and comparing behavioural theories in models of social-ecological systems. Ecol. Econ. 2017, 131, 21–35. [Google Scholar] [CrossRef]
- Theobald, D. Landscape patterns of exurban growth in the USA from 1980 to 2020. Ecol. Soc. 2005, 10, 34. [Google Scholar] [CrossRef] [Green Version]
- Verburg, P.H.; Overmars, K.P. Dynamic simulation of land-use change trajectories with the clue-s model. In Modelling Land-Use Change: Progress and Applications; Koomen, E., Stillwell, J., Bakema, A., Scholten, H.J., Eds.; Springer: Dordrecht, The Netherlands, 2007; pp. 321–337. [Google Scholar]
- Jantz, C.A.; Goetz, S.J.; Shelley, M.K. Using the SLEUTH urban growth model to simulate the impacts of future policy scenarios on urban land use in the Baltimore-Washington metropolitan area. Environ. Plan B 2004, 31, 251–271. [Google Scholar] [CrossRef]
- Sloan, S.; Pelletier, J. How accurately may we project tropical forest-cover change? A validation of a forward-looking baseline for REDD. Global Environ. Chang. 2012, 22, 440–453. [Google Scholar] [CrossRef]
- Sleeter, M.; Liu, J.; Daniel, C.; Frid, L.; Zhu, Z. An integrated approach to modeling changes in land use, land cover, and disturbance and their impact on ecosystem carbon dynamics: A case study in the Sierra Nevada Mountains of California AIMS. Environ. Sci. 2015, 2, 577–606. [Google Scholar] [CrossRef]
- Reyes-Gómez, D.A. Descripción y Aplicaciones de los Autómatas Celulares. Master’s Thesis, Universidad Autónoma de Puebla, Puebla, Mexico, 25 August 2011. [Google Scholar]
- Allen, P.M. Cities and regions as evolutionary complex systems. Geogr. Syst. 1997, 4, 103–130. [Google Scholar]
- Gharbia, S.S.; Alfatah, S.A.; Gill, L.; Johnston, P.; Pilla, F. Land use scenarios and projections simulation using an integrated GIS cellular automata algorithm. Model. Earth Syst. Environ. 2016, 2, 151. [Google Scholar] [CrossRef] [Green Version]
- Zhang, Q.; Ban, Y.; Liu, J.; Hu, Y. Simulation and analysis of urban growth scenarios for the Greater Shanghai Area, China. Comp. Environ. Urb. Syst. 2011, 35, 126–139. [Google Scholar] [CrossRef]
- Pahlavani, P.; Askarian Omran, H.; Bigdeli, B. A multiple land use change model based on artificial neural network, markov chain, and multi objective land allocation. Earth Obs. Geomat. Eng. 2017, 1, 82–99. [Google Scholar]
- Ozturk, D. Urban growth simulation of Atakum (Samsun, Turkey) using cellular automata-markov chain and multi-layer perceptron-Markov chain models. Remote Sens. 2015, 7, 5918–5950. [Google Scholar] [CrossRef] [Green Version]
- Morais Ferreira, B.; Silveira Soares-Filho, B.; Magno Quintão Pereira, F. The Dinamica EGO virtual machine. Sci. Comput. Program. 2019, 173, 3–20. [Google Scholar] [CrossRef]
- Soares-Filho, B.S.; Moutinho, P.; Nepstad, D.; Anderson, A.; Rodrigues, H.; Garcia, R.; Maretti, C. Role of Brazilian Amazon protected areas in climate change mitigation. Proc. Natl. Acad. Sci. USA 2010, 107, 10821–10826. [Google Scholar] [CrossRef] [Green Version]
- Espinoza-Mendoza, V.E. DINAMICA EGO: Una herramienta gratuita para modelar y brindar soporte en el análisis de CCUS. Bol. Col. Geógrafos Perú 2016, 3, 1–13. [Google Scholar]
- Mas, J.F.; Kolb, M.; Paegelow, M.; Camacho, M.T.; Houet, T. Inductive pattern-based land use/cover change models: A comparison of four software packages. Environ. Modell. Softw. 2014, 51, 94–111. [Google Scholar] [CrossRef] [Green Version]
- Maeda, E.; Almeida, C.M.; Carvalho, A.; Formaggio, A.; Shimabukuro, Y.; Pellikka, P. Dynamic modeling of forest conversion: Simulation of past and future scenarios of rural activities expansion in the fringes of the Xingu National Park, Brazilian Amazon. Int. J. Appl. Earth Obs. 2011, 13, 435–446. [Google Scholar] [CrossRef]
- Mas, J.F.; Flamenco, A. Modelación de los cambios de coberturas/uso del suelo en una región tropical de México. GeoTrópico 2011, 5, 1–24. Available online: http://www.geotropico.org/NS_5_1_Mas-Flamenco.pdf. (accessed on 25 March 2021).
- Pérez, A.; Mas, J.F.; Ligmann, A. Comparing two approaches to land/use cover change modeling and their implications for the assessment of biodiversity loss in a deciduous tropical forest. Environ. Modell. Softw. 2012, 29, 11–23. [Google Scholar] [CrossRef]
- Bahadur, R.; Murayama, Y. Urban growth modeling of Kathmandu metropolitan region, Nepal. Comp. Env. Urb. Sys. 2011, 35, 25–34. [Google Scholar] [CrossRef]
- Godoy, M.M.G.; Soares-Filho, B.S. Modelling intraurban dynamics in the Savassi neighbourhood, Belo Horizonte city, Brazil. In Modelling Environmental Dynamics, 1st ed.; Paegelow, M., Camacho, M.T., Eds.; Springer: Berlin/Heidelberg, Germany, 2008; pp. 319–338. [Google Scholar]
- Cheng, L.; Liu, M.; Zhan, J. Land use scenario simulation of mountainous districts based on Dinamica EGO model. J. Mt. Sci. 2020, 17, 289–303. [Google Scholar] [CrossRef]
- Pathirana, A.; Hailu, B.D.; Veerbeek, W.; Zevenbergen, C.; Banda, A.T. Impact of urban growth-driven land use change on microclimate and extreme precipitation. A sensitivity study. Atmos. Res. 2014, 138, 59–72. [Google Scholar] [CrossRef]
- Josse, C.; Cuesta, F.; Navarro, G.; Barrena, V.; Cabrera, E.; Chacón-Moreno, E.; Ferreira, W.; Peralvo, M.; Saito, A. Ecosistemas de los Andes del Norte y Centro. Bolivia, Colombia, Ecuador, Perú y Venezuela, 1st ed.; Secretaría General de la Comunidad Andina: Lima, Peru, 2009; p. 100. [Google Scholar]
- Consejo de planificación del cantón Mejía. Actualización del Plan de Desarrollo Y Ordenamiento Territorial 2019–2023; Gobierno Autónomo Descentralizado Municipal del Cantón Mejía: Machachi, Ecuador, 2019; p. 569. [Google Scholar]
- Ministerio de Agricultura, Ganadería, Acuacultura y Pesca de Ecuador; Ministerio del Ambiente del Ecuador, Secretaría Nacional de Planificación y Desarrollo. Mapa de Cobertura y Uso de la Tierra; Ministerio del Ambiente de Ecuador: Machachi, Ecuador, 2014. [Google Scholar]
- Dirección de Estadísticas Agropecuarias y Ambientales. Boletín Técnico: Encuesta de Superficie y Producción Agropecuaria Continua (ESPAC); Instituto Nacional de Estadística y Censos: Quito, Ecuador, 2020; p. 15. [Google Scholar]
- Equipo Técnico de Análisis del Censo de Población y Vivienda. Resultados de Censos de Población y Vivienda del Ecuador 2010. Fascículo de la Provincia de Pichincha; Instituto Nacional de estadística y Censos: Quito, Ecuador, 2010; p. 15. [Google Scholar]
- Escobar, S. Caracterización del Paisaje del Valle de Machachi (Ecuador), y Análisis de su Evolución Reciente (1940–2015). Doctoral Thesis, Universidad de Barcelona, Barcelona, Spain, 26 September 2018. [Google Scholar]
- Advanced Spaceborne Thermal Emission and Reflection Radiometer, California Institute of Technology, NASA. Available online: https://asterweb.jpl.nasa.gov/index.asp (accessed on 13 July 2021).
- Ministerio del Ambiente. Línea Base de Deforestación del Ecuador Continental; Ministerio de Medio Ambiente: Quito, Ecuador, 2012; p. 32. [Google Scholar]
- Olofsson, P.; Foody, G.M.; Stehman, S.V.; Woodcock, C.E. Making better use of accuracy data in land change studies: Estimating accuracy and area and quantifying uncertainty using stratified estimation. Remote Sens. Environ. 2013, 129, 122–131. [Google Scholar] [CrossRef]
- Ministerio de Medio Ambiente. Informe sobre la Reducción de Emisiones por Deforestación en el Ecuador para Pagos Basados en Resultados de REDD+ Periodo 2017-2018; Ministerio de Medio Ambiente: Quito, Ecuador, 2019; p. 68. [Google Scholar]
- Instituto Espacial Ecuatoriano. Proyecto de Generación de Geoinformación para la Gestión del Territorio a Nivel Nacional Escala 1: 25 000; Ministerio de Defensa Nacional: Quito, Ecuador, 2012. [Google Scholar]
- Instituto Espacial Ecuatoriano. Memoria Técnica Cantón Mejía, Proyecto: “Generación de Geo Información para la Gestión del Territorio a Nivel Nacional Escala 1: 25 000” Evaluación de las Tierras por su Capacidad de Uso; Ministerio de Defensa Nacional: Quito, Ecuador, 2013; p. 63. [Google Scholar]
- Instituto Espacial Ecuatoriano. Memoria Técnica Cantón Mejía, Proyecto: “Generación de Geo Información para la Gestión del Territorio a Nivel Nacional Escala 1: 25 000”. Infraestructuras y Servicios; Ministerio de Defensa Nacional: Quito, Ecuador, 2013; p. 41. [Google Scholar]
- Instituto Espacial Ecuatoriano. Memoria Técnica Cantón Mejía, Proyecto: “Generación de Geo Información para la Gestión del Territorio a Nivel Nacional Escala 1: 25 000”. Análisis de Amenaza por Tipo de Movimiento en Masa; Ministerio de Defensa Nacional: Quito, Ecuador, 2013; p. 57. [Google Scholar]
- Instituto Espacial Ecuatoriano. Memoria Técnica Cantón Mejía, Proyecto: “Generación de Geo Información para la Gestión del Territorio a Nivel Nacional Escala 1: 25 000”. Socioeconómico y Cultural; Ministerio de Defensa Nacional: Quito, Ecuador, 2013; p. 57. [Google Scholar]
- Rykiel, E.J. Testing ecological models: The meaning of validation. Ecol. Modell. 1996, 90, 229–244. [Google Scholar] [CrossRef]
- Mondal, B.; Das, D.N.; Bhatta, B. Integrating cellular automata and Markov techniques to generate urban development potential surface: A study on Kolkata agglomeration. Geocarto Int. 2017, 32, 401–419. [Google Scholar] [CrossRef]
- Ghosh, P.; Mukhopadhyay, A.; Chanda, A.; Mondal, P.; Akhand, A.; Mukherjee, S.; Nayak, S.K.; Ghosh, S.; Mitra, D.; Ghosh, T.; et al. Application of Cellular automata and Markov-chain model in geospatial environmental modeling. A review. Remote Sens. Appl. Soc. Environ. 2017, 5, 64–77. [Google Scholar] [CrossRef]
- Weed, D.L. Weight of Evidence: A Review of Concept and Methods. Risk Anal. 2005, 25, 1545–1557. [Google Scholar] [CrossRef]
- Goodacre, A.K.; Bonham-Carter, G.F.; Agterberg, F.P.; Wright, D.F. A statistical analysis of the spatial association of seismicity with drainage patterns and magnetic anomalies in western Quebec. Tectonophysics 1993, 217, 285–305. [Google Scholar] [CrossRef]
- Kotrlik, J.W.; Williams, H.A.; Jabor, M.K. Reporting and Interpreting Effect Size in Quantitative. J. Agric. Educ. 2011, 52, 132–142. [Google Scholar] [CrossRef]
- Rea, L.M.; Parker, R.A. Designing and Conducting Survey Research, 4th ed.; Jossey–Bass: San Francisco, CA, USA, 1992; p. 352. [Google Scholar]
- Rodrigues, H.O.; Soares-Filho, B.S.; Costa, W.L.D.S. Dinamica EGO, uma plataforma para modelagem de sistemas ambientais. In Proceedings of the XIII Simpósio Brasileiro de Sensoriamento Remoto, Florianpólis, Brazil, 21–26 April 2007. [Google Scholar]
- Joint Research Centre. Modelling Deforestation Processes—A review. Research Report No.1; European Commission/Institute for Remote Sensing Applications, and European Space Agency: Luxembourg, 1994; p. 113. [Google Scholar]
- Hagen-Zanker, A. An improved Fuzzy Kappa statistic that accounts for spatial autocorrelation. Int. J. Geogr. Inf. Sci. 2009, 19, 831–857. [Google Scholar] [CrossRef] [Green Version]
- Pontius, R.G. Statistical methods to partition effects of quantity and location during comparison of categorical maps at multiple resolutions. Photogramm. Eng. Remote Sens. 2002, 68, 1041–1049. Available online: https://www.asprs.org/wp-content/uploads/pers/2002journal/october/2002_oct_1041-1049.pdf (accessed on 13 July 2021).
- Ulloa, R.; Lalama, E. Geopronósticos de asentamientos con construcciones civiles en las periferias de la ciudad basado en autómatas celulares: Caso zona norte-Calderón. Rev. Geospacial 2018, 15, 45–59. [Google Scholar] [CrossRef]
- Pontius, R.G., Jr. Quantification error versus location error in comparison of categorical maps. Photogramm. Eng. Remote Sens. 2000, 66, 1011–1016. [Google Scholar]
- Rimal, B.; Sloan, S.; Keshtkar, H.; Sharma, R.; Rijal, S.; Shrestha, U.B. Patterns of Historical and Future Urban Expansion in Nepal. Remote Sens. 2020, 12, 628. [Google Scholar] [CrossRef] [Green Version]
- Leta, M.K.; Demissie, T.A.; Tränckner, J. Modeling and Prediction of Land Use Land Cover Change Dynamics Based on Land Change Modeler (LCM) in Nashe Watershed, Upper Blue Nile Basin, Ethiopia. Sustainability 2021, 13, 3740. [Google Scholar] [CrossRef]
- Hagen, A. Fuzzy set approach to assessing similarity of categorical maps. Int. J. Geogr. Inf. Sci. 2003, 17, 235–249. [Google Scholar] [CrossRef] [Green Version]
- Piontekowski, V.; da Silva, S.; Mendoza, E.; de Souza Costa, W.; Ribeiro, F.; Ribeiro, C. Modelagem do desmatamento para o Estado do Acre utilizando o programa DinamicaEGO. In Proceedings of the 4th Simpósio de Geotecnologias no Pantanal, Bonito, Brasil, 20–24 October 2012. [Google Scholar]
- Costa Roriz, P.A.; Miho Yanai, A.; Martin, P. Deforestation and Carbon Loss in Southwest Amazonia: Impact of Brazil’s Revised Forest Code. Environ. Manag. 2017, 60, 367–382. [Google Scholar] [CrossRef] [PubMed]
- Mejía Salazar, M.; Páliz, C.F. El territorio periurbano de la ciudad de Quito: Expansión urbana, cambio de la morfología y valor del suelo. Caso de estudio “valle de Los Chillos”, Distrito Metropolitano de Quito, Ecuador. EIDOs. Rev. Cient. Urban. Arquit. 2018, 11, 1–26. [Google Scholar] [CrossRef]
- Corporación de Manejo Forestal Sustentable. Planificación Estratégica de los Bosques Nativos de Ecuador 2007–2012; Corporación de Promoción de Exportaciones: Quito, Ecuador, 2007; p. 141. [Google Scholar]
- Sanguinetti, P.; Vargas, J. Urban Growth and Access to Opportunities: A Challenge for Latin America; Corporación Andina de Fomento: Bogota, Colombia, 2018; p. 120. [Google Scholar]
- Inostroza, L. Informal urban development in Latin American urban peripheries. Spatial assessment in Bogotá, Lima and Santiago de Chile. Landsc. Urban. Plan 2017, 165, 267–279. [Google Scholar] [CrossRef]
- Puente-Sotomayor, F.; Egas, A.; Teller, J. Land policies for landslide risk reduction in Andean cities. Habitat Int. 2021, 107, 102298. [Google Scholar] [CrossRef]
- Gómez-Salazar, A.; Cuvi, N. Informal settlements and environment in Quito. Áreas. Rev. Int. Cienc. Soc. 2016, 35, 101–119. [Google Scholar]
- Mena, A.P. Regularización de los Asentamientos Informales en Quito: Análisis de las Políticas Públicas, FLACSO Ecuador. Master’s Thesis, Facultad Latinoamericana de Ciencias Sociales, Sede, Ecuador, July 2010. [Google Scholar]
- Robert, J.; D’Ercole, R.; Pigeon, P.; Serrano, T. Complejidad, incertidumbre y vulnerabilidad: El riesgo asociado al volcán Cotopaxi en el Valle de Los Chillos (Quito, Ecuador). Bull. Inst. Franç. Etudes Andin. 2009, 38, 709–733. [Google Scholar] [CrossRef] [Green Version]
- Carrión Cueva, M.A. Análisis de la Dinámica de Crecimiento Urbano en la Cabecera Parroquial de Conocoto, en el Periodo de Estudio 2001 a 2010 y Escenario Tendencial al 2030. Ph.D. Thesis, Pontificia Universidad Católica del Ecuador, Facultad de Ciencias Humanas, Quito, Ecuador, 2020. [Google Scholar]
- Müller, R.; Pacheco, P.; Montero, J.C. The Context of Deforestation and Forest Degradation in Bolivia Drivers, Agents, and Institutions; Center for International Forestry Research: Bogor, Indonesia, 2014; p. 92. [Google Scholar]
- Jieying, X.; Yanjun, S.; Jingfeng, G.; Ryutaro, T.; Changyuan, T.; Yanqing, L.; Zhiying, H. Evaluating urban expansion and land use change in Shijiazhuang, China, by using GIS and remote sensing. Landsc. Urban Plan. 2006, 75, 69–80. [Google Scholar] [CrossRef]
- Li, F.; Xie, Z.; Clarke, K.C.; Li, M.; Chen, H.; Liang, J.; Chen, Z. An agent-based procedure with an embedded agent learning model for residential land growth simulation: The case study of Nanjing, China, Cities. Land Use policy 2020, 88, 155–165. [Google Scholar] [CrossRef] [Green Version]
- Durán, G.; Martí, M.; Mérida, J. Crecimiento, segregación y mecanismos de desplazamiento en el periurbano de Quito. Íconos Rev. Cienc. Soc. 2016, 56, 123. [Google Scholar] [CrossRef] [Green Version]
- Viera, A.J.; Garrett, J.M. Understanding interobserver agreement: The kappa statistic. Fam. Med. 2005, 37, 360–363. [Google Scholar] [PubMed]


| Land Use [53] | Definition | Area (km2) | Percent |
|---|---|---|---|
| Forest plantation | Anthropically established tree stand with one or more forest species. | 23.64 | 2.68% |
| Areas with no vegetation cover | Areas generally devoid of vegetation which are not used for agriculture or forestry due to their soil, climatic, topographic, or anthropic limitations, although they may have other uses. | 3.88 | 0.44% |
| Shrub vegetation | Areas with a substantial component of non-tree native woody species. They include degraded areas in transition to dense canopy coverage. | 66.13 | 7.50% |
| Moorland | High Andean vegetation is characterized by dominant non-arboreal species that include fragments of native forest typical of the area. | 172.36 | 19.55% |
| Agriculture and livestock | Agricultural areas and planted pastures. | 401.8 | 45.57% |
| Native forest | Primary or secondary arboreal ecosystem regenerated by natural succession, characterized by the presence of trees of different native species in an irregular structure with one or more strata. | 108.99 | 12.36% |
| Infrastructure | Road and transport networks, industry, and social infrastructure. | 2.15 | 0.24% |
| Natural water bodies | Surface static or moving water. | 0.62 | 0.07% |
| Herbaceous vegetation | Areas of spontaneously growing native herbaceous species receiving no special care and used for sporadic grazing, wildlife, or protection purposes. | 0.7 | 0.08% |
| Urban area | Areas mainly occupied by homes and public buildings. | 101.34 | 11.51% |
| Factor | Name of the Map | Data Sources and Construction Method of the Maps * |
|---|---|---|
| Physical | Slope | Obtained from the altitude map [62]. |
| Physical | Euclidean distance to roads | Obtained from the infrastructure and service map [63]. |
| Physical | Potential land use | Obtained from the slope, temperature, and precipitation maps, and from the following soil maps: effective depth; surface texture, stoniness, fertility, salinity, toxicity, drainage, flooding periods and soil moisture [62]. |
| Physical | Landslide risk | Obtained from the land use and land cover map, geomorphology map, seismic movement data and precipitation map [64]. |
| Social | Access to services (electricity, drinking water and sewerage) | Obtained from the infrastructure and service map [63]. |
| Social | Access to education | Obtained from the infrastructure and service map [63]. |
| Social | Access to healthcare | Obtained from infrastructure and service map [63]. |
| Social | Housing types | Obtained from the building material map [65]. |
| Social | Foreign immigration | Obtained from the data: total population; population density; population distribution; migratory movements; internal and external migration [65]. |
| Social | Internal immigration | Obtained from the data: total population; population density; population distribution; migratory movements; internal and external migration [65]. |
| Social | Education level | Obtained from the data: coverage of education services, education level [65]. |
| Social | Illiteracy | Obtained from the illiteracy rate [40]. |
| Climate | Water deficit | Obtained from the maps: precipitation, temperature, dry months, and water deficit [62]. |
| Climate | Evapotranspiration | Obtained from the maps: precipitation, temperature, water deficit and vegetation [62]. |
| Climate | Rainfall | Obtained from the maps: precipitation [62]. |
| Window Size (Num. of Pixels) | Similarity (%) | Real Evaluation Distance on the Map (Pixel Size 50 m) |
|---|---|---|
| 1 | 41.5% | 50 m |
| 7 | 71.9% | 350 m |
| 13 | 77.0% | 650 m |
| 19 | 79.8% | 950 m |
| 25 | 81.3% | 1250 m |
| 31 | 82.0% | 1550 m |
| 37 | 82.4% | 1850 m |
| 43 | 82.7% | 2150 m |
| 49 | 82.8% | 2450 m |
| 55 | 82.9% | 2750 m |
| 61 | 83.0% | 3050 m |
| 67 | 83.0% | 3350 m |
| Actual Land Use 2018 | |||||||||||
|---|---|---|---|---|---|---|---|---|---|---|---|
| 1 | 2 | 3 | 4 | 5 | 6 | 7 | 8 | 9 | 10 | ||
| Actual land use 2000 | 1 | 0.0178% | 1.4132% | 0.2787% | 1.7% | 0.0053% | 0.0135% | 0.0014% | 0.0245% | 0.3267% | |
| 2 | 0.0235% | 0.1850% | 2.1732% | 0.1% | 0.0104% | 0.0573% | |||||
| 3 | 0.3819% | 0.0033% | 0.2689% | 1.7% | 0.0199% | 0.0103% | 0.0223% | 0.0120% | 0.2676% | ||
| 4 | 0.0248% | 0.0134% | 0.0979% | 0.6% | 0.0078% | 0.0126% | 0.0002% | ||||
| 6 | 0.0297% | 0.0046% | 0.5058% | 0.0325% | 0.6% | 0.0007% | |||||
| 7 | 0.2% | 3.1065% | |||||||||
| 8 | 0.1646% | 0.0% | 0.2469% | ||||||||
| 9 | 0.3968% | 4.3651% | |||||||||
| 10 | 0.0017% | 0.0% | 0.0003% | 0.0003% | |||||||
| 11 | 0.1176% | 0.2227% | 0.0258% | 4.5% | 0.0024% | 0.0206% | 0.6819% | ||||
| 12 | 0.1820% | 0.0105% | 0.4734% | 0.0260% | 3.8% | 0.0243% | 0.0170% | 0.0063% | 0.0002% | 0.9976% | |
| 13 | 0.0770% | 0.0105% | 0.0832% | 0.0215% | 5.2% | 0.0014% | 0.0180% | 0.1689% | |||
| Land Use Name | Actual Land Use 2018 | Simulated Land Use 2018 | ||
|---|---|---|---|---|
| Area/km2 | Area/% | Area/km2 | Area/% | |
| Forest plantation | 23.64 | 2.68% | 23.31 | 2.64% |
| Areas with no vegetation cover | 3.88 | 0.44% | 3.93 | 0.44% |
| Shrub vegetation | 66.13 | 7.50% | 64.78 | 7.37% |
| Moorland | 172.36 | 19.55% | 171.53 | 19.45% |
| Agriculture and livestock | 401.8 | 45.57% | 401.09 | 45.50% |
| Native forest | 108.99 | 12.36% | 107.91 | 12.24% |
| Infrastructure | 2.15 | 0.24% | 2.04 | 0.23% |
| Natural water bodies | 0.62 | 0.07% | 0.71 | 0.08% |
| Herbaceous vegetation | 0.7 | 0.08% | 0.83 | 0.09% |
| Urban area | 101.34 | 11.51% | 105.48 | 11.96% |
| Total/km2 | 881.61 | |||
| Land Use Name. | 2018 Actual Land Use | 2023 Scenario | 2028 Scenario | 2038 Scenario | |||||
|---|---|---|---|---|---|---|---|---|---|
| Area (km2) | Area (%) | Area (km2) | % Increment | Area (km2) | % Increment | Area (km2) | % Increment | ||
| Study area | 23.64 | 2.68 | 23.23 | −1.73 | 23.21 | −1.82 | 22.97 | −2.83 | |
| Forest plantation | A.I. Quito | 14.31 | 6.04 | 15.07 | 5.31 | 16.13 | 12.72 | 16.60 | 16.00 |
| A.I. Machachi | 5.22 | 3.90 | 4.37 | −16.28 | 3.83 | −26.63 | 3.63 | -30.52 | |
| Study area | 3.88 | 0.44 | 3.72 | −4.12 | 3.57 | −7.99 | 3.30 | −14.95 | |
| Areas with no vegetation cover | A.I. Quito | 0.2 | 0.08 | 0.19 | -5.00 | 0.16 | -20.00 | 0.05 | -75.00 |
| A.I. Machachi | - | - | - | - | - | - | - | - | |
| Study area | 66.13 | 7.50 | 66.76 | 0.95 | 67.65 | 2.30 | 68.82 | 4.07 | |
| Shrub vegetation | A.I. Quito | 22.74 | 9.60 | 20.88 | −8.18 | 19.41 | −14.64 | 18.07 | −20.54 |
| A.I. Machachi | 3.94 | 2.94 | 4.58 | 16.24 | 4.74 | 20.30 | 4.10 | 4.06 | |
| Study area | 172.36 | 19.55 | 171.02 | −0.78 | 169.27 | −1.79 | 165.64 | −3.90 | |
| Moorland | A.I. Quito | - | - | - | - | - | |||
| A.I. Machachi | - | - | - | - | - | - | - | - | |
| Study area | 401.80 | 45.58 | 398.70 | −0.77 | 395.28 | −1.62 | 389.93 | −2.95 | |
| Agriculture and livestock | A.I. Quito | 120.56 | 50.90 | 115.46 | −4.23 | 109.40 | −9.26 | 97.92 | −18.78 |
| A.I. Machachi | 96.12 | 71.79 | 96.11 | −0.01 | 96.29 | 0.18 | 96.89 | 0.80 | |
| Study area | 108.99 | 12.36 | 106.77 | −2.04 | 104.35 | −4.26 | 99.46 | −8.74 | |
| Native forest | A.I. Quito | 4.66 | 1.97 | 4.46 | −4.29 | 4.17 | −10.52 | 3.47 | −25.54 |
| A.I. Machachi | 0.29 | 0.22 | 0.25 | −13.79 | 0.25 | −13.79 | 0.18 | −39.31 | |
| Study area | 2.15 | 0.24 | 2.13 | −0.93 | 2.16 | 0.47 | 2.20 | 2.33 | |
| Infrastructure | A.I. Quito | 1.21 | 0.51 | 1.18 | −2.48 | 1.19 | −1.65 | 1.14 | −5.79 |
| A.I. Machachi | 0.83 | 0.62 | 0.85 | 2.41 | 0.86 | 3.61 | 0.95 | 14.22 | |
| Study area | 0.62 | 0.07 | 0.62 | 0.00 | 0.62 | 0.00 | 0.62 | 0.00 | |
| Natural water bodies | A.I. Quito | 0.6 | 0.25 | 0.6 | 0.00 | 0.60 | 0.00 | 0.60 | 0.00 |
| A.I. Machachi | - | - | - | - | - | - | - | - | |
| Study area | 0.70 | 0.08 | 0.71 | 1.43 | 0.72 | 2.86 | 0.77 | 10.00 | |
| Herbaceous vegetation | A.I. Quito | - | - | - | - | - | - | - | - |
| A.I. Machachi | - | - | - | - | - | - | - | - | |
| Study area | 101.34 | 11.49 | 107.90 | 6.47 | 114.68 | 13.16 | 127.71 | 26.02 | |
| Urban area | A.I. Quito | 72.57 | 30.64 | 78.9 | 8.72 | 85.53 | 17.86 | 98.35 | 35.52 |
| A.I. Machachi | 27.49 | 20.53 | 27.73 | 0.87 | 27.91 | 1.53 | 28.15 | 2.39 | |
| Total (km2) | Study area: 881.61; | Quito: 236.85 | Machachi: 133.89 | ||||||
Publisher’s Note: MDPI stays neutral with regard to jurisdictional claims in published maps and institutional affiliations. |
© 2021 by the authors. Licensee MDPI, Basel, Switzerland. This article is an open access article distributed under the terms and conditions of the Creative Commons Attribution (CC BY) license (https://creativecommons.org/licenses/by/4.0/).
Share and Cite
Ulloa-Espíndola, R.; Martín-Fernández, S. Simulation and Analysis of Land Use Changes Applying Cellular Automata in the South of Quito and the Machachi Valley, Province of Pichincha, Ecuador. Sustainability 2021, 13, 9525. https://doi.org/10.3390/su13179525
Ulloa-Espíndola R, Martín-Fernández S. Simulation and Analysis of Land Use Changes Applying Cellular Automata in the South of Quito and the Machachi Valley, Province of Pichincha, Ecuador. Sustainability. 2021; 13(17):9525. https://doi.org/10.3390/su13179525
Chicago/Turabian StyleUlloa-Espíndola, René, and Susana Martín-Fernández. 2021. "Simulation and Analysis of Land Use Changes Applying Cellular Automata in the South of Quito and the Machachi Valley, Province of Pichincha, Ecuador" Sustainability 13, no. 17: 9525. https://doi.org/10.3390/su13179525
APA StyleUlloa-Espíndola, R., & Martín-Fernández, S. (2021). Simulation and Analysis of Land Use Changes Applying Cellular Automata in the South of Quito and the Machachi Valley, Province of Pichincha, Ecuador. Sustainability, 13(17), 9525. https://doi.org/10.3390/su13179525