Article

Towards an Adaptation of Efficient Passive Design for Thermal Comfort Buildings

by
Ghada Elshafei
1,*,
Silvia Vilcekova
2,*,
Martina Zelenakova
2 and
Abdelazim M. Negm
3
1
Department of Architecture, Faculty of Engineering, Minia University, Minia 61519, Egypt
2
Institute of Environmental Engineering, Faculty of Civil Engineering, Technical University of Košice, Vysokoškolská 4, 04200 Košice, Slovakia
3
Department of Water and Water Structures Faculty of Engineering, Zagazig University, Zagazig 44519, Egypt
*
Authors to whom correspondence should be addressed.
Sustainability 2021, 13(17), 9570; https://doi.org/10.3390/su13179570
Submission received: 25 June 2021 / Revised: 5 August 2021 / Accepted: 10 August 2021 / Published: 25 August 2021

Abstract

:
This paper discusses the effect of various climatic conditions that pertain to passive design measurements and their relationships with building configurations to improve indoor thermal comfort based on the different climate zones in Egypt to support Egypt’s sustainability agenda 2030. We find the most appropriate design settings that can increase the indoor thermal comfort, such as building orientation and shape. These settings can be modeled using DesignBuilder software combined with Egyptian meteorological data. This software is used accompanied by computational fluid dynamics to numerically assess the outcomes of different changes, by simulating indoor climate condition factors such as wind speed and temperature. Natural ventilation simulations were performed for four different shapes to create comprehensive dataset scenarios covering a general range of shapes and orientations. Seven scenarios were optimized to put forward a series of building bioclimatic design approaches for the different characteristic regions. The results indicated that the temperature decreased by about 3.2%, and the air velocity increased within the study domain by 200% in the best and the worst cases, respectively, of the four different shapes. The results of the study gave evidence that the configuration of buildings, direction, and wind speed are very important factors for defining the natural ventilation within these domains to support the green building concept and the sustainable design for a better lifestyle.

1. Introduction

The idea of green building is gaining popularity in different countries. Green building is an idea that seeks designs for buildings that are compatible with the environment and resource conservation over their lifetime [1]. These objectives expand and complement the economic, utility, durability, and comfort concerns of classical building design. Green buildings are intended to minimize the total undesirable effects of environmental building on human health and the natural world. Green buildings utilize electricity, water, and other resources effectively, preserving the wellbeing of the inhabitants and increasing the efficiency of the workers. Additionally, green buildings eliminate waste, emissions, and deterioration of the atmosphere, which enhances the air quality for environmental protection [2].
This research focuses on thermal comfort, which, particularly in the hot–arid environment, plays a major role in all building sectors in Egypt. It has a significant effect on buildings’ indoor temperature and hence on energy use. It may also be represented using the Physiologically Equivalent Temperature (PET) and up-to-date thermal index [3]. PET is regarded as an important method for evaluating thermal comfort in various climates [4]. It depends on human characteristics (gender, age, dress, activity) and natural conditions (air temperature, radiation from the sun, relative humidity, and wind speed) [5]. Therefore, thermal comfort may be improved by reducing and adjusting the impact of climatic factors based on multiple techniques for building design [6,7,8]. The present study aims primarily to incorporate current indoor thermal comfort as well as natural ventilation in various climatic regions in Egypt, which are classified into seven regions.
These regions are defined as the different governorates in Egypt that relate to each other geographically, locally, and economically. To explore the relationship between the Egyptian climatic regions and building design and then determine the most appropriate building design strategies, this paper adopts the DesignBuilder (DB) software to analyze the design strategies according to the climatic meteorological data. This research firstly reviewed the methods that worked on improving the thermal properties of indoor spaces in the different Egyptian climates by formulating user guides for the first planning phase, which is highlighted in three phases. Firstly, the articles for a statistical review of a series of research that focused on temperature observations and simulations which evaluate the climatic factors influencing thermal comfort have been studied.
The study followed the correct mitigation techniques that can be adopted in various areas to enhance thermal comfort indoor spaces. Secondly, a comprehensive simulation was conducted to evaluate the function of each simulator component that affects the thermal activity of the indoor spaces allocated in dry–arid or hot–arid areas. Finally, we investigated a recommended optimization scheme that labeled the best mitigation techniques based on the modeling calculations. To carry out the recommended optimization methodology, we performed a study based on numerical simulation as a computational fluid dynamic (CFD) [3] with the aid of the DesignBuilder software to develop the case study. To do so, a detailed simulation model of building architecture was carried out using the program interface EnergyPlus (EP) to analyze indoor comfort situations in addition to the natural ventilation of various shapes of buildings in different climatic regions in Egypt.
Next, we applied the strategies that resulted from the software on the best and worst cases to measure the indoor thermal surroundings based on Adaptive Thermal Comfort (ATC) models in different conditions. One of the most significant determinations of thermal comfort indoors is the thermal performance of the building envelope that depends the most on temperature. Therefore, some of the predictions published by the Intergovernmental Panel on Climate Change (IPCC) [9] indicated an increase in the global average surface temperature across Egypt in various scenarios, which is the location of this case study. Correspondingly, the construction sector was estimated to have produced 28% of carbon dioxide (CO2) emissions and to have consumed around 60% of the world’s electricity in residential and commercial buildings to achieve thermal comfort [10,11].
Therefore, the sustainable design that achieved thermal comfort is built to minimize any harmful impact in running buildings that improve the occupants for indoor air quality. Most buildings use ventilation air conditioning systems to achieve thermal comfort, which consumes more energy. Accordingly, we have to utilize renewable energy as a technique for the environment to achieve Net-zero Energy Buildings (NEBs), which is studied in the roadmap review committee, Japan [12,13]. Different climate zones have introduced variations of building designs, which have affected building efficiency. Buildings are typically constructed in cold environment regions to use internal heat and to minimize heat loss. In hot climate regions, the competing concepts are utilized to avoid solar radiation and introduce cold air effectively.
These concepts can predict the environment that describes the best building design. This design in the hot–arid region is the biggest challenge to optimize natural ventilation to provide human comfort and to consume less energy, and also to enhance the efficiency of indoor air quality. Thus, several mathematical models have been developed and tested for natural ventilation [14] parameters such as heat transfer radiation and the effect of wind that produces a buoyancy force to drive airflow across stacks, which was reported in many references [15,16,17,18]. As has been discussed in previous works, natural ventilation is considered an important point in achieving thermal comfort for buildings. Buildings’ and cities’ thermal comfort has become a necessary topic for architects, planners, engineers, and other sponsors to consider.
Therefore, the objective and the novelty of this study is to find the best relationship between the building configuration and its effects on natural ventilation according to the different climatic regions where the prioritization of indoor thermal comfort in these hot regions is a critical problem, ensuring greater comfort for human indoor activities. The study supports the green buildings trend in Egypt and helps achieve green lifestyle sustainability.

2. Literature Review
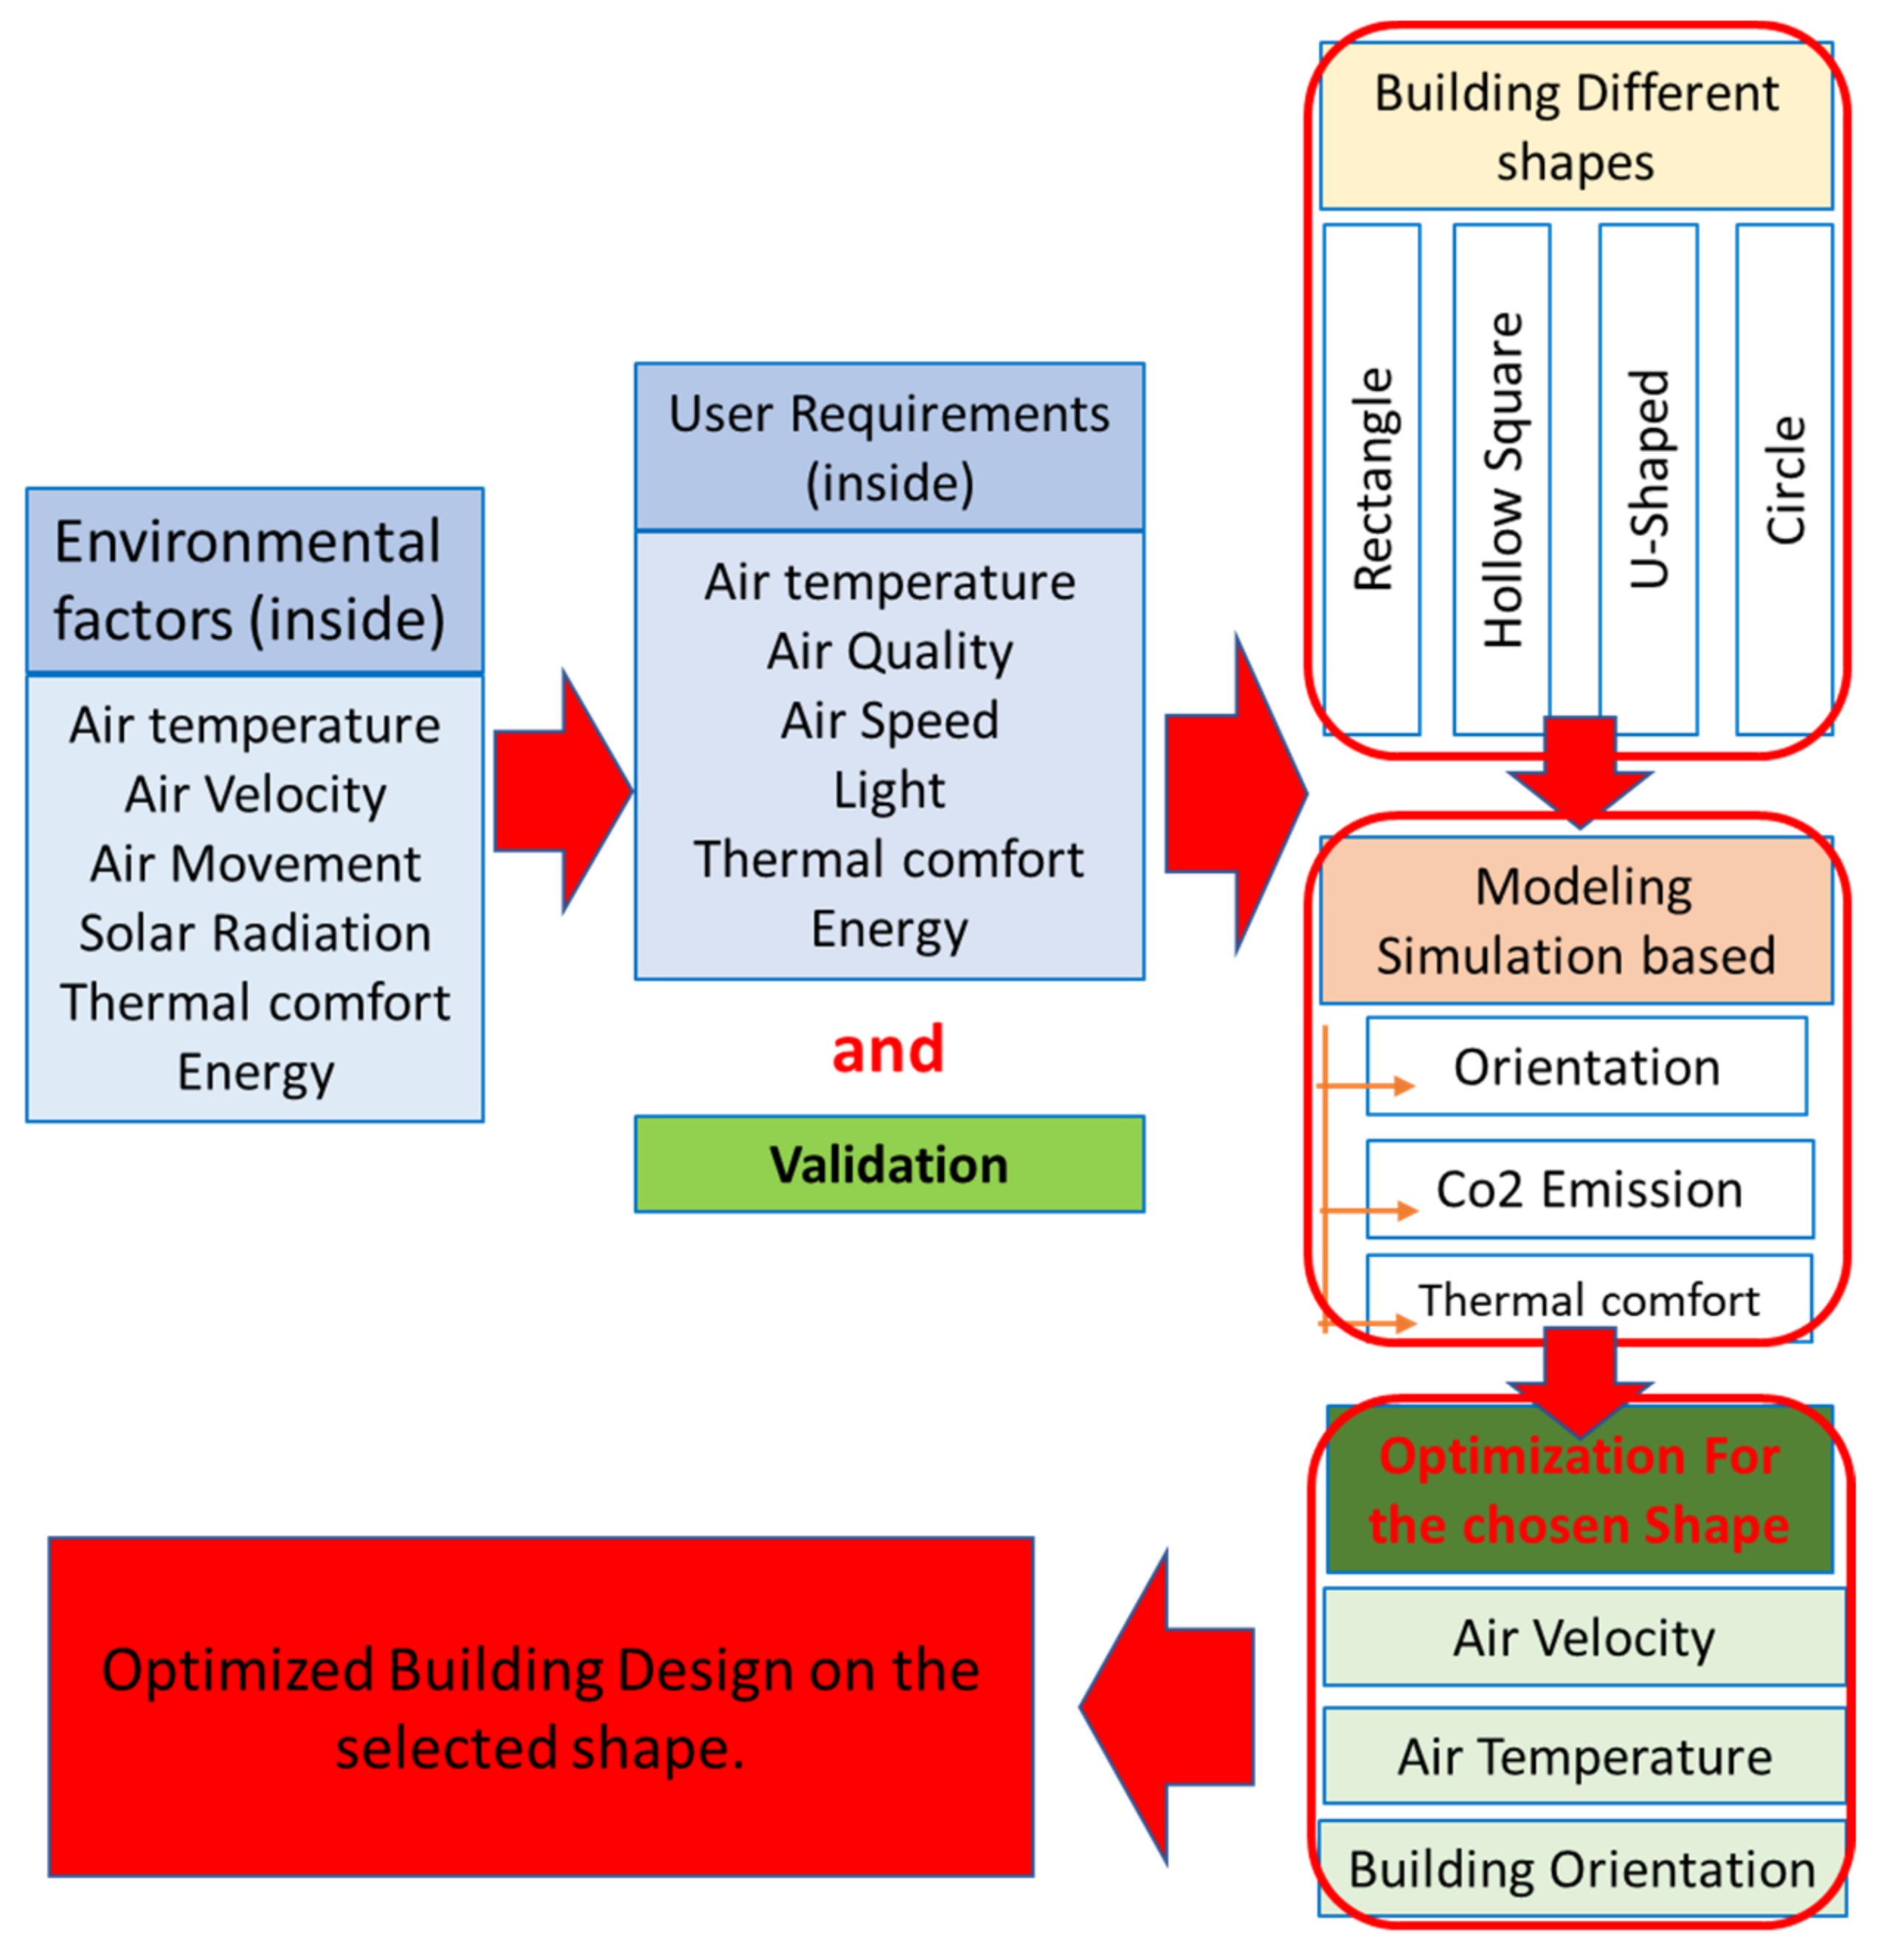
The synergy between buildings and their shapes and dimensions has a critical impact on the thermal behavior of the considered spaces [19]. Changing the shape of an urban block or its orientation influences its thermal behavior [20]. Multiple techniques have been studied all over the world to improve the thermal comfort of indoor spaces to adapt and mitigate climate change. From those techniques, the building shape, orientation, roof, and landscape are analyzed [21,22,23]. The shape of the building is one of the most important considerations in the early design stage since the building size and its orientation are calculated explicitly. The shape of the building influences the performance of the building in many ways such as energy consumption, construction costs, and esthetic results [24].
According to the MIT study, four major factors affect the energy consumption of buildings: house architecture, air conditioning, heating ventilation systems (HVAC), and the personal behavior model, which are very random [25,26]. The climate environment is fixed for each area. Building design, therefore, plays an important role in improving thermal comfort which effectively reduces energy consumption in buildings. Recently, natural ventilation evolved into a common trend as a mechanism that helps boost indoor air quality, process cooling, and optimum energy usage [27,28]. Additionally, it helps to decrease energy consumption by up to 30–40% in comparison with mechanically ventilated buildings [29,30,31,32,33,34].
However, it is a challenging task to design a naturally ventilated room for air movement in and out of buildings. Some natural factors have an important role, such as climatic conditions including temperature, wind, radiation, precipitation, and sun direction [1,35,36,37]. Wang [38] studied the consequence of genetic algorithms to research floor shape’s effect on building efficiency in the architecture of green buildings and concluded that building shape variability can impact performance differently. Stelios et al. [39] studied the prismatic building envelope shapes compared to the buildings with right angles using the CFD WinAir software; the study showed an average annual energy consumption difference of 7.88% in prismatic house envelope shapes as opposed to the right-angled structures.
The authors in study [40] used CFD software to simulate the ventilation of inter-roof space and analyze effects of roof ventilation on the thermal and moisture regime of the roof. They theoretically justified the condensation formation on the inner surface of the upper layer of the double skin roof. The CFD simulation was used as a progressive method for the analysis of air temperature stratification in a theatre building. This study [41] states that the CFD simulation of air distribution in the theatre solves the different states of indoor conditions in the theatre during the year by setting different boundary and initial conditions (air temperature at the inlets, quantity of air volume flow, number of people in the audience or actors at the theatre stage, heat flow from different heat sources such as artificial lighting, etc.). Alan et al. [42] considered regional, local, and microclimate regions as a systematic approach to delivering low-energy buildings and identifying passive design opportunities to enhance adequate system efficiency, use renewable energy, and optimize end-user management. Their research aimed to rigorously answer the research question of how building and energy systems can provide high-quality indoor thermal environments that respond to local climate characteristics while minimizing energy consumption.
Morsy et al. [43] suggested the use of the theory of ’Biophilic Design’, ’Biomimicry’, and ’Green Architecture’ that help to adapt the building to the surrounding environment in many ways to achieve thermal comfort. The outcome of this study provided the integration of building elements into workplace environments that could renew a historically innate human connectedness to the natural environment that supports occupants’ productivity. Shaoxiong et al. [44] explored a study of performance-oriented architectural architecture and optimization to resolve the aforementioned efficiency disparity between the building’s energy use and field results. They presented a thorough review of the architecture trends, testing characteristics, priorities for optimization, and existing solution techniques. The study showed that performance-oriented product optimization would support the industry as a whole based on heuristic techniques and production space extension while retaining sustainability.
Yi and Malkawi [45] established a novel approach to control the form by getting the hierarchical connection between the nodes of the building agents. They explored the optimization algorithm GA for performance-based form making. The findings showed that the shades in the winter season on the optimized building resulted in approximately a 12% reduction in heat load compared with the original building and a 6% reduction in heat flow per total surface region. Another study [46] used the parametric modeling methodology GA, architecture theory for free-form buildings built by splitting the surface of the building into finite elements by creating a mesh using Grasshopper. Its applicability was demonstrated by deriving the optimized shape of the model free-form building for various climate zones. The findings revealed that the proposed method was able to quickly model and maximize the variability in the heat gain and loss characteristics induced by modifying the form of the structure.
Gao et al. [47] utilized the CFD simulations to evaluate the influence of various opening configurations on the performance of natural ventilation using the mean air age. Results of the assessment showed that the natural ventilation efficiency of the residential units was most influenced by the relative location of the openings of the windows, accompanied by the orientation of the buildings and direction of the doors. It was found that better natural ventilation performance could be achieved when the two openings were positioned in opposite directions or perpendicular to each other. In another study [48] the CFD outdoor simulation methods were used to optimize the wind environment for green building design. The authors concluded that when the wind is at a pace of around 1.5 m/s and has an upward direction, the outdoor multi-level atrium brings in a heavy stack impact. This is also useful for indoor cooling and fresh air exchange. At the same time, with the atrium, the wind speed in the ground level open spaces is greater and within a more reasonable range compared to the scenario where there is no atrium.
Aram et al. [1] used the CFD numerical method in the computational investigation to calculate the properties of flows in a space such as temperature, velocity, pressure, and others. The results indicated that increases in the opening area enhance natural ventilation by up to 25%. It was observed that the local wind can efficiently accelerate the ventilation process by orienting the roof windows towards the leeward direction. Hatamipour and Abedi [49] studied the natural ventilation technologies that are presently used in the hot and humid climate. They proposed a design for passive cooling schemes in a design of building shading to prevent the obstruction of air circulation. The simulation findings revealed that the usage of light-colored internal or exterior doors, light-colored walls, and roofs led to a reduction in the cooling load; however, a more dramatic reduction in the cooling load was accomplished by the thickness of the wall, resulting from the decline in the total heat transfer coefficient.
Researchers in [50] suggested the rectangular plans were more efficient than a square plan to enhance natural ventilation in the building. Additionally, the elevated floor permits the wind to flow easily to the interior spaces. They concluded that due to the low mean temperature and higher relative humidity values, night ventilation is the most effective approach. The mean temperature values recorded were below 30 °C and the relative humidity values were above 70%. Elshafei et al. [51] performed an experimental and comparative analysis to examine the effect of natural ventilation on a residential building in Egypt; for the steady-state condition, the CFD tools offered in DB were adopted to estimate the field of wind flow within the study domain. They quantified thermal comfort using the parameters of temperature, air velocity, and relative humidity. Finally, some adjustments were made to the design of window parameters such as size, placement, and shades to improve indoor air quality and ventilation. They concluded that the temperature decreased by 2.5%, while an increase in air velocity by 6 times was noticed.
Srijita et al.and Aritra et al. [52,53] played out a trial and similar investigations to inspect window boundaries and building energy-saving potential for three window advancements to fulfill cooling, warming, and artificial lighting load interest. The use of exceptionally protected switchable windows and controlling them by utilizing the PV framework is an alluring procedure. Likewise, they demonstrated that it is conceivable for the thermal comfort conditions inside a structure to enhance the inhabitant’s wellbeing and psychological performance. Nonetheless, customary exceptional windows ought to be supplanted with semi-transparent windows to accomplish agreeable sunshine inside a structure. However, smart windows can smooth infiltration to the structure that helps adjust the speed of air that impacts the thermal comfort of a building.
An analysis of previous studies revealed that the most research was focused on the impact of external boundaries and the interior building. The conditions of the environment and the effect of different variables of the climate such as temperature, humidity, wind velocity direction, and solar radiation on the pattern of airflow, along with the building orientation, shading, and comfort conditions are other important factors that toned to be considered in the building operating conditions. Additionally, the CFD models are designed to simulate airflow and air circulation by demanding the climatic parameters in boundaries.
This study follows the concept of green building by highlighting the effects of design variables such as the orientation of the building, decreases in the discomfort level, and decreases in the CO2 emission on the initial engineering design procedure. The variations in these variables and their influence on the condition of indoor air are addressed using a series of computer simulations. Wind-driven ventilation and its association with other temperature influences has been studied. Through the optimization process, the scenario that provides the highest natural ventilation will be addressed as the optimal design, which enhances the indoor air quality, which leads to the significance of each variable, which can help engineers to better invest in space features throughout the predesign stage.

3. Methodology

While there are many similar studies in the public domain, this study focused on new strategies to differentiate among multi regions that have nearly climatic properties in Egypt. As a problem of research is finding the best optimization design for buildings in such countries to achieve the green building concepts, we need an extensive study on these strategies or techniques to be applied in these countries. In this study, CFD software combined with an energy simulation program was used to enhance the indoor airflow and thermal comfort in residential buildings in Egypt. As a state-of-the-art simulation tool for thermal comfort calculation, DesignBuilder was used to model air characteristics. DesignBuilder is a powerful 3D model for the visualization and the analysis of resident comfort during the early stages of construction design. It provides a thermal graphical interface comfort airflow analysis and hydrodynamic modeling. The suggested methodology in our study for optimized the building shape regarding thermal comfort improvement is represented as shown in Figure 1.
The proposed approach in this study comprises airflow properties such as temperature and air velocity in a residential architectural building for the hot and dry arid subtropical climatic conditions in Egypt. Specific scenarios for natural ventilation enhancement are formulated based on the architectural design principles which have been studied in many previous kinds of research. The methodology began by analyzing the environmental factors that affect the climatic regions, such as factors affecting the user requirements inside the domain. Then, we proposed four different shapes for buildings in Egypt as the main different scenarios in seven selected cities. The shapes were chosen according to the most designed buildings in Egypt, which have the main distinguishing features of Egypt’s environment [54,55]. These shapes were simulated in the DesignBuilder program after their validity was checked. The modeling process began in the DesignBuilder tool to imitate each one to obtain the optimized objective (thermal comfort), based on the constrain (CO2 emission) and parameter (orientation).
We considered architectural elements such as “building rotation” between 0° and 355°, “mixed-mode max wind speed” between 0 m/s and 50 m/s, and “natural vent setpoint temperature” between 10 °C and 30 °C as the main variables. The chosen objective was to minimize the discomfort, and the constrain was the operational CO2 emission being less than 10,000 ton. Finally, the effectiveness of these parameters and their impacts were investigated to enhance thermal comfort.
Weather parameters such as dry bulb temperature and wet bulb temperature, atmospheric pressure, global solar irradiation, wind velocity, and wind direction were considered as data inputs for DesignBuilder. The values were derived from a reference weather station in each region for certain variables. The hot weather conditions of August were the time chosen for simulation, while the cooling systems were the most demand. So, August was considered the worst-case scenario for simulations in terms of comfort conditions.
The simulation was applied to four different building configurations (rectangle, hollow square, U-shaped, circle) in the seven selected climatic regions, which introduced twenty-eight scenarios. We chose seven different scenarios from the twenty-eight, according to the best one that achieves the best parameters for thermal comfort (i.e., the best building configuration in each climatic region). After the simulation and CFD steps, the slices were taken in the first, middle, and end of each shape of the buildings in the two different axes, X and Y, to measure the temperature and air velocity. Then, the optimization step was applied to the seven different scenarios to choose the best and the worst case to calculate the difference of change in temperature and air velocity, achieving the thermal comfort by using the following equations, Equations (1) and (2):
T = ( T c T n ) / T c 100 ,
V = ( V c V n ) / V c 100 ,
where ∆T and ∆V are the rate of change in temperature and air velocity before and after optimization, Tc and Vc are the temperature and air velocity in the current state before optimization, and Tn and Vn are the temperature and air velocity in the next case after optimization.

4. Case Study Analysis

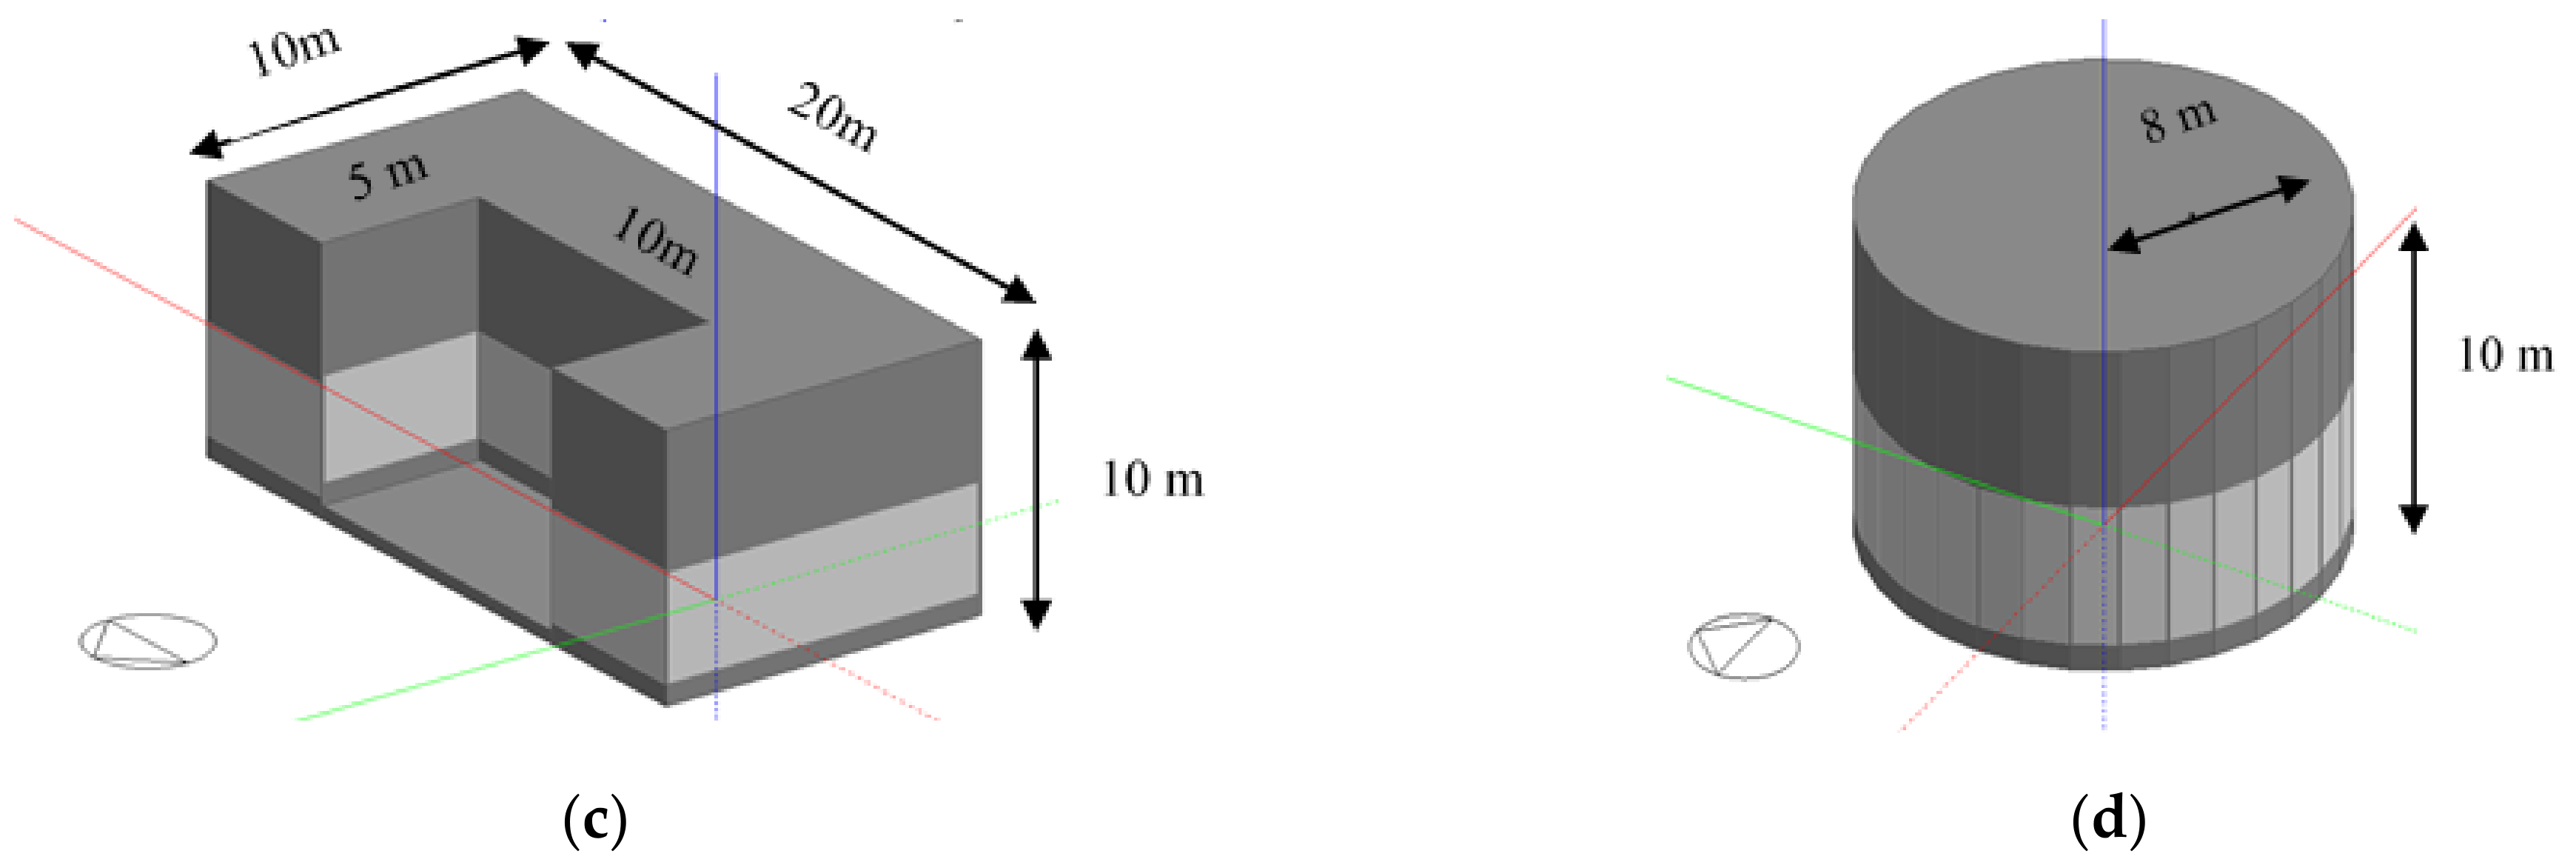
4.1. Location and Building Geometric

The selected cases were chosen based on the reason for their difference in a climate to help create a set of different climatic data in Egypt [50]. The primary data for the buildings was proposed as a residential building. Then, the simulation was conducted based on ‘real’ hourly weather data [56] applied on an area of about 200 m2 for the chosen different building geometries (rectangle with dimensions 20 m × 10 m, square shape with side length 15 m and an inside square with side length of 5 m as a court, U-shaped building with outside dimensions 25 m × 10 m and inside dimensions 10 m × 5 m, circle with radius 8 m). The window locations and opening sizes were assumed as constant parameters by default in the DB tool for all cases. Figure 2 shows the different suggested shapes and their dimensions.

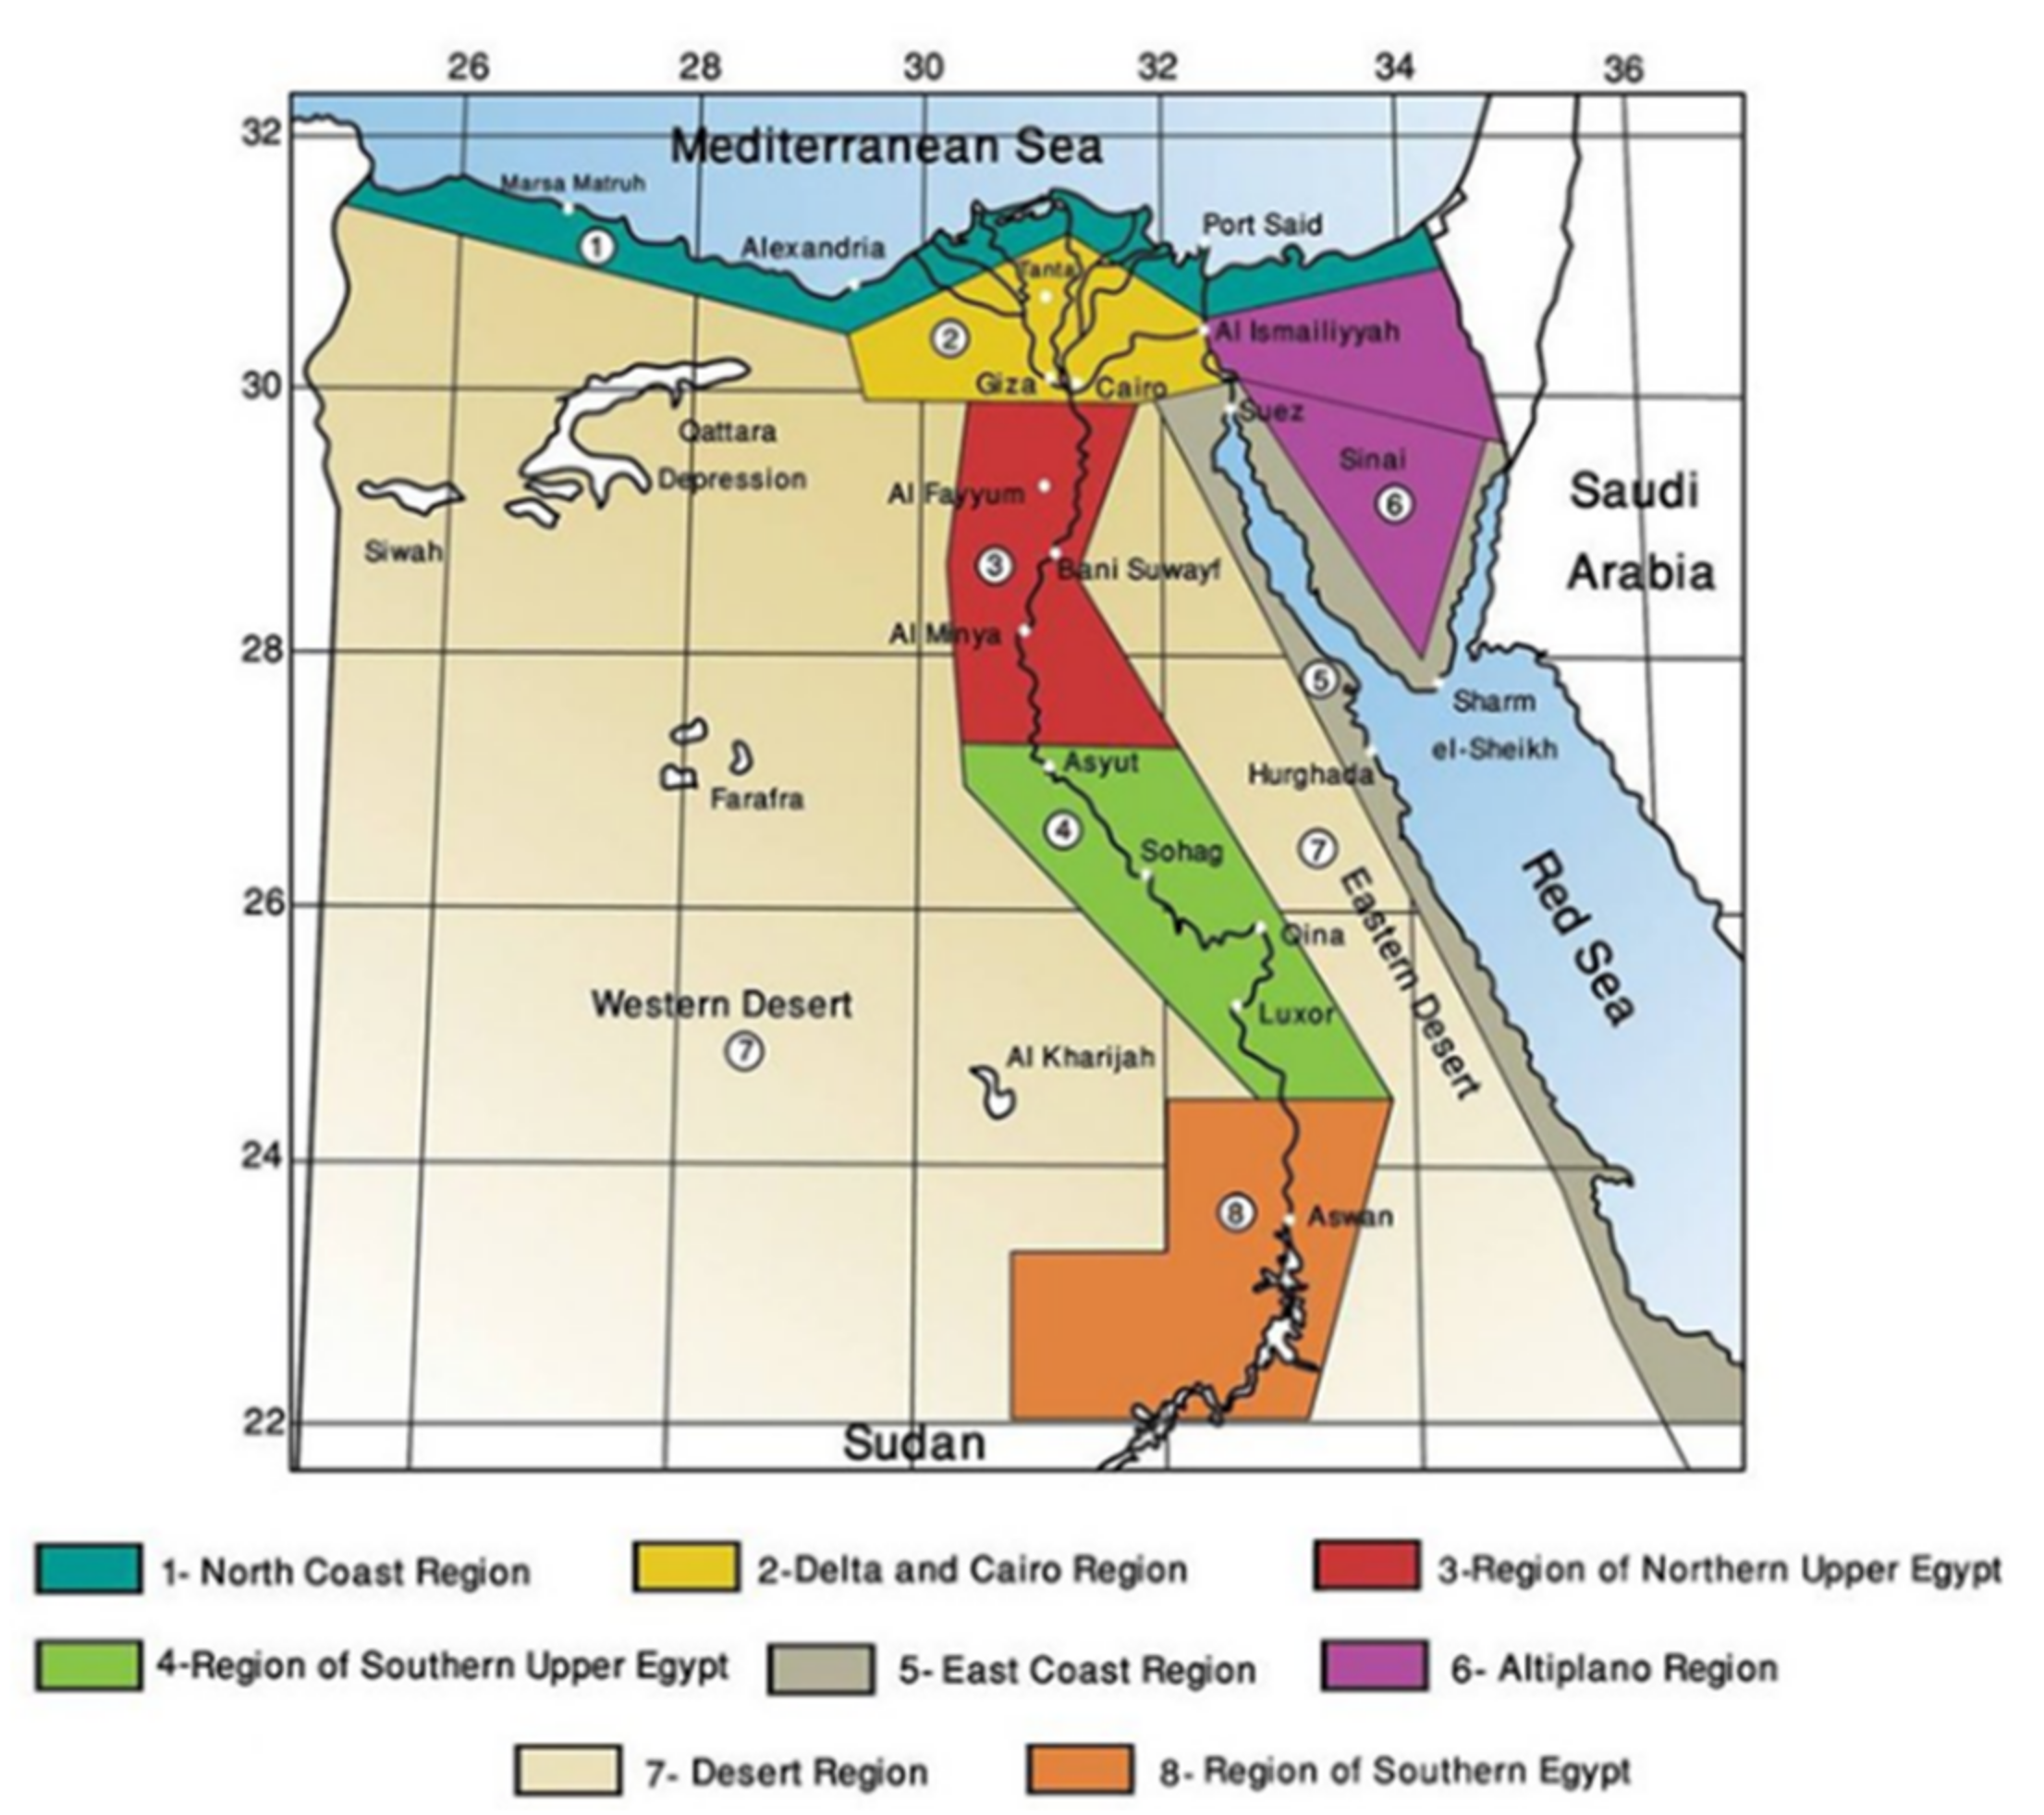
4.2. The Egyptian Climate Overview

Climate is characterized as the human being’s comfort, where all meteorological elements are included (air temperature, air velocity, air pressure, humidity, precipitation, fog, etc.) [51]. The environment in Egypt is determined by several influences, the most significant of which are the location, the geography of the general weather system, and the areas of low pressure. These parameters led to the distribution of the regions in Egypt into defined climatic areas except for the northern area, which enjoys a Mediterranean climate, where Egypt lies in the dry arid zone. In summer, the climate is hot and dry, and in winter, it is mild with little rain, which increases on the coast. Egypt has only two prominent seasons: a moderate November–April winter and a hot May–October summer, where the average temperature is measured between 9 and 24 in January, and between 21 and 42 in July and August [57].
Egypt has a strong difference in climate. The Research Center for Housing and Construction (HBRC) divides the country according to Koeppen classification [58,59] into multiple features such as main climatic, perceptions, and temperature. Egypt experiences the ’hot desert climate’ (BWh) along the coast in the country’s southern and central regions, and the ‘hot–arid climate’ (BSh). The climatic regions in Egypt are separated into eight regions [60] of environment planning, as shown in Figure 3. Many areas of Egypt are covered by the Sahara Desert, which is considered the planet’s greatest arid region. Egypt generally has a hot–arid climate year-round. This study only classified the climatic regions into seven different climatic regions, according to the matching of the climate and geographical locations that nearly compromise the Koeppen classification. The seven climatic regions are selected and analyzed as shown in Table 1, which classifies the regions into the hot, desert, and arid climates and also presents their locations [61,62,63].
Egypt’s temperature ranges from cold to incredibly humid. In winter (December through March) along the country’s northern coast, the climate is Mediterranean—mild, windy, and humid, with intermittent rains. Sinai can sometimes be covered with snow. Summer is typically very dry in Egypt (June through September) with exceptionally high temperatures between 33 °C and 38 °C, often reaching 49 °C. The percentage of annual sunshine is 42%, while its duration ranges between 3500 h/year and 4500 h/year. Additionally, in summer, the dominant wind direction is SSW (south–southwest), with an average wind speed of 2.2 m/s. Additionally, the principal wind direction in winter is NNW (north–northwest), with an average wind speed of 2.3 m/s. Additionally, the relative humidity ranges from 77% to 80% year-round [63,65].
According to a comprehensive survey of measuring temperature and air velocity for the different chosen cities, the study recommended the month of August based on temperature/humidity, as almost the driest one across the different cities. Table 2 shows the maximum and minimum features of our climatic study regions. From this section, it is clear that climate change has an important impact on the building’s pre-design environment. Consequently, the purpose of this study is to investigate the thermal performance of bioclimatic zones in different cities in Egypt by generating some specific information about temperature and air velocity variation during specific hours.
The temperature difference between indoor and outdoor is nonlinear. There is a substantial link between inside and outdoor temperature when the outside temperature is warmer, while the correlation is minimal when the outside temperature is cooler [66]. In contrast to the current appropriated building designs in the area, it is necessary to model outbuilding designs that suit the type of climate characteristics widespread in the study location. This will enable the establishment of more ventilated building designs. Figure 4 shows the relation between the outdoor and indoor temperature and air velocity in the case of all the shapes in the seven cities in August [56].
Therefore, it is important to rank the effectiveness of various parameters influencing thermal comfort in hot–arid climatic zones, to know the appropriate urban geometry mitigation according to studies focused on climate measurements and simulations in the selected cases. Air temperature and velocity have the largest portion of the effects on microclimate in a hot–arid area [67,68] where the air temperature, mean radiant temperature, and solar radiation have noticed effects on the thermal comfort. This study focuses on the simulation analysis of air temperature and air velocity factors as the highest parameters of thermal comfort.

5. DesignBuilder Analysis

The DesignBuilder software includes an integrated coupling approach by transferring the output from EP to the CFD calculations as input data. The CFD can provide profitable additional data to the wind speed, providing a subjective gauge of the qualities of the Coefficient Pressure (Cp) that indicates the flow of wind at each measured point [69] based on the genetic algorithm that is used as an optimization scheme in software [70,71,72].

5.1. DesignBuilder Validation

The methodology consists of two main procedures: the first one is to optimize the DesignBuilder as a trusted tool based on Energyplus, which is sponsored by the U.S. Department of Energy’s Building Technologies Office [73]. Secondly, due to its accuracy, DesignBuilder was chosen as a simulation tool, and it has a friendly interface and gives accurate outcomes in thermal simulations [74]. This software has been used and tested in many studies to simulate built environments and has been validated for its ability to simulate thermal environmental conditions on the microclimate scale [49,75].
Our study’s purpose is to compare the relative thermal performance for multiple urban forms within a residential site before and after the optimization process. Hence, we consider the validation as adequate for the microscale simulation stage.

5.2. Modeling and Simulation

Modeling and simulations were performed using the thermal simulation tool DesignBuilder in its version (V.6.1) Energyplus 8.9. The software consists of an “early design template” by default that includes the best practice, medium weight for any building materials. A 3D DB model was first developed for the case study as a consequence of model validation. Then, we applied simulation to obtain values of the indoor air temperature in the different climate zones during the selected month (August).
Accordingly, all the details that were discussed in Section 4 were applied to the simulation model concerning the comfort limit using the ASHRAE standard adaptive approach. In this paper, we selected the Egypt weather file that originated from ASHRAE [76] as an input location to the DB simulator analysis. The analysis is mainly concerned with assessing the current status of the conditions for the comfort of internal buildings according to the expected temperatures, referenced to ASHRAE standard 55 within the different climatic regions in Egypt.
An internal CFD calculation was conducted to optimize the orientation, temperature, and air velocity parameters for the seven different climatic regions. After simulation and CFD steps, the slices were taken for suitable points measurements at the first, middle, and end of the suggested shapes of buildings in two different axes, X and Y. The slice points were chosen to be effectively distributed on all the shape space to obtain a balanced evaluation for all the thermal comfort parameters. Figure 5 shows the measurement points in each shape.

5.3. CFD Calculations

In this study, the powerful engine of DB is EnergyPlus, which is used to quantify the performance of the energy building simulation. The EP is established by the U.S. Department of Energy’s (DOE) Building Technologies Office (BTO) to model ventilation, heating, cooling, lighting, and electrical loads in buildings. As open-source and free software, EP is well-incorporated within the DB, allowing for advanced thermal dynamic simulations in a short time. A group of control measures was implemented in DB to model natural ventilation. DB uses a built-in coupling approach to obtain the results from EP as input data to its CFD module. Additionally, the wind speed on each surface can be loaded into the CFD to estimate the natural ventilation module. The EP is a group of numerous program modules that work with each other using a diversity of systems and energy sources [1].
The Adaptive Comfort Standard (ACS) based on ASHRAE standard 55 is designed for measuring naturally ventilated buildings, which calculates the suitable indoor air temperature in the building depending on the monthly mean outdoor air temperature. The following formula expresses that relationship in Equation (3):
T c o m = 0.31 T o u t + 17.8 ,
where Tcom is the optimum comfort operative temperature in °C, and Tout is the mean monthly outdoor air temperature in °C [77].
In this study, a numerical simulation for the temperature and wind-driven environment was simulated using the CFD included in DesignBuilder. To simulate the turbulence effects, the standard k-ε model [78] was considered to estimate a stable wind flow field. The air temperature inlet is a constant flux layer predictable for the turbulent energy k as given by Equation (4). The turbulent intensity I was supposed to be 10% of the wind velocity inflow at an illustrative height of about 74.6 m, where u represents the velocity component in the corresponding direction. So, to calculate the turbulent dissipation rate ε which was studied according to Equation (5), which rises from assuming local equilibrium is accomplished throughout the framework, in particular, all subparts of the framework are near balance condition and can be securely depicted by thermodynamic factors, where μ is the viscosity, and C is a main constant.
k   1.5 u × I 2 ,
ε C μ 1 / 2 × k × u z ,
Concerning the upper and side boundaries, a free slip state was chosen. The logarithmic rule was applied to the boundary at ground level and wall construction. Fine meshes were applied close to the walls of the buildings, and rough ones were used far from them. This technique was applied in the study domain to confirm a proper resolution of the boundary layers. Table 3 summarizes the applied boundary conditions and the parameters used in the numerical simulations.
CFD is used in the framework technique, and it gives correct practical results [77,78]. It is a valuable tool for authorities and architects to calculate the inside and outside conditions of structures. Regarding energy utilization and wind stream taking into account CFD modeling, adequate results were accomplished [79,80,81].
Air change efficiency assesses a system’s capacity to affect air change in an indoor or outdoor space. The principle of air change efficiency is the most accurate way to measure the level of air exchange supported in a given volume of air [82]. This CFD technique can evaluate the ventilation patterns, and it is analyzed by how much time was taken for the fresh air to substitute the old one. This was obtained by evaluating the age of the air. Additionally, different parameters affected the air change efficiency, such as the placement of inlets and exhausts, the shape of the air volume, temperature, turbulence and momentum, and the density of both fresh and old air [67]. Models of the airflow network model the creation of bulk airflow across the structure, coupled to thermal dynamic simulation in the mix of EnergyPlus and DesignBuilder software [83].
The CFD used streams for the internal building and also outer building streams. DesignBuilder is a front-end application for simulation engine EnergyPlus, which has been combined with the bulk airflow module for zonal wind current forecasts, where the outside stream modeling (CFD) can give profitable extra data to the wind design, giving a particular measure to Pressure Coefficient (Cp) qualities, to enhance it [84].
The main advantage of CFD simulation is that it is not restricted by any particular urban section geometry or difficulty and can produce wind pressure values on each window in space. Therefore, the wind pressure is an important boundary condition for a wide range of models, from building component air, heat, and moisture that is used in energy simulation for construction software [85]. To calculate the wind pressure on the building envelope, it can be expressed by Cp, which is calculated from Equation (6).
C p = P x P 0 / P d ,   P d = ρ . U 2 h / 2 ,
where Px is the static pressure at a specified point on the building facade, P0 is the static reference pressure, Pd is the dynamic pressure, ρ is the air density (kg/m3), and Uh is wind speed, which is sometimes taken in the upstream undisturbed flow (m/s) at building height h. The coefficient wind pressure is used when the natural ventilation model option is selected as ‘Calculated’, so, the EP uses Cp to calculate the wind-induced pressure during simulations on each surface. DesignBuilder is provided with a database of wind pressure coefficients using the data from the Air Infiltration and Ventilation Center (AIVC) Applications Guide: A guide to energy-efficient ventilation. The Cp data are only calculated for buildings of three stories or less [86], for three levels of site exposure, and with square surfaces. These data are calculated from CFD simulations because the height for the building chosen to study is considered on the third floor, which means it is a building with less than three stories.
It is a standard practice in airflow network tools to demonstrate the impacts of grinding and streaming through substantial openings using a discharge coefficient (Cd), where it is the proportion of the current flow to the ideal flow, as shown in Equation (7).
C d = Q A 2 P / ρ ,
where Cd refers to the discharge coefficient for a specific opening, Q is the flow rate through the opening, A is the area of the opening, ∆P is the pressure difference across the opening, and ρ is the fluid density [86]. For a sharp-edged rectangular window, the discharge coefficient is Cd = 0.6, which is calculated by EnergyPlus, where all simple and detailed doors and windows are utilized, with Cd changing to around 0.5 and 0.6 as it is opened from 0% to 100% [87]. In such lines, the discharge coefficient for constant window openings is a fixed value of 0.6 but differs considerably with the window form in the case of operable windows (sash), the opening area, and the pressure difference across the opening [88]. CFD is a built-in hourly based building energy simulation model [89,90] and zonal airflow model [82] to obtain the more useful outcome and improve the accuracy of these simulations such as in DesignBuilder [91]. Under the CFD boundary, the importing EnergyPlus performance data can be viewed [92].
EnergyPlus is used to generate building simulation, energy reenactment, load figuring, mass parity, and heat adjustment [93]. Additionally, the sun path chart depicted in DesignBuilder can be an exceptionally valuable approach to see the ways taken by the sun as it travels through the sky consistently throughout the year. Figure 6 shows the general configuration visualization of the buildings in each shape, and the sun path which demonstrates the simulation for the sun path on 14th of August for one of the cities as an example. Here, the sun path means the apparent relevant seasonal and hourly positional shifts in the sun’s location as the earth rotates. The relative location of the sun is a major factor in buildings’ heat gain and solar energy systems efficiency.

5.4. Simulation Results

DesignBuilder’s computational approach involves re-throwing the differential conditions into units, defined as a limited volume grid. The condition series is then interpreted as an arrangement of straight arithmetic conditions for each cell within a matrix and the general arrangement of conditions is discussed using an iterative method found in all related programming; then, the buildings are analyzed. When a CFD project is started, a grid is automatically generated for the chosen model domain by recognizing all the included vertices in the model object, then producing key coordinates along the major grid axes from these vertices.
A uniform grid system with 139,392 cells was applied for all the buildings that incorporate 66 cells × 66 cells × 32 cells with a 12.287 maximum aspect ratio, which is a worthy proportion for demonstrating the test of the model. The simulation for the chosen cases was carried out for the 14 August. Figure 7 shows the CFD results for the 14th of August for the seven selected cities, for example. As it is shown in the figure, we took a slice at every point configured in each shape. The slices illustrate the air temperature and air velocity distributions along with the points, that are represented as contours and colored values. The slices revealed the values as low or high using colors; however, each color is linked to a value in the attached table with each graph. The simulation results were utilized as input data for the CFD study. These measurements are characterized to achieve more accurate thermal comfort.
It is important to know that six parameters affect the feeling of thermal comfort inside a domain. Some of these factors are linked to environmental conditions and others are linked to personal conditions. Environmental conditions include air and mean radiant temperature, air velocity, and relative humidity, whereas the personal conditions contain two parameters: clothes, and human activity level [94]. So, in this study we focus on the main factors that affect natural ventilation, which is one of the elements of green buildings; these factors are air temperature and air velocity.

6. Results and Discussion

The simulation results were obtained in summer (hottest time) under the climatic conditions of the study cases. Simulations were carried out under steady-state conditions, and the environment zone wind and hourly temperature data were exported as a result. The simulation shows that wind-induced ventilation is one of the important factors for the regions that have a hot and humid climate rather than other factors. However, the orientation factor has the main impact on the wind ventilation parameter, which affects the resident’s comfort and satisfaction by improving the air change rate within the range of comfortable velocity. The accuracy of the findings from simulations was fairly accurate, so it can be applied for technical purposes in this field, where the values of air velocity are increased, and the values of air temperature are decreased, which can help to enhance thermal comfort, whereas each specific climate zone has its private study and strategy; moreover, the common effect of variations in each factor also needs to be examined. So, finding the most appropriate strategy of building design can help engineers to give more attention to the building design features before implementing their designs.
To discuss the simulator results, we made a benchmark between the changes in the most valuable parameters, which are the air temperature and the air velocity, in each building shape and every climatic region site before the optimization, as shown in Figure 8. The figures indicated that the best case along the scenarios was the circle shape, which achieves the best conditions related to thermal comfort (the lowest air temperature and the highest air velocity). The worst case was the hollow square, because it did not achieve a valuable change in the main parameters.
Accordingly, we re-simulated (Re) the best shape (circle) that achieved the best values in air temperature and velocity and the worst shape (hollow square) for all seven climatic regions after applying the optimization parameters (building orientation, air temperature, and air velocity), to obtain the findings of the difference between the temperature and air velocity for all the different cities. These differences play an important role in achieving thermal comfort, as shown in Figure 9. That represents the comparison between before and after optimization for the best case (circle shape), which shows that there is a significant difference between the temperature and air velocity in the different cities. From the same Figure 9a, we noticed a significant difference in the air temperature, especially in Alexandria city, where at points P10, P11, and P12, the temperature values are improved by decreasing about 3.1%, 3.2%, and 3.1%, respectively, where the 3.1% reduction is an acceptable value according to some references [95,96]. From Figure 9b, we inspect a high noticed achievement difference in measuring the air velocity that appeared in Alexandria city also, where at points P10, P11, and P12, the air velocity values are improved by increasing by about 466.7%, 122.2%, and 200%, respectively. Additionally, it is noticed that all the cities increased, where El Minia, Assiut, and Baheira increased by 50%, Ismailia, and Aswan by 200%, and Cairo increased by 400%. These percentage values come from the main difference between the simulation results measurements before and after applying the optimization simulator in each case.
In the same analysis, Figure 10 shows the comparison between before and after optimization for the worst case (hollow square), which indicates the differences appeared in the temperature and air velocity for the measured points before and after applying the best parameter on the optimization step towards achieving the thermal comfort. In Figure 10a, we noticed that the higher reduction in temperature appeared in Ismailia city by 5.1%, while it was reduced in the other cities by approximately 2.6%. Additionally, Figure 10b shows a noticeable improvement in the air velocity in Aswan city which increased by 200%, while in Ismailia, El Minia, and Assiut, it increased by 50%.
The previous results, which indicated that the circle shape as the best shape, have an important role in achieving thermal comfort through decreasing the air temperature and increasing the air velocity. So, we can suggest that the curved ends (nearly a circle) in the buildings play an important role in the designing step, which can enhance thermal comfort. Additionally, we can form the building shape inside a circle unreal frame, which can enhance the temperature and let the wind speed stream the building easily.

7. Conclusions and Future Work

In this article, the coupling of the green building configurations, natural ventilation, and sustainable design for the four suggested shapes (rectangle, hollow square, U-shaped, circle) buildings in hot–arid summer areas were studied. The shapes were compared against the influence of orientation, temperature, and air velocity to identify the suitable model for the urban geometry concerning the environmental vision in an important national residential building.
The results quantitatively indicated that there is a relation between the geometry’s shape and thermal comfort achievement. It can be said that sustainable design can improve the thermal comfort of indoor residential spaces. Thermal comfort is a tradeoff between different design factors to achieve a target level of comfort, which varies according to the climatic design of indoor spaces.
The analysis of the study can relatively improve the thermal comfort conditions of a dry–hot climate. Our study achieved a decrease in the air temperature by about 3.2% and an increase in the air velocity within the study domain by 200% in the case of the best and the worst case of the different chosen shapes (circle, hollow square), consequently. Where the results of the study gave evidence that the configuration of buildings and the direction of the wind are very important factors in determining the natural ventilation induced within domains.
Additionally, this study is considered as a step forward regarding achieving thermal comfort; however, there are many suggested future works. One of the suggested future works is changing the measured parameters, then comparing the results of this paper with the new one to obtain the most affected parameters. Secondly, the same methodology can be examined using another technique to obtain the most appropriate one towards thermal comfort. Additionally, applying the same methodology to other similar climatic regions and conducting a benchmarking between the different regions, particularly in the Minia region, is another suggested study. Finally, the study suggests considering the impact of outdoor climate conditions to enhance or achieve thermal comfort by obtaining the relation between indoor and outdoor conditions.

Author Contributions

Conceptualization, G.E.; methodology, G.E.; software, G.E.; validation, G.E.; data curation, A.M.N.; writing—original draft preparation, G.E.; writing—review and editing, S.V., M.Z. and A.M.N.; supervision, A.M.N. All authors have read and agreed to the published version of the manuscript.

Funding

This study was financially supported by the Grant Agency of Slovak Republic to support projects No 1/0512/20 and 1/0308/20.

Institutional Review Board Statement

Not applicable.

Informed Consent Statement

Not applicable.

Data Availability Statement

Not applicable.

Conflicts of Interest

The authors declare no conflict of interest.

References

  1. Aram, M.; Abessi, O. Optimal design of green buildings using computational fluid dynamics and climate simulation tools. Int. J. Environ. Sci. Technol. 2020, 17, 917–932. [Google Scholar] [CrossRef]
  2. ASHRAE. Available online: www.ashrae.org (accessed on 1 July 2021).
  3. Höppe, P. The physiological equivalent temperature—A universal index for the biometeorological assessment of the thermal environment. Int. J. Biometeorol. 1999, 43, 71–75. [Google Scholar] [CrossRef]
  4. Matzarakis, A.; Mayer, H.; Iziomon, M. Applications of a universal thermal index: Physiological equivalent temperature. Int. J. Biometeorol. 1999, 43, 76–84. [Google Scholar] [CrossRef] [PubMed]
  5. Parsons, K. Environmental ergonomics: A review of principles, methods and models. Appl. Ergon. 2000, 31, 581–594. [Google Scholar] [CrossRef]
  6. Georgakis, C.; Zoras, S.; Santamouris, M. Studying the effect of “cool” coatings in street urban canyons and its potential as a heat island mitigation technique. Sustain. Cities Soc. 2014, 13, 20–31. [Google Scholar] [CrossRef]
  7. Santamouris, M. Energy and Climate in the Urban Built Environment; Routledge, Taylor and Francis Group: Oxfordshire, UK, 2001; ISBN 9780367578824. [Google Scholar]
  8. Ridha, S. Urban Heat Island Mitigation Strategies in an Arid Climate. In Outdoor Thermal Comfort Reachable. Ph.D. Thesis, INSA de Toulouse, Toulouse, France, April 2017. [Google Scholar]
  9. Nakicenovic, N.; Swart, R. Emissions Scenarios—Special Report of the Intergovernmental Panel on Climate Change; Press Syndicate of the University of Cambridge: Cambridge, UK, 2000. [Google Scholar]
  10. Srisamranrungruang, T.; Hiyama, K. Balancing of natural ventilation, daylight, thermal effect for a building with double-skin perforated facade (DSPF). Energy Build. 2020, 210, 109765. [Google Scholar] [CrossRef]
  11. Gielen, D. Energy Technology Perspectives; International Energy Agency: Paris, France, 2008. [Google Scholar]
  12. Efficiency, E. Definition of ZEB and Future Measures Proposed by the ZEB Roadmap Examination Committee; Technical Report; Conservation Division Agency for Natural Resources and Energy, Ministry of Economy, Trade, and Industry: Tokyo, Japan, 2015. [Google Scholar]
  13. Athalye, R.; Taylor, T.; Liu, B. Impact of ASHRAE standard 169-2013 on building energy codes and energy efficiency. Proc. SimBuild 2016, 6, 431–438. [Google Scholar]
  14. Etheridge, D. A perspective on fifty years of natural ventilation research. Build. Environ. 2015, 91, 51–60. [Google Scholar] [CrossRef]
  15. Anderson, K.T. Theoretical considerations on natural ventilation by thermal buoyancy. ASHRAE Trans. 1995, 101, 1103–1117. [Google Scholar]
  16. Etheridge, D.; Sandberg, M. Building Ventilation: Theory and Measurement; John Wiley and Son: Essex, UK, 1996. [Google Scholar]
  17. Swami, M.V.; Chandra, S. Correlation for pressure distribution on buildings and calculation of natural ventilation airflow. ASHRAE Trans. 1987, 93, 243–265. [Google Scholar]
  18. Liddament, M.W. A Guide to Energy Efficient Ventilation; AIVC: Coventry, UK, 1996. [Google Scholar]
  19. Yang, F.; Lau, S.S.; Qian, F. Thermal comfort effects of urban design strategies in high-rise urban environments in a sub-tropical climate. Arch. Sci. Rev. 2011, 54, 285–304. [Google Scholar] [CrossRef]
  20. Taleghani, M.; Kleerekoper, L.; Tenpierik, M.; Dobbelsteen, A.V.D. Outdoor thermal comfort within five different urban forms in the Netherlands. Build. Environ. 2015, 83, 65–78. [Google Scholar] [CrossRef]
  21. Srivanit, M.; Hokao, K. Evaluating the cooling effects of greening for improving the outdoor thermal environment at an institutional campus in the summer. Build. Environ. 2013, 66, 158–172. [Google Scholar] [CrossRef]
  22. Ratti, C.; Raydan, D.; Steemers, K. Building form and environmental performance: Archetypes, analysis and an arid climate. Energy Build. 2003, 35, 49–59. [Google Scholar] [CrossRef]
  23. Bernard, J.; Bocher, E.; Petit, G.; Palominos, S. Sky view factor calculation in urban context: Computational performance and accuracy analysis of two open and free gis tools. Climate 2018, 6, 60. [Google Scholar] [CrossRef] [Green Version]
  24. Ying, X.; Li, W. Effect of floor shape optimization on energy consumption for u-shaped office buildings in the hot-summer and cold-winter area of China. Sustainability 2020, 12, 2079. [Google Scholar] [CrossRef] [Green Version]
  25. Carlo, R.; Nick, B.; Koen, S. Energy consumption and urban texture. Energy Build. 2005, 37, 762–776. [Google Scholar]
  26. Koen, S. Energy, and the city: Density, buildings, and transport. Energy Build. 2003, 35, 3–14. [Google Scholar]
  27. Li, H.; Wang, S.; Cheung, H. Sensitivity analysis of design parameters and optimal design for zero/low energy buildings in subtropical regions. Appl. Energy 2018, 228, 1280–1291. [Google Scholar] [CrossRef]
  28. Zhou, C.; Wang, Z.; Chen, Q.; Jiang, Y.; Pei, J. Design optimization and field demonstration of natural ventilation for high-rise residential buildings. Energy Build. 2014, 82, 457–465. [Google Scholar] [CrossRef]
  29. Yu, C.K.; Li, M.; Chan, V.; Lai, A.C.; Lai, C.K.A. Influence of mechanical ventilation system on indoor carbon dioxide and particulate matter concentration. Build. Environ. 2014, 76, 73–80. [Google Scholar] [CrossRef]
  30. Liu, L.; Wang, L.; Zhang, Y.; Dong, B.; Song, B. Study on ventilation rates at university dormitories in winter. Procedia Eng. 2015, 121, 743–748. [Google Scholar] [CrossRef] [Green Version]
  31. Zhang, W.; Wang, L.; Ji, Z.; Ma, L.; Hui, Y. Test on ventilation rates of dormitories and offices in university by the CO2 tracer gas method. Procedia Eng. 2015, 121, 662–666. [Google Scholar] [CrossRef] [Green Version]
  32. Hu, K.; Chen, Q. Ventilation optimization for reduction of indoor semi-volatile organic compound concentration based on the variational principle. Build. Environ. 2015, 94, 676–682. [Google Scholar] [CrossRef]
  33. Gratia, E.; Herde, A. Natural cooling strategies efficiency in an office building with a double-skin façade. Energy Build. 2004, 36, 1139–1152. [Google Scholar] [CrossRef]
  34. Schulze, T.; Eicker, U. Controlled natural ventilation for energy efficient buildings. Energy Build. 2013, 56, 221–232. [Google Scholar] [CrossRef]
  35. Chen, Q. Using computational tools to factor wind into architectural environment design. Energy Build. 2004, 36, 1197–1209. [Google Scholar] [CrossRef]
  36. Seifert, J.; Li, Y.; Axley, J.; Rösler, M. Calculation of wind-driven cross ventilation in buildings with large openings. J. Wind Eng. Ind. Aerodyn. 2006, 94, 925–947. [Google Scholar] [CrossRef]
  37. Hu, C.; Ohba, M.; Yoshie, R. CFD modeling of unsteady cross-ventilation flows using LES. J. Wind Eng. Ind. Aerodyn. 2008, 96, 1692–1706. [Google Scholar] [CrossRef]
  38. Weiming, W.; Hugues, R.; Radu, Z. Floor shape optimization for green building design. Adv. Eng. Inform. 2006, 20, 363–378. [Google Scholar]
  39. Stelios, C.Z.; Christos, A.T. The role of building form in energy consumption: The case of a prismatic building in Athens. Energy Build. 2012, 48, 97–102. [Google Scholar]
  40. Kovac, M.; Vojtuš, J. Analysis of air velocity, moisture and thermal regime in an air gap of a double-shell roof. Energy Procedia 2015, 78, 759–764. [Google Scholar] [CrossRef] [Green Version]
  41. Kovac, M.; Kovacova, K. CFD Simulation of Air Temperature stratification in historical building of theatre. In Proceedings of the 19th International Multidisciplinary Scientific Geoconference, SGEM 2019, Albena, Bulgaria, 30 June–6 July 2019; Volume 19, pp. 411–416. [Google Scholar]
  42. Short, C.A.; Li, B.; Shahrestani, M. Climate responsive solutions to heating and cooling of buildings. J. Build. Eng. 2018, 15, 289. [Google Scholar] [CrossRef]
  43. Morsy, A.A.E.; Emam, M.A.M. Towards a better performance in office buildings by integrating natural elements. J. Eng. Sci. Assiut Univ. J. Eng. Sci. 2019, 47, 389–404. [Google Scholar] [CrossRef]
  44. Peng, L.L.C. A review of performance-oriented architectural design and optimization in the context of sustainability: Dividends and challenges. Sustainability 2020, 12, 1427. [Google Scholar]
  45. Yi, Y.K.; Malkawi, A.M. Optimizing building form for energy performance based on hierarchical geometry relation. Autom. Constr. 2009, 18, 825–833. [Google Scholar] [CrossRef]
  46. Jin, J.-T.; Jeong, J.-W. Optimization of a free-form building shape to minimize external thermal load using genetic algorithm. Energy Build. 2014, 85, 473–482. [Google Scholar] [CrossRef]
  47. Gao, C.; Lee, W.L. Evaluating the influence of openings configuration on natural ventilation performance of residential units in Hong Kong. Build. Environ. 2011, 46, 961–969. [Google Scholar] [CrossRef]
  48. Guo, W.; Liu, X.; Yuan, X. A case study on optimization of building design based on CFD simulation technology of wind environment. Procedia Eng. 2015, 121, 225–231. [Google Scholar] [CrossRef] [Green Version]
  49. Hatamipour, M.; Abedi, A. Passive cooling systems in buildings: Some useful experiences from ancient architecture for natural cooling in a hot and humid region. Energy Convers. Manag. 2008, 49, 2317–2323. [Google Scholar] [CrossRef]
  50. Jamaludin, A.A.; Hussein, H.; Ariffin, A.R.M.; Keumala, N. A study on different natural ventilation approaches at a residential college building with the internal courtyard arrangement. Energy Build. 2014, 72, 340–352. [Google Scholar] [CrossRef]
  51. Elshafei, G.; Negm, A.; Bady, M.; Suzuki, M.; Ibrahim, M. Numerical and experimental investigations of the impacts of window parameters on indoor natural ventilation in a residential building. Energy Build. 2017, 141, 321–332. [Google Scholar] [CrossRef]
  52. Nundy, S.; Mesloub, A.; Alsolami, B.M.; Ghosh, A. Electrically actuated visible and near-infrared regulating switchable smart window for energy positive building: A review. J. Clean. Prod. 2021, 301, 126854. [Google Scholar] [CrossRef]
  53. Ghosh, A.; Mesloub, A.; Touahmia, M.; Ajmi, M. Visual comfort analysis of semi-transparent perovskite-based building integrated photovoltaic window for hot desert climate (Riyadh, Saudi Arabia). Energies 2021, 14, 1043. [Google Scholar] [CrossRef]
  54. Weather Data by Region. Available online: https://energyplus.net/weather-region/africa_wmo_region_1/EGY (accessed on 1 March 2021).
  55. Mahmoud, A. An analysis of bioclimatic zones and implications for design of outdoor built environments in Egypt. Build. Environ. 2011, 46, 605–620. [Google Scholar] [CrossRef]
  56. Mahmoud, H.; Ghanem, H. Urban geometry mitigation guidelines to improve outdoor thermal performance in Egyptian hot arid new cities. J. Eng. Sci. Assiut Univ. Fac. Eng. 2019, 47, 172–193. [Google Scholar] [CrossRef]
  57. The Climate of Egypt. Available online: https://en.wikipedia.org/wiki/Climate_of_Egypt (accessed on 1 August 2021).
  58. Average Weather in Cairo. Available online: https://www.weatherbase.com/gr/koppen.png (accessed on 1 August 2021).
  59. Kottek, M.; Grieser, J.; Beck, C.; Rudolf, B.; Rubel, J. World map of the Köppen-Geiger climate classification updated. Meteorol. Z. 2006, 15, 259–263. [Google Scholar] [CrossRef]
  60. Sayed, Y.H.A. An analysis of thermal comfort for indoor environment of the new assiut housing in Egypt. World Acad. Sci. Eng. Technol. 2014, 7, 381–387. [Google Scholar]
  61. Regional Units of Egypt. Available online: https://en.wikipedia.org/wiki/Regional_units_of_Egypt (accessed on 1 June 2021).
  62. Elmohsen, M.A. Natural Ventilation Techniques as a Base for Environmental Passive Architecture with Special Reference to Residential Buildings in Greater Cairo. Ph.D. Thesis, Ain Shams University, Cairo, Egypt, 2012. [Google Scholar]
  63. Robaa, S. Evaluation of sunshine duration from cloud data in Egypt. Energy 2008, 33, 785–795. [Google Scholar] [CrossRef]
  64. Wodu, D.P.; Nwagbara, M.O.; Weli, V.E. Relationships between outdoor and indoor temperature characteristics in Yenagoa, Nigeria. J. Geogr. Reg. Plan. 2020, 13, 54–62. [Google Scholar] [CrossRef]
  65. Ali-toudert, F.; Mayer, H. Effects of asymmetry, galleries, overhanging facades and vegetation on thermal comfort in urban street canyons. Sol. Energy 2007, 81, 742–754. [Google Scholar] [CrossRef]
  66. Hassaan, A.; Mahmoud, A. Analysis of the microclimatic and human comfort conditions in an urban park in hot and arid regions. Build. Environ. 2011, 46, 2641–2656. [Google Scholar]
  67. Good, J.; Frisque, A.; Phillips, D. The Role of Wind in Natural Ventilation Simulations Using Airflow Network Models, 3rd ed.; National Conference of IBPSA-USA: Berkeley, CA, USA, 2008. [Google Scholar]
  68. De Michele, G. Coupling energy and daylighting simulation for complex fenestration systems. In Proceedings of the 13th International Radiance Workshop, London, UK, 1–3 September 2014. [Google Scholar]
  69. Kheiri, F. A review on optimization methods applied in energy-efficient building geometry and envelope design. Renew. Sustain. Energy Rev. 2018, 92, 897–920. [Google Scholar] [CrossRef]
  70. Han, T.; Huang, Q.; Zhang, A.; Zhang, Q. Simulation-based decision support tools in the early design stages of a green building—A review. Sustainability 2018, 10, 3696. [Google Scholar] [CrossRef] [Green Version]
  71. Mundt, E.; Mathisen, H.M.; Nielsen, P.V.; Moser, A. Guidebook No. 02: Ventilation Effectiveness; Federation of European Heating and Air-Conditioning Associations (REHVA): Helsinki, Finland, 2004. [Google Scholar]
  72. Meiss, A.; Feijó-Muñoz, J. Influencia de la ubicación de las aberturas en la eficiencia de la ventilación en viviendas. Inf. Constr. 2011, 63, 53–60. [Google Scholar] [CrossRef]
  73. Taleghani, M.; Sailor, D.; Ban-Weiss, G.A. Micrometeorological simulations to predict the impacts of heat mitigation strategies on pedestrian thermal comfort in a Los Angeles neighborhood. Environ. Res. Lett. 2016, 11, 024003. [Google Scholar] [CrossRef]
  74. ASHRAE Standard 55-2010. In Thermal Environmental Conditions for Human Occupancy; American Society of Heating, Refrigerating and Air-Conditioning Engineers: Atlanta, GA, USA, 2010.
  75. ASHRAE Standard 55-2004. In Thermal Environmental Conditions for Human Occupancy; American Society of Heating, Refrigerating and Air-Conditioning Engineers: Atlanta, GA, USA, 2004.
  76. Bady, M.; Kato, S.; Huang, H. Towards the application of indoor ventilation efficiency indices to evaluate the air quality of urban areas. Build. Environ. 2008, 43, 1991–2004. [Google Scholar] [CrossRef]
  77. Ji, Y.; Cook, M.J. Numerical studies of displacement natural ventilation in multi-story buildings connected an atrium. Build. Serv. Eng. Res. Technol. 2007, 28, 207–222. [Google Scholar] [CrossRef]
  78. Wang, X.; Huang, C.; Cao, W. Mathematical modeling and experimental study on vertical temperature distribution of hybrid ventilation in an atrium building. Energy Build. 2009, 41, 907–914. [Google Scholar] [CrossRef]
  79. Chien, C.H.; Lin, H.T.; Chou, J.H.; Su, T.C. Buoyancy ventilation efficiency analysis of a conference hall. Appl. Mech. Mater. 2011, 71–78, 2442–2446. [Google Scholar] [CrossRef]
  80. Mahmoud, H. Effect of urban form on outdoor thermal comfort of governmental residential buildings: New aswan as a case study, Egypt. J. Eng. Sci. Assiut Univ. Fac. Eng. 2019, 47, 309–325. [Google Scholar] [CrossRef]
  81. Gupta, V. Thermal efficiency of building clusters: An index for non-airconditioned buildings in hot climates. In Energy and Urban Built Form; School of Planning and Architecture: New Delhi, India, 1987; pp. 133–145. [Google Scholar] [CrossRef]
  82. DesignBuilder. Available online: http://www.designbuilder.co.uk (accessed on 10 January 2013).
  83. Cóstola, D.; Blocken, B.; Hensen, J. Overview of pressure coefficient data in building energy simulation and airflow network programs. Build. Environ. 2009, 44, 2027–2036. [Google Scholar] [CrossRef] [Green Version]
  84. Prajongsan, P.; Sharples, S. Enhancing natural ventilation, thermal comfort and energy savings in high-rise residential buildings in Bangkok through the use of ventilation shafts. Build. Environ. 2012, 50, 104–113. [Google Scholar] [CrossRef]
  85. Heiselberg, P.; Svidt, K.; Nielsen, P.V. Characteristics of airflow from open windows. Build. Environ. 2001, 36, 859–869. [Google Scholar] [CrossRef]
  86. Iqbal, A. Discharge coefficient of center-pivot roof windows. Build Environ. 2015, 92, 635–643. [Google Scholar] [CrossRef]
  87. Djunaedy, E. External Coupling between Building Energy Simulation and Computational Fluid Dynamics. Ph.D. Thesis, Technische Universiteit, Eindhoven, The Netherlands, 2005. [Google Scholar]
  88. Zhai, Z.J.; Chen, Q.Y. Performance of coupled building energy and CFD simulations. Energy Build. 2005, 37, 333–344. [Google Scholar] [CrossRef]
  89. Wang, L.; Chen, Q. Validation of a coupled multizone-CFD program for building airflow and contaminant transport simulations. HVAC&R Res. 2007, 13, 267–281. [Google Scholar] [CrossRef]
  90. DesignBuilder. Design Builder Simulation, and CFD Training Guide; DesignBuilder Software Ltd.: London, UK, 2009. [Google Scholar]
  91. Fumo, N.; Mago, P.; Luck, R. Methodology to estimate building energy consumption using energy plus benchmark models. Energy Build. 2010, 42, 2331–2337. [Google Scholar] [CrossRef]
  92. Honjo, T. Thermal comfort in outdoor environment. In Global Environmental Research; AIRIES: Tokyo, Japan, 2009; Volume 13, pp. 43–47. [Google Scholar]
  93. Hatem, H.M.; Karram, M.A. Integrating layout geometry with architectural requirements to achieve energy-efficient office buildings in Egypt. In ASHRAE Topical Conference Proceedings; American Society of Heating, Refrigeration and Air Conditioning Engineers, Inc.: Chicago, IL, USA, 2020; pp. 610–617. [Google Scholar]
  94. Moustafa, W.S.; Abdelrahman, M.M.; Hegazy, I.R. Building performance assessment of user behavior as a post occupancy evaluation indicator: Case study on youth housing in Egypt. In Building Simulation; Tsinghua University Press: Beijing, China, 2018; Volume 11, pp. 389–403. [Google Scholar]
  95. Makvandi, M.; Zhou, X.; Li, C.; Deng, Q. A field investigation on adaptive thermal comfort in an urban environment considering individuals’ psychological and physiological behaviors in a cold-winter of Wuhan. Sustainability 2021, 13, 678. [Google Scholar] [CrossRef]
  96. Reda, I.; Raouf, N.; AbdelMessih, M.S.; Ehab, M.M. Quantifying fenestration effect on thermal comfort in naturally ventilated classrooms. Sustainability 2021, 13, 7385. [Google Scholar] [CrossRef]
Figure 1. Suggested optimization methodology.
Sustainability 13 09570 g001
Figure 2. The different shapes chosen for simulation and their dimensions: (a) rectangle shape, (b) hollow square shape, (c) U-shaped building, (d) circle building.
Sustainability 13 09570 g002aSustainability 13 09570 g002b
Figure 3. The classification of climatic regions in Egypt [64].
Sustainability 13 09570 g003
Figure 4. The relation between the outdoor indoor (a) temperature and (b) air velocity in the different climatic zones.
Sustainability 13 09570 g004
Figure 5. The points for slices in every shape: (a) rectangle shape, (b) hollow square shape, (c) u-shaped building, (d) circle building.
Sustainability 13 09570 g005
Figure 6. The different shapes of the building’s visualization and sun path: (a) sun path of rectangle shape, (b) sun path of hollow square shape, (c) sun path of U-shaped building, (d) sun path of circle building.
Sustainability 13 09570 g006
Figure 7. Typical CFD results slices for the 14 August in different cities for the different four selected shapes: (a) rectangle shape, (b) hollow square shape, (c) U-shape building, (d) circle building.
Sustainability 13 09570 g007
Figure 8. The comparison between the temperature and air velocity for the four selected geometries in the seven selected cities before optimization (a) temperature—before, (b) air velocity—before.
Sustainability 13 09570 g008
Figure 9. Comparison between before and after optimization for the best case (circle) in the seven different climatic cities: (a) temperature, (b) air velocity.
Sustainability 13 09570 g009
Figure 10. Comparison between before and after optimization for the worst case (hollow square) in the seven different climatic cities: (a) temperature, (b) air velocity.
Sustainability 13 09570 g010
Table 1. The seven climatic suggested regions.
The Climatic RegionGovernoratesCase StudyCase Study Architectural Features Climatic Feature
LongitudesLatitudes
Cairo Cairo, Giza, Qalyubia Cairo31.233334″ E30.033333″ Nhot desert climate
AlexandriaAlexandria, Matruh Alexandria29.924526″ E31.205753″ Nhot desert climate
DeltaDamietta, Monufia, Beheira, Gharbia, Kafr El Sheikh, DakahliaBeheira30°10′27″ E30°54′36″ Ndesert climate
CanalSharqia, PortSaid, Ismailia, Suez, North Sinai, South SinaiIsmailia32°16′20″ E30°36′15″ Ndesert climate
North upper EgyptEl Minia, Faiyum, Beni Suef El Minia30°45′1.08″ E28°6′35.57″ Ndesert climate
AssiutAssiut, New Valley Assiut31.189283"E27.180134″ Ndesert climate
Upper EgyptSohag, Qena, Luxor, Aswan, Red Sea Aswan32°40″ E24°11″ Nhot–arid climate
Table 2. The maximum and minimum features of our climatic study regions.
CityMaxMinThe Driest Month Critical
Months
Temp. °CHumid %Air Vel.Temp. °CHumid %Air Vel.
CairoJune
34.8
May
43
June
4.2
January
7
August
60
August
3.4
August is the driest month.August, June
AlexandriaAugust
30.8
August
70
July
4.2
January
17.9
April
65
August
3.4
August is the driest month.August
IsmailiaAugust
34
August
61
June
4.2
January
9
May
48
August
3.4
August is the driest month.August
El-Minia July
36.6
January
52
August
4.2
January
19.4
May
25
January
3.4
January is the driest month.August, July
AswanJuly
45.2
December
42
March
5
January
23.9
June
18
July
4
July is the driest month.August, July
AssiutJune
37.2
January
52
June
4.2
January
20.4
May
25
January
3.4
January is the driest month.August, June
BeheiraAugust
33
August
50
March
7
January
19
June
13
June
3.3
January is the driest month.August
Table 3. CFD simulation parameters with the applied boundary conditions.
Turbulence ModelThe Standard k-ε Model
Differential schemesConvection term: Second-order upwind Diffusion term: Central difference scheme Concentration: First order upwind scheme
Inflow conditions u = 1   m / s θ = 37 °
k = 1.5 u × I 2 ,   ε = C μ 1 / 2 × k × u z
Sides and skyFree slip
Walls and ground Generalized logarithmic law
Start date 14 August 2020
Period One hour
Initial air temp. at 12:00 p.m.Differ according to the case—range from 16.88 up to 17.79
Publisher’s Note: MDPI stays neutral with regard to jurisdictional claims in published maps and institutional affiliations.

