Article

Evaluation of Cowpea (Vigna unguiculata) in an Intercropping System as Pollinator Enhancer for Increased Crop Yield

Department of Natural Resources and Environmental Design, North Carolina A&T State University, Greensboro, NC 27411, USA
*
Author to whom correspondence should be addressed.
Sustainability 2021, 13(17), 9612; https://doi.org/10.3390/su13179612
Submission received: 3 August 2021 / Revised: 20 August 2021 / Accepted: 23 August 2021 / Published: 26 August 2021

Abstract

:
Production of pollinator-dependent crops (PDCs) is increasing. However, pollinators are declining partly due to loss of floral resources. There is urgency to mitigate this decline and the potential risks to the production of PDCs and food security. One way is by promoting farming systems that enhance flower-rich habitats. In a two-year study, Pinkeye Purple Hull and Whippoorwill cowpea varieties attractive to pollinators were intercropped with three PDCs (squash, okra, and watermelon). We evaluated whether cowpea intercrop increases the abundance and diversity of pollinators, other beneficial insects, and crop yield, and decreases the abundance of the brown marmorated stink bug (BMSB). Diverse pollinators were recorded in both years for a total of 80,379, representing seven pollinator families (Andrenidae, Apidae, Crabronidae, Formicidae, Halictidae, Tachinidae, and Vespidae) captured in pan traps, six families (Apidae, Crabronidae, Halictidae, Pyralidae, Tachinidae, and Vespidae) from sticky traps, and five pollinator types (bumble bees, carpenter bees, honeybees, butterflies and moths, and wasps) through direct visual count. Pollinator abundance and diversity was highest on the cowpea-intercropped treatments than controls. PDCs intercropped with cowpea recorded more beneficial insects than BMSB. Okra, squash, and watermelon intercrops produced 7%, 27%, and 54% more fruits than the control, respectively. Our findings indicate that intercropping cowpeas with PDCs attracted more and diverse pollinators and resulted in increased crop yield. However, to optimize pollination, factors such as planting dates to synchronize the flowering of both cowpeas and PDCs should be taken into consideration.

1. Introduction

Insect pollinators are an important component of biodiversity that provides ecosystem services, including the pollination of many crops. Pollination mediated by insects provides essential support for food security and ecosystem sustainability. Globally, about 90% of flowering plants that produce seeds require insect pollination [1], and about 35% of the human diet is dependent on insect pollination [2]. However, the abundance and diversity of bees and other pollinating insects have been on a decline [3]. The loss of floral resources and other factors including agricultural intensification, spread of pathogens, climate change, landscape modification, non-native species invasion, and the widespread use of pesticides [3] have contributed to this decline to some extent. This has led to an increased reliance on managed species, most often honeybees, to mediate pollination services despite recorded low yields in some cases [4].
Specific plant species provide unique seasonal pattern in the amount, diversity, and composition of floral resources, which together create phenological complementary forage resources for pollinators [5,6,7]. A review of previous studies indicated that plant diversity in and around crop fields improved habitat for bees as well as other beneficial insects [8]. In this mutualistic relationship, pollinators receive nectar and pollen, which provides them with carbohydrates, proteins, fats, vitamins, and minerals [9], and in return plants receive the service of pollination. In recent years, there has been a rise in the production of pollinator-dependent crops (PDCs) which include many vegetables such as squash, pumpkin, cucumber, watermelon, and okra [1,10]. Unfortunately, honeybees, which are the most important insect pollinators worldwide, as well as some native bee species, are on the decline. This raises concerns about the production of pollinator-dependent crops. Research has shown that the diverse assemblage of insect pollinators as a result of the provision of floral resources promotes pollination and crop yield [7,9,11]. For example, flower strips [12,13,14], intercropping with flowering plants [15], and hedgerows [16] increased pollinator abundance in crop fields.
Cowpea (Vigna unguiculata L. Walp) has been recognized for its nectariferous nature and its role in attracting pollinators [17,18,19,20]. The plant has extrafloral nectaries on its petioles and leaflets that are nectar-releasing sites, which attract beneficial insects, including pollinators. Cowpea is widely grown in the tropics and subtropical regions as an intercrop [21] to enhance soil fertility through its ability to fix atmospheric nitrogen. It is consumed as a major source of protein; the leaves contain about 34.9% protein and the seeds about 25% protein [22,23]. In the United States, cowpea is grown widely in California, Texas, and in the southern states, mainly for frozen, canned, and fresh peas [24,25]. The brown marmorated stink bug (BMSB), Halyomorpha halys (Heteroptera: Pentatomidae), has emerged as a serious pest of many crops [26], including cowpea [27,28]. According to [26], H. halys causes millions of dollars’ worth of economic loss to fruits and vegetables annually. Currently, pesticides are the main strategy for the management of H. halys. Considering the dangers of frequent pesticide use to humans and the environment, there is a need to investigate other environmentally friendly strategies.
Intercropping is an important cultural practice based on the principle of reducing insect pests, increasing diversity in an ecosystem, and increasing crop yield. However, there are inconsistent reports on crop yield associated with intercropping. For example, cowpea intercropped with corn [29], maize-cassava [30], and okra [31,32] resulted in increased crop yield compared to sole cropping. On the other hand, intercropping cowpea with tomato and okra resulted in a 45–55% loss in marketable fruit yields in both vegetables [33,34]. Most often, the ability of cowpea to fix atmospheric nitrogen and its contribution to the replenishment of soil fertility has been associated with the increase in crop yield [35]. Several factors, including pollinators in the cropping system, may also play a crucial role in the yield outcome. It is therefore important to assess the contribution of pollinators in an intercropping system on crop yield. In this study, two cowpea varieties (Pinkeye Purple Hull and Whippoorwill) reported to be highly attractive to diverse pollinators [19] were intercropped with three pollinator-dependent crops (squash, okra, and watermelon), including controls (PDCs with no cowpeas and sole cowpea). We determined the effect of cowpea intercrop on the abundance and diversity of pollinators and other beneficial insects, H. halys, and crop yield.

2. Materials and Methods

2.1. Study Site and Experimental Plants

The study was conducted at the North Carolina Agricultural and Technical State University Research Farm in Greensboro, North Carolina, USA (longitude 36.0586243° N and latitude 79.78932° W) during the summers of 2018 and 2019. Three pollinator-dependent crops (PDCs)—squash (Cucurbita pepo L.) [S] (Tempest Yellow Summer variety), okra (Abelmoschus esculentus) [O] (Clemson Spineless variety), and watermelon (Citrullus lanatus) [W] (Little Baby variety in 2018 and Mini Love variety in 2019)—were obtained from Johnny’s Seeds (Winslow, ME, USA). Together, these PDCs are referred to as SOW in this paper. They were selected because they are commonly grown by limited-resource farmers in North Carolina. The PDCs were intercropped with two cowpea varieties: Pinkeye Purple Hull [PPH] procured from Hummert Seed Company (Earth City, MO, USA) and Whippoorwill [WHIP] from Southern Exposure Seed Exchange (Mineral, VA, USA).

2.2. Experimental Design and Setup

In both years, there were three cowpea intercrop treatments (PPH + SOW + PPH, WHIP + SOW + WHIP, and PPHWHIP + SOW + PPHWHIP), two sole cowpea treatments (PPH-only and WHIP-only), and one sole PDC treatment (SOW), for a total of six treatments. The cowpea intercrop treatments comprised six rows of PDCs (two rows of each PDC) bordered on each side by either two rows of PPH or WHIP, or one row each of PPH and WHIP. The sole cowpea treatments comprised five rows each of PPH and WHIP. The sole PDC treatment comprised three rows each of squash, okra, and watermelon without cowpea (control) and was set up 50 m away from the cowpea and cowpea intercrop treatments. The experiments were set up as a randomized complete block design (RCBD) and replicated four times. For each treatment, each row measured 5 m long with 1 m inter-row spacing.
In 2018, all seeds were planted from 1 June to 12 June and according to the 2018 Southeastern Vegetable Handbook [36]. During the season, we observed that cowpea flowered before okra but after squash and watermelon. In 2019, the planting date was staggered for the different species based on the date of flowering recorded in 2018 to synchronize the flowering of PDCs with that of cowpeas. Therefore, okra was planted on 4 June, WHIP on 18 June, PPH on 25 June, watermelon on 12 July, and squash on 19 July. In both years, the seeds were planted by the block manually and the entire experimental setup was mulched with wheat straw (Rankin Farms Inc. Ellerbe, NC, USA). Conventional recommendations of growing vegetables in the Southeast were followed [36]. No insecticides were applied, and plots were irrigated (drip irrigation system) as needed.

2.3. Insect Sampling

Pollinators, including other beneficial insects, and H. halys were sampled on both the PDCs and the cowpeas. Sampling was conducted using direct visual count, sticky traps, and pan traps (blue, white, and yellow).

2.3.1. Insect Sampling Using Direct Visual Counts

Direct visual counts of pollinators and H. halys were carried out by counting the number of pollinator types (bumble bees, carpenter bees, honeybees, butterflies and moths, and wasps) and H. halys was observed on each 5 m row for two minutes. For each treatment, a visual count of pollinators began 37 days after planting (DAP), corresponding to the first incidence of pollinators on the experimental plots weekly between 08:00 to 13:00 for five weeks from 11 July to 8 August 2018, and 17 August to 11 September 2019. Visual counts of H. halys began 46 DAP, the time when H. halys was first observed on the experimental plots, and conducted weekly from 10:00 to 12:00 for five weeks from 20 July to 13 August 2018 and 16 August to 9 September 2019.

2.3.2. Insect Sampling Using Sticky Traps

Double-sided yellow sticky traps (8 × 13 cm2) (Sticky Strips, Olson Products, Medina, OH, USA) were used to monitor smaller pollinators and other beneficial insects that were likely to be missed with visual counts and pan trap sampling. They also provided an additional alternative sampling method. Beginning 34 DAP, weekly sticky trap sampling was conducted from 9 July to 30 July, 2018, and from 12 August to 2 September, 2019. One sticky trap affixed to a metal stake was placed at the center of each row of the cowpea intercrop treatments, the sole PDC treatment, and the inner rows of the sole cowpea treatment for a total of two sticky cards on two rows. Traps were placed just below the canopy height. The traps were removed after 24 h and placed in Ziploc® bags and taken to the Integrated Pest Management (IPM) Laboratory, where the insects were identified using a microscope (AmScope Stereozoom trinocular microscope, SZMT2 Series, WF10X/20; United Scope LLC, Irvine, CA, USA) to the family level.

2.3.3. Insect Sampling Using Pan Traps

Pollinators were sampled within each treatment using three colored (blue, white, and yellow) pan traps. Sampling began 45 DAP with the presence of flower visitors. As described by [33], the traps consisted of 16 oz squat polypropylene deli bowls (BioServ, Frenchtown, NJ, USA) painted with UV-bright fluorescent blue paint (blue trap) or yellow paint (yellow trap) and unpainted 12 oz white Styrofoam bowls (white trap) (Uline, Pleasant Prairie, WI, USA). The trap setup was carried out by gluing individual unpainted 16 oz polypropylene deli bowls onto a 36′′ plant prop and three of these were placed 0.2 m apart between the two rows of the PDC and cowpeas for each treatment for the entire sampling period. One of each of the colored traps was then placed inside each of the unpainted bowls on the prop and filled with approximately 250 mL of soapy water solution [33]. The traps were placed so that they were at the same level as the crop canopy. Traps were set out weekly from 19 July to 16 August 2018, and from 22 August to 19 September 2019, between 08:00 to 10:00 and collected after 24 h. During collection, each pan trap was drained, and the contents transferred to vials containing 70% ethanol and taken to the IPM laboratory, where they were stored in a refrigerator and later identified using a microscope (AmScope Stereozoom trinocular microscope, SZMT2 Series, WF10X/20; United Scope LLC, Irvine, CA, USA) to the family level. The traps were collected in the order they were placed to ensure that all traps were available to insects for approximately equal time.

2.4. Crop Yield Data Collection

At maturity, all crops in each treatment including the control were harvested with the aid of a handheld pruner of 10 cm × 2.5 cm × 27 cm dimensions (Fiskars Bypass Pruner, The Home Depot®, NC, USA). Squash was harvested weekly from 9 July (39 DAP) to 6 August in 2018 and from 26 August (39 DAP) to 23 September in 2019. Okra was harvested weekly from 6 August (67 DAP) to 7 September in 2018 and from 23 August (67 DAP) to 26 September in 2019. Watermelon was harvested once on 30 July (60 DAP) in 2018 due to excessive rainfall that led to the bursting of the fruits and subsequent wilting of the plants, and every two weeks for a total of three times from 11 September (59 DAP) to 9 October in 2019. Twenty-five fresh pods from each of the five-cowpea treatments were randomly harvested from each 5 m row within each treatment on 10 August in 2018 and 5 September in 2019. Harvested fruits were weighed using an Ohaus T51P weighing scale (Pine Brook, NJ, USA) and data were recorded.

2.5. Data Analysis

The diversity of pollinators reported from direct visual counts, sticky traps, and pan traps on the various treatments was assessed using the Shannon–Weaver Diversity Index (H′) [37,38]. For each sampling method, the total number of pollinators in each family or pollinator type captured on each treatment for the entire sampling period was used to calculate the Diversity and Evenness indices.
The index is expressed as:
H′ = − ∑ pi ln(pi)
where H′ = Shannon–Weaver diversity index
  • pi = the proportion of individuals found in species i
  • pi is estimated as pi = ni/N
  • where ni = number of individuals in species i
  • N = total number of individuals in the community
The Shannon Equitability (Evenness) Index (E) normalizes the Shannon Diversity Index (H’) to a value between 0 and 1. It provides an idea about the evenness of the distribution of groups of organisms in a community. An index value of 1 means that all groups have the same frequency.
The Evenness Index (E) is expressed as:
E = H′/log(k)
where E = Evenness,
  • H′ = Shannon–Weaver Diversity Index
  • k = number of species/groups in the community
For each sampling method, the total number of insects belonging to each insect family or pollinator type that was captured throughout the sampling period was obtained.
The mean number of insect pollinators and other beneficial insects, H. halys, and the yield of fresh cowpeas and PDCs within the 5 m row sampling area were analyzed using generalized linear mixed models using PROC GLIMMIX in SAS 9.4 (SAS Institute Inc, Cary, NC) with block as a random effect. Crops, years, transformation, distribution, and use of the repeated measures for each data type are presented in Table S1. The data of the PDCs were sorted by each crop (i.e., squash, okra, and watermelon) using the PROC SORT function. Some of the data were analyzed as repeated measures with an autoregressive order 1 (AR(1)) repeated measures correlation structure. Polled data for all sampling methods and data from both years combined were not analyzed using repeated measures because of the unequal number of sampling weeks (each year sampling using direct visual count and pan trap was done weekly for five weeks compared to four weeks for sampling using sticky traps). For the weekly distribution of pollinators on the cowpeas and PDCs, pollinator counts obtained during the fifth sampling week were eliminated because data were collected only by direct counts and pan traps and not with sticky traps, unlike in the first four weeks where counts were done using all three sampling methods. Pollinator counts obtained during sampling were transformed either by square root or log-transformation or without any transformation to meet the assumptions of normality (Table S1). Some of the data fit well with negative binomial distribution with logit link function (Table S1). The degrees of freedom (df) were assessed using the Kenward–Rogers degrees of freedom approximation. Multiple comparisons of treatments were made comparing the least-squares means (LSM) with a Tukey–Kramer test at a 5% level of significance.
The relationship between the number of pollinators and the yield of each PDC for each treatment was determined using Pearson’s correlation and regression analysis. Data were fitted to the equation:
y = a + bx
where y is the crop yield and x is the number of pollinators.
All the above analyses except the diversity and evenness assessments were performed using SAS 9.4 (SAS Institute Inc., Cary, NC, USA).

3. Results

3.1. Abundance and Diversity of Pollinators Associated with Cowpea Treatments and Controls

Five pollinator types (bumble bees, carpenter bees, honeybees, butterflies and moths, and wasps) were recorded through direct visual counts in both years on all treatments (Table 1). A total of 4476 and 7417 pollinators were recorded on all treatments in 2018 and 2019, respectively. In 2018, the highest number of pollinators (1159) was recorded on PPH + SOW + PPH and the lowest number (364) on SOW (control) (Table 1). The number captured ranged from 364 on the control to 1159 on PPH + SOW + PPH with numbers on PPH + SOW + PPH > PPHWHIP + SOW + PPHWHIP > PPH-only > WHIP + SOW + WHIP > WHIP-only > SOW. Similarly, in 2019, the highest number of pollinators (2242) was recorded on the PPH + SOW + PPH, and the lowest (104) on the control with numbers on PPH + SOW + PPH > PPHWHIP + SOW + PPHWHIP > WHIP + SOW + WHIP > PPH-only > WHIP-only > SOW (Table 1).
From sticky cards, a total of 30,114 and 25,163 pollinators representing six families (Apidae, Crabronidae, Halictidae, Pyralidae, Tachinidae, and Vespidae) were captured on all treatments in 2018 and 2019, respectively (Table 2). In 2018, the number captured ranged from 2980 on the control to 6650 on PPH + SOW + PPH with numbers on PPH + SOW + PPH > PPHWHIP + SOW + PPHWHIP > WHIP + SOW + WHIP > PPH-only > WHIP-only > SOW. Similarly, in 2019, the number of pollinators captured ranged from 1581 on the control to 5706 on PPHWHIP + SOW + PPHWHIP with numbers on PPHWHIP + SOW + PPHWHIP > PPH + SOW + PPH > WHIP + SOW + WHIP > PPH-only > WHIP-only > SOW (Table 2).
A total of 7884 and 5295 insects representing seven pollinator families (Andrenidae, Apidae, Crabronidae, Formicidae, Halictidae, Tachinidae, and Vespidae) were captured in pan traps in all treatments in 2018 and in 2019, respectively (Table 3). In 2018, the number of pollinators captured ranged from 802 on PPH-only to 1789 on WHIP + SOW + WHIP with numbers on WHIP + SOW + WHIP > PPHWHIP + SOW + PPHWHIP > PPH + SOW + PPH > SOW > WHIP-only > PPH-only. In 2019, the number of pollinators ranged from 391 on the control to 1251 on WHIP + SOW + WHIP with numbers on WHIP + SOW + WHIP > PPH + SOW + PPH > PPHWHIP + SOW + PPHWHIP > WHIP-only > PPH-only > SOW.
Diversity and evenness varied among the sampling methods and year. In 2018, insects recorded from visual counts were more diverse and evenly distributed on the five-cowpea treatments than control with the highest diversity (H′ = 1.40) and evenness (E = 0.87) recorded on cowpea PPH-only. However, in 2019, insects were more diverse and evenly distributed in the control (Table 1). Insects from sticky traps were diverse and evenly distributed on the control treatment in 2018 and 2019 (Table 2). Species diversity and evenness from pan trap capture were similar among all treatments in 2018. However, in 2019, all five-cowpea treatments were more diverse and evenly distributed than the control (Table 3).

3.2. Pollinators on Cowpeas and Pollinator-Dependent Crops

3.2.1. Pollinators on Cowpeas

Among the five-cowpea treatments, the mean number of pollinators recorded on the cowpeas through direct visual counts over the entire sampling period was significantly different (F4,18.7 = 5.94, p = 0.002) in 2018 and (F4,16.8 = 4.92, p = 0.008) in 2019. In 2018, PPH + PPH and PPH-only recorded the highest number of pollinators and the number of pollinators ranged from 17.5 ± 1.4 on WHIP + WHIP to 44.8 ± 10.8 in PPH-only treatment (Figure 1a). In 2019, PPH + PPH and PPHWHIP + PPHWHIP cowpeas recorded the highest number of pollinators of 87.7 ± 7.6 and 77.7 ± 5.8, respectively (Figure 1a). Sticky trap catches indicated there were significant differences in the numbers of pollinators captured among the cowpeas in 2018 (F4,24.42 = 4.59, p = 0.007) and in 2019 (F4,23.13 = 6.94, p = 0.0008). In 2018, the highest number of pollinators were captured on PPH-only cowpea (220.8 ± 10.2) and the lowest on WHIP + WHIP cowpea (167.1 ± 8.4) (Figure 1b). Similarly, in 2019 the highest number of pollinators were captured on PPH-only (203.4 ± 16.0) and the lowest on WHIP + WHIP (156.5 ± 6.3) (Figure 1b). Pollinators recorded from pan traps were not significantly different among the cowpeas in 2018 (F4,21.01 = 2.2, p = 0.1) or in 2019 (F4,21.14 = 0.23, p = 0.92) (Figure 1c). However, in 2018, pollinator counts were highest (71.2 ± 13.6) on WHIP + WHIP > WHIP-only (61.4 ± 10.9) > PPHWHIP + PPHWHIP (60.9 ± 10.8) > PPH + PPH (50.4 ± 8.1) cowpeas and lowest (50.2 ± 6.8) in PPH-only cowpea. Pollinator counts in 2019 ranged from 44.2 ± 4.1 on PPHWHIP + PPHWHIP to 47.5 ± 4.2 in WHIP + WHIP cowpeas (Figure 1c).
Combining pollinators from all sampling methods for each year, our results show that the total number of pollinators captured in 2018 was not significantly different (F4,12 = 2.46, p = 0.10) among the cowpeas. However, PPH-only (315.7 ± 25.9) and PPH + PPH (304.3 ± 39.3) recorded the highest numbers of pollinators (Figure 1d). In 2019, significant differences (F4,15 = 10.4, p = 0.0003) were recorded among the cowpeas, with counts ranging from 247.8 ± 7.7 on WHIP-only to 323.1 ± 15.8 on PPH + PPH (Figure 1d).

3.2.2. Pollinators on Pollinator-Dependent Crops (PDCs)

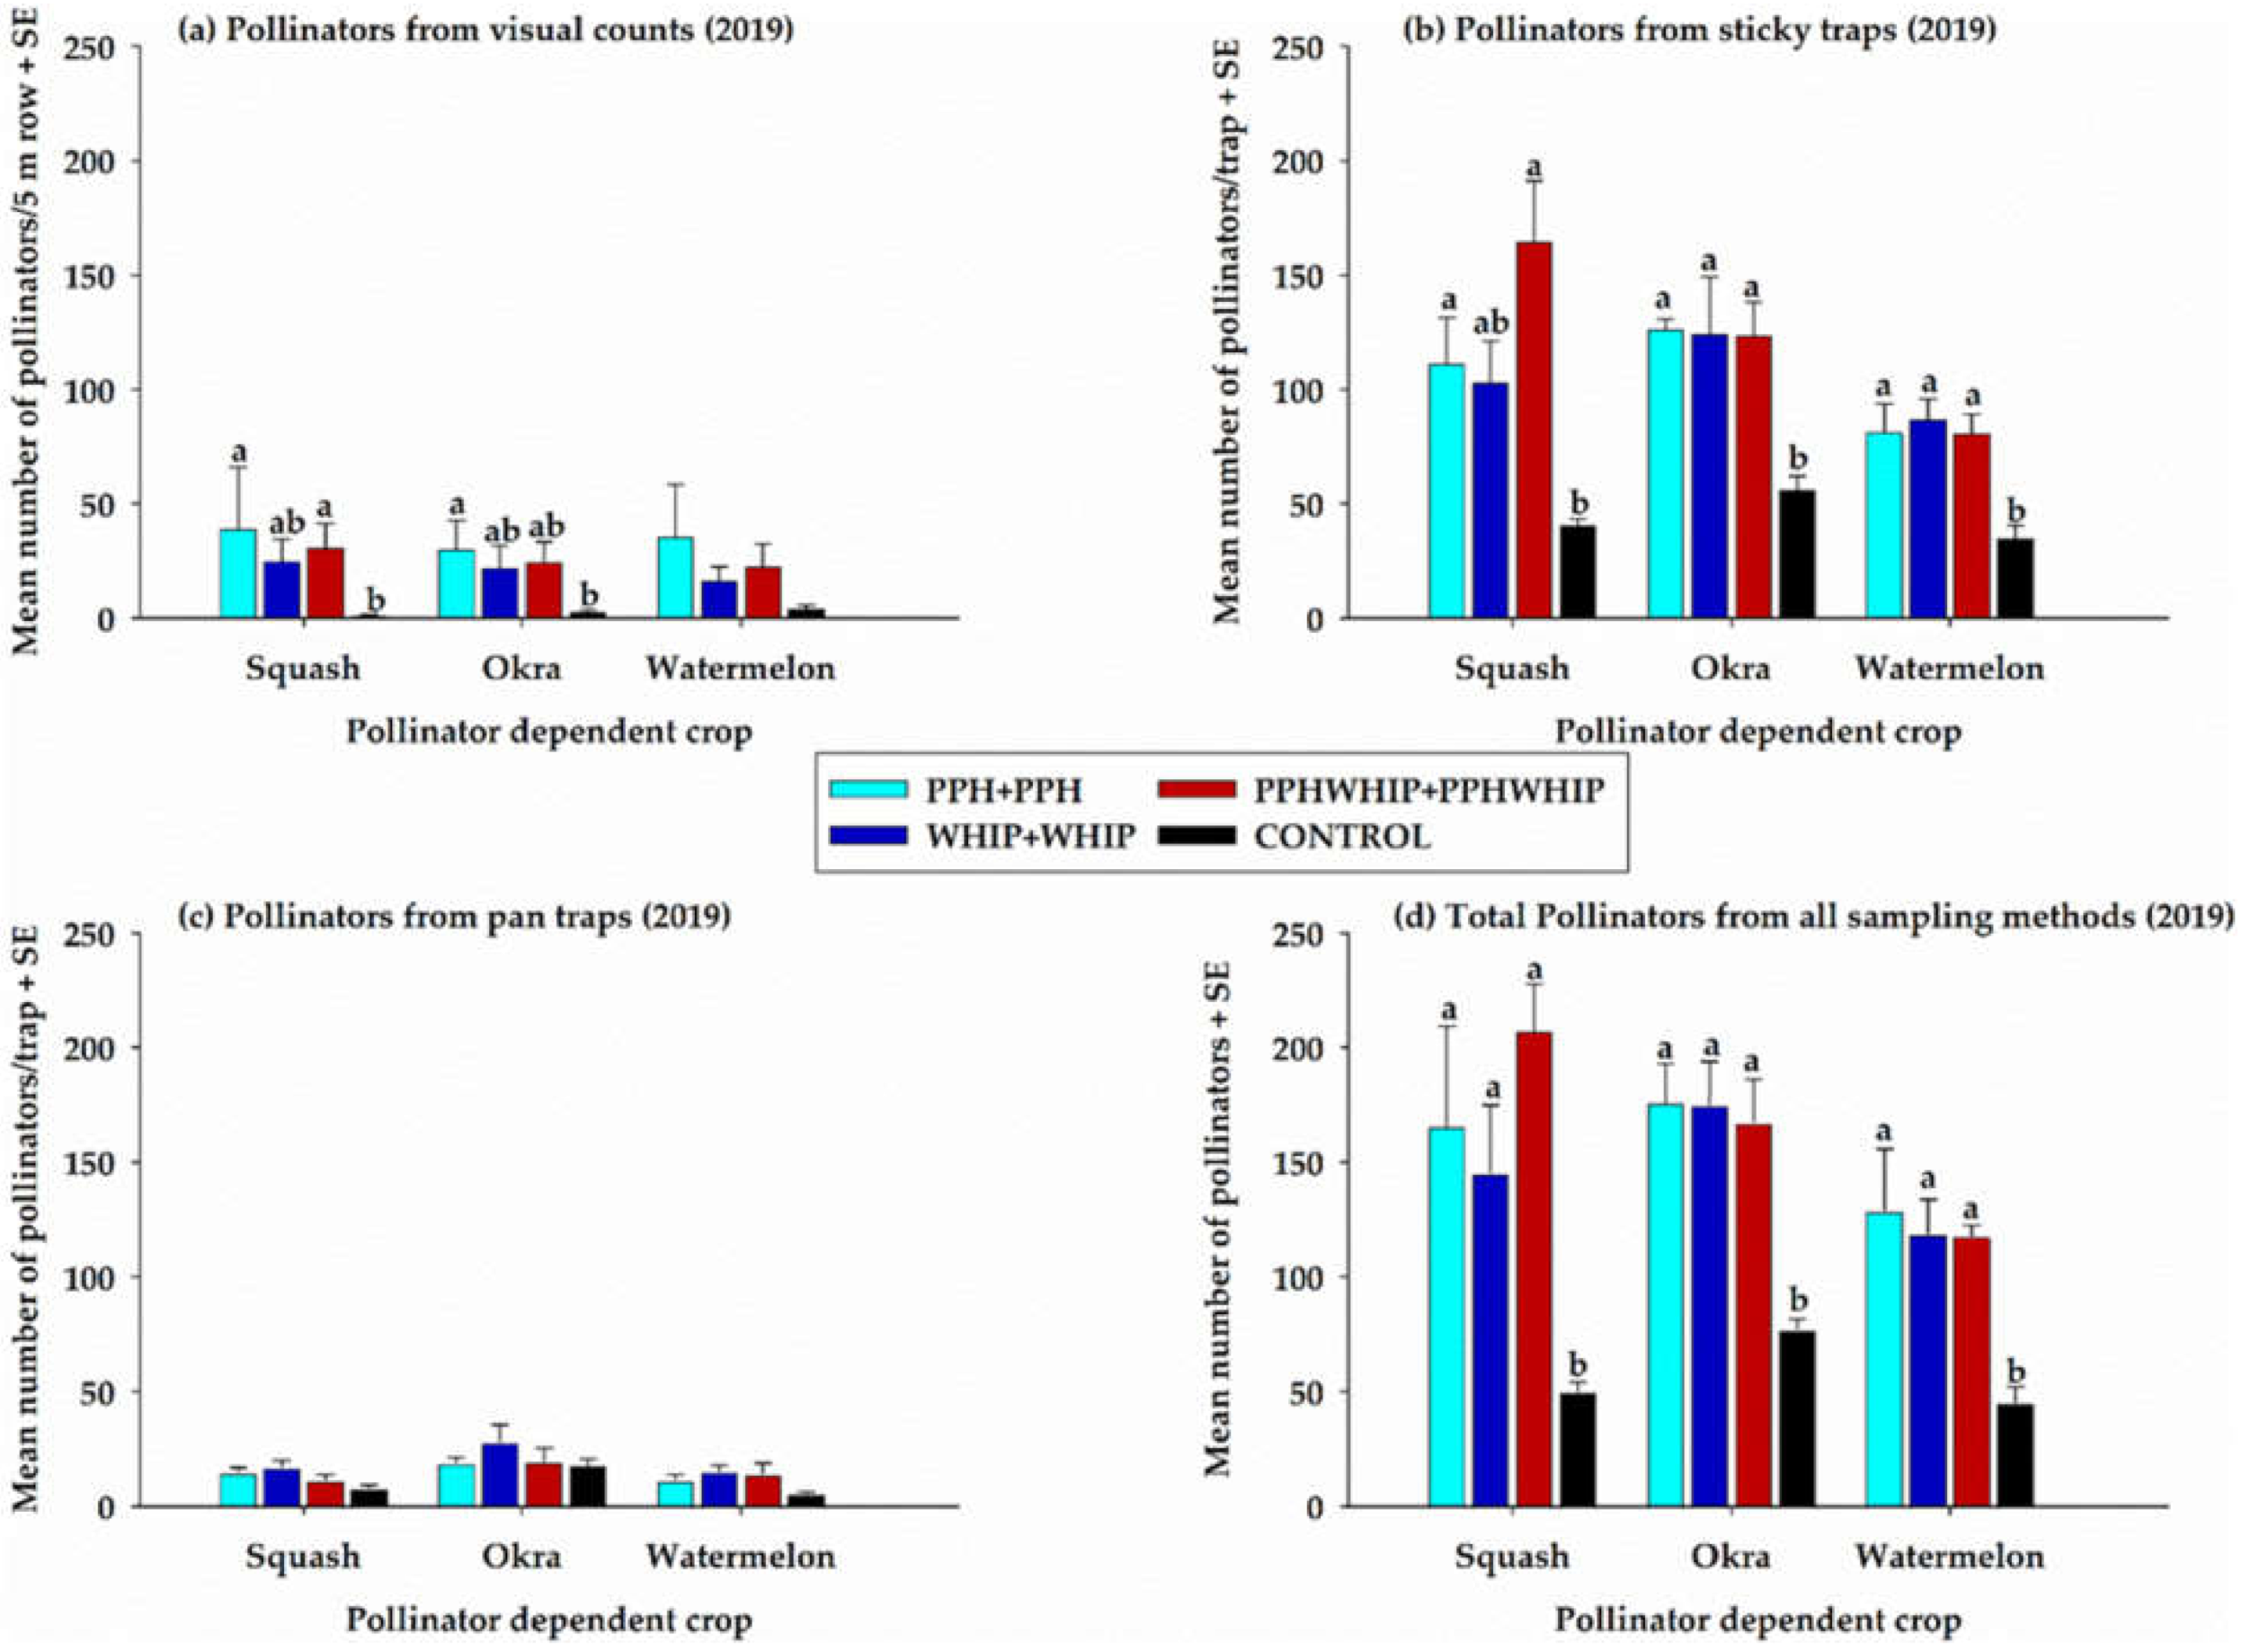
Pollinators recorded from the three sampling methods on each pollinator-dependent crop bordered with cowpea and without cowpea in 2018 and 2019 are presented in Figure 2 and Figure 3, respectively. In 2018, the number of pollinators recorded through direct visual counts on squash intercropped with cowpea was significantly different (F3,23.9 = 8.91, p = 0.0004) than the control (squash without cowpea). Figure 2a shows that more pollinators were recorded on squash that was intercropped with cowpea compared to the control without cowpea. Similarly, in 2019, there was significant difference (F3,15.8 = 4.08, p = 0.025) in the number of pollinators recorded on squash intercropped with cowpea and the control. Figure 3a shows that more pollinators were recorded on squash intercropped with PPH + PPH and PPHWHIP + PPHWHIP cowpeas than on the control. For okra, there was no significant difference (F3,16.5 = 1.78, p = 0.19) in the number of pollinators recorded among all treatments in 2018 (Figure 2a). However, in 2019, there was significant difference among the treatments (F3,12.1 = 4.15, p = 0.031), with okra intercropped with PPH + PPH cowpea recording the highest number of pollinators (Figure 3a). For watermelon, there was no significant difference in the number of pollinators recorded on all treatments in both 2018 (F3,15.14 = 3.08, p = 0.0059) and 2019 (F3,11.77 = 1.72, p = 0.22. However, in both years the count was higher on watermelon intercropped with cowpea (Figure 2a and Figure 3a).
Results from sticky traps show that in 2018 there was a significant difference ((F3,16.6 = 3.45, p = 0.041), (F3,20.4 = 8.60, p = 0.0007), and (F3,14.3 = 11.90, p < 0.0004)) among intercropped squash, okra, and watermelon, respectively, and the control. Similarly, in 2019, there was a significant difference ((F3,11.7 = 9.48, p = 0.0002), (F3,13.3 = 6.33, p = 0.0007), and (F3,10.9 = 9.77, p = 0.002)) among intercropped squash, okra, and watermelon, respectively, and the control. In both years, more pollinators were recorded on the pollinator-dependent crops (squash, okra, and watermelon) that were intercropped with cowpea than on PDCs without cowpea (Figure 2b and Figure 3b).
From pan traps, there was no significant difference ((F3,15.0 = 0.64, p = 0.60) and (F3, 16.7 = 2.60, p = 0.09)) in the number of pollinators recorded on squash intercropped with cowpea and the control in 2018 and 2019, respectively. Our results show that in 2018, the number of pollinators on the okra control was significantly higher (F3,16.3 = 9.65, p = 0.0007) than on intercropped okra. However, in 2019, there was no significant difference (F3, 14.6 = 1.09, p = 0.38) among the treatments, and pollinator counts were higher on the okra intercropped with WHIP + WHIP than on the control (Figure 3c). In 2018 and 2019, pollinator counts on watermelon were not significantly different ((F3,12.9 = 1.02, p = 0.41) and (F3,12.9 = 2.92, p = 0.07) respectively). However, in 2019, counts were higher on intercropped watermelon than on the control (Figure 3c).
Combining pollinators from all sampling methods on each PDC intercropped with cowpea and controls without cowpea intercropped shows that in 2018, there was no significant difference in squash (F3,9 = 3.28, p = 0.07) or okra (F3,9 = 3.54, p = 0.06) in the number of pollinators recorded on the PDC intercropped with cowpea and the control. However, more pollinators were recorded on squash and okra intercropped with cowpea than the control (Figure 2d). In 2019, there was a significant difference in squash (F3,9 = 8.15, p = 0.006), okra (F3,13 = 12.52, p = 0.002), and watermelon (F3,9 = 8.47, p = 0.006) in the number of pollinators recorded on these PDCs intercropped with cowpea than their controls (Figure 3d).

3.2.3. Total Pollinators on Cowpeas and on Pollinator-Dependent Crops and Controls

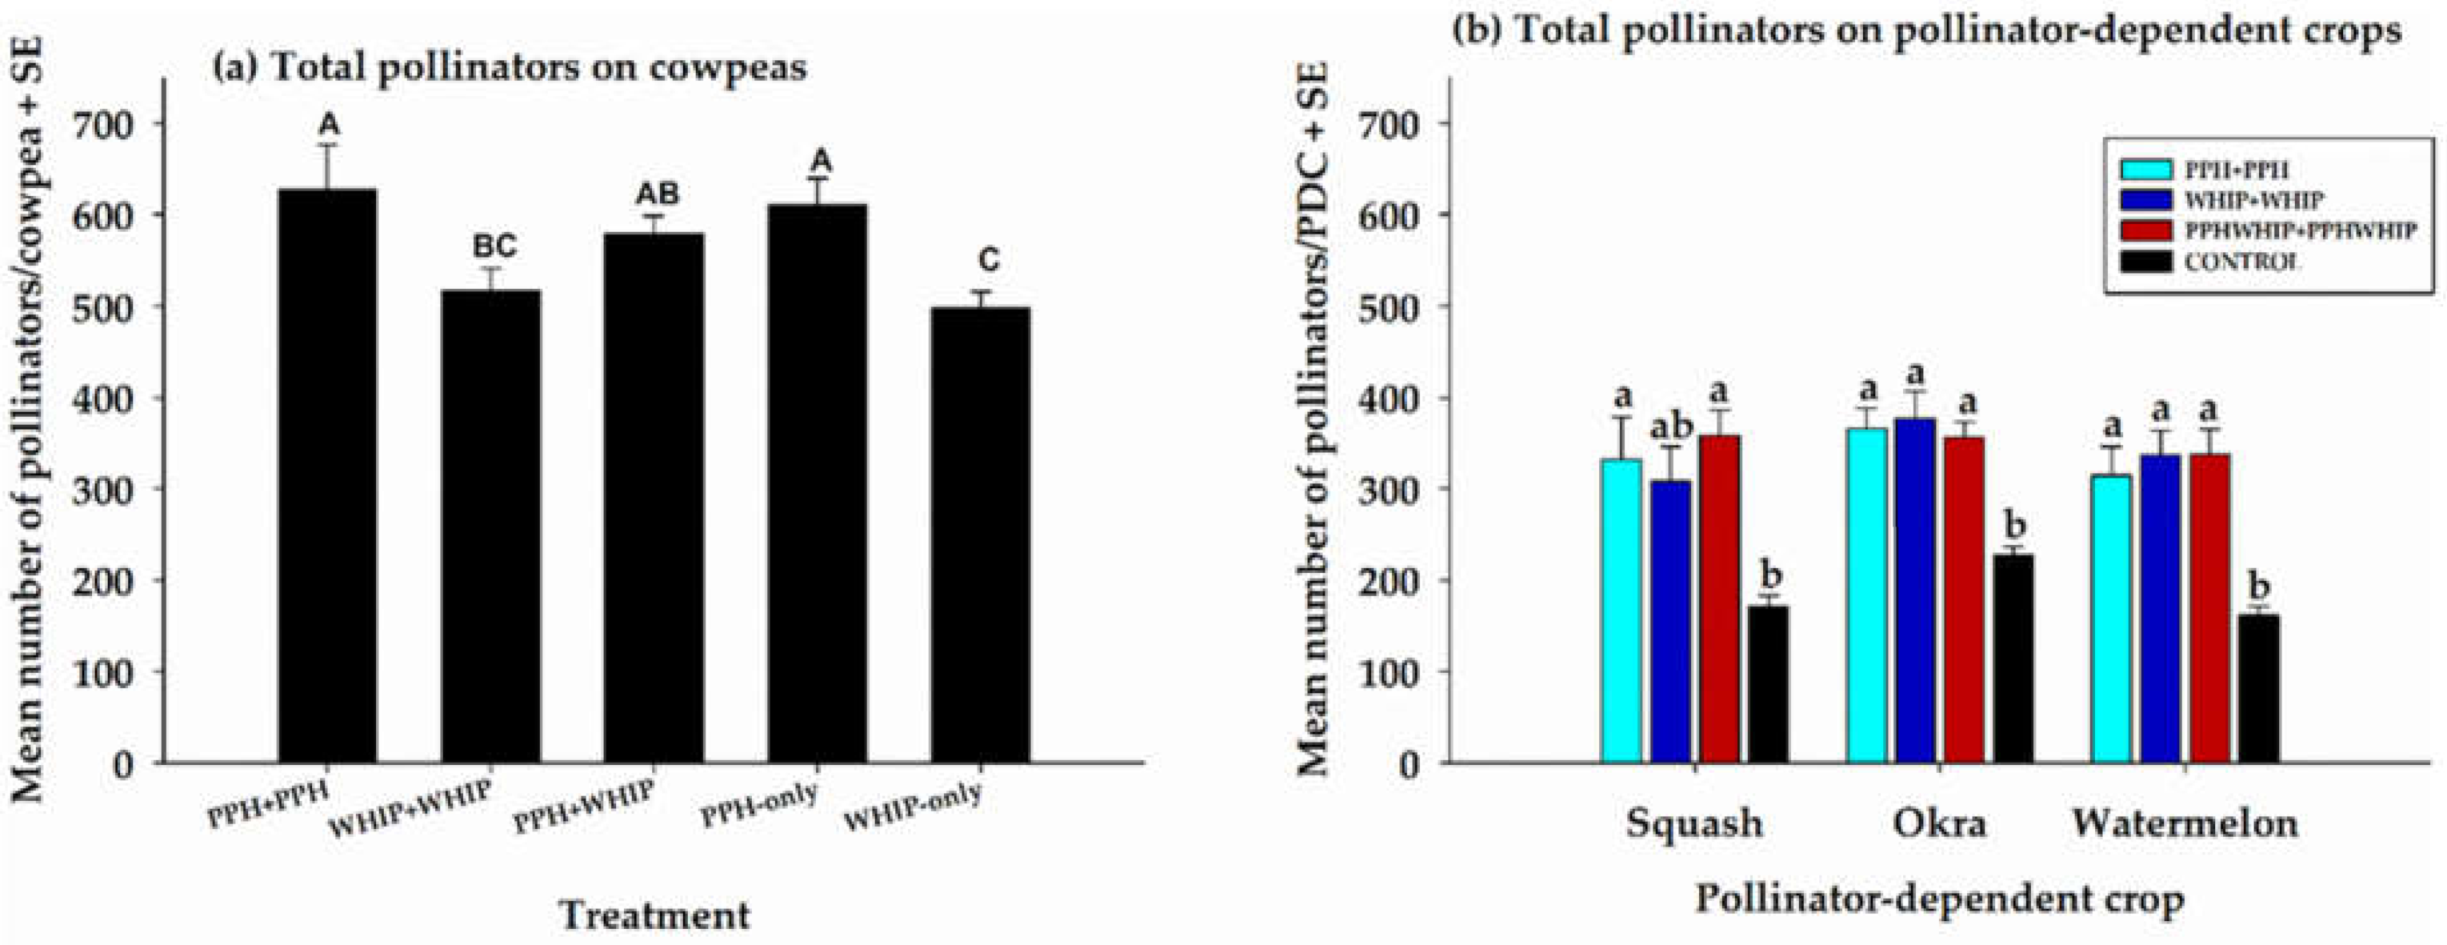
Total pollinators recorded from all sampling methods in both years on cowpeas from each of the five-cowpea treatments and on the pollinator-dependent crops are presented in Figure 4a,b, respectively. Among the five-cowpea treatments, the number of pollinators recorded on the cowpeas was significantly different (F4,12.3 = 9.6, p = 0.001), with pollinator counts higher on PPH + PPH = PPH-only ≥ PPH + WHIP ≥ WHIP + WHIP > WHIP-only and ranging from 498.1 ± 18.2 on WHIP-only to 627.4 ± 48.9 on PPH + PPH (Figure 4a). Pollinator counts were not significantly different among the three intercropped pollinator-dependent crops but were significantly different than their controls for squash (F3,9 = 6.84, p = 0.01), okra (F3,12 = 11.8, p = 0.0007), and watermelon (F3,9 = 13.0, p = 0.001). The controls recorded the lowest counts, with 162.3 ± 9.3 in watermelon, 172.3 ± 11.0 in squash, and 228.2 ± 8.4 in okra (Figure 4b).
Comparing the number of pollinators on cowpeas from each of the five-cowpea treatments with the number on squash intercropped with cowpea and on the squash control, our results show there was a significant difference (F8,24 = 41.0, p < 0.001) among treatments. The highest pollinator counts were recorded on the cowpeas of the five-cowpea treatments, and counts on intercropped squash were higher than counts on the squash control (Figure 5a). There was a significant difference (F8,24 = 38.3, p < 0.001) between the number of pollinators on cowpeas from each of the five-cowpea treatments and the number on okra intercropped with cowpea and on the okra control. Similar to squash, the highest pollinator counts were recorded on the cowpeas of the five-cowpea treatments, also counts on okra intercropped were higher than counts on the okra control (Figure 5b). On watermelon, there was a significant difference (F8,24 = 62.9, p < 0.001) among treatments. Similar to squash and okra, pollinator counts on intercropped watermelon were similar and higher than counts on the control but lower than the counts on cowpeas (Figure 5c).
Similarly, during each sampling week, more pollinators were recorded on cowpeas compared to the PDCs intercropped with cowpea (Figure 6a–c). Among the four sampling weeks for each treatment, pollinator counts dropped on week three on both the cowpeas and PDCs and peaked at week four for the PPH + SOW + PPH and PPHWHIP + SOW + PPHWHIP treatments (Figure 6a,b).

3.3. Other Beneficial Insects and H. halys on Cowpeas and PDCs

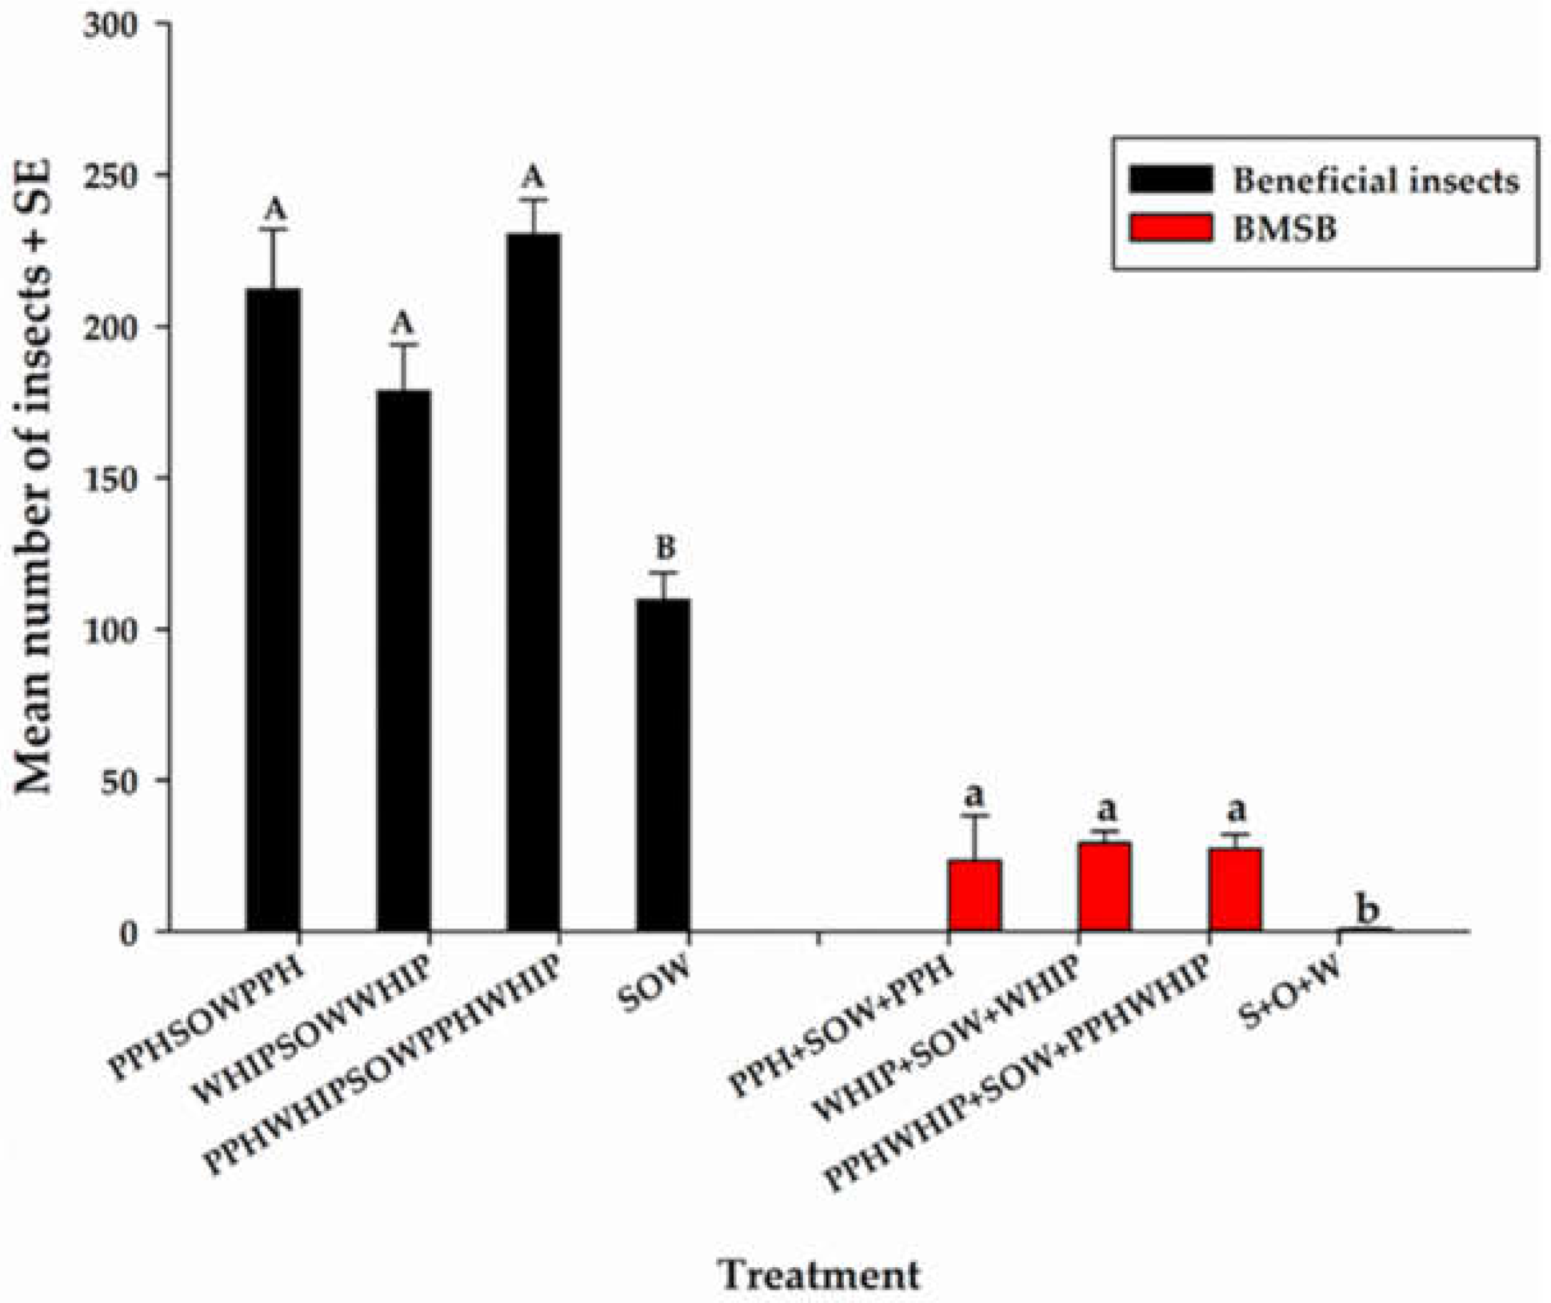
The number of H. halys on the cowpeas was not significantly different (F4,12 = 1.05, p = 0.42) among the five-cowpea treatments (Figure 7). The number on each of the PDCs intercropped with cowpea and control was not significantly different among treatments; squash (F3,12 = 0.71, p = 0.56), okra (F3,12 = 2.11, p = 0.15), and watermelon (F3,12 = 0.88, p = 0.48), which recorded zero H. halys. However, combining all PDCs (SOW), there was a significant difference (F3,9 = 8.87, p = 0.0047) in the number of H. halys among treatments, with more recorded on the PDC intercrop (probably due to no H. halys recorded on watermelon) than on the control (Figure 8).
Beneficial insects, including Anthocoridae, Berytidae, Dolichopodidae, and Geocoridae, were recorded on all treatments. On the cowpeas, the number of beneficial insects was significantly different (F4,12 = 118.7, p < 0.001), with more on cowpeas that were intercropped than on the sole cowpeas (Figure 7). The number recorded on each of the PDCs intercropped with cowpea was significantly higher on squash (F3,9 = 10.10, p = 0.003) and watermelon (F3,9 = 7.42, p = 0.008) than on the control without cowpea, and similar on okra (F3,9 = 1.99, p = 0.19) and the control. Combining beneficial insects on all PDCs (SOW), there was a significant difference (F3,9 = 17.76, p = 0.004) in the number of beneficial insects on the PDCs intercropped with cowpea than the control without cowpea (Figure 8).

3.4. Crop Yield

Our results show that in 2018, there was no significant difference (F3,9 = 2.55, p = 0.12) in squash yield among the three cowpea treatments and the control. However, in 2019 the yield of squash control was significantly lower (F3,12 = 23.9, p < 0.0001) than the yield in any of the three cowpea intercropped treatments (Table 4). Overall, the squash intercrop produced 27% more fruits than the control. The yield among okra intercropped with cowpea and the control was not significantly different among treatments in 2018 (F3,9 = 1.93, p = 0.20) or in 2019 (F3,12 = 0.39, p = 0.76). However, overall, okra intercropped with cowpea produced 7% more fruits than the control (Table 4). The yield of watermelon intercropped with cowpea was significantly higher than the control in 2018 (F3,9 = 14.57, p < 0.0008) and in 2019 (F3,12 = 11.6, p = 0.0008). Overall, watermelon intercropped with cowpea produced 54% more fruits than the control. Among the cowpeas, the mean total from both years combined indicates that there was a significant difference (F4,12 = 24.62, p < 0.0001) in yield (kg), with PPH-only cowpea recording the highest yield (2.0 ± 0.1) > WHIP-only (1.7 ± 0.04) > PPH + PPH (1.6 ± 0.03) > PPH + WHIP (1.5 ± 0.04) > WHIP + WHIP (1.4 ± 0.1).

3.5. Relationship between Pollinator Abundance and Crop Yield

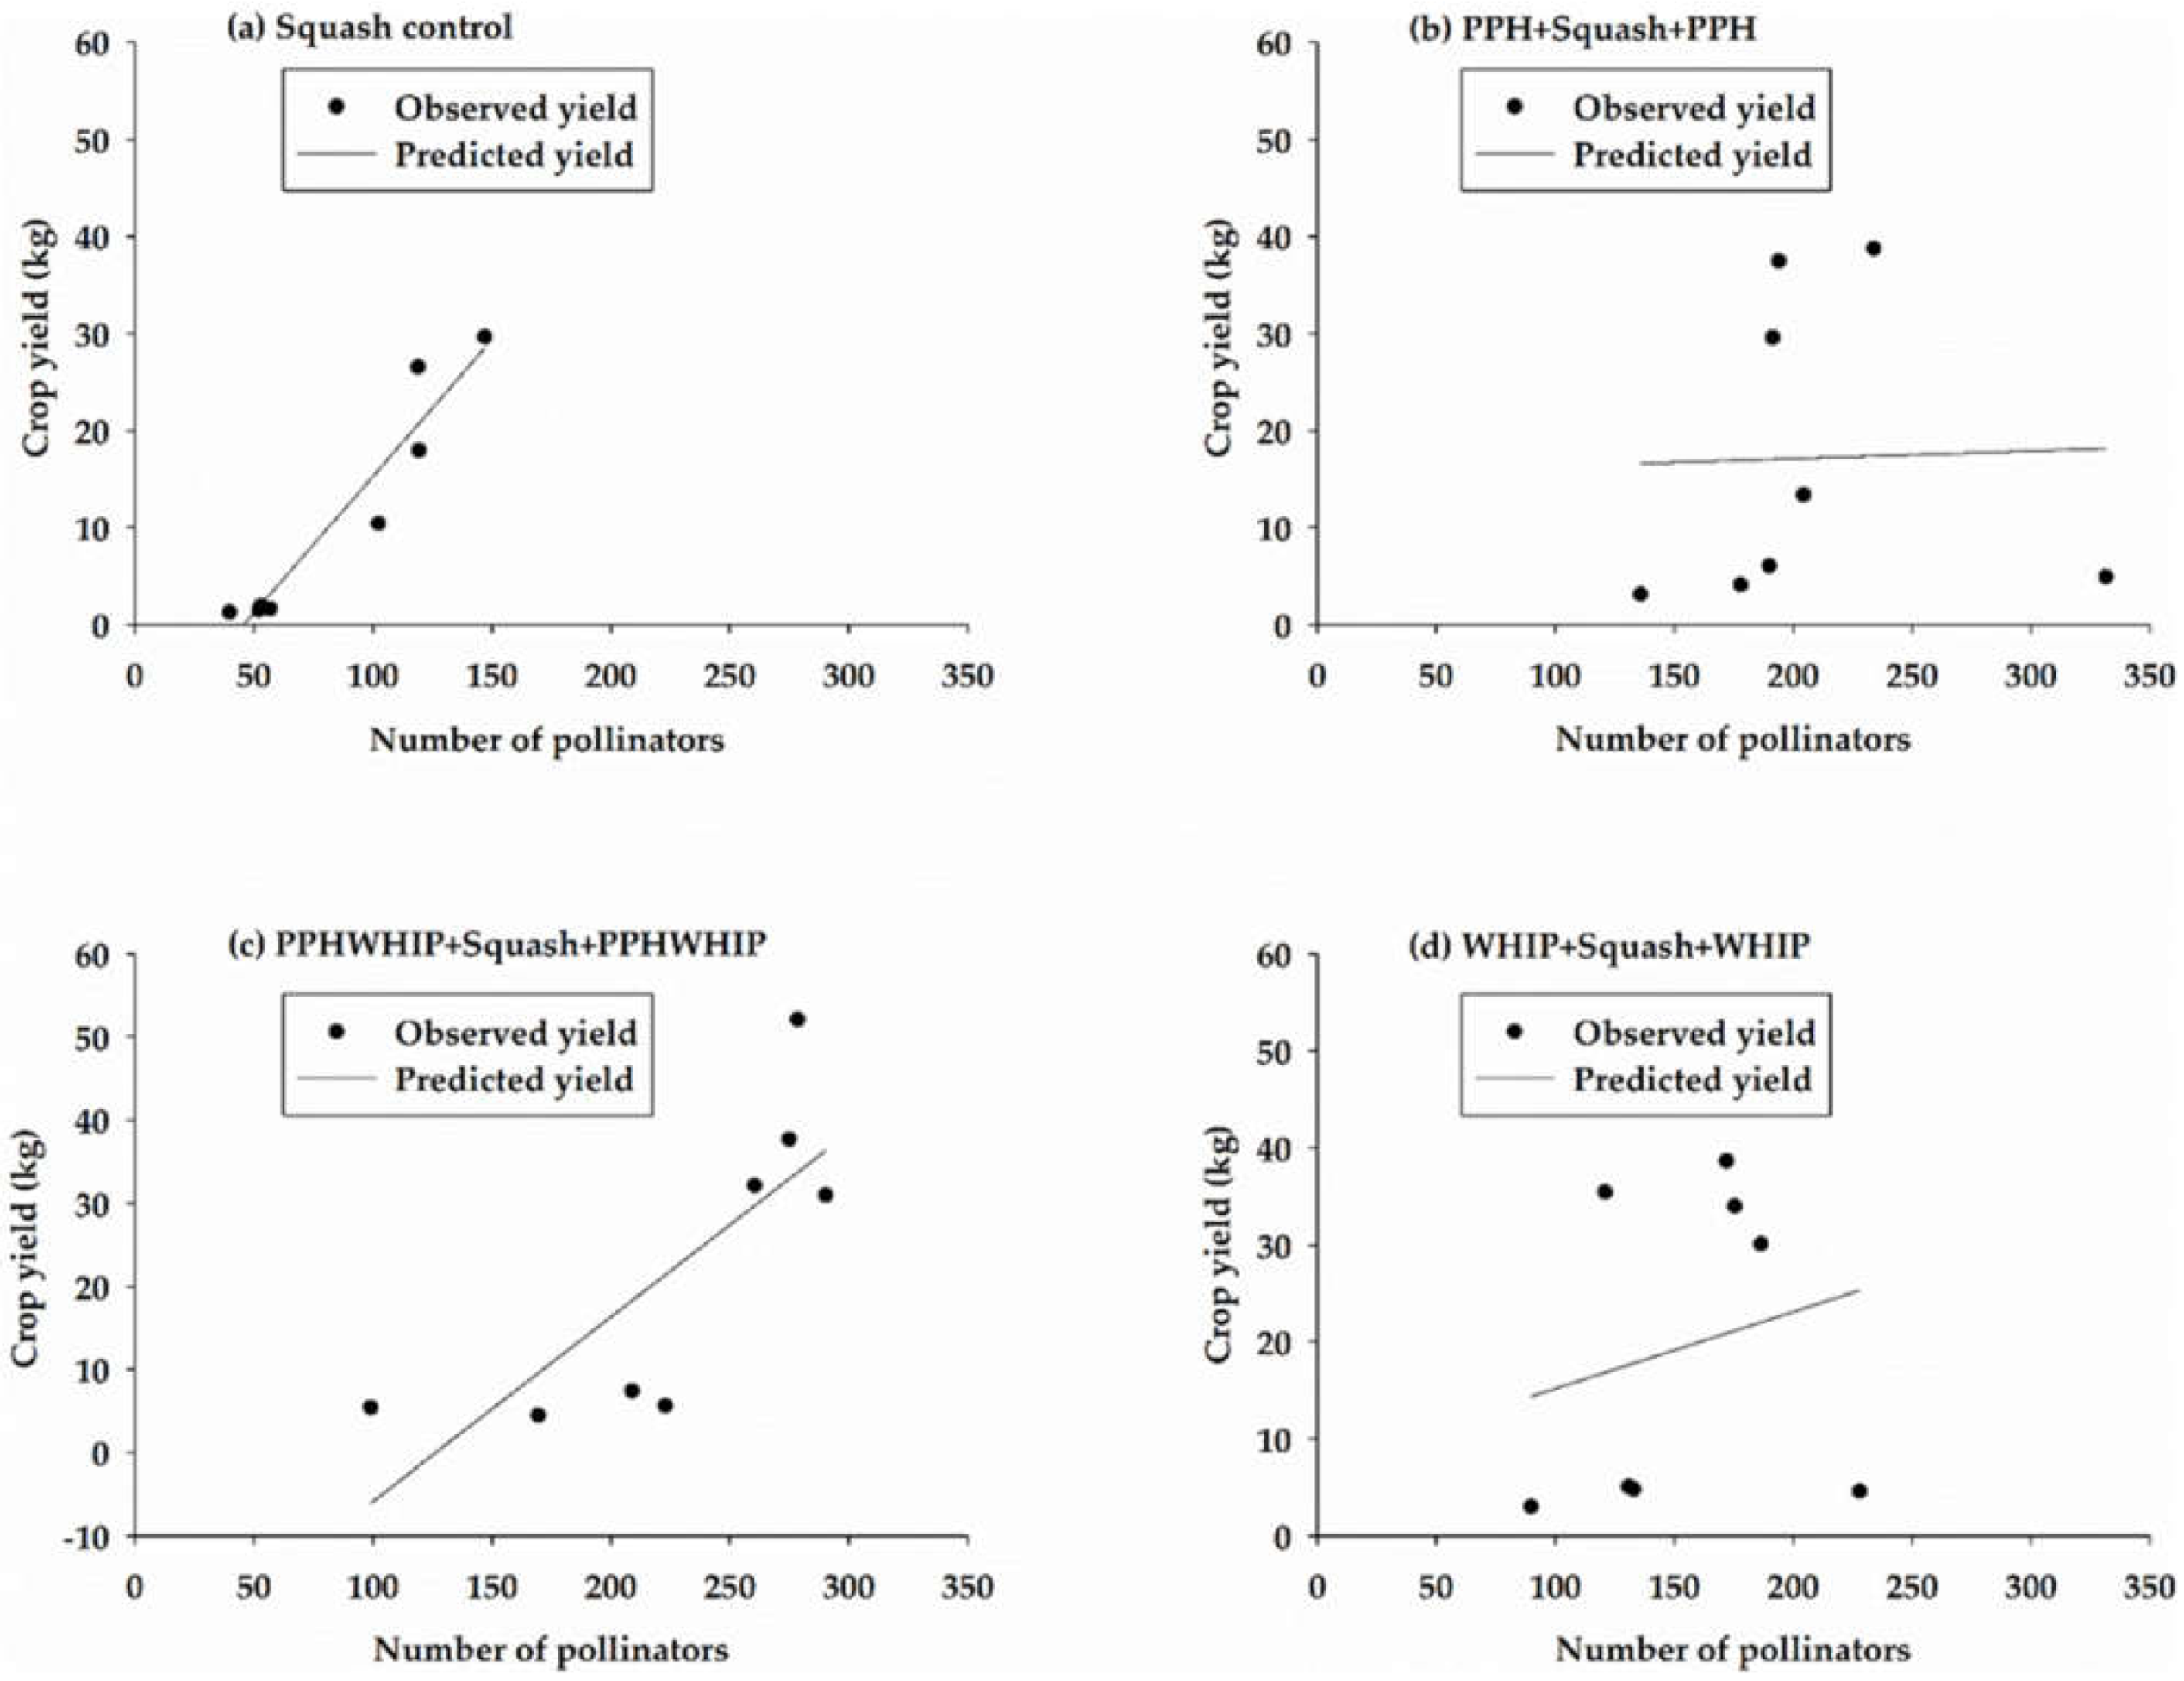
There was a positive relationship between pollinator abundance and squash yield for all treatments (Figure 9). A strong and significant relationship was recorded in the squash control (r = 0.95; p = 0.0002) and squash intercropped with PPH + WHIP cowpea (r = 0.79; p = 0.02). The relationship in squash intercropped with PPH + PPH cowpea (r = 0.03; p = 0.95) and WHIP + WHIP cowpea (r = 0.21; p = 0.61) was weak and not significant. About 95%, 79%, 3%, and 21% of the variation in squash yield can be explained by the relationship between yield and the number of pollinators in the squash control, PPHWHIP + Squash + PPHWHIP, PPH + Squash + PPH, and WHIP + Squash + WHIP cowpea treatments, respectively.
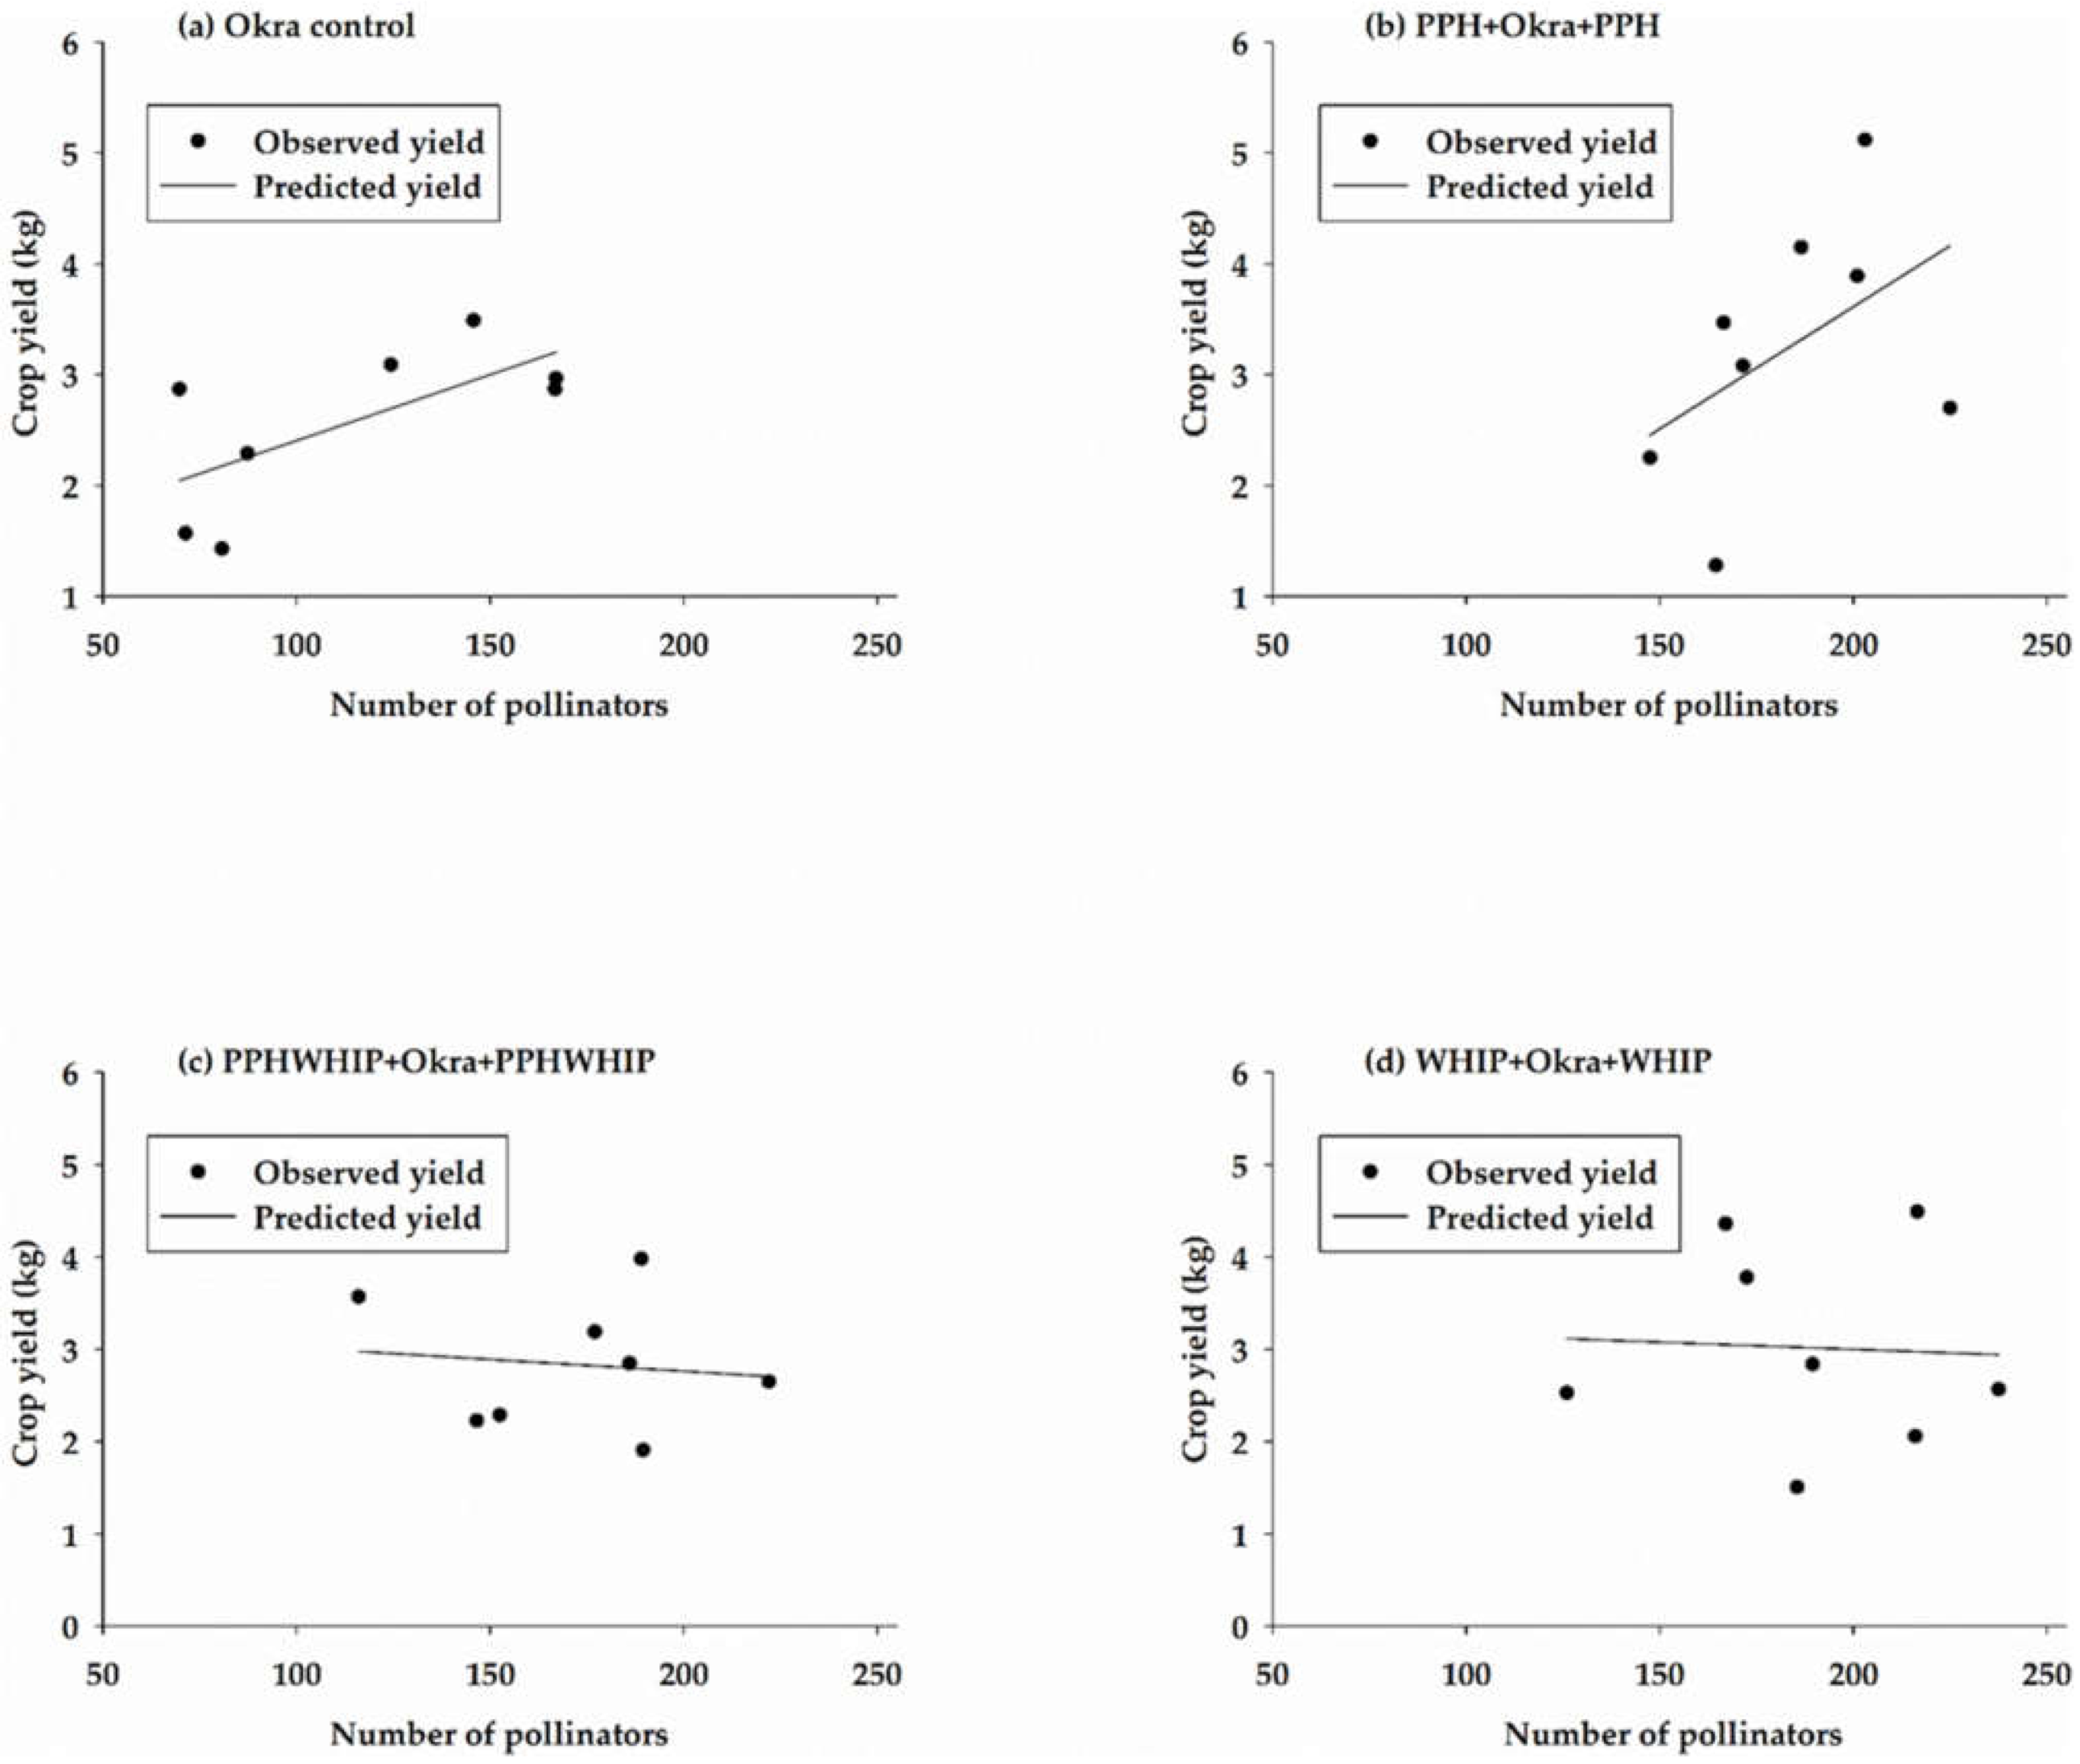
There was a positive but non-significant relationship between pollinator abundance and yield in the okra control (r = 0.67; p = 0.07) and in the PPH + Okra + PPH intercrop (r = 0.47; p = 0.24). A weak negative and non-significant relationship was recorded in PPHWHIP + Okra + PPHWHIP (r = 0.12; p = 0.78) and in WHIP + Okra + WHIP (r = 0.05; p = 0.91) (Figure 10). About 67%, 47%, 12%, and 5% of the variation in okra yield can be explained by the relationship between yield and number of pollinators in the okra control, PPH + Okra + PPH, PPHWHIP + Okra + PPHWHIP, and WHIP + Okra + WHIP cowpea treatments, respectively.
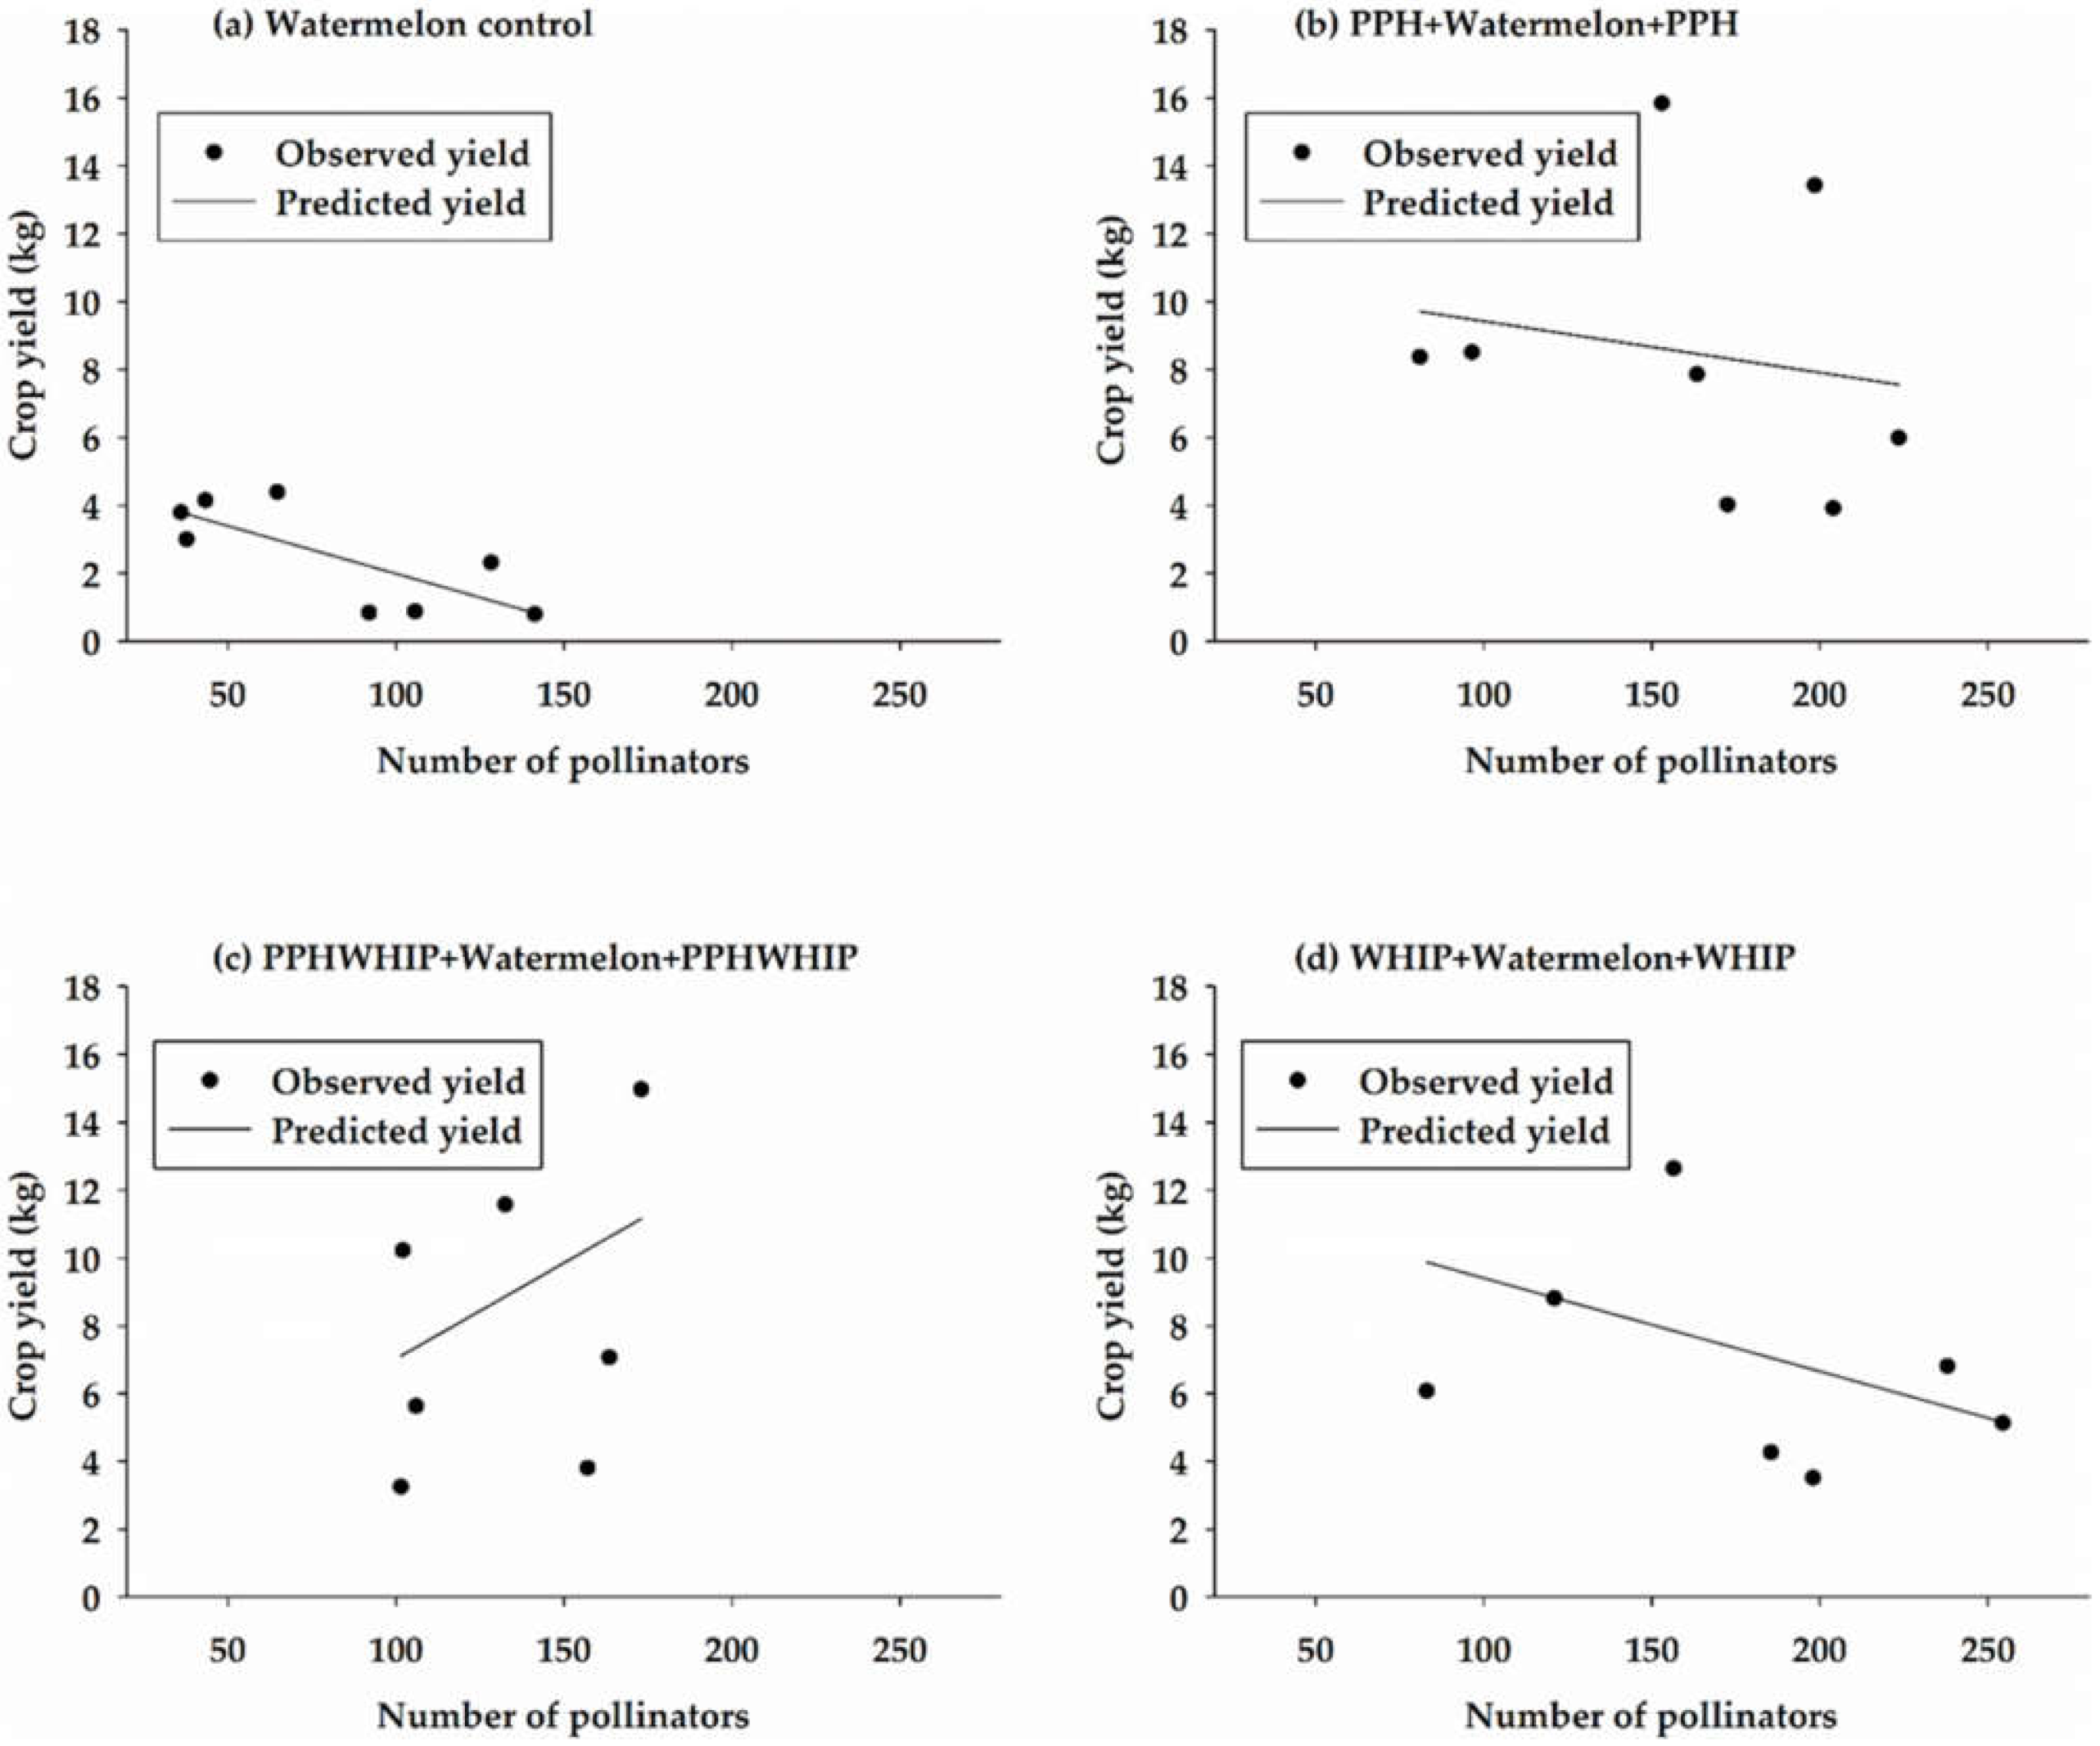
All watermelon treatments except PPHWHIP + Watermelon + PPHWHIP (r = 0.35; p = 0.41), showed a negative relationship between yield and number of pollinators (Figure 11). There was a strong, moderate, and weak negative relationship observed in the watermelon control (r = 0.76; p = 0.03), WHIP + Watermelon + WHIP, (r = 0.47; p = 0.25) and PPH + Watermelon + PPH (r = 0.18; p = 0.67) treatments, respectively.

4. Discussion

The use of farming systems that encourage the creation of flower-rich habitats to promote ecosystem services such as pollination is crucial at this time, given that global agriculture has expanded and has become increasingly dependent on pollinator services as a result of the increase in the production of pollinator-dependent crops (PDCs). In this study, we evaluated the impact of pollinator abundance and diversity and the presence of other beneficial insects and H. halys on crop yield when two cowpea varieties attractive to pollinators where intercropped with three pollinator-dependent crops (squash, okra, and watermelon). This was achieved using three sampling methods (direct visual counts, pan traps, and sticky traps). It has been suggested by several studies that when assessing the abundance and diversity of insect pollinators, the use of multiple sampling methods would provide a better representation of the different types of pollinators in an ecosystem [14,19,39,40,41,42,43,44]. From our study, diverse pollinator types were recorded. A total of 80,379 pollinators representing seven pollinator families (Andrenidae, Apidae, Crabronidae, Formicidae, Halictidae, Tachinidae, and Vespidae) were captured in pan traps, six families (Apidae, Crabronidae, Halictidae, Pyralidae, Tachinidae, and Vespidae) in sticky traps, and five pollinator types (bumble bees, carpenter bees, honey bees, butterflies and moths, and wasps) through direct visual counts in both years. This supports the recommendation that different sampling methods are efficient for depicting the different pollinator types, and our findings present a more accurate representation of the diversity of pollinators attracted to cowpea and pollinator-dependent crops. Generally, sticky traps and pan traps catch a proportion of the aerial insect community. Consequently, it is more difficult to attribute the presence and abundance of insects in these traps to specific treatments, especially in small plots like those used in the present study. However, the trapping data support the trends with the direct visual counts of pollinators. The traps also provided an opportunity for measuring diversity within the field.
From each sampling method used in our study, squash, okra, and watermelon intercropped with cowpea resulted in increased pollinator abundance compared to squash, okra, and watermelon planted without cowpea (Table 1, Table 2 and Table 3). Our findings are similar to other studies that have reported that intercropping with flowering plants or flower strips established adjacent to or within crop fields enhanced pollinator abundance compared to sole cropping. For example, intercropping native and perennial wildflower species adjacent to blueberry farms increased wild bee abundance compared to the control [12]. In another study, flowering basil intercropped with bell peppers resulted in an increased number of pollinators compared to bell peppers without basil [15]. Other studies have suggested that an increase in the number of inflorescences may result in an increase in pollinator visits [45,46,47,48]. Pinkeye Purple Hull and Whippoorwill cowpeas produce an average of 49.4 and 56.4 flowers per plant, respectively [19]. These flowers, in addition to those from squash, okra, and watermelon, as well as other floral resources such as nectar and pollen, may have influenced the attraction and abundance of pollinators in the cowpea intercrop.
In most studies, the contribution of the individual crop to the documented outcome has not been investigated. For each treatment and control, pollinator counts were highest on the cowpeas, followed by PDCs intercropped with cowpea and lowest on the control without cowpea (Figure 5). In addition, data from the weekly distribution of pollinators show that among the three cowpea intercrop treatments, there were more pollinators recorded on the cowpeas during each sampling period compared to the PDCs (Figure 6). From our findings, intercropping resulted in more pollinators on the PDCs intercropped with cowpea compared to the control, which had no cowpea (Figure 5). This could be attributed to the consistent high numbers of pollinators on the cowpeas. The flower color and floral resources in cowpea could have contributed to this outcome. It has been reported that colorful flowers induce responses in the form of sensory signals indicating the quantity and quality of floral rewards [20]. In addition to this, the canopy structure of cowpea may have provided more appropriate nesting sites and a suitable microhabitat, as observed on some cowpea varieties [49].
Environmental factors such as temperature, rainfall, and relative humidity can affect pollinator abundance. Data obtained from the State Climate Office of North Carolina [50] indicate that the average relative humidity during the sampling period was 74% in both years; however, the average temperature was 25 °C and 23 °C in 2018 and 2019, respectively. The elevated temperatures in 2018 were accompanied by an increase in pollinator abundance compared to 2019, when temperatures were two degrees lower (Table 1, Table 2 and Table 3). It is most likely that the temperatures during the sampling period in 2018 could have been optimal for pollinator foraging activity. On the other hand, there was a noticeable decrease in pollinator counts in the third week of sampling (Figure 6). This could be due to the continuous rainfall during this sampling period (22 July to 3 August 2018), where precipitation ranged from 0.05 to 1.11 inches daily, with an average of 0.69 inches [50]. Rainfall has the potential to affect plant–pollinator interactions, as it could have direct physical effects on the floral resources and thus their pollinators.
Creating ways of producing food sustainably requires cropping systems that support biodiversity for increase crop yield [51,52]. From our findings, intercropping with cowpea resulted in increased pollinator diversity compared to crops without intercropped cowpea. This was accompanied by an increase in crop yield, where okra, squash, and watermelon intercropped with cowpea produced 7%, 27%, and 54% more fruits, respectively, than the controls. Among the insects recorded, pollinators in the Apidae (honey bees and bumble bees) and Halictidae families were the most abundant insects on the intercropped cowpea treatments. Honeybees are essential insect pollinators for all PDCs. Their abundance on the intercrop could have aided pollination efficiency and the observed increase in yield. According to [53], honeybees were the main pollinators of okra flower and resulted in improved yield. The high yield in watermelon and squash could have been due to the combined pollination from honeybees, bumble bees, and halictidae, all of which have been reported to pollinate watermelon and squash and were among the most abundant pollinators recorded on the cowpea intercrops [54,55,56]. Our findings suggests that pollinators, and subsequently yield, could be increased by intercropping with cowpea varieties that are attractive to pollinators.
On the other hand, pest densities in intercropped systems are reduced as a result of an increase in the density of beneficial insects, resulting in increased crop yield [57,58]. H. halys has been reported to be a major pest of cowpea in North Carolina [27]. Even though the number of H. halys on the cowpea among the five-cowpea treatments (Figure 7) and the number on each of the PDCs was similar to the control, the yield of each of the PDCs intercropped was higher than the control. This could be due to the presence of more beneficial insects recorded on the three-cowpea intercrop treatments than the control without cowpeas. Intercropping benefitted both the cowpeas and the PDCs in increasing the number of beneficial insects on these crops compared to the controls (Figure 7 and Figure 8). Additionally, the intercropped treatments recorded the highest number of tachinidae (Table 2 and Table 3), a family of true flies that are parasitic on some insects. For example, from several cowpea studies, tachinid fauna has been reported to attack cowpea pests such as the cowpea curculio and the pod-sucking bug complex [59]. In addition, in soybean fields, several stink bug species were reported to be parasitized by tachinids [60]. Tachinidae have also been reported to parasitize the leaf-footed bug, the southern green stink bug [61], and the squash bug [62], which are pests of squash and okra. Although all the PDC controls recorded some H. halys, watermelon without cowpea recorded no H. halys. This could be because in the United States, watermelon is not a host plant of H. halys, whereas okra and squash are host plants [63]. This may imply that H. halys recorded on the intercropped watermelon probably moved from the cowpeas onto the watermelon.

5. Conclusions

In this study, we demonstrated that the use of Pinkeye Purple Hull (PPH) and Whippoorwill (WHIP) cowpea varieties in an intercropping system with pollinator-dependent crops (PDCs) squash, okra, and watermelon increased pollinator abundance, diversity, and crop yield. Pollinator counts were higher in all cowpea intercrop treatments than the control; hence, there was no superior cowpea intercrop treatment. Though the number of H. halys on the cowpeas and on each of the PDCs was similar to the controls, the yield of each of the PDCs intercropped was higher than the controls, with okra, squash, and watermelon intercrops producing 7%, 27%, and 54% more fruits than the controls, respectively. This suggests that beneficial insects may have kept the pest population below the economic injury level, given that more beneficial insects were recorded on the three-cowpea intercrop treatments than the controls. Overall, an increase in pollinator count resulted in increased crop yield. However, other factors such as pollinator diversity and the presence of pollinators specific to pollinating the PDCs were important. Intercropping with cowpea showed promise in these small field trials. Future research in scaling up the experiment to test intercropping with cowpea on a larger field scale is warranted. We recommend okra, squash, and watermelon intercropped with PPH, WHIP, or both for increase yield.

Supplementary Materials

The following is available online at https://www.mdpi.com/article/10.3390/su13179612/s1, Table S1: List of the data analyzed using PROC GLIMMMIX for specific data types, crop, year, transformation, and distribution and with or without repeated measures.

Author Contributions

Conceptualization, B.N.D. and L.E.J.; methodology, B.N.D. and L.E.J.; formal analysis, B.N.D., B.A.A. and D.S.; writing—original draft preparation, B.N.D., P.C.O. and B.A.A.; writing—review and editing, B.N.D., B.A.A., P.C.O., L.E.J. and D.S.; visualization, B.N.D.; supervision, B.N.D.; project administration, B.N.D.; funding acquisition, B.N.D. All authors have read and agreed to the published version of the manuscript.

Funding

This research was funded by the USDA-NIFA Southern Sustainable Agriculture Research and Education (SSARE), grant number LS17-279.

Institutional Review Board Statement

Not applicable.

Informed Consent Statement

Not applicable.

Data Availability Statement

Not applicable.

Acknowledgments

We hereby acknowledge the assistance of the staff in the IPM laboratory at NC A&T State University for their help in setting up experimental plots and data collection.

Conflicts of Interest

The authors declare no conflict of interest. The funders had no role in the design of the study; in the collection, analyses, or interpretation of data; in the writing of the manuscript, or in the decision to publish the results.

References

  1. Klein, A.-M.; Vaissière, B.E.; Cane, J.H.; Steffan-Dewenter, I.; Cunningham, S.A.; Kremen, C.; Tscharntke, T. Importance of pollinators in changing landscapes for world crops. Proc. Biol. Sci. 2007, 274, 303–313. [Google Scholar] [CrossRef] [Green Version]
  2. Vanengelsdorp, D.; Meixner, M.D. A historical review of managed honey bee populations in Europe and the United States and the factors that may affect them. J. Invertebr. Pathol. 2010, 103, S80–S95. [Google Scholar] [CrossRef]
  3. Vanbergen, A.J.; Baude, M.; Biesmeijer, J.C.; Britton, N.F.; Brown, M.J.F.; Brown, M.; Bryden, J.; Budge, G.E.; Bull, J.C.; Carvell, C.; et al. Threats to an ecosystem service: Pressures on pollinators. Front. Ecol. Environ. 2013, 11, 251–259. [Google Scholar] [CrossRef] [Green Version]
  4. Garibaldi, L.A.; Steffan-Dewenter, I.; Winfree, R.; Aizen, M.A.; Bommarco, R.; Cunningham, S.A.; Kremen, C.; Carvalheiro, L.G.; Harder, L.D.; Afik, O.; et al. Wild pollinators enhance fruit set of crops regardless of honey bee abundance. Science 2013, 339, 1608–1611. [Google Scholar] [CrossRef]
  5. Mandelik, Y.; Winfree, R.; Neeson, T.; Kremen, C. Complementary habitat use by wild bees in agro-natural landscapes. Ecol. Appl. 2012, 22, 1535–1546. [Google Scholar] [CrossRef] [PubMed]
  6. Winfree, R. The conservation and restoration of wild bees. Ann. N. Y. Acad. Sci. 2010, 1195, 169–197. [Google Scholar] [CrossRef] [PubMed]
  7. Blüthgen, N.; Klein, A.-M. Functional complementarity and specialisation: The role of biodiversity in plant–pollinator interactions. Basic Appl. Ecol. 2011, 12, 282–291. [Google Scholar] [CrossRef]
  8. Nicholls, C.; Altieri, M. Plant biodiversity enhances bees and other insect pollinators in agroecosystems. A review. Agron. Sustain. Dev. 2013, 33, 257–274. [Google Scholar] [CrossRef] [Green Version]
  9. Vaudo, A.D.; Tooker, J.F.; Grozinger, C.M.; Patch, H.M. Bee nutrition and floral resource restoration. Curr. Opin. Insect Sci. 2015, 10, 133–141. [Google Scholar] [CrossRef] [Green Version]
  10. Free, J.B. Insect Pollination of Crops, 2nd ed.; Academic Press: London, UK, 1993; 684p. [Google Scholar]
  11. Garibaldi, L.A.; Carvalheiro, L.G.; Leonhardt, S.D.; Aizen, M.A.; Blaauw, B.R.; Isaacs, R.; Kuhlmann, M.; Kleijn, D.; Klein, A.M.; Kremen, C.; et al. From research to action: Enhancing crop yield through wild pollinators. Front. Ecol. Environ. 2014, 12, 439–447. [Google Scholar] [CrossRef] [Green Version]
  12. Blaauw, B.R.; Isaacs, R. Flower plantings increase wild bee abundance and the pollination services provided to a pollination-dependent crop. J. Appl. Ecol. 2014, 51, 890–898. [Google Scholar] [CrossRef]
  13. Williams, N.M.; Ward, K.L.; Pope, N.; Isaacs, R.; Wilson, J.K.; May, E.A.; Ellis, J.; Daniels, J.C.; Pence, A.; Ullmann, K.S.; et al. Native wildflower plantings support wild bee abundance and diversity in agricultural landscapes across the United States. Ecol. Appl. 2015, 25, 2119–2131. [Google Scholar] [CrossRef] [Green Version]
  14. Amy, C.; Noël, G.; Hatt, S.; Uyttenbroeck, R.; Van de Meutter, F.; Genoud, D.; Francis, F. Flower Strips in Wheat Intercropping System: Effect on Pollinator Abundance and Diversity in Belgium. Insects 2018, 9, 114. [Google Scholar] [CrossRef] [PubMed] [Green Version]
  15. Pereira, A.L.C.; Taques, T.C.; Valim, J.O.S.; Madureira, A.P.; Campos, W.G. The management of bee communities by intercropping with flowering basil (Ocimum basilicum) enhances pollination and yield of bell pepper (Capsicum annuum). J. Insect Conserv. 2015, 19, 479–486. [Google Scholar] [CrossRef]
  16. Morandin, L.A.; Kremen, C. Hedgerow restoration promotes pollinator populations and exports native bees to adjacent fields. Ecol. Appl. 2013, 23, 829–839. [Google Scholar] [CrossRef] [Green Version]
  17. Musa, A.K.; Liadi, M.T.; Adegbite, O.R. Impact of honey bees (Apis mellifera adansonii) (Hymenoptera: Apidae) pollination on pod and seed set of cowpea (Vigna unguiculata L. Walp) in Ilorin, Southern Guinea Savanna of Nigeria. J. Agric. Res. 2013, 1, 83–87. [Google Scholar]
  18. Fohouo, F.-N.; Albert, N.; Kengni, B. Pollination and yield responses of cowpea (Vigna unguiculata L. Walp.) to the foraging activity of Apis mellifera adansonii (Hymenoptera: Apidae) at Ngaoundéré (Cameroon). Afr. J. Biotechnol. 2009, 8, 9. [Google Scholar]
  19. Dingha, B.N.; Jackai, L.E.; Amoah, B.A.; Akotsen-Mensah, C. Pollinators on Cowpea Vigna unguiculata: Implications for Intercropping to Enhance Biodiversity. Insects 2021, 12, 54. [Google Scholar] [CrossRef]
  20. Vaz, C.G.; De Oliveira, D.; Ohashi, O.S. Pollinator Contribution to the Production of Cowpea in the Amazon. HortScience 1998, 33, 1157–1159. [Google Scholar] [CrossRef] [Green Version]
  21. Jackai, L.E.N.; Daoust, R.A. Insect pests of cowpeas. Annu. Rev. Entomol. 1986, 1, 95–119. [Google Scholar] [CrossRef]
  22. Sreerama, Y.N.; Sashikala, V.B.; Pratape, V.M.; Singh, V. Nutrients and antinutrients in cowpea and horse gram flours in comparison to chickpea flour: Evaluation of their flour functionality. Food Chem. 2012, 131, 462–468. [Google Scholar] [CrossRef]
  23. Enyiukwu, D.N.; Amadioha, A.C.; Ononuju, C.C. Nutritional Significance of Cowpea Leaves for Human Consumption. Greener Trends Food Sci. Nutr. 2018, 1, 1–10. [Google Scholar] [CrossRef]
  24. Hall, A.E.; Frate, C.A. Blackeye Bean Production in California; University of California Division of Agriculture and Natural Resources: Oakland, CA, USA, 1996; 24p. [Google Scholar]
  25. Ehlers, J.D.; Hall, A.E. Cowpea (Vigna unguiculata L Walp). Field Crops Res. 1997, 53, 187–204. [Google Scholar] [CrossRef]
  26. Leskey, T.C.; Hamilton, G.C.; Nielsen, A.L.; Polk, D.F.; Rodriguez-Saona, C.; Bergh, J.C.; Herbert, D.A.; Kuhar, T.P.; Pfeiffer, D.; Dively, G.P.; et al. Pest Status of the Brown Marmorated Stink Bug, Halyomorpha Halys in the USA. Outlooks Pest Manag. 2012, 23, 218–226. [Google Scholar] [CrossRef] [Green Version]
  27. Jackai, L.E.; Dingha, B.N.; Worku, M. Cowpea—An Ancient Crop for Modern Challenges. Scientia. 2018. Available online: http://www.scientia.global/cowpea-an-ancient-crop-for-modern-challenges/ (accessed on 15 March 2020).
  28. Dingha, B.N.; Nyaupane, S.; Jackai, L.E. Laboratory Assessment of Host Plant Selection of the Brown Marmorated Stink Bug (Halyomorpha halys). Am. J. Entomol. 2009, 4, 26–34. [Google Scholar] [CrossRef]
  29. Dahmardeh, M.; Ghanbari, A.; Syasar, B.; Ramrodi, M. Intercropping maize (Zea mays L.) and cowpea (Vigna unguiculata L.) as a whole-crop forage: Effects of planting ratio and harvest time on forage yield and quality. J. Food Agric. Environ. 2009, 7, 505–509. [Google Scholar]
  30. Adeniyan, O.N.; Ayoola, O.T.; Ogunleti, D.O. Evaluation of cowpea cultivars under maize and maize-cassava based in-tercropping systems. Afr. J. Plant Sci. 2011, 5, 570–574. [Google Scholar]
  31. Maduwanthi, A.K.M.R.B.; Karunarathna, B. Biological and economic benefit of okra (Abelmoschus. esculentus L.) cowpea (Vigna unguiculata L. Walp) intercropping in Sandy Regosol. Middle East J. Agri. Res. 2019, 8, 28–34. [Google Scholar]
  32. John, S.A.; Mini, C.B. Biological efficiency of intercropping in okra (Abelmoschus esculentus (L.) Moench). J. Trop. Agric. 2005, 43, 33–36. [Google Scholar]
  33. Ajayi, O.E.; Adeoye, B.I.; Shittu, A.O. Economics analysis of intercropping okra with legumes. J. Agric. Sci. 2017, 62, 193–202. [Google Scholar] [CrossRef]
  34. Olasantan, F.O. Response of tomato and okra to nitrogen fertilizer in sole cropping and intercropping with cowpea. J. Hortic. Sci. 1991, 66, 191–199. [Google Scholar] [CrossRef]
  35. Senaratne, R.; Liyanage, N.D.L.; Soper, R.J. Nitrogen fixation of and N transfer from cowpea, mungbean and groundnut when intercropped with maize. Fertil. Res. 1995, 40, 41–48. [Google Scholar] [CrossRef]
  36. Kemble, J.M.; Quesada-Ocampo, L.M.; Ivors, K.L.; Jennings, K.M.; Walgenbach, J.F. Southeastern United States Virginia Cooperative Extension, 2014 Vegetable Crop Handbook. 2014. Available online: https://vtechworks.lib.vt.edu/bitstream/handle/10919/55798/AREC-66.pdf?sequence=1 (accessed on 15 March 2020).
  37. Shannon, C.E.; Weaver, W.W. The Mathematical Theory of Communications; University of Illinois Press: Urbana, IL, USA, 1963; 117p. [Google Scholar]
  38. Spellerberg, I.F.; Fedor, P.J. A tribute to Claude Shannon (1916–2001) and a plea for more rigorous use of species richness, species diversity and the ‘Shannon-Wiener’ Index. Glob. Ecol. Biogeogr. 2003, 12, 177–179. [Google Scholar] [CrossRef] [Green Version]
  39. Dan, S.; Murungi, L.K.; Kioko, E. Diversity and abundance of insect pollinators and their effect on yield and quality of cowpea and cucumber in Makueni, Kenya. Afr. J. Hortic. Sci. 2019, 16, 43–54. [Google Scholar]
  40. Geroff, R.K.; Gibbs, J.; McCravy, K.W. Assessing bee (Hymenoptera: Apoidea) diversity of an Illinois restored tallgrass prairie: Methodology and conservation considerations. J. Insect Conserv. 2014, 18, 951–964. [Google Scholar] [CrossRef]
  41. Shapiro, L.H.; Tepedino, V.J.; Minckley, R.L. Bowling for bees: Optimal sample number for “bee bowl” sampling transects. J. Insect Conserv. 2014, 18, 1105–1113. [Google Scholar] [CrossRef]
  42. Campbell, J.W.; Hanula, J.L. Efficiency of Malaise traps and colored pan traps for collecting flower visiting insects from three forested ecosystems. J. Insect Conserv. 2007, 11, 399–408. [Google Scholar] [CrossRef]
  43. Wheelock, M.J.; O’Neal, M.E. Insect Pollinators in Iowa Cornfields: Community Identification and Trapping Method Analysis. PLoS ONE 2016, 11, e0143479. [Google Scholar] [CrossRef] [Green Version]
  44. Wousla, E.N.; Andargie, M.; Pasquet, R.S.; Mondon, M.; Menez, V.; Cochin, C.; Paul, L.; Pardon, L.; Roubaud, M. Is bigger better? Apidae (Xylocopinae), megachilidae and cowpea (Vigna unguiculata) pollination. Plant Breed. 2019, 139, 156–166. [Google Scholar] [CrossRef]
  45. Quinn, N.F.; Brainard, D.C.; Szendrei, Z. Floral strips attract beneficial insects but do not enhance yield in cucumber fields. J. Econ. Entomol. 2017, 110, 517–524. [Google Scholar] [CrossRef] [PubMed]
  46. Conner, J.K.; Rush, S. Effects of flower size and number on pollinator visitation to wild radish, Raphanus raphanistrum. Oecologia 1996, 105, 509–516. [Google Scholar] [CrossRef]
  47. Bell, G.; Hamilton, W.D. On the function of flowers. Proc. R. Soc. Lond. Ser. B Biol. Sci. Lond. 1985, 224, 223–265. [Google Scholar]
  48. Kawarasaki, S.; Hori, Y. Effect of flower number on the pollinator attractiveness and the threshold plant size for flowering in Pertya triloba (Asteraceae). Plant Species Biol. 1999, 14, 69–74. [Google Scholar] [CrossRef]
  49. Van Emden, H.F. Plant diversity and natural enemy efficiency in agroecosystems. In Critical Issues in Biological Control, 2nd ed.; Mackauer, M., Ehler, L.E., Roland, J., Eds.; Intercept Ltd.: Andover, UK, 1990; pp. 63–80. [Google Scholar]
  50. State Climate Office of North Carolina, NC State University. Cardinal [Data Retrieval Interface]. Available online: https://products.climate.ncsu.edu/cardinal/request (accessed on 14 May 2021).
  51. Bommarco, R.; Kleijn, D.; Potts, S.G. Ecological intensification: Harnessing ecosystem services for food security. Trends Ecol. Evol. 2013, 28, 230–238. [Google Scholar] [CrossRef] [PubMed]
  52. Tscharntke, T.; Clough, Y.; Wanger, T.C.; Jackson, L.; Motzke, I.; Perfecto, I.; Vandermeer, J.; Whitbread, A. Global food security, biodiversity conservation and the future of agricultural intensification. Biol. Conserv. 2012, 151, 53–59. [Google Scholar] [CrossRef]
  53. Angbanyere, M.A.; Baidoo, P.K. The Effect of Pollinators and Pollination on Fruit Set and Fruit Yield of Okra (Abelmoschus esculentus (L.) Moench) in the Forest Region of Ghana. Am. J. Exp. Agric. 2014, 4, 985–995. [Google Scholar] [CrossRef]
  54. Stanghellini, M.S.; Ambrose, J.T.; Schulthesis, J.R. Seed production in watermelon: A comparison between two commercially available pollinators. HortScience 1998, 33, 28–30. [Google Scholar] [CrossRef] [Green Version]
  55. Campbell, J.W.; Stanley-Stahr, C.; Bammer, M.; Daniels, J.C.; Ellis, J.D. Contribution of bees and other pollinators to watermelon (Citrullus lanatus Thunb.) pollination. J. Apic. Res. 2019, 58, 597–603. [Google Scholar] [CrossRef]
  56. Shuler, R.E.; Roulston, T.H.; Farris, G.E. Farming practices influence wild pollinator populations on squash and pumpkin. J. Econ. Entomol. 2005, 98, 790–795. [Google Scholar] [CrossRef] [PubMed]
  57. Songa, J.M.; Jiang, N.; Schulthess, F.; Omwega, C. The role of intercropping different cereal species in controlling lepidopteran stemborers on maize in Kenya. J. Appl. Entomol. 2007, 131, 40–49. [Google Scholar] [CrossRef]
  58. Srinivasarao, M.; Ca, R.; Karlapudi, S.; Gudapaty, P.; Sekhar, S.M.; Vani, G.; Venkateswarlu, B. Intercropping for Management of Insect Pests of Castor, Ricinus communis, in the Semi—Arid Tropics of India. J. Insect Sci. 2012, 12, 14. [Google Scholar]
  59. Matteson, P.C. The effects of intercropping with cereals and minimal permethrin applications on insect pests of cowpea and their natural enemies in Nigeria. Trop. Pest Manag. 1982, 28, 372–380. [Google Scholar] [CrossRef]
  60. McPherson, R.M.; Pitis, J.R.; Newsom, L.D.; Chapin, J.B.; Herzog, D.C. Incidence of Tachinid Parasitism of Several Stink Bug (Heteroptera: Pentatomidae) Species Associated with Soybean. J. Econ. Entomol. 1982, 75, 783–786. [Google Scholar] [CrossRef]
  61. Tillman, P.G.; Carpenter, J.E. Milkweed (Gentianales: Apocynaceae): A Farmscape Resource for Increasing Parasitism of Stink Bugs (Hemiptera: Pentatomidae) and Providing Nectar to Insect Pollinators and Monarch Butterflies. Environ. Entomol. 2014, 43, 370–376. [Google Scholar] [CrossRef] [PubMed]
  62. Cornelius, M.L.; Vinyard, B.T.; Gates, M.W. Use of Flowering Plants to Enhance Parasitism and Predation Rates on Two Squash Bug Species Anasa tristis and Anasa armigera (Hemiptera: Coreidae). Insects 2019, 10, 318. [Google Scholar] [CrossRef] [PubMed] [Green Version]
  63. Stopbmsb.org Management of Brown Marmorated Stink Bug in US Specialty Crops. Available online: http://www.stopbmsb.org/where-is-bmsb/ (accessed on 20 April 2021).
Figure 1. Pollinator abundance on cowpeas from direct visual counts (a), sticky traps (b), pan traps (c), and mean total from all sampling methods combined (d) in 2018 and 2019. For each year and within each graph, treatment means with the same letters are not significantly different (Tukey–Kramer Test, p > 0.05).
Sustainability 13 09612 g001
Figure 2. Pollinator abundance on pollinator-dependent crops (PDCs) from direct visual counts (a), sticky traps (b), pan traps (c), and all sampling methods combined (d) in 2018. For each crop and within each graph, treatment means with the same letters are not significantly different (Tukey–Kramer test, p < 0.05).
Sustainability 13 09612 g002
Figure 3. Pollinator abundance on pollinator-dependent crops (PDCs) from direct visual counts (a), sticky traps (b), pan traps (c), and all sampling methods combined (d) in 2019. For each crop and within each graph, treatment means with the same letters are not significantly different (Tukey–Kramer test, p < 0.05).
Sustainability 13 09612 g003
Figure 4. Total pollinators captured on cowpeas (a) and pollinator-dependent crops and control (b) in both years (2018 and 2019) during the entire study period. In subfigure (a), treatment means with the same letters are not significantly different (p > 0.05). In subfigure (b), within each crop, treatment means with the same letters are not significantly different (p > 0.05).
Sustainability 13 09612 g004
Figure 5. Total pollinators captured on cowpeas and each pollinator-dependent crop ((a) squash, (b) okra, and (c) watermelon)) in an intercropping system and control for the entire study period. For each graph, treatment means with the same letters are not significantly different (p > 0.05).
Sustainability 13 09612 g005
Figure 6. Weekly distribution of pollinators on cowpeas and pollinator-dependent crops for each intercrop treatment ((a) PPH + SOW + PPH treatment, (b) PPHWHIP + SOW + PPHWHIP treatment, and (c) WHIP + SOW + WHIP treatment)).
Sustainability 13 09612 g006
Figure 7. Beneficial insects and H. halys recorded on cowpeas planted solely or intercropped with pollinator-dependent crops for the entire study period. Treatment means with the same upper-case letters (for beneficial insects) or the same lower-case letters (H. halys) are not significantly different (p > 0.05).
Sustainability 13 09612 g007
Figure 8. Beneficial insects and H. halys recorded on pollinator-dependent crops planted solely or intercropped with cowpea for the entire study period. Treatment means with the same upper-case letters (for beneficial insects) or the same lower-case letters (H. halys) are not significantly different (p > 0.05).
Sustainability 13 09612 g008
Figure 9. Linear regression showing the relationships between crop yield and number of pollinators recorded on (a) sole squash (y = −12.8 + 0.3x; n = 8; r2 = 0.91; p = 0.0002), (b) squash intercropped with PPH cowpea (y = 15.6 + 0.01x; n = 8; r2 = 0.001; p = 0.94), (c) squash intercropped with PPH + WHIP cowpea (y = −27.9 + 0.22x; n = 8; r2 = 0.62; p = 0.02), and (d) squash intercropped with WHIP cowpea (y = 7.23 + 0.08x; n = 8; r2 = 0.05; p = 0.61).
Sustainability 13 09612 g009
Figure 10. Linear regression showing the relationships between crop yield and number of pollinators recorded on (a) sole okra (y = 1.2 + 0.01x; n = 8; r2 = 0.45; p = 0.07), (b) okra intercropped with PPH cowpea (y = −0.8 + 0.02x; n = 8; r2 = 0.22; p = 0.24), (c) okra intercropped with PPH + WHIP cowpea (y = 3.3 − 0.003x; n = 8; r2 = 0.01; p = 0.78), and (d) okra intercropped with WHIP cowpea (y = 3.3 − 0.002x; n = 8; r2 = 0.003; p = 0.91).
Sustainability 13 09612 g010
Figure 11. Linear regression showing the relationships between crop yield and number of pollinators recorded on (a) sole watermelon (y = 4.8 − 0.03x; n = 8; r2 = 0.58; p = 0.03), (b) watermelon intercropped with PPH cowpea (y = 10.9 − 0.02x; n = 8; r2 = 0.03; p = 0.67), (c) watermelon intercropped with PPH + WHIP cowpea (y = 1.4 + 0.06x; n = 8; r2 = 0.12; p = 0.41), and (d) watermelon intercropped with WHIP cowpea (y = 12.2 − 0.03x; n = 8; r2 = 0.22; p = 0.25).
Sustainability 13 09612 g011
Table 1. The total number of insects recorded through direct visual counts on cowpea treatments and controls in 2018 and 2019.
OrderPollinator Type
(Common Name)
Treatments and Number of Pollinators (2018)Treatments and Number of Pollinators (2019)
PPH + SOW + PPHWHIP + SOW + WHIPPPHWHIP + SOW + PPHWHIPPPH-OnlyWHIP-OnlySOWPPH + SOW + PPHWHIP + SOW + WHIPPPHWHIP + SOW + PPHWHIPPPH-OnlyWHIP-OnlySOW
ApidaeBumble bee52632240529840227145108199626310
Carpenter bee3624168118414010
Honeybee20318222019710310058934249525923242
HymenopteraWasps26074135233809128981495753841718
LepidopteraButterfly and moth134143121159182202151752099410134
Total1159745897895416364224214401864953814104
(H′)1.361.361.331.401.350.981.081.121.191.081.171.26
(E)0.840.850.830.870.840.610.670.700.740.780.720.91
Table 2. The total number of insects captured on sticky traps on cowpea treatments and controls in 2018 and 2019.
Pollinator FamilyTreatments and Number of Pollinators (2018)Treatments and Number of Pollinators (2019)
PPH + SOW
+ PPH
WHIP + SOW
+ WHIP
PPHWHIP
+ SOW +
PPHWHIP
PPH-OnlyWHIP-OnlySOWPPH + SOW
+ PPH
WHIP + SOW
+ WHIP
PPHWHIP
+ SOW +
PPHWHIP
PPH-OnlyWHIP-OnlySOW
Apidae14923722112159872
Crabronidae550673579476383392134169127726834
Halictidae101910181114642654679606644662369377190
Pyralidae2522341516456677772934153
Tachinidae499544444636323422761757457739514595339725661182
Vespidae47747841348616716023619217920
Total665062406464441533652980556250165706406732311581
(H′)0.780.860.860.820.911.120.660.760.710.630.740.84
(E)0.430.480.480.460.510.620.370.420.400.350.410.47
Table 3. The total number of insects captured in pan traps on cowpea treatments and controls in 2018 and 2019.
Pollinator FamilyTreatments and Number of Pollinators (2018)Treatments and Number of Pollinators (2019)
PPH + SOW + PPHWHIP + SOW
+ WHIP
PPHWHIP
+ SOW +
PPHWHIP
PPH-OnlyWHIP-OnlySOWPPH + SOW
+ PPH
WHIP + SOW
+ WHIP
PPHWHIP
+ SOW +
PPHWHIP
PPH-OnlyWHIP-OnlySOW
Andrenidae16201981523161103
Apidae77727625308222342414157
Crabronidae138165112797320689373686819
Formicidae3733382120119153324
Halictidae669787740407465556410489420228254118
Tachinidae400649535210328501377397378216215197
Vespidae79634452503124922717819017443
Total1416178915648029811332112812511077720728391
(H′)1.401.321.301.351.321.341.331.381.321.411.391.25
(E)0.720.680.670.690.680.690.680.710.700.720.770.64
Table 4. Mean (+ SE) yield (per 5 m row) of pollinator-dependent crops (kg) intercropped with cowpea and control (no cowpea) in 2018, 2019, and combined for both years. For each crop and within each time period, means followed by the same letters are not significantly different (p > 0.05).
TreatmentYield of Pollinator-Dependent Crop (kg)
SquashOkraWatermelon
2018PPH + PPH29.8 ± 5.84.1 ± 0.45.5 ± 1.0 a
WHIP + WHIP34.6 ± 1.83.6 ± 0.54.9 ± 0.7 a
PPH + WHIP38.3 ± 4.83.0 ± 0.45.7 ± 1.6 a
CONTROL21.2 ± 4.43.1 ± 0.11.2 ± 0.4 b
2019PPH + PPH4.6 ± 0.6 a2.4 ± 0.511.5 ± 1.9 a
WHIP + WHIP4.4 ± 0.5 a2.5 ± 0.510.1 ± 1.6 a
PPH + WHIP5.8 ± 0.6 a2.6 ± 0.412.2 ± 1.9 a
CONTROL1.6 ± 0.2 b2.0 ± 0.33.8 ± 0.3 b
Mean of both yearsPPH + PPH17.2 ± 3.13.2 ± 0.38.5 ± 1.2 a
WHIP + WHIP19.5 ± 1.03.0 ± 0.57.5 ± 1.1 a
PPH + WHIP22.0 ± 2.52.8 ± 0.49.0 ± 0.2 a
CONTROL11.4 ± 2.22.6 ± 0.22.5 ± 0.1 b
Percent change in intercrop vs. control +26.5% +7.1% +53.7%
Publisher’s Note: MDPI stays neutral with regard to jurisdictional claims in published maps and institutional affiliations.