2.2. Data Sources
A topography, land-use map, soil map and weather data are essential inputs for a SWAT simulation. The precipitation, minimum and maximum air temperature records are crucial to run the SWAT project [
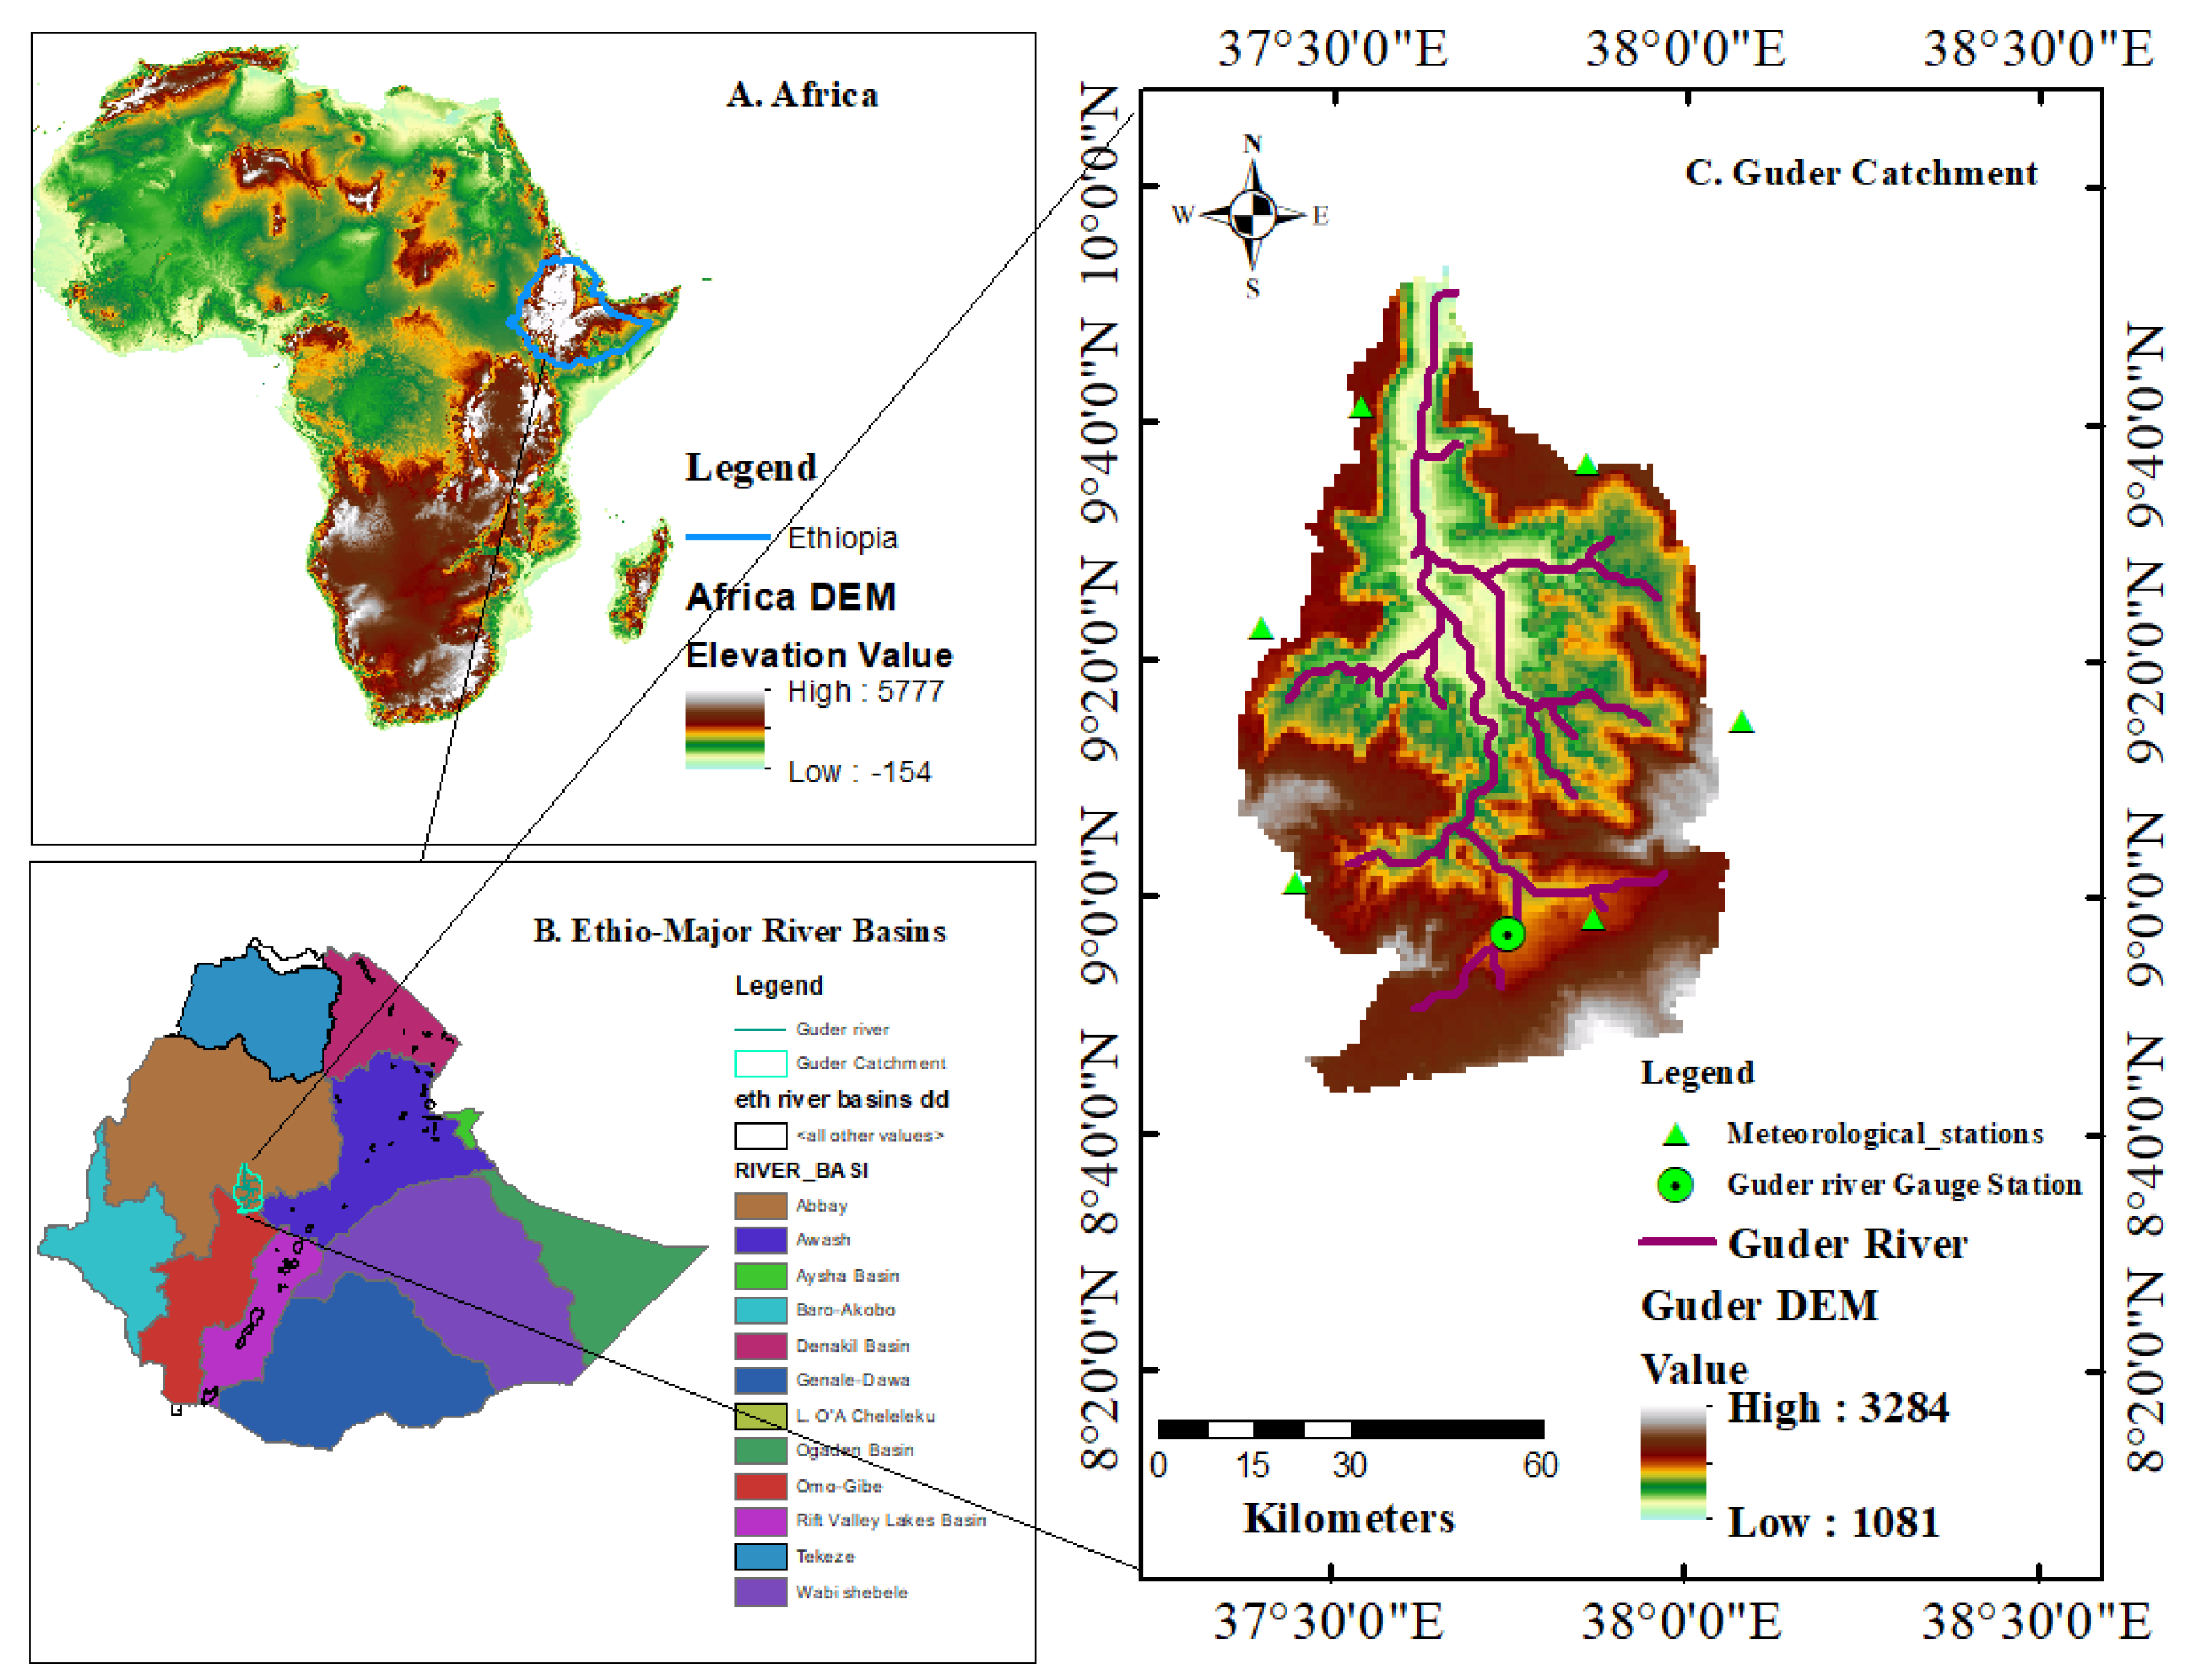
20]. These two meteorological records, daily rainfall and air temperature (1983–2016) from 6 stations, were collected from Ethiopian MoWIE, the hydrology department at Guder River Basin stations, and data on land use soil were collected from the department of the GIS. The Shuttle Radar Topography Mission (SRTM) has access to the shapefile data of every country, and the Digital Elevation Model of Guder Catchment was downloaded from the Consortium for Spatial Information (CGIR-CSI) website (
http://srtm.csi.cgiar.org/ (accessed on 25 January 2020)).
The daily streamflow/discharge records between 1983 and 2001 from the Guder river station were taken from the Ethiopian MoWIE. The Upper Abbay Basin region (including Guder Catchment) has a small number of meteorological and hydrological stations [
21].
2.3. SWAT Model Principle and Setup
Before creating the SWAT project setup, the Digital Elevation Model shapefile was projected on an arc map with Ethiopian projection UTM Zone 37 N. The SWAT model uses HRU to identify the spatially different distribution of land use or land cover (
Figure 3) to the soil type in the basin. HRUs are well defined independently for every sub-basin during the SWAT project building, centered on land use, soil type and slope in a definite sub-basin. The land use cover (
Table 1) and soil shapefile of Guder Catchment (
Figure 4) were overlapped and clipped to use for further hydrologic response unit definition.
The Hydrologic Response Unit (HRU) definition in the Arc-SWAT aids in bringing the land use, soils and slope map to the SWAT project. The watershed that Arc-SWAT delineates in the watershed delineation section and land use and soil layers clipped from using the Arc Map on Arc GIS were overlapped. After re-allocation, finally, the whole watershed region in a Guder Catchment remained altered into Hydrologic Response Units with a total of 33 sub-basins.
Due to its effects on plant development and the flow of sediments, nutrients, pesticides and pathogens across the watershed region, water balance is the primary driving factor behind every process in the SWAT model [
22]. In SWAT simulation, the equation of water balances in the base of the land phase hydrologic cycle that can be defined as the formula for the temporary water balance applied to the movement of water in the soil is described in the following equation:
where SW
t is the final soil water content (mm); SW
o—the initial soil water content on the day
i (mm);
t—the time (days);
Rday—the amount of precipitation on a day
i (mm);
Qsurf—the amount of surface runoff on the day
i (mm);
Ea—the amount of evapotranspiration on the day
i (mm);
Wseep—the amount of water entering the vadose zone from the soil profile on the day
i (mm); and
Qgw is the amount of return flow on the day
i (mm).
SWAT deals with the Soil Conservation Service (SCS) curve number equation and the Green and Ampt infiltration methods [
23]. SWAT uses three methods to estimate the potential evapotranspiration (PET): Priestly–Taylor, Penman–Monteith and Hargreaves methods [
24]. These approaches’ input data requirements are different. Solar radiation, air temperature, humidity and wind speed are required for the Penman–Monteith technique; solar radiation, air temperature and relative humidity are required for the Priestley–Taylor technique, and only air temperature is required for the Hargreaves method, which was chosen in this study.
SWAT-CUP (2012 Versions) is a computer program used to integrate various calibrations/uncertainty analysis programs to arc SWAT tools for calibration, validation and sensitivity analysis using the same interface. For this particular study, the Sequential Uncertainty Fitting version 2 (SUFI-2) algorithm was selected. The highest sensitive and significant stream discharge parameters were selected for modeling purposes at Guder Catchment. These parameters were collected from the research performed at the Abbay Basin and from the software developer manual [
25,
26].
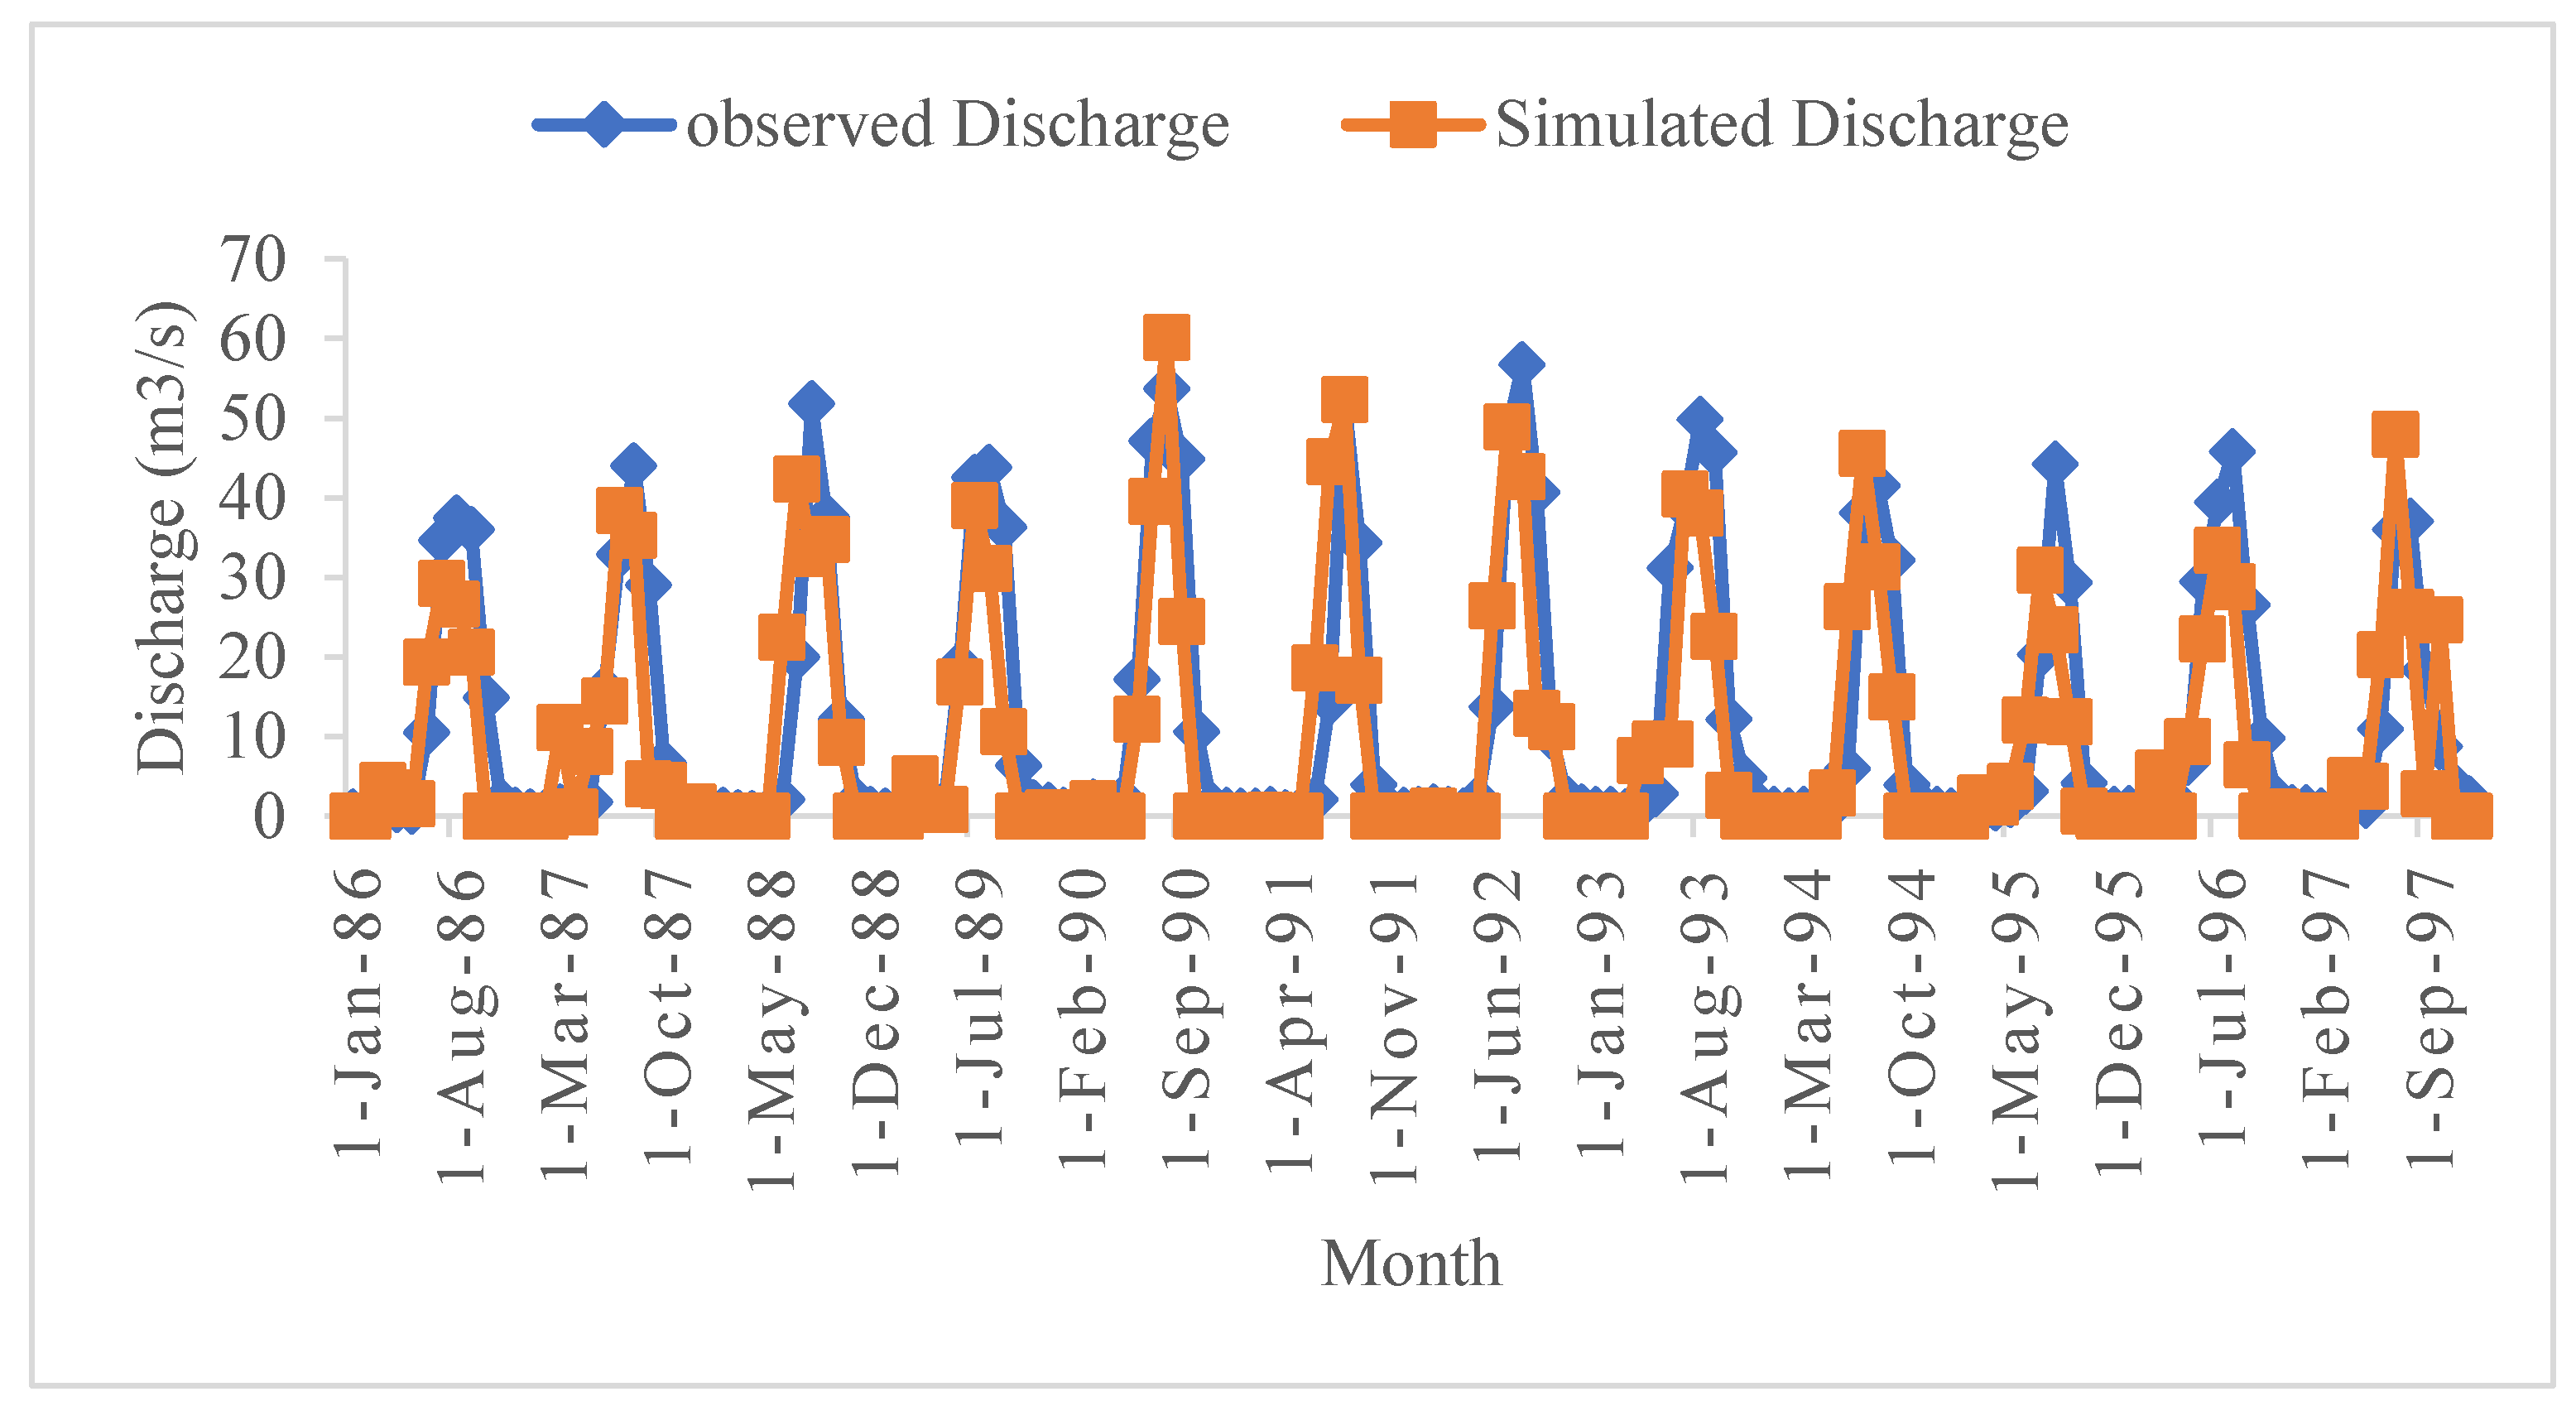
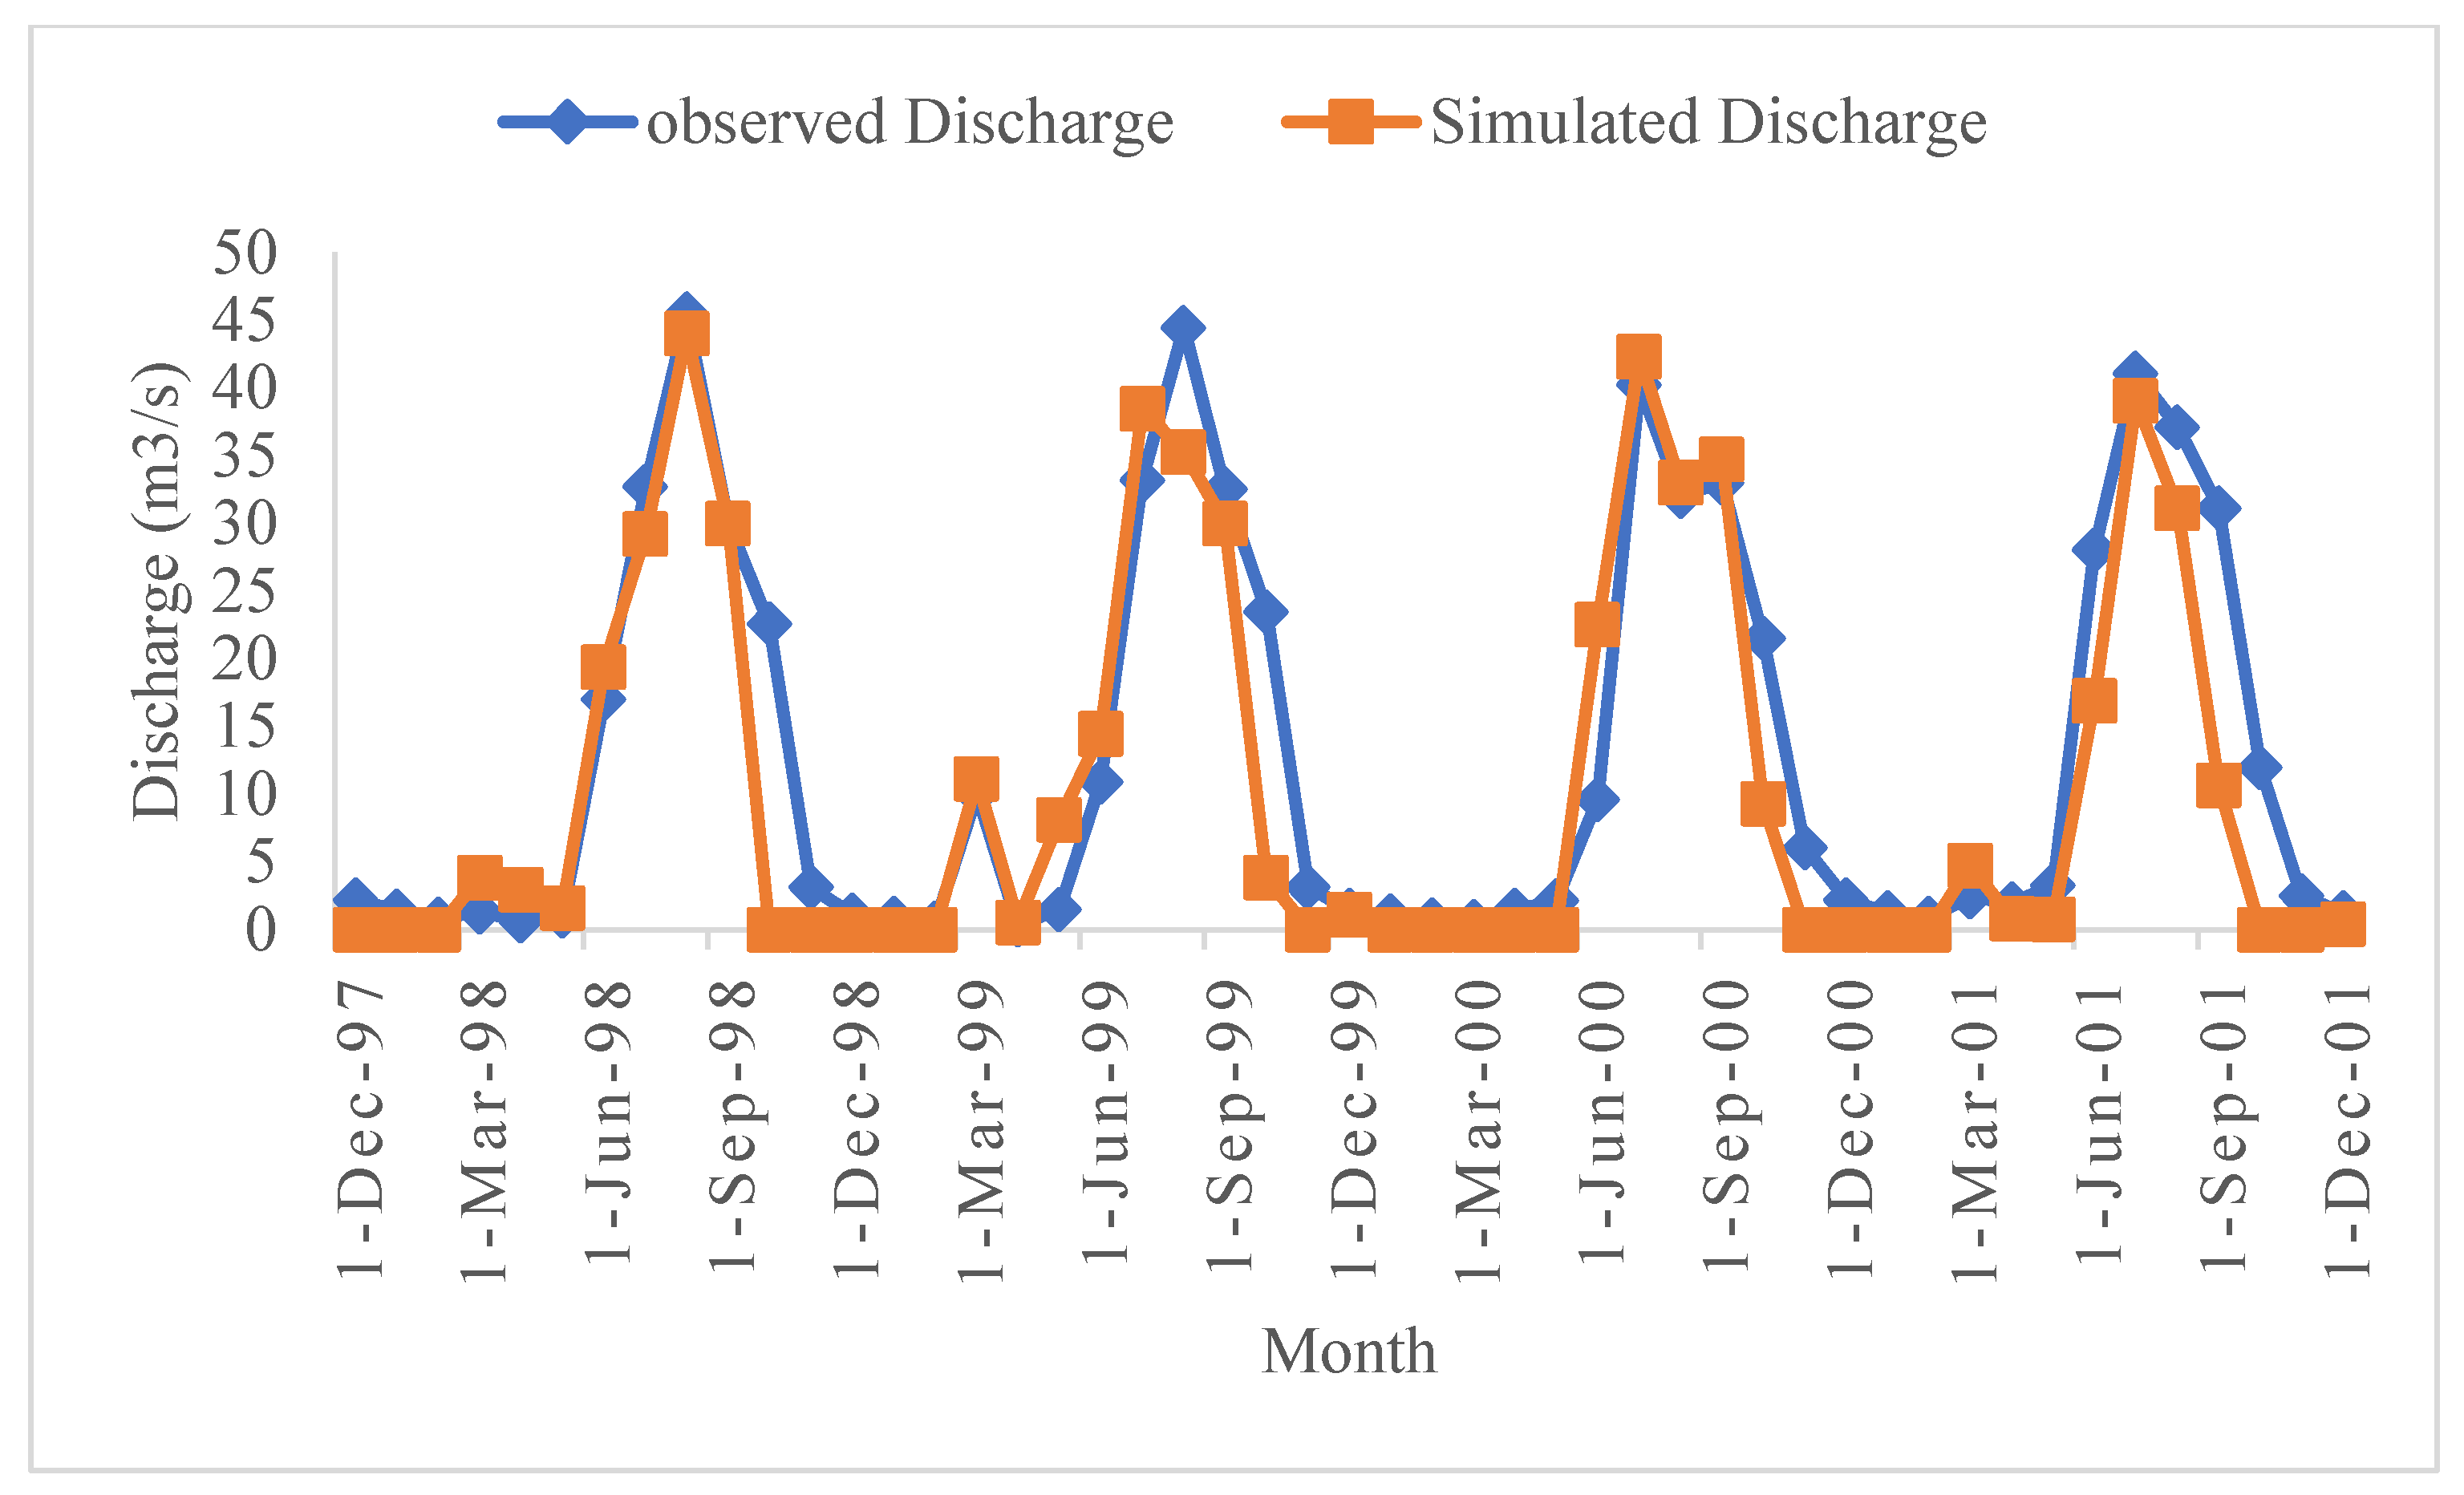
Hydrological models are usually calibrated at longer times (monthly, seasonally, or annually) than their daily computing time (due to improved calibration, less processing requirements and the lack of reliable temporally fine data on the download observed (particularly in developing countries)) [
27]. On the monthly time series for 19 years (1983–2001), including a three-year warm-up period, the calibration and validation of the model using the SUFI-2 algorithm program in the SWAT-Cup, applying the objective functions Nash–Sutcliffe Efficiency (NSE) and R
2, were performed. The streamflow data from 1986 to 1997 were used for calibration, and from 1998 to 2001 were used for validation. NSE [
18] remains a commonly used and possibly reliable statistic for evaluating the goodness of fit of the hydrological model, and the ranges of the value are from 1 (best) to (−∞) negative infinity. PBIAS was used to measure whether the simulated value was more or less than that of the measured data. The optimized PBIAS value is zero, and low values show modified models. Positive values show the model’s overestimation, while the model’s underestimation can be shown from the negative values.
2.4. Trend Analysis
The nonparametric (MK) Mann–Kendall and Sen’s slope estimates method was used in this analysis to evaluate and detect patterns in statistical time series databases based on annual results. The XLSTAT tools (XLSTAT 2019) were installed as an Excel extension, and MK on MATLAB provided an efficient, complete and user-friendly data analysis and statistical solution. The following formulas were used in MK-Test and SEN’s at MATLAB workspace to obtain and correct patterns in annual results.
where f(ti) is a continuously monotonous increase or decrease in time; the εi residues are considered to be of the same zero-mean distribution.
H1, as an alternative hypothesis, states that there is a rising or declining monotonic trend, is pitted against the null hypothesis of no trend, Ho, in which the observations xi are randomly ordered in time:
where
xj and
xk are the annual values in years’
j and
k,
j >
k, respectively.
The pth group denotes the number of data values with tp and the number of bound groups with q.
The true path of a current trend is determined by the nonparametric method of Sen (as the change each year). This implies that in equation five (5), the above f(t) equals the following:
where
Q is the slope and B is a constant.
where
j is greater than
k if the time series contains
n values
xj, then N =
n (
n − 1)/2 slope estimates
Qi. The median of these N
Qi values is Sen’s estimator of the slope. The
Qi values are arranged from smallest to largest in Sen’s estimator, with t = year first.
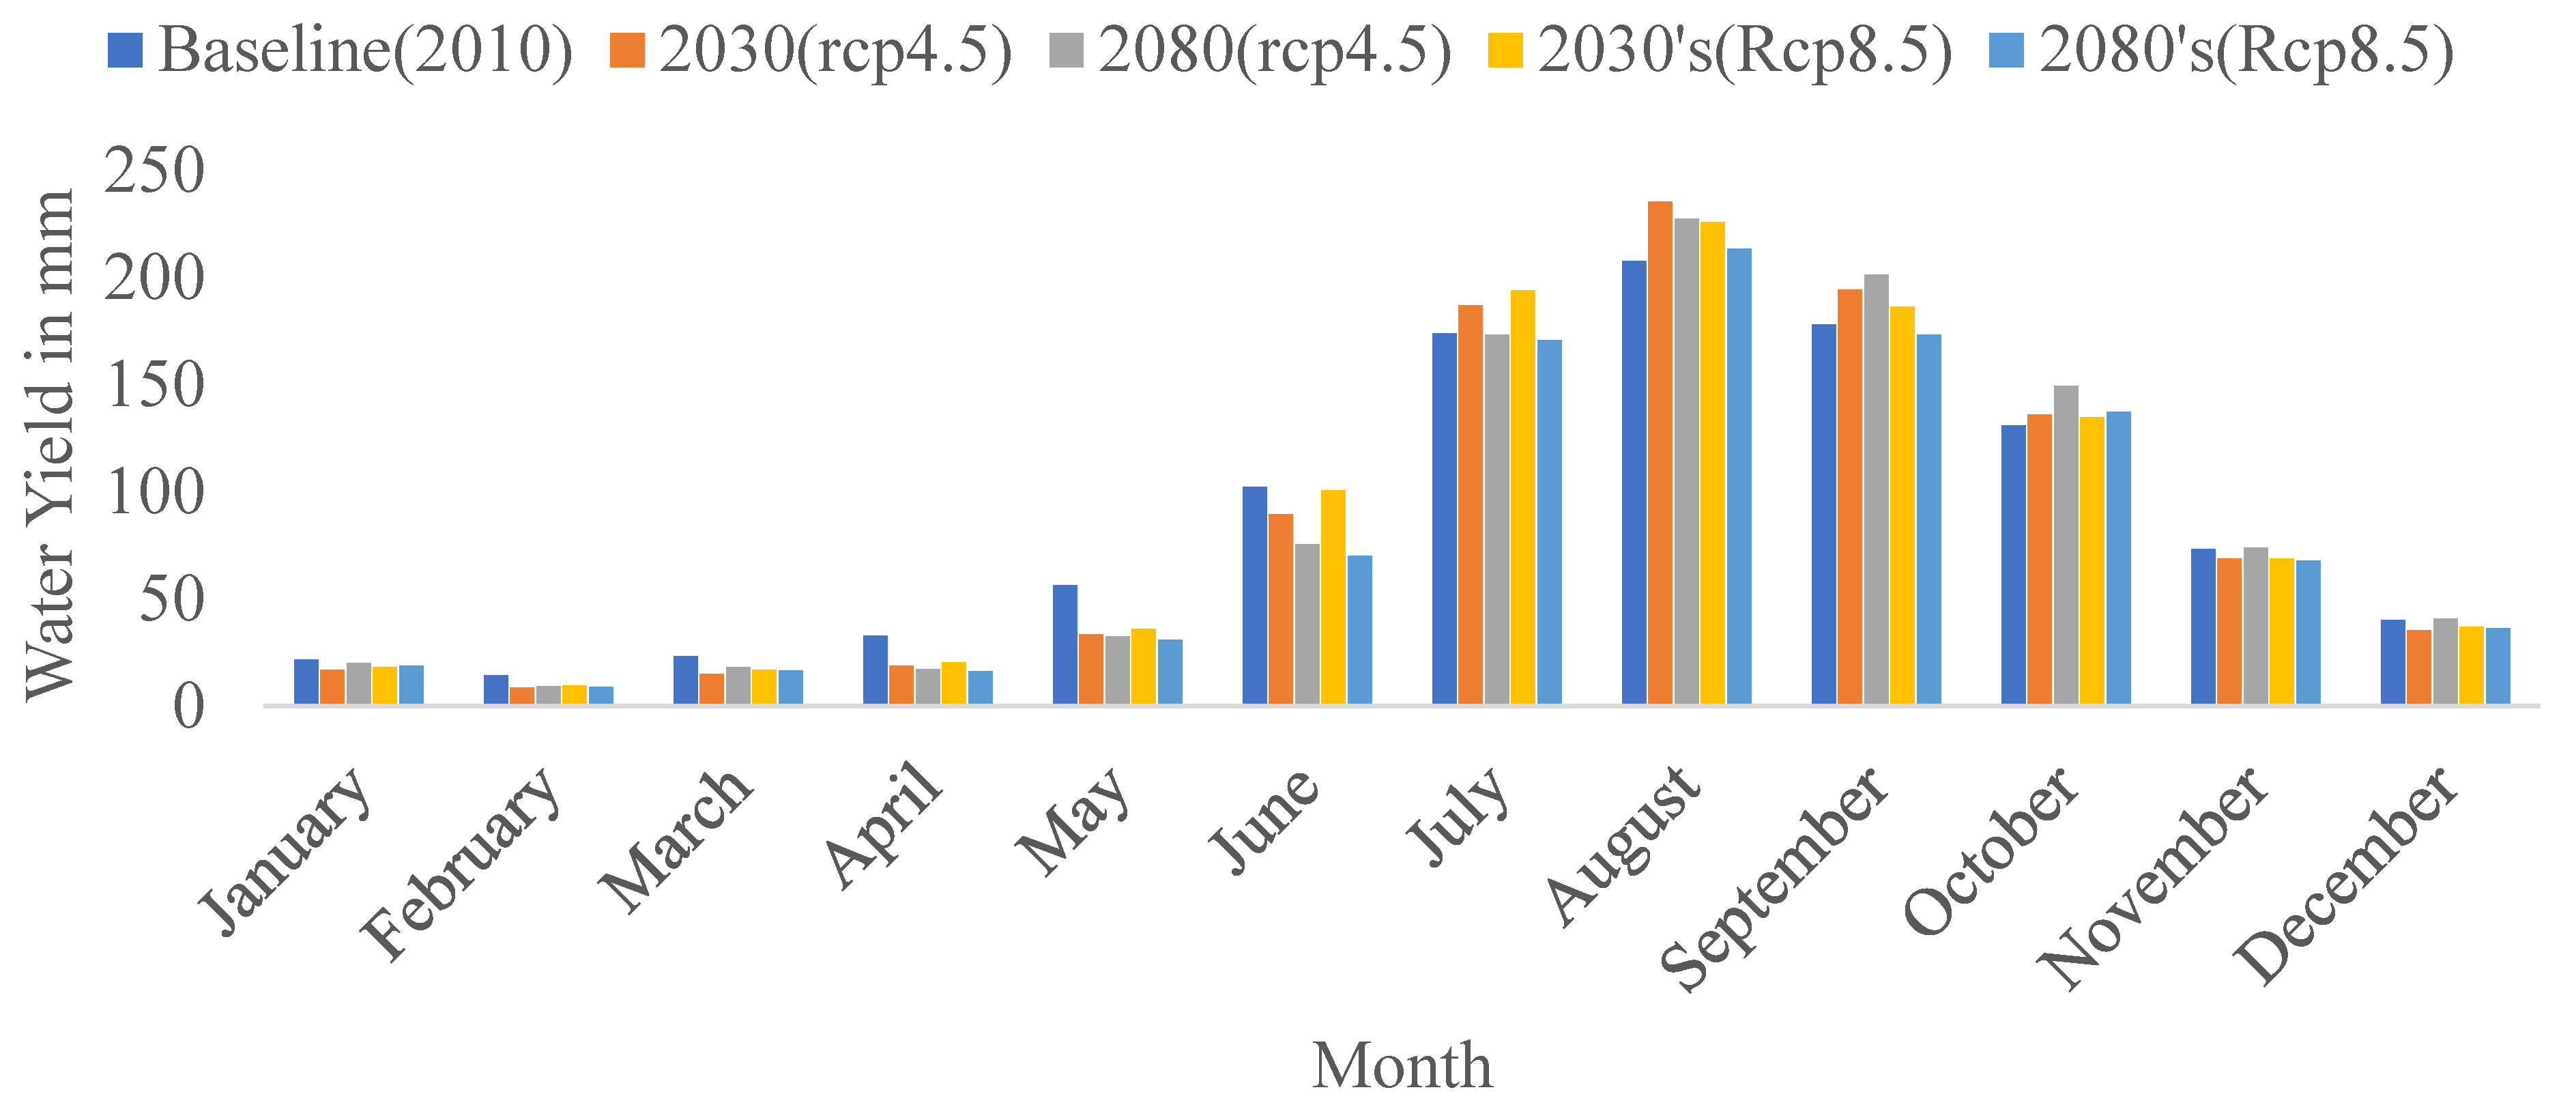
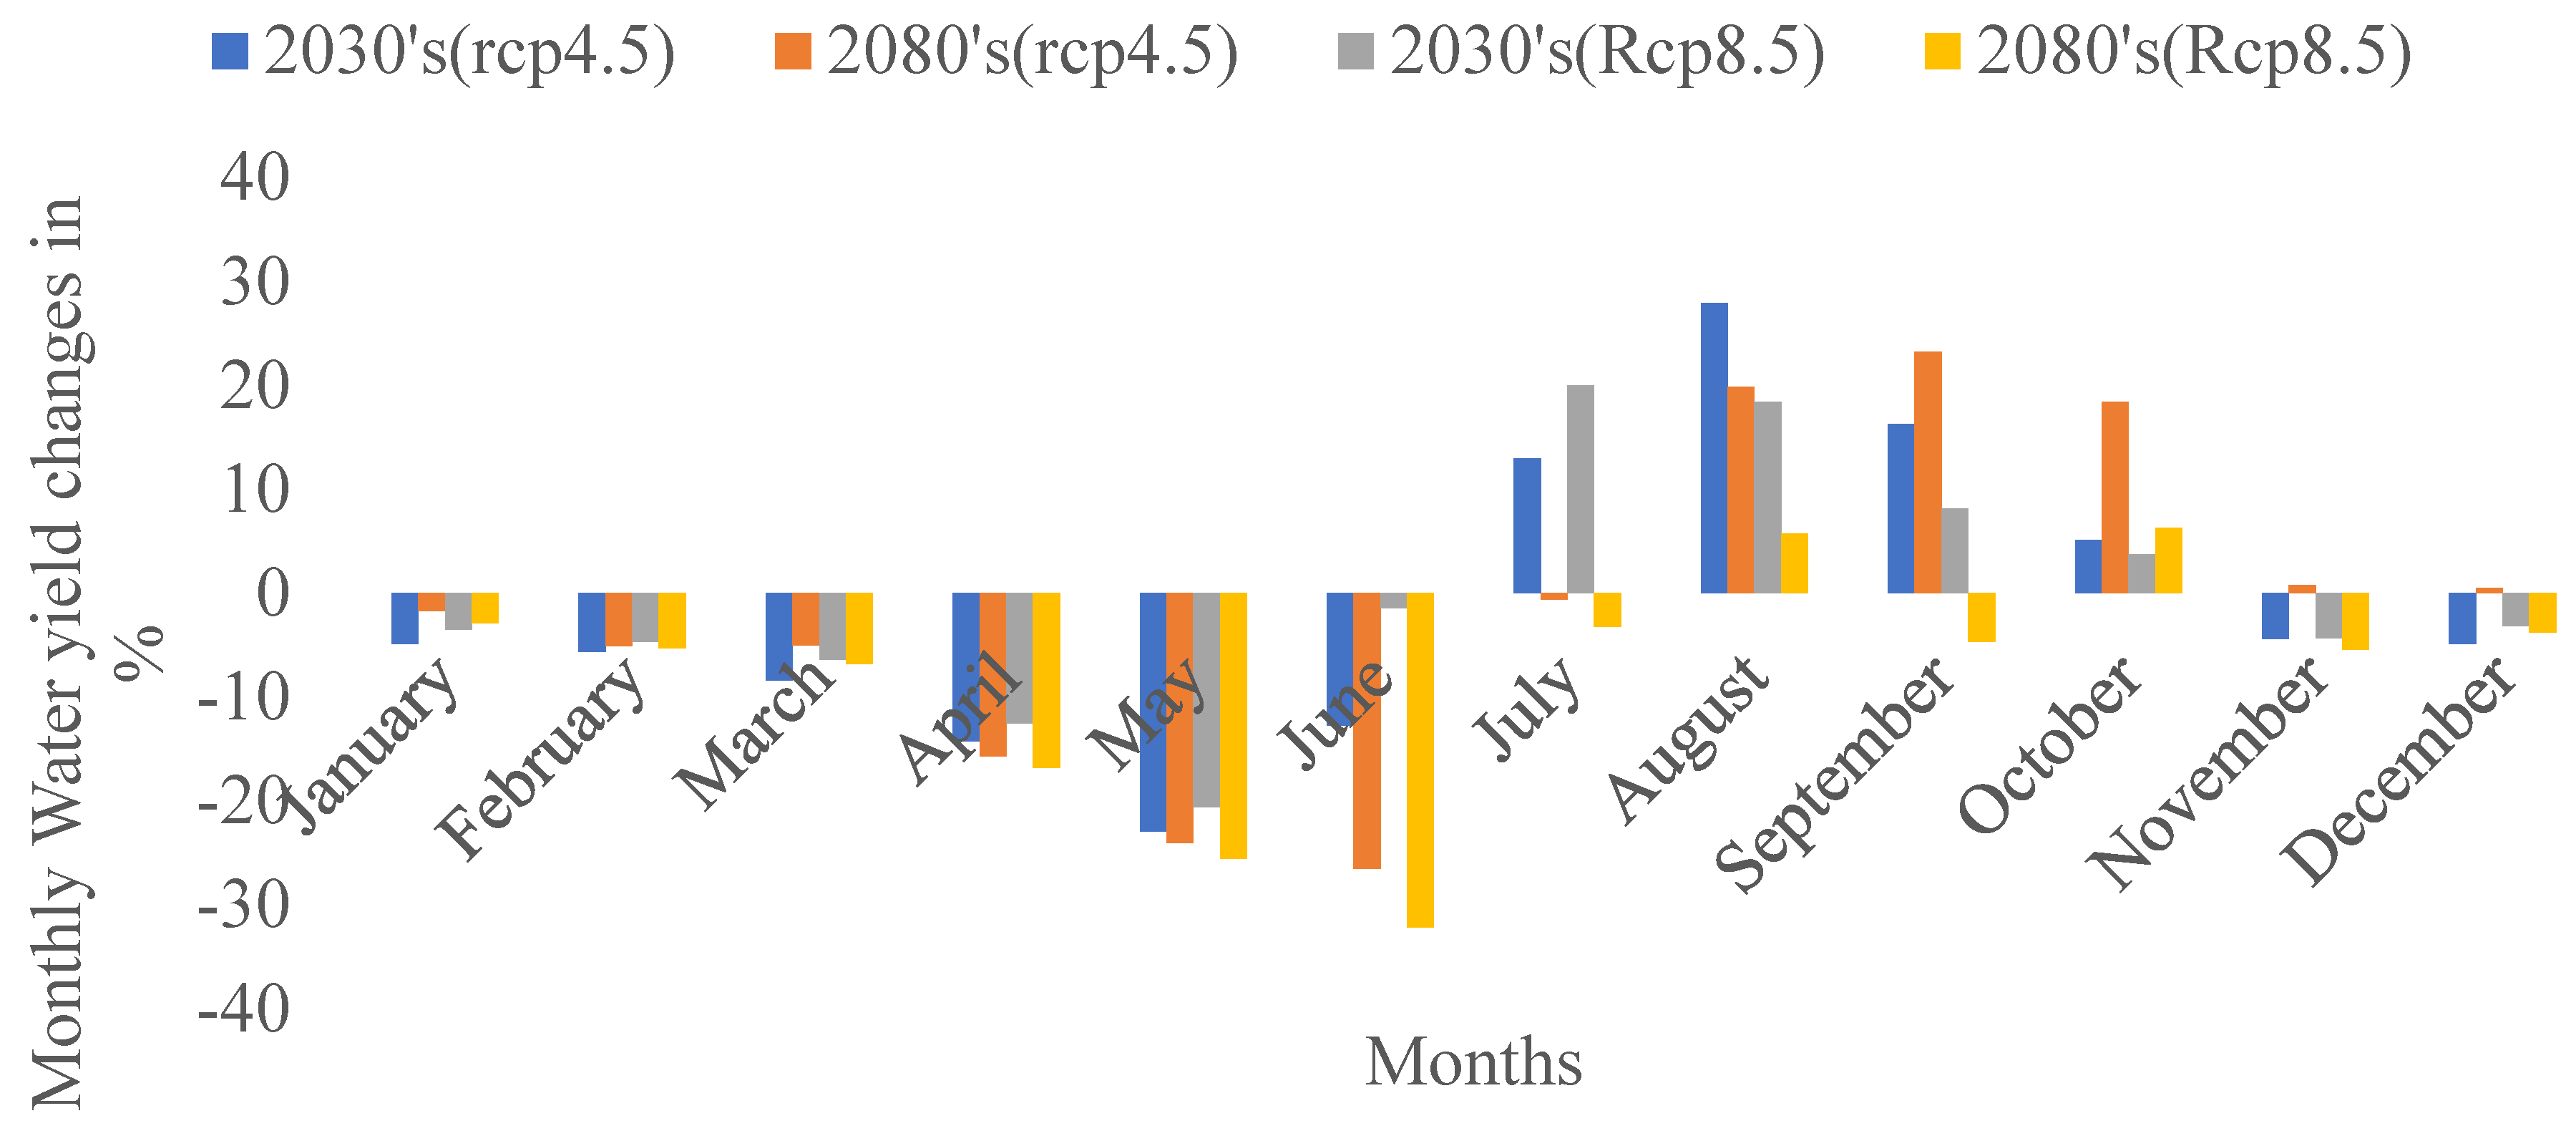
2.5. Climate Scenarios and Bias Correction
The World Climate Research Program’s Organized Coordinated Regional Climate Downscaling Experiment (CORDEX) program is currently providing an opportunity to develop regional climate predictions that could be used with high-resolution on a regional scale to assess possible climate change impacts. The study selected RCP 4.5 (stabilization scenario) reductions in energy consumption and RCP 8.5 (high emission scenario) indicative of high emission scenarios from the four RCP scenarios used in CMIP5, leading to radiative forcing values. Ethiopia’s RCM in CORDEX was statistically downscaled and utilized in hydrological modeling as input data. For use in climate impact modeling, this data set includes downscaled data for different forecasts with a spatial resolution of 0.5° ∗ 0.5° (approximately 50 ∗ 50 km). The historical database spans from 1 January 1976 to 31 December 2005, while future climate prediction scenario data (RCP 4.5 and RCP 8.5) span from 1 January 2021 to 31 December 2100. Each *.nc _le contains one climate variable (i.e., pr, tasmax and tasmin) that spans five years. Due to structural model errors and discretization and spatial averaging within grid cells, simulated climate data cannot be used as direct inputs to hydrologic models. On a standard time scale, to minimize the disparity between measured and modeled climate change, bias correction techniques are used so that hydrological simulations based on corrected climate simulation data comply with the simulations based on climate observations [
28].
The CMhyd tool was conceived to offer climate information simulated that could be used to decide where gages should be placed in a watershed model. As a result, climate model data for each gaging station position should be obtained and bias-corrected [
25]. The netCDF metadata are used by CMhyd to convert the precipitation and air temperature data into millimeters and degrees Celsius, respectively, and the climate model grid cells overlaying the gaging sites. Finally, CMhyd reads the netCDF file to extract time series from linked grid cells [
29].
Distribution mapping of precipitation and air temperature is intended to compare the distribution function of the RCM expected outcome values with the distribution function measured. This can be achieved by creating a transfer feature that changes the precipitation and air temperature distribution. According to [
28], distribution mapping is the most effective correction method. It corrects most statistical features and has the smallest deviation ranges when paired with the best overall mean fit. Thus, for this study, using CMhyd instruments for a selected position at the Guder Catchment, the data from the models were extracted and used for further analysis.


 ,
, 


