1. Introduction
Pavements are part of a complex system of airport infrastructures that contribute to determine safety and regularity of aviation operations. Given the extension of their surfaces (i.e., runways, taxiways, aprons), pavements construction and maintenance constitute an important economic investment. For this reason, the aerodrome operator needs to periodically assess their conditions and schedule rehabilitation to optimize the use of available budget. An extensive technical and scientific bibliography is available on these topics, including articles presenting case studies [
1,
2,
3] and books, the validity of which, for some of these, is now internationally recognized [
4].
Moreover, the need for systematic verification of the airport infrastructure is established by requirements and rules specified by the national and international aviation authorities: as established in the European Basic Regulation 2018/1139 [
5] issued by the European Council and Parliament, the aerodrome operator has to implement actions to monitor a series of functional and structural characteristics of the pavement that contribute to determining the effective operational status of the infrastructure. This condition is necessary to achieve the aerodrome certification issued by the national [
6] or international [
7] aviation authorities, and the Airport Pavement-Management System (APMS) is a valid instrument for airport managers to ensure compliance with safety standards [
8].
AMPS is the result of a systematic approach based on a deep knowledge of the structural and functional condition of the pavement, which allows to define technically and economically sustainable strategies; confronting the existing pavement conditions with an optimal scenario and a theoretical model, it is possible to define the serviceability condition and the associated level of safety and comfort.
Moreover, an APMS not only evaluates the present level of service of a pavement but also aims to predict its future condition using specific indicators; for example, it is possible to determine the life-cycle for a pavement by projecting the rate of deterioration defined by the observation of its performance during the previous years to the actual surveyed condition.
This perspective changes pavement-maintenance management from a traditional reactive approach to a proactive one. The first approach provides pavement replacement once significant structural damage has occurred and leads to more severe and expensive rehabilitation [
9], while the second approach aims for pavement preservation through the systematic implementation of less invasive and small-scale repairs on infrastructures before structural degradations occur.
The effectiveness of an APMS depends on the availability of recent data; updated data provides more appropriate indicators to describe the current pavement condition and to enable a correct, proactive approach.
The medium-term benefits coming from a proactive approach have to face with some initial disadvantages, such as implementation costs of the system and operation costs for data acquisition and processing, and time-consuming operations, such as survey and data processing.
Nevertheless, the implementation of the APMS is growing due to two facts: its economical and safety benefits are recognized worldwide, and APMS procedures have become a mandatory part of the airport manual [
10].
This study presents the monitored activities carried out to implement the APMS for the pavement network of Cagliari Airport and the obtained maintenance program. The principal phases of planning and execution of pavement surveys for data acquisition through the integration of several mapping techniques are presented, and the related definition of pavement-condition indicators used to evaluate the overall pavement conditions are illustrated.
2. Standards Review
The paved areas in the airport airside (runways, taxiways, and aprons) are subjected to different dynamic and static stresses depending on the aircraft loads and the number of repetitions that the pavement will actually bear. Consequently, the pavements present different structures, physical characteristics, and different level of distresses and deterioration depending on their function. The aerodrome operator has the duty of providing for an adequate maintenance and rehabilitation program aiming to restore the adequate comfort and safety conditions for the aerodrome operations.
The Airport Pavement-Management System (APMS) is a dynamic process to monitor representative indexes under known operational conditions to forecast the short–medium term evolution of the airport pavement and to define the best maintenance strategy. To accomplish this important task, the APMS needs systematic procedures for the storage and the analysis of an updated set of data and information that fully describe the pavement condition [
4].
The information base of the APMS is a geo-database that fully describes the infrastructure conditions and includes both historical information and design documents and data from surveys of the pavement structural and functional characteristics. The size and level of detail of the system depend on the complexity of the infrastructure and the organization’s maintenance and management policy.
The main objectives of the APMS are:
Assessment of the current conditions of the airport pavement by mean of specific indexes;
Prediction of the short-term and long-term conditions using theoretical methods; and
Identification of elements requiring maintenance and/or rehabilitation to repristinate the adequate level of safety and service.
These objectives can be pursued exclusively through an organic procedure that includes the following main steps:
Building up the inventory of the existing pavements (i.e., collection of geometrical, technical, and mechanical data) and monitoring their performance;
Planning and scheduling maintenance and rehabilitation activities according to the cost-benefit criteria; and
Evaluation of effectiveness and costs of maintenance activities to be performed as well as those carried out in the past.
The implementation of an APMS can yield many benefits to the airport administrator [
10]:
Increment and optimization of pavement lifespan;
Definition of an objective and consistent evaluation of pavement condition;
Realization of a systematic and documented engineering basis for determining pavement needs;
Identification of budget/financial resources needed to maintain pavements;
Implementation of a model describing the current and future pavement conditions; and
Life-cycle cost analysis for different maintenance alternatives.
Additionally, in Italy, the guidelines by the National Civil Aviation Authority (ENAC, Ente Nazionale per l’Aviazione Civile) [
11] organize the APMS in the following phases:
Methods of collecting and storing pavement data;
Objective and repeatable methods of evaluating the pavement conditions by indicators;
Methods of the evolution of pavement performance/degradation through mathematical models;
Assessment of the distress evolution based on the pavement condition and on the life cycle costs;
Assessment of the necessary budget to ensure the achievement of the objectives (for example, minimum expected performance levels); and
Identification of recommended maintenance strategies and definition of related priorities.
In addition, the Italian guidelines [
11] provide indications on the on-site test execution, also including non-destructive and high-performance methodologies.
As recommended in various national and international references [
4,
11,
12], the pavement-management system has been organized according to the following structure of the airport infrastructure network:
Branch: part of the network that performs a specific function. Usually, the branches are represented by runways, taxiways, and aprons. For example, each runway constitutes a branch.
Section: homogeneous subpart of a branch that has the same characteristics (for example, the same pavement, module, thickness, traffic, etc.) and constitutes the minimum element on which to plan maintenance and rehabilitation interventions.
Sample unit: a part of the section in which the survey and the distresses measurements are carried out.
These elements make it possible to create a representative model of the pavement investigated, which corresponds to a data structure with a variable level of detail:
The network level for an overall indication and support of the decision-making phase of planning, therefore useful for the manager’s programming functions;
The project level for an operational organizational phase requiring more detailed knowledge.
Such a structure finds a natural transposition in a relational data architecture that can be implemented in GIS platforms, Geographic Information System [
13], which allow to manage relational databases of a geographic type, GeoDatabase.
The feeding and updating of the database provide the information framework of the actual pavement condition to promptly identify critical situations in terms of operational efficiency and provide for adequate interventions necessary within a farsighted economic planning.
The main features that are monitored are:
Type and density of pavement distresses;
Physical and mechanical properties of materials composing the pavement layers (such as elastic modulus, load transfer across joints, void detection under slabs, subgrade bearing capacity).
The acquired data can be interpreted by the status indicators for which it is customary to refer to as:
Indicators of the operational surface condition (regularity, adherence, macro-texture, FOD—Foreign Objects Debris/Damage, surface drainage capacity of rainwater, etc.);
Structural indicators (structural integrity, bearing capacity); and
Indicators of surface instability.
Some suggestions on the survey frequency are provided in the Italian guidelines [
11] (
Table 1).
The survey type, the frequency, and the acquisition data density depend on the level of deepening and the aim of the survey (network or project level). The assessment of the condition indexes and the definition of the thresholds for each index is the main tool for defining the maintenance priorities [
11,
14].
The evaluation of the pavement condition and the following definition of decay models are the base for the definition of the maintenance strategy: time and type of maintenance work.
Many studies [
4,
8] suggest a decay model based on the PCI—Pavement Condition Index. The PCI is a synthetic parameter to evaluate both structural and functional performance of a pavement, used not only for airport surfaces but also for roads and sidewalks [
4,
15,
16,
17]. Models for predicting pavement performance or deterioration curves are one of the most critical and important foundations of the PMS. These models can be used to predict future pavement deterioration based on the present pavement condition, deterioration factors, and the effect of the maintenance. The model for predicting the deterioration of the PCI is a regressive power curve whose coefficients need to be calibrated based on the pavement structural factors, the thickness of the asphalt layer, the subgrade strength, and the environmental conditions [
18].
3. Methods of Survey and Equipment
In this session, the relevant methods that have been used in the case study described below are described. The surveys were carried using the following equipment:
Global Navigation Satellite System (GNSS): the aim of the topographic survey was to guarantee the precision and accuracy needed for the spatial information required for the implementation of the spatial database, which contains all the georeferenced information of the APMS, and it was performed with the high-precision GPT-9000 integral stations used in static mode to reach the maximum precision. The preliminary phase of the survey requires the positioning and identification of the coordinates of at least two “orientation” points for the execution of the entire survey for each survey area. Each point requires about an hour of acquisition by the GPS (Global Positioning System) GNSS instrumentation, carried out according to phase measurements, to be used as “base” for the Laser Scanner survey.
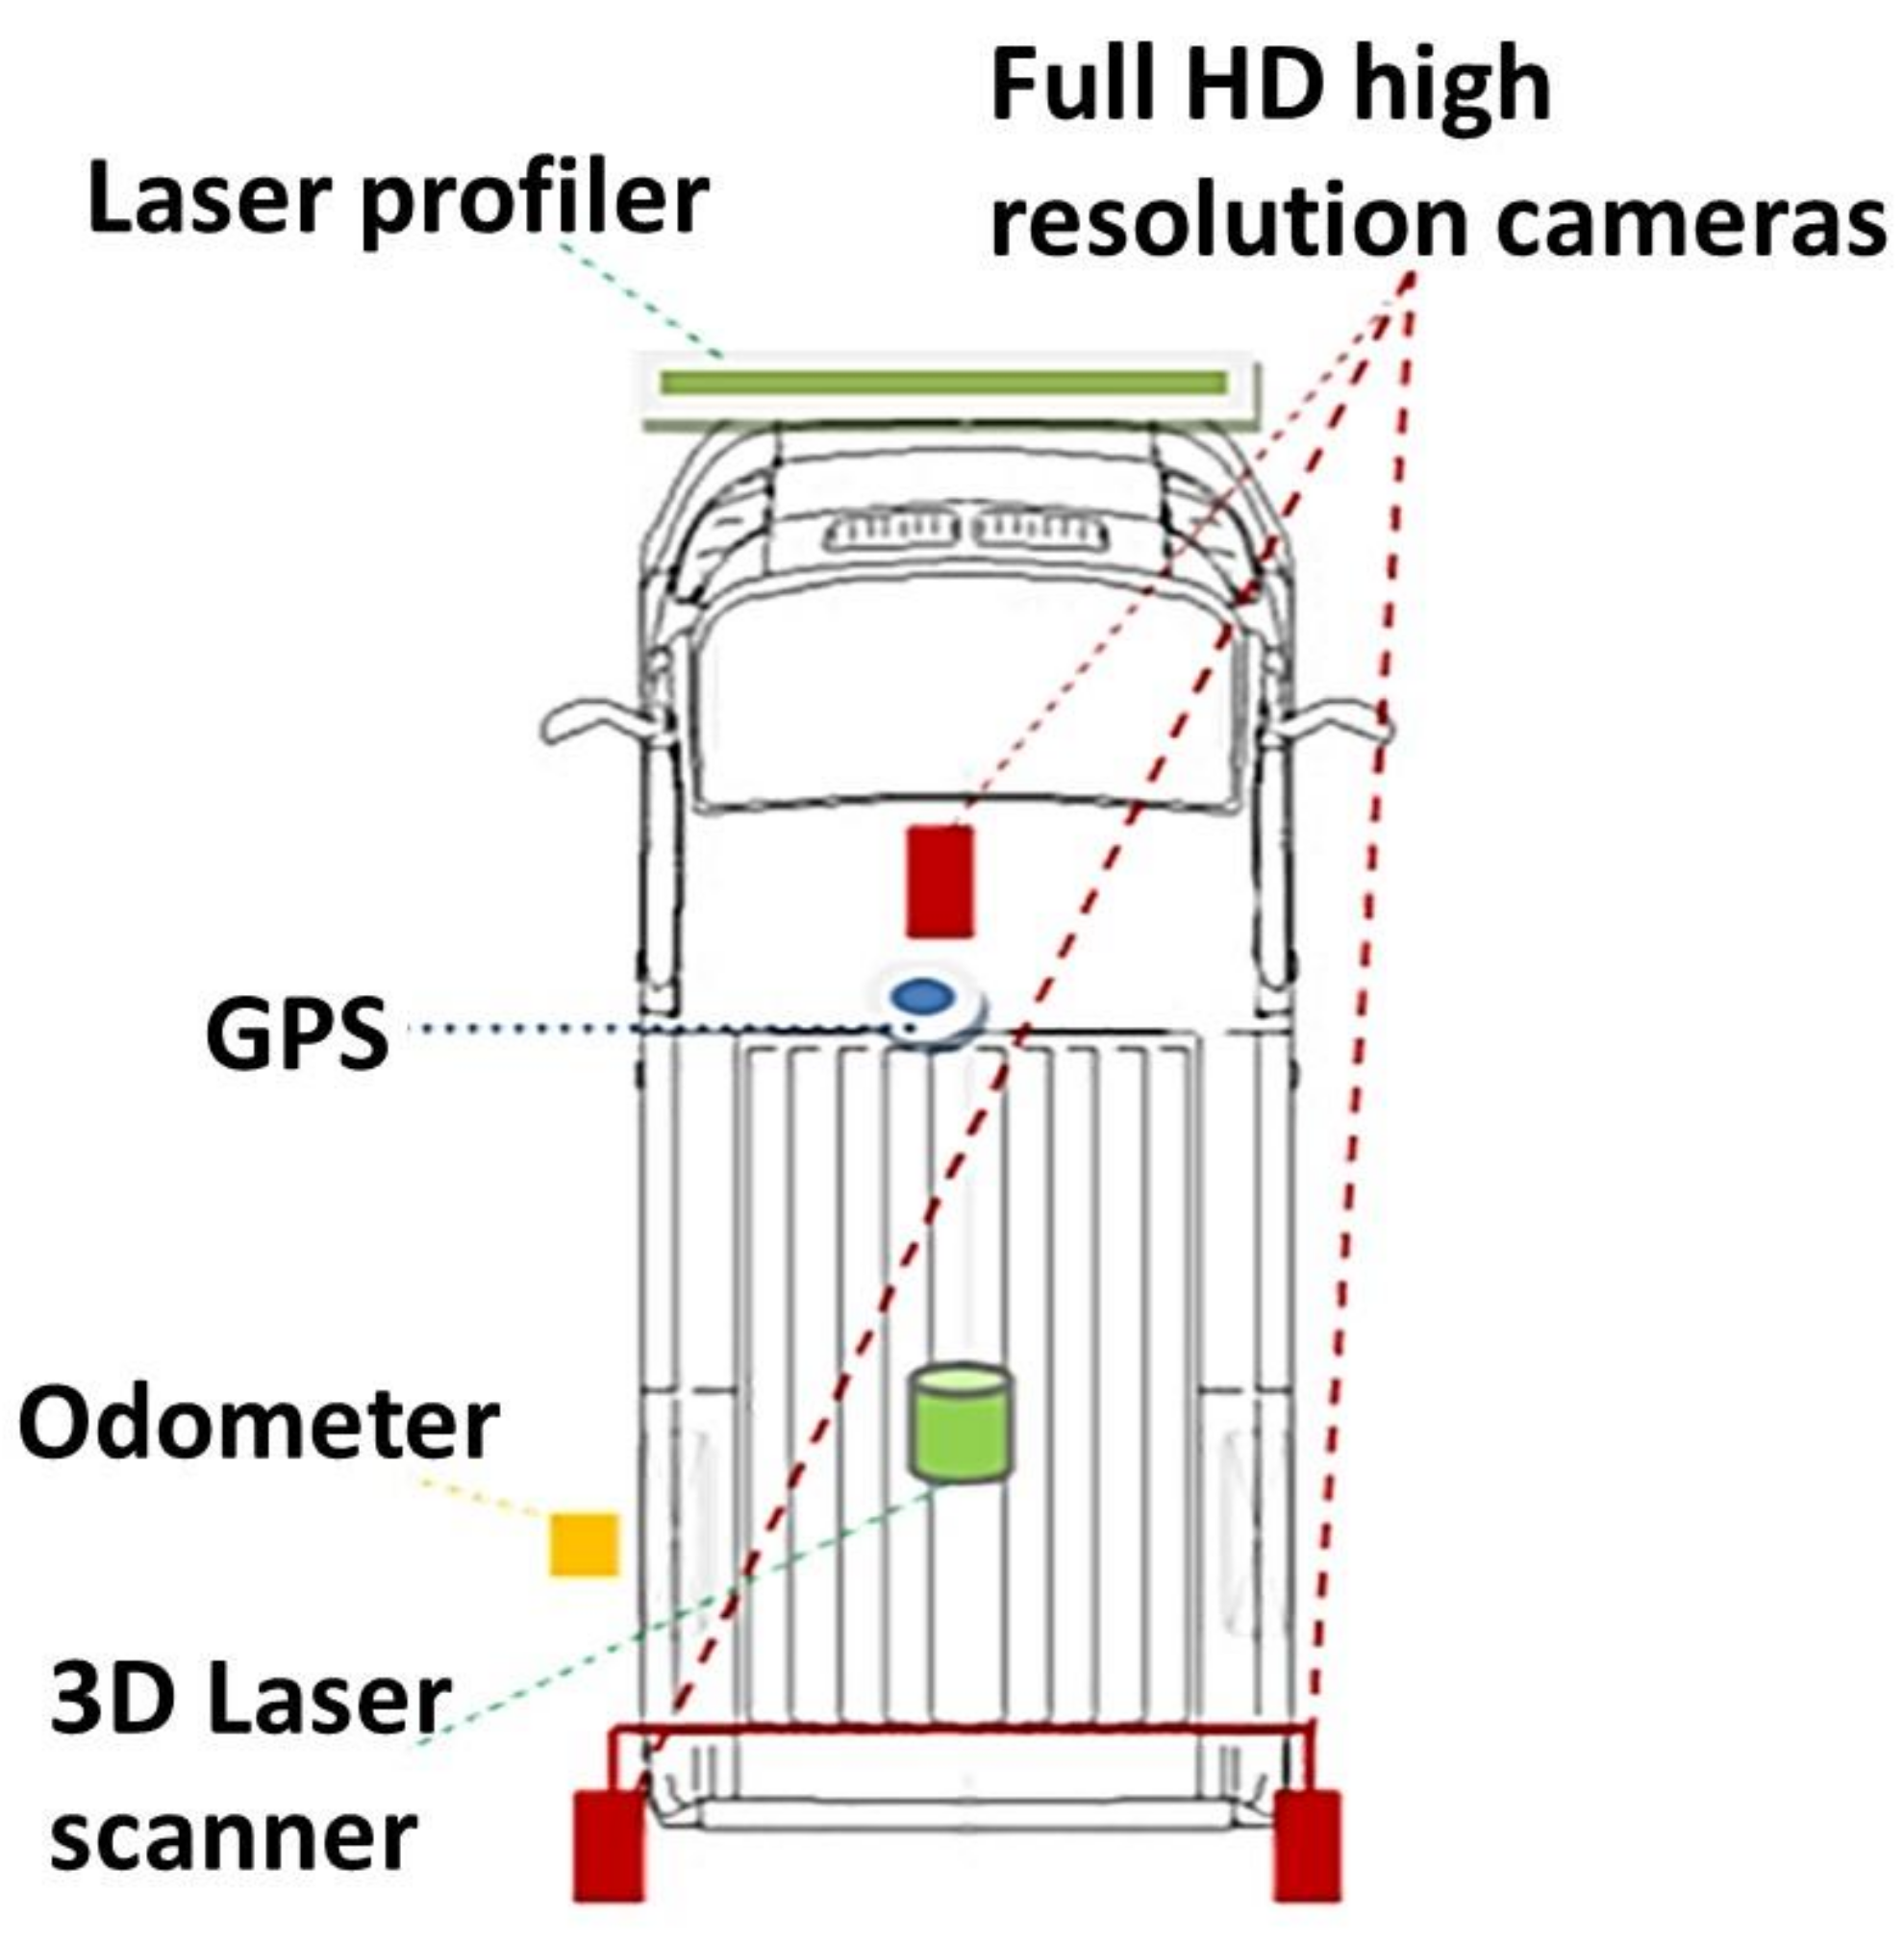
Laser Scanner and Video survey: the high-performance surveys for assessing the deterioration condition, pavements evenness, and profiles (longitudinal and transverse) of the airport infrastructures were carried out with the LSV—Laser Scanner and Video Survey multifunctional system (
Figure 1 and
Figure 2). The LSV system is equipped with full HD matrix cameras with lighting bar to ensure homogeneity of the survey conditions, allowing high productivity and stability of the acquired data both in day and night conditions. The rear chamber system consists of two sensors with nadiral orientation (modifiable according to the purpose of the survey) placed on a support bar mounted at about 2.30 m from the ground, which acquires a longitudinal continuity of a band of about 4.5 m in width. To measure longitudinal and transverse evenness conditions, the LSV system is equipped with a Laser RSP (Runway Surface Profiler) profilometer bar. The bar is equipped with 16-KHz (for measuring pavement profile) and 62.5-KHz sensors for measuring pavement profile and macro texture. It is mounted integrally with the vehicle and can detect the longitudinal and transverse profile of the measurement line. The measurements made by the lasers are compensated by an inertial navigation system equipped with accelerometers and gyroscopes. The surveyed dataset is directly georeferenced by the position and orientation data of the odometer, IMU (Inertial Measurement Units), and GPS antenna, starting from the runway heads.
- 3.
Laser scanner Mobile “Stop and Go”: to acquire the geometric features of the pavement with greater accuracy, geo-referenced, three-dimensional point clouds are acquired with a laser scanner used in Stop and Go mode to maximize productivity and compatibly with the accuracy required. With suitable laser scanner instrumentation and the use of an inertial platform, with the aid of a suitable georeferencing technique, it is possible to obtain three-dimensional models of the state of the place with centimeter-level accuracy. The Riegl VZ 400i system installed on a road vehicle was used (
Figure 3).
This high-precision survey method allowed the reconstruction of a three-dimensional model of the paved surfaces. An example is shown in
Figure 4.
4. Case Study
Cagliari airport is included in the Ten-T Network and the Trans-European Transport Network and is one of the nodes of the European Core Network, the network that guarantees the accessibility and connectivity of all regions of the Union [
19]. The Core Network is complementary to the Comprehensive Network, which materializes the backbone of the development of a sustainable multimodal transport network and stimulates the development of the entire global network.
In the Italian Airports Plan, Cagliari airport is a strategic node for the development of the national airport network [
20]. The airport was inaugurated on 3 May 1937, and at present, the current size of the airport grounds is over 300 hectares. It is located about 6 km northwest of the city of Cagliari in the municipality of Elmas.
Cagliari airport is a civil airport open to military traffic, class 4 D, according to the ICAO functional classification [
7], with the possibility of accommodating class E aircraft with restrictions.
The airport has a single runway, RWY 14/32, 2804-m long and 45-m wide, equipped with ILS (Instrumental Landing System) CAT I on THR 32, with a reference altitude of 3 m above sea level.
The apron has a total area of 156,000 m
2, including two areas for general aviation: one of 4000 m
2, in the northwest of the main apron, and the other, with an area of 4500 m
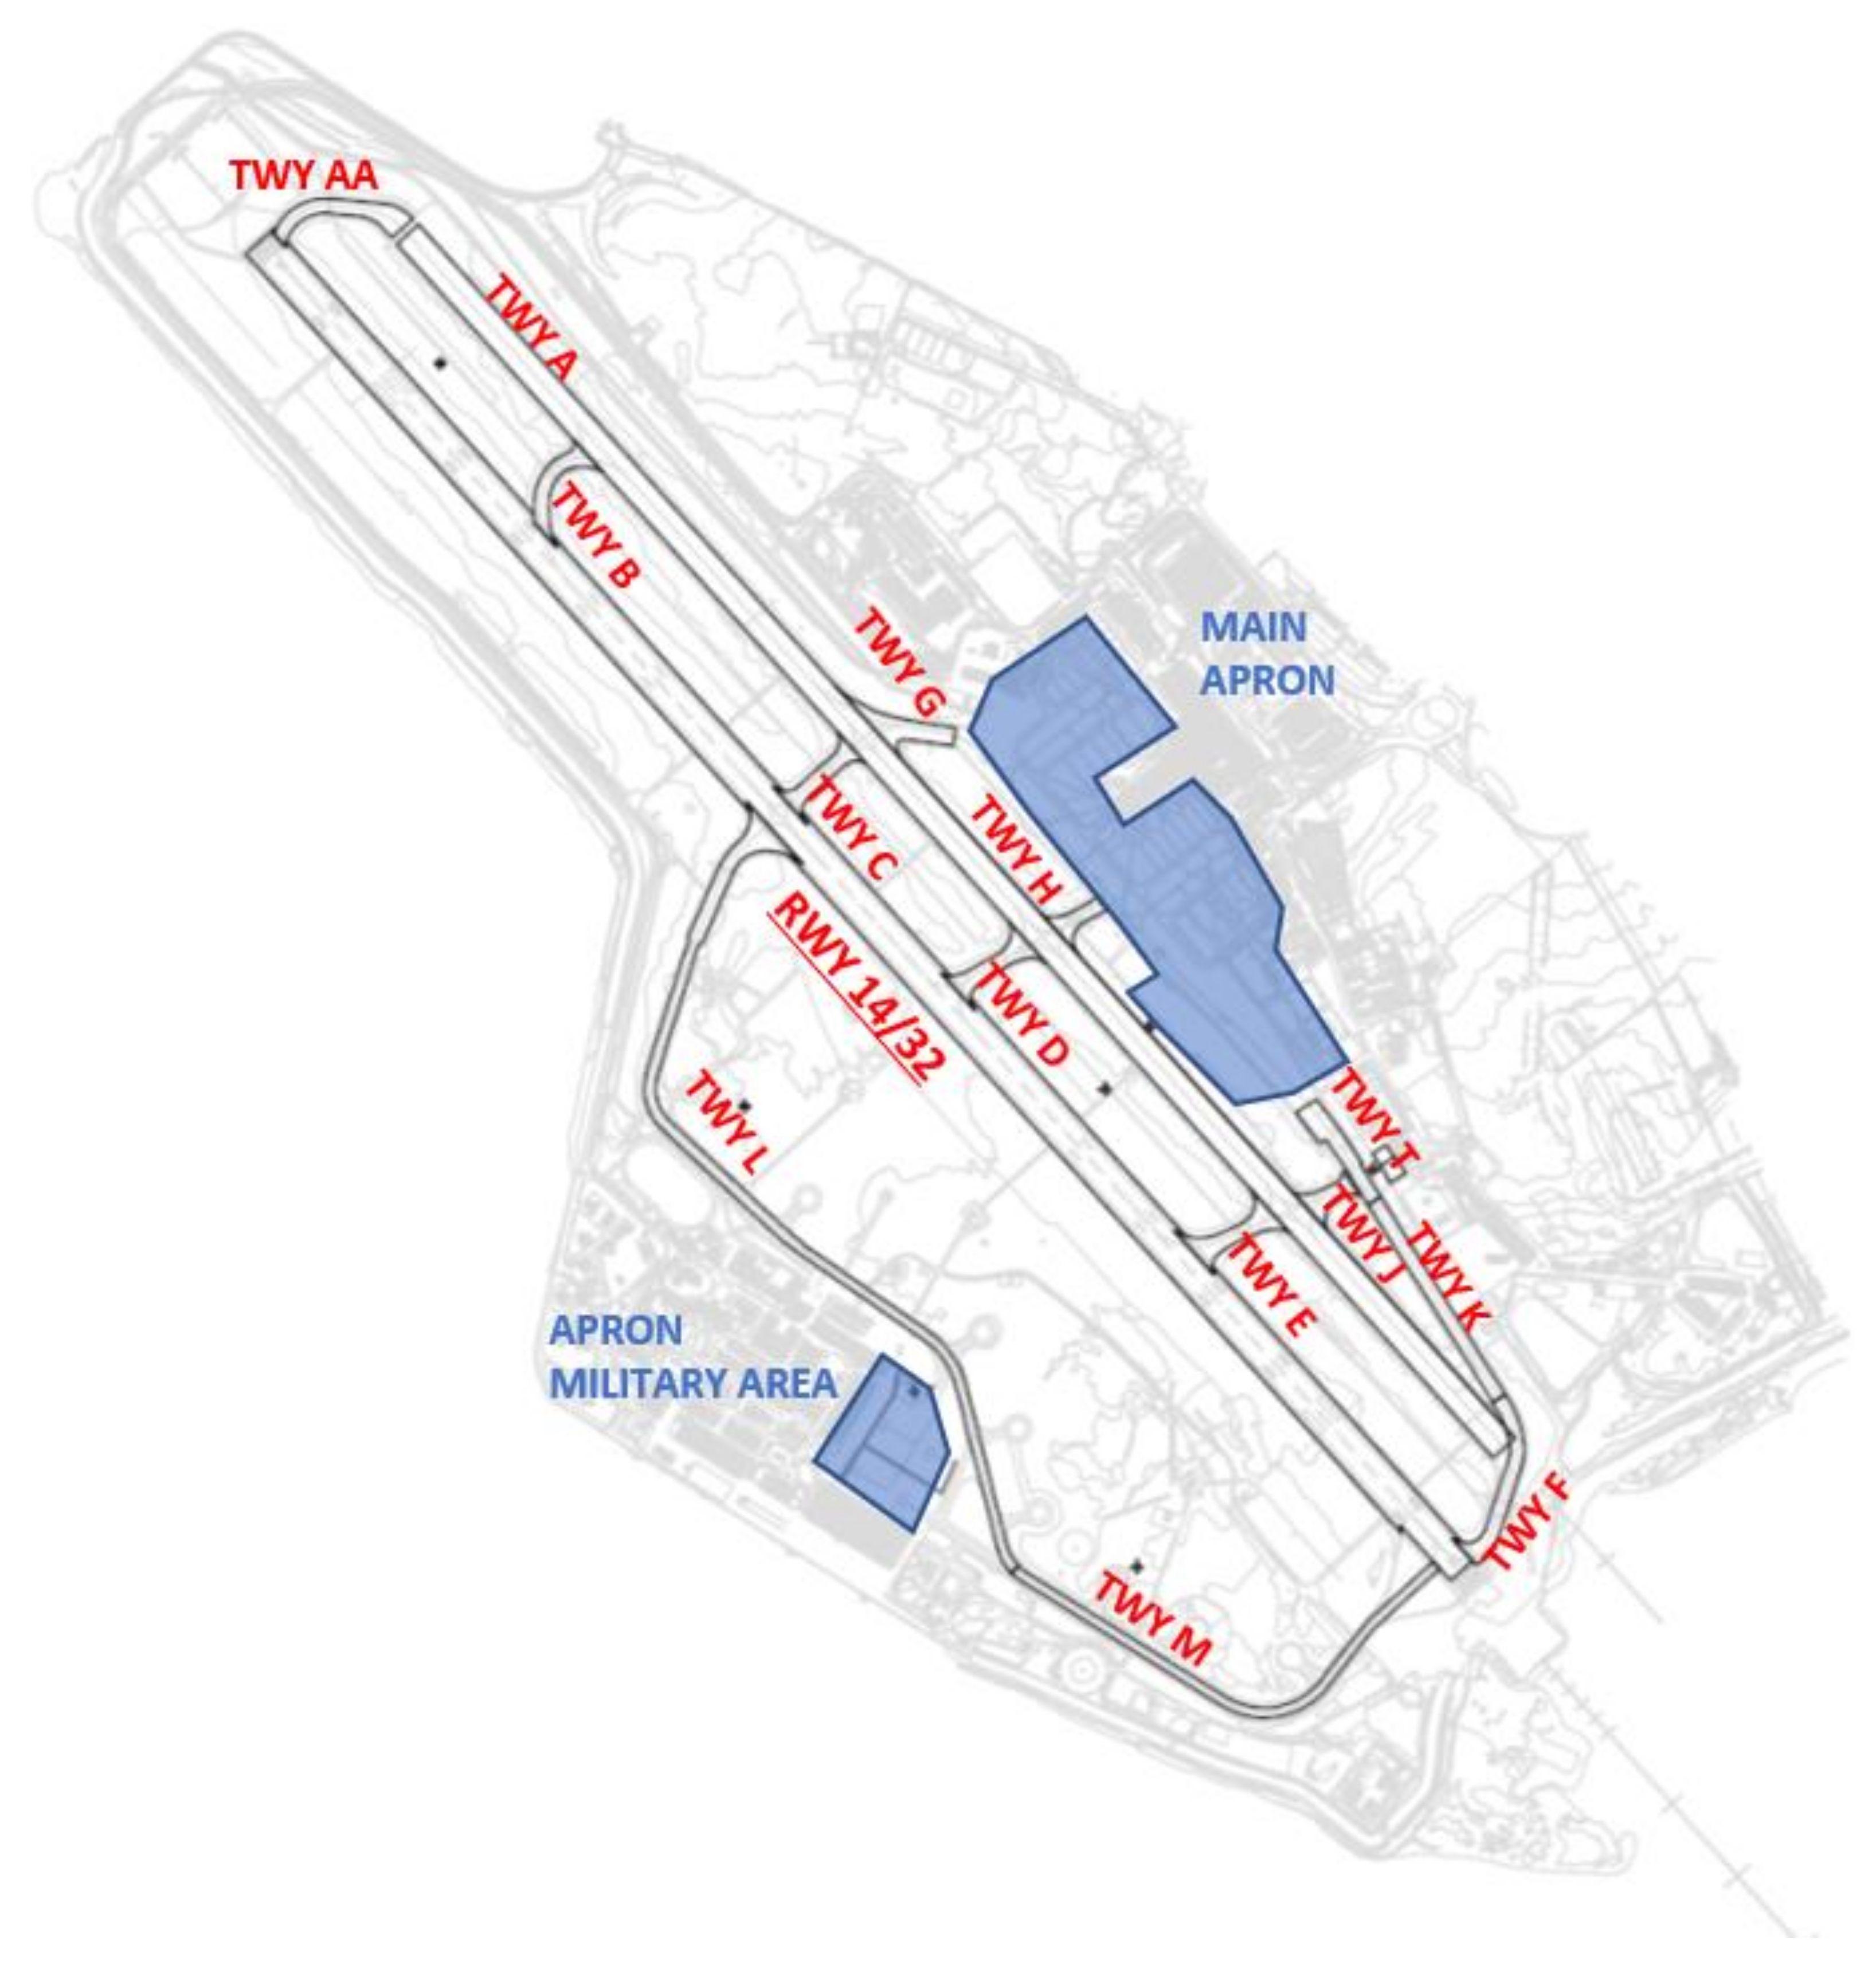
2, is slightly dislocated, in front of the Hangar Aeroclub. Most of the stands are dedicated to class C aircraft; there are also some stands to accommodate class D, E, and F aircraft and a military apron area south of the runway (
Figure 5).
The runway and aprons are connected by a structured network of taxiways.
In 2008, RWY 14/32 was completely reconstructed, and 150 sensors were embedded inside the new flexible pavement layers to acquire deformations, displacements, and pressures under real traffic and weather conditions [
21,
22,
23,
24].
During runway maintenance works, the taxiway A parallel to the runway, about 2400-m long, was used as an auxiliary 14L/32R orientation runway.
The runway and the taxiway A are connected by a header and intermediate taxiway that guarantee full operational efficiency in maximum safety. A network of secondary taxiways leads up to the stands of the main apron area.
Two taxiways, L and M, extend to the southwest, connecting the former military areas.
Figure 5 shows a scheme of the airport.
The surveyed paved areas of Cagliari airport include:
The rigid pavement of the newly built apron and taxiway T, for a total extension of about 18.6 hectares, bordered in red in
Figure 6;
The flexible pavements of the runway and taxiways, for a total of about 35 hectares, bordered in blue in
Figure 6.
For both types of pavements, the survey of surface distresses was carried out, and the consequent operating conditions was assessed by means of specific condition indices.
In 2019, surveys were performed considering the criteria of campaign carried out in 2016; the same sample units and similar method were used in producing an update on the data of previously surveyed areas, such as main apron and general aviation apron. In a 2019 survey, new areas were also investigated: the apron military area facing the hangars of the Guardia di Finanza and the new rigid pavement of taxiway T. This activity therefore represents a second step for the creation of a sufficiently consistent historical database to be able to feed a local APMS. The information acquired in continuity with the previous survey campaign is necessary to integrate the existing database and will be used to define the degradation curves within a forecast model costumed for the Cagliari airport. The following condition indices were assessed:
PCI—Pavement Condition Index that evaluates the functional pavement condition on the basis of visual analysis, used to map and assess the present distresses;
IRI—International Roughness Index that synthesizes the presence of the pavement irregularities along the longitudinal profile in terms of vertical deviations from an ideal profile; and
MDP—Mean Depth Profile, which represents the difference between the arithmetic mean of two peaks and the mean level on a baseline with a defined length.
All the surveys were carried out during the day without interrupting the air traffic on apron and taxiways; on the runway, they were performed during the night since traffic frequency is lower.
4.1. Survey of Rigid Pavements
The rigid pavements were surveyed visually by qualified technicians equipped with precision GPS instrument and HD camera and operating according to the standard ASTM D5340 “Standard Test Method for Airport Pavement Condition Index Surveys” [
12] and in FAA circular AC 150/5380-7B [
25], which was used also for the section geometric definition. The activity involved:
Update of the survey and analysis of the main apron;
First survey of the apron in the military area; and
First survey of the partial reconstruction of the rigid pavement on taxiway T.
The structure of the network was adopted consistently with that of 2016, making changes only with regard to the areas detected for the first time (apron of the military area and taxiway T) or for those that had undergone changes between 2016 and 2019.
The updated area was divided into 12 sections and alphanumerically numbered, consistent with that of the previous survey. A similar organization in six sections was carried out for the new area detected in the military apron, as shown in
Figure 7.
Each section includes the pavement composed of slabs with the same dimensions and thickness, the same mechanical characteristics, and bearing the same traffic loads and repetition. Each section was sub-divided in sample units including 20 slabs for rigid pavements, except those ones on the boundary that have generally a lower number of slabs.
The distresses present on each slab were classified according to the international reference standards mentioned above [
12], recording their types and severity. In support of the visual investigations, the cracks in the concrete pavements were located by precision GPS references, relying on previously acquired known points (2016 survey campaign and head nails). Thanks to the positional data, each single distress was associated with each slab (
Figure 8) so as to be able to proceed with the calculation of the PCI for each individual sample unit (SU).
In order to investigate the slab pavement in the recently built TWY T with higher accuracy, a static survey was carried out with laser scanner instrumentation on a portion of that area.
The point cloud was acquired with an angular resolution of 0.03°, which produces an extremely dense spatial resolution. This means that each acquired slab can be analyzed with millimeter-level detail. However, the analysis to calculate the PCI proved to be particularly onerous; thus, the laser scanner was only used in areas where more detail was needed, such as the rigid pavement of the taxiway T, where the cracks were not detectable with the camera.
The distress computation procedure on each single SU of the network was performed in a GIS environment (QGIS), while the PCI calculation was performed using the FAA PAVEAIR tool [
26]. The results are shown in
Figure 9.
The analysis of the map revealed a generally satisfactory condition in terms of PCI: most of the sample units have values from “Excellent” to “Good”. Sections E and G, on the other hand, have lower PCI values from “Fair” (which in any case, represents an acceptable level) to “Poor” level, which indicates the evident need for an intervention. The sample units that are most damaged are located at the apron taxiway.
4.2. Survey of Flexible Pavements
The runway’s and taxiways’ flexible pavements were surveyed and analyzed with different technologies.
4.2.1. Surface Distresses
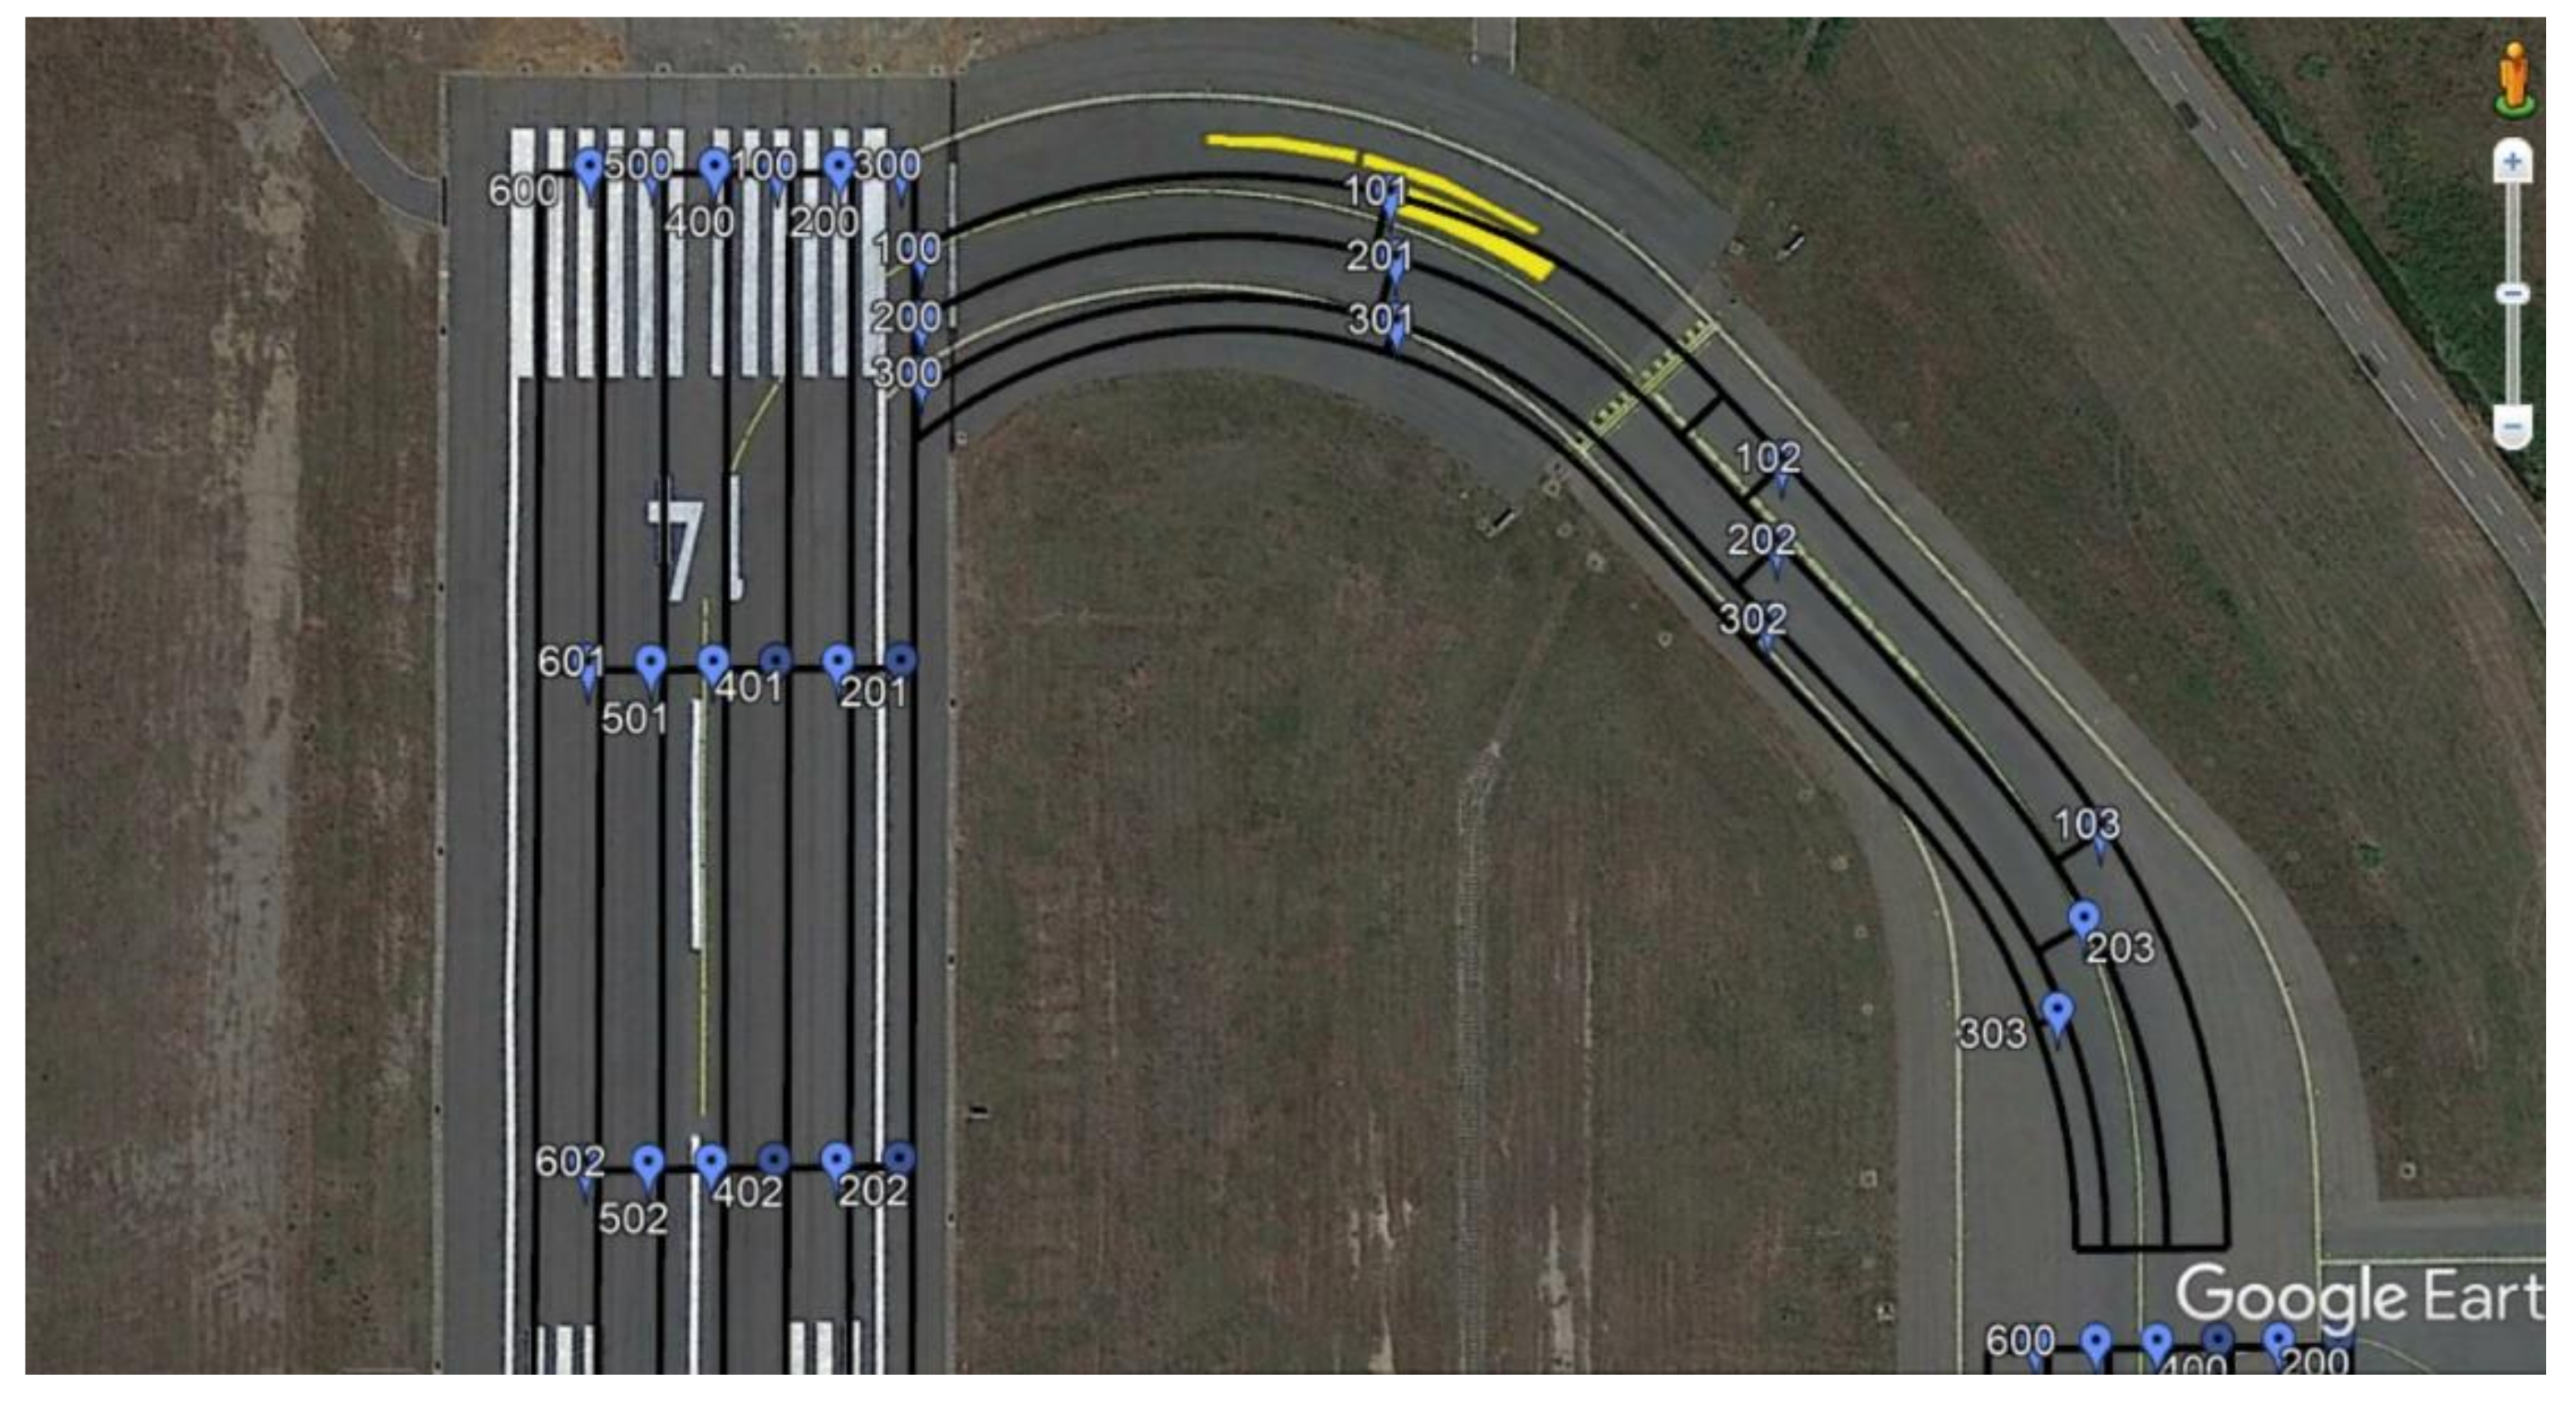
The surface distresses were acquired by means of the instrumented vehicle Laser Scanner and Video survey, previously described. The vehicle acquires, without interruption, images of the pavement for a width of about 4 m (parameter that can be modulated in the system configuration) to cover the entire width of the infrastructure through successive relief alignments, guaranteeing a good overlap between the parallel strips. The layout, shown in
Figure 10, was determined to cover the entire length and width of all the analyzed infrastructures, considering for each alignment a useful band of 3.75 m and an overlap area between contiguous alignments equal to 0.25 m.
The use of this system produced benefits in terms of timing and redundancy of the acquired dataset. The flexible pavements were investigated by dividing the areas into branches, sections, and sample units (
Figure 11) according to the criteria of the ASTM [
12] and FAA [
25] standards so that the PCI was defined in continuity with the previous campaign. Each section includes the pavement composed of the same layers with the same elastic moduli and thicknesses and bearing the same traffic loads and repetitions. Each section was sub-divided in sample units defined as an area 450 ± 180 m
2.
The subsequent post-processing phase includes the consistency evaluation and correction of the georeferenced images acquired by the LSV system in order to make them metrologically valid by means of photogrammetric restitution techniques.
The subsequent semi-automated analysis of the images made it possible to identify (feature identification) and extract in vector form (features extraction) the distress present and proceed to their validation with control by the operator. This minimized the false positives that can often occur with automated procedures. Distresses were classified according to the international reference standards mentioned above [
12], recording types and severity. Subsequently, the distresses were superimposed in a GIS environment with the vectoral plan of the SU defined for the asphalt pavements.
This made it possible to evaluate the origination of the distress detected to the various sample units in order to proceed with the calculation of the PCI.
For continuity with the survey campaign carried out in 2016, the same sample units were kept and organized in the same previous hierarchical structure of branches and sections.
The distress computation procedure on each single SU of the network was performed in a GIS environment (QGIS), while the PCI calculation was performed using the FAA PAVEAIR application [
26]. Following the methodological steps described above, it was possible to create a mapping of the deterioration present on the single sample units, as shown in
Figure 12.
Figure 13 shows the thematic map of the PCI over the entire extension of the flexible pavements that represents the results of PCI calculation in a colored scale rating.
Figure 13 shows that the most of the surveyed sample units are green colored, which means that they are in good condition, which will be discussed in the next section.
The PCI mapping confirms the good conditions of runway 14/32, while the most damaged areas are concentrated on the junctions at the AA and F end and near apron taxiway K. Taxiway A is damaged between junctions B and C and in the area close to the junction E.
4.2.2. Surface Evenness
The surface-evenness conditions were acquired by means of a profilometric bar integrated with inertial sensors on board of the same high-performance vehicle, with the aim of reaching the formulation of the IRI index and the evaluation of the macro-texture.
The surface regularity can be defined as the set of deviations of the pavement surface from a flat reference surface, having characteristics that influence the behavior of the aircraft, the comfort of passengers, and the value of dynamic loads applied to the pavement.
The main parameter used for the synthetic definition of the diffuse longitudinal evenness level of a pavement is the International Roughness Index (IRI), defined in the ASTM E1926 standard [
27]. It measures the number of millimeters of cumulative oscillation in one linear meter (mm/m). For runways, the allowable upper limit of IRI of 2 mm/m is identified [
4].
The Riding Comfort Index (RCI) was used to assess in detail the evenness conditions of the flexible airside pavements and to make a chromatic map.
This index is a subjective index based on the pilot roughness assessment, and it is defined by Transport Canada Civil Aviation [
28] on a scale of 0 to 10 while riding in an automobile, with a RCI equal 0 when the ride quality is very poor and 10 when it is very good.
Many countries have adopted the Ride Comfort Index (RCI), whose correlation with IRI was established; thus, due to the importance of pilots’ reports on runways roughness, it is possible to determine the corresponding RCI values starting from IRI values.
The IRI acceptance limit equal to 2 m/km refers to a RCI value of 10. The correlation between IRI and RCI was used for the definition of the thresholds and the corresponding evaluation, listed in
Table 2.
The IRI analysis highlights a satisfactory condition of evenness longitudinal extension for almost all the flexible pavements in the maneuvering area. The graphs in
Figure 14 briefly represent this condition and show lower IRI values on the zones afferent to the connections between runway and taxiway A: AA, B, CG, DH, EJ, and F, where localized IRI values were found to be greater than 3.5 mm/m.
4.2.3. Macro Texture
The macro-texture measurements were performed with laser technology, as required by ISO 13473-3 [
29], and the profilometric simultaneous acquisitions, with 1-mm sampling interval. The macro-texture is the set of asperities that characterize the surface of a pavement characterized by wavelengths λ between 0.5 mm and 50 mm and variable amplitudes between 0.2 mm and 10 mm. It mainly depends on the aggregate grain-size distribution of the asphalt concrete used to create the surface layer and on the conditions of installation.
The macro-texture influences the surface-drainage characteristics of rainwater, the generation of rolling noise, and the tire-pavement adhesion (mainly in wet pavement conditions and for speeds above about 50 km/h), and it is historically evaluated by the volumetric methods (for example, height in sand). These methods, however, are very slow, and they are likely to reduce the airport operation for too long a time; therefore, high-performance laser methods are preferred.
The parameters used for the characterization of the texture are:
TD (Texture Depth), which represents the distance between the road surface and a reference plane passing through the three highest points within an area having dimensions of the same order of magnitude as the tire-pavement interface;
MTD (Mean Texture Depth), which represents the mean value of the TD measured by the volumetric method of the sand height HS [
30];
MPD (Mean Profile Depth), which represents the average value of the depth of the profile evaluated on a predefined surface section (baseline) determined according to the procedure indicated by the EN ISO 13473-1 standard [
31]; and
ETD (Estimated Texture Depth), a term used to indicate the MTD parameter when it is determined with methods other than the volumetric one. The ETD is related to the MPD by means of the following relationship:
From the MPD data detected with the laser equipment, the corresponding ETD value was determined (according to the provisions of the EN ISO 13473-1 standard). This parameter is directly comparable with the texture values evaluated by the volumetric method of the height in sand (HS). Therefore, in the case of Cagliari airport, it is possible to compare the values acquired from the new measurements with the stored values of HS.
In accordance with various international references [
8,
32], the rating scale shown in
Table 3 was applied.
The analysis of the ETD shows a satisfactory condition of surface texture almost on the entire extension of the flexible pavements in the maneuvering area. The graphs in
Figure 15 summarize this condition.
4.2.4. Ruts
The ruts represent a superficial manifestation of a degradation that can originate in the deep layers of the flexible pavement. It is important to already identify the first signs of these mechanisms, as they are difficult to identify and, once manifest, are scarcely remediable with minimally invasive and economic interventions. For this reason, an innovative methodology was applied for the identification of ruts through the analysis of data acquired with laser instrumentation in mobile or Stop and Go mode. In this way, even a minimal difference in altitude is detected, and the presence of ruts can be evaluated.
The survey of 3D point clouds also makes use of a precision positioning system (GPS + IMU) that allows the acquisition of the scanning positions in a synchronized way with the activity of the laser sensor.
Following the acquisition of the geometric data, a classification of the 3D model was carried out for the entire area of the survey, making it possible to identify the presence of potentially critical situations with respect to the regularity of the shape and the presence of ruts.
For example,
Figure 16 shows the 3D model of the identification of rutting in the runway threshold 32. The different coloring indicates the different level of severity of the ruts (
Table 4). From the distribution of colors in
Figure 16, the symmetry of the tracks with respect to the axis is highlighted.
The critical areas WERE studied in detail, producing some sections in order to evaluate the characteristics of extension (area) and severity (depth) of the ruts.
The latter was assessed according to the criteria of the ASTM [
12] standard, shown in
Table 4.
Figure 17 presents the detailed study of the rut depth in the transversal section built from the detected 3D point cloud of the pavement surface. The analysis of the transversal section allowed the determination of the maximum rut depth with millimetric precision, resulting in a high-severity level, according to the classification in
Table 5.
The analysis of the georeferenced 3D point cloud, acquired with a terrestrial laser scanner, highlighted the presence of two areas with ruts on taxiways AA and F, as represented in
Figure 18 and
Figure 19. The severity and extension of the ruts and the correspondent sample units where they were detected are reported in
Table 5.
4.2.5. Decay Curves
Periodical preventive maintenance activities to the pavements reduce the rate of deterioration and maintain a high level of service. The deterioration rate of airport pavements is influenced by the traffic cycles, airplanes type and maneuvers, pavement structure, pavement surface type, subgrade type, and environment. The rate of decay is strictly dependent on airport dimension, location, and traffic. Thus, to develop a reliable and accurate decay curve for the runway pavement, surveyed data were combined with the measurements acquired from April 2009 until June 2012 with strain gauges, pressure cells, LVDTs, and thermocouples embedded on runway layers and with daily survey conducted by the aerodrome operator. The prediction model was developed using a specific module of FAA PAVEAIR. The module develops deterioration models by grouping together similar pavements and performing a regression analysis to relate pavement condition to pavement age. The model was constructed using data of runway pavement sections similar in terms of pavement layers, traffic volume, age of construction, traffic patterns, and subgrade strength.
The obtained decay curves for different homogeneous sections of the runway pavements are reported on
Figure 20. The prediction part of the curve highlights the need for programming a rehabilitation of the critical part of the runway pavement. The calculated PCI values of all sections were compared to the measured PCI based on the daily survey of the same segments conducted by the aerodrome operator at the beginning of the year 2021, obtaining a good correlation.
5. Results and Discussion
The study carried out highlights how many aspects contribute to the creation of an APMS, the continuous need for updating, and the great informative and predictive potential that this system offers, producing economic and organizational benefits even in the short term.
The first aspect to emphasize is linked to the availability and updating of information: the possibility of carrying out survey campaigns with expeditious methodologies on a georeferenced basis facilitates the supply of a coherent and accurate database equipped with an information potential that does not run out in the short term but builds the history of the infrastructure.
In the case study of the Cagliari airport, this aspect made it possible, already in the short term (2016–2019), to be able to evaluate an embryonic trend of natural obsolescence of the airside pavements. However, of course, much more data collected over a longer time span is needed to implement a custom, reliable decay model for the Cagliari airport.
As regards the results of rigid pavements, a satisfactory condition was found in general: indeed, the PCI falls below “Good” only in a limited area that traces the path of aircraft along the apron taxiway T and the runway exit taxiway H, as shown in
Figure 9.
The comparison with the 2016 data suggests a trend of natural decrease in the PCI value, which is expected on average on 3–5% variation on the sample units. For example,
Figure 21 shows the comparative situation of Section B, which contains most of the main apron dedicated to commercial traffic.
The analysis of flexible pavements also reveals a downward trend compatible with the use of infrastructures: the PCI mapping confirms the good conditions on runway 14/32, shown in
Figure 13; indeed, more than 80 % of samples units are between “Good” and “Excellent” condition regarding the PCI, as shown in
Figure 22. The most damaged areas are concentrated on entrance taxiway AA and F (see scheme in
Figure 5). This is due to many rutting phenomena already highlight in
Figure 18, which play a decisive role in calculating the PCI.
The recent pavement restoration work on an extended portion of taxiway A is evidenced from the much higher PCI values as
Figure 13 shows.
The general “Good” conditions of both rigid and flexible pavements derived from visual survey of surface distresses, and the consequent evaluation of PCI values have defined the airport manager’s decision to postpone the structural tests to a subsequent survey campaign. This is an obvious advantage of visual surveys in programming all the monitoring activities necessary for the APMS.
Another consideration is linked precisely to the importance of repeating the surveys at defined time intervals so as to be able to build local degradation models that can boast a greater degree of detail and accuracy. This condition is made possible by the synergy between a greater culture of preventive action, strongly hinged on the concepts of safety and LOS-Level of Services, widely referred to in the sector regulations, and a greater availability of highly performing and increasingly accessible technologies.
Moreover, the introduction of innovative technologies in the field of surveys is characterized by increasingly higher productivity in terms of timing and information produced, and in the face of sustainable computational costs, thanks also to the introduction of automation and artificial intelligence procedures, has represented another positive push to the APMS development.
In fact, the experience conducted at the Cagliari airport was characterized by the massive use of experimental, highly productive technologies, such as the acquisition of surface deterioration thanks to video surveys and subsequent semi-automated post processing for the recognition of distress, and the experimentation of the methodology for the recognition of ruts using ultra-high-density laser data.
6. Conclusions
Nowadays, civil aviation airports often struggle with limited operating funds for the expense of pavement maintenance. The Airport Pavement-Management System (APMS) has proven to be a strategic tool to support decisions, aimed at defining a technically and economically sustainable management plan. The theoretical elements and structure of an APMS has been investigated, and its complexity has been highlighted by means of the description of a case study of a medium-dimension, international Italian airport. The paper presented the first step of the implementation of the APMS at Cagliari airport: the survey campaign carried out in 2019. It was performed with high-performance equipment based on Global Navigation Satellite System (GNSS) and Laser Scanner and Video survey. The surveyed areas of the Cagliari airport included both rigid and flexible pavements, and some condition indexes to evaluate the functional and surface conditions were calculated: the Pavement Condition Index (PCI), the International Roughness Index (IRI), and the Mean Depth Profile (MDP). The surveys were carried out considering the subdivision into sample units already used in the previous survey campaign (2016), with the aim of comparing the results obtained in the two surveys. The results and the analysis were stored to implement customized decay curves for Cagliari Airport. Already in the short term (2016–2019), an embryonic trend of natural decrease in the PCI value of the airside pavements was observed, and encouraging results were obtained through integrating data collected since 2009 on runway flexible pavement.


