Article

Alternative Use of the Insecticide Diofenolan on Musca domestica (Diptera: Muscidae): A Morphological and Ultrastructural Investigation

1
Department of Life Sciences and Biotechnology, University of Ferrara, Via L. Borsari 46, 44121 Ferrara, Italy
2
Department of Biology, Josip Juraj Strossmayer University of Osijek, Cara Hadrijana 8/A, HR-31000 Osijek, Croatia
3
Department of Biology, Ecology and Earth Sciences, University of Calabria, Via P. Bucci, Arcavacata di Rende, 87036 Cosenza, Italy
*
Author to whom correspondence should be addressed.
Sustainability 2021, 13(18), 10122; https://doi.org/10.3390/su131810122
Submission received: 31 July 2021 / Revised: 29 August 2021 / Accepted: 1 September 2021 / Published: 9 September 2021
(This article belongs to the Special Issue Sustainable Defense Strategies for Pest Management)

Abstract

:
Musca domestica Linnaeus (Diptera: Muscidae), a relevant synanthropic pest, is the most frequent dipteran species in farms and waste landfills. Insect Growth Regulators (IGR), insecticides with species-specific toxicity and low health and environmental impact, are known to act mostly on larval stages but may induce sterility in adults. We investigated the effects of diofenolan, an IGR analogue of juvenile hormone, on M. domestica, with special attention to female reproductive ability (egg-laying and hatching), and ovarian and ovariole morphology, using optical and transmission electron microscopy. We also tested the interactions between diofenolan and the activity of corpora allata, endocrine gland producing juvenile hormone required for ovarian development, by morphological and ultrastructural investigations. The results show that diofenolan negatively affects the reproductive ability of M. domestica, causing extensive morphological alterations in ovaries and ovarioles. In treated females, ovarioles showed nine different morphotypes that could be arranged into three “transformation paths”, and these alterations were able to reduce egg-laying. The effects of diofenolan on corpora allata, investigated at the optical and ultrastructural level in M. domestica, showed extensive alterations of the nuclei, cytoplasms, and mitochondria, strongly suggesting a rapid transition of the gland from inactivity to degeneration. The sterilizing effects of diofenolan in M. domestica are very interesting for integrated pest management programs within sustainable defence strategies against this relevant and annoying pest.

1. Introduction

The house fly, Musca domestica Linnaeus (Diptera: Muscidae), a common and cosmopolitan insect pest [1], is closely associated with human populations. It is a polyphagous and endophilic species [2,3], very common also in cattle and poultry farms [4,5] where it represents the main hygiene problem [6]. The high mobility of adults and the high reproductive rate cause massive infestations not only in farms but also in the nearby residential areas, leading to complaints and often to lawsuits [6,7]. The life cycle of M. domestica consists of four stages: egg, larva (three instars), pupa, and adult [2]. For its extreme ubiquity and synanthropism, M. domestica plays a pathogenic role in both larval and adult stages [8]. The larvae of M. domestica may also cause facultative myiasis [9]. Adults are a serious threat to human and animal health, being mechanical vector of a wide range of pathogens (virus, bacteria, protozoans, parasite nematodes) [8,10,11]. As all Diptera, M. domestica has two polytrophic meroistic ovaries [12], each consisting of 50–75 ovarioles, arranged in 4–5 concentric circles [13]. Three regions can be easily recognized in each ovariole: a terminal filament, a germarium containing oogonia and a vitellarium containing a maximum of three follicles. In turn, follicles are composed of a somatic epithelium, an oocyte and 15 polyploid nurse cells [14,15]. Follicles develop sequentially, with younger ones near the germarium and older ones at the posterior end [16,17]. Each ovary ends in a common duct enlarging into a sacculus and a vagina, which opens in the ovipositor in the XI abdominal segment [2]. In Diptera, the corpora cardiaca, together with the corpora allata and prothoracic glands, form a unique structure called the Weismann’s ring or ring gland. The Weismann’s ring is maintained during the larval instars and in adults, when prothoracic glands undergo degeneration [18]. The corpora allata, active for all life, produce juvenile hormones (JH) which regulate postembryonal development in larvae and ovarian development in adults [18,19]. The JH are sesquiterpenoids with an epoxy group at one extremity and a methyl group on the opposite one [20]. Among insect hormones, JH are probably the most versatile [21] and play a key role in many processes, including development, reproduction, embryogenesis, molt, metamorphosis, determination of castes in social insects, vitellogenesis, ovarian development, regulation of diapause, polymorphism and even external colours [22]. In ovarian development, JH and ecdysteroids are involved in vitellogenin synthesis in fat bodies, production of new follicles, previtellogenic growth of the oocyte and uptake of yolk proteins. The activity of these molecules is highly heterogeneous according to the insect species [21]. In M. domestica most data concerning hormone control of reproduction in females are found in Adams and Li [23]. The JH apparently increases the sensitivity of tissues producing vitellogenin towards ecdysteroids synthesized by the ovary [24]. Among recently developed insecticides, Insect Growth Regulators (IGR) are able to interfere with growth and development in insects. IGRs are called “third-generation insecticides” [25] because, unlike previously developed insecticides, they target juvenile pest populations with low toxicity against non-target organisms. For this reason, they are considered compatible with integrated pest management systems. According to their mode of action, IGRs are classified as chitin synthesis inhibitors and disruptors of JH and ecdysteroids [26]. Diofenolan, a JH-analogue used for the control of Lepidoptera, interferes with endogenous JH levels, disrupting growth, development, metamorphosis and moulting [27]. To verify the possible use of this JH-analogue against M. domestica, the effects of diofenolan were investigated by optical and transmission electron microscopy on adult females, with special attention to reproductive ability (egg-laying and hatching), and ovarian and ovariole morphology. The interactions between diofenolan and the activity of corpora allata were also investigated in the same species at the optical and ultrastructural level.

2. Materials and Methods

2.1. House Fly Strain

The strain of Musca domestica employed in all experiments was a sensitive reference strain [28]. The strain (s-DBF), never exposed to any insecticide, was maintained since 2009 at the Department of Life Sciences and Biotechnology, University of Ferrara (Ferrara, Italy), in a way to continuously produce mating adults, eggs and larvae. All developmental stages occurred within a thermostatic cell (ISCO s.r.l., Milan, Italy) at 25 ± 2 °C, 60 ± 5% relative humidity and 12:12 light:dark photoperiod [29].

2.2. Fecundity Bioassays

For all tests, the active ingredient diofenolan (2-ethyl-4-[(4-phenoxyphenoxy)methyl]-1,3-dioxolane) was purchased from Sigma-Aldrich (Milan, Italy).
The fecundity bioassays evaluated the effects of diofenolan on the average number of eggs laid in 10 days [30]. Virgin females were obtained by individually placing 400–600 pupae in cloth-sealed “emerging tubes”. Emerged individuals were sexed by genital morphology and females of the same age, slowed by exposure to CO2 and gathered in groups of 10, were placed for 15 h in containers with food and water. Bioassays for fecundity were performed with 5, 25, 50 and 75 µg/µL of the active ingredient diluted in acetone. The container was chilled for 90 s and each group of females was topically treated with 1 µL of diofenolan solution on the dorsal part of the thorax, using a 50 µL Kloehn syringe (Norgren Inc., Las Vegas, NV, USA) mounted on a repeating dispenser (Hamilton Co., Bonaduz, Switzerland). The treated females were placed in mating boxes with 10 males of the same age for 10 days. The mating boxes were adapted for both adult feeding (by plastic tubes with cotton plugs soaked in 90% milk and 10% sucrose) and egg-laying. The plastic tubes were changed every 24 h, collecting eggs after slowing the flies with CO2. Each diofenolan concentration was tested in four replicates of 10 males and 10 females of the same age, with matching female controls topically treated with 1 µL acetone. Eggs were counted and data were analysed by the Levene and Kolmogorov–Smirnov tests for normality and homoscedasticity. To detect significant differences between the average number of eggs laid in treated and control females, a one-way ANOVA test was performed using the STATISTICA 7.1 program (StatSoft, Tulsa, OK, USA), with Least Significant Difference (LSD) post hoc comparisons, selecting the significance level p < 0.05.
Moreover, the number of eggs laid after exposure to each dose was used to calculate the percentage of Fecundity Inhibition [30] according to the formula [(A − a)/A] × 100, where “A” is the average number of eggs laid by the controls and “a” the average number of eggs laid by females treated with a given dose of diofenolan.

2.3. Stereomicroscope Observations

After detecting significant differences in the average number of eggs laid by treated and control females, the ovaries were observed under the stereomicroscope. Adults of both sexes were collected and prepared as previously described. Females were treated with the highest dose (75 µg/µL) of diofenolan, and kept in boxes with males until near the end of the first egg deposition cycle, about 90 h after emerging. All adult females were anaesthetized with CO2 and painlessly sacrificed. Ovaries were dissected under a stereomicroscope SZM-2 (Optika Microscopes, Bergamo, Italy), fixed in 4% formaldehyde, pH 6.9 (Carlo Erba, Milan, Italy) for 4 h and rinsed in sodium cacodylate buffer 0.125 M, pH 7.3, with 6% sucrose. Ovarioles were isolated and examined under a stereomicroscope Nikon SMZ 800 (Nikon Instruments Europe, Amsterdam, The Netherlands). Images of the ovarioles were taken with a Nikon Digital Sight DS-Fil camera (Nikon Instruments Europe) mounted on the stereomicroscope.

2.4. Fecundity and Hatching Tests in Egg Deposition Cycles

A special protocol was devised to verify the effects of diofenolan on the fecundity of each egg deposition cycle of individual M. domestica females. One female was placed with four males in a 200 mL plastic box provided with food and hydration (70% milk and 30% water) and a suitable place to lay eggs. Virgin females were topically treated with 75 µg/µL diofenolan, as previously described. A total of 10 boxes for treated females and 10 boxes for controls were prepared. Eggs were collected every 3 h and their total number and the percentage of hatched ones was recorded for three consecutive egg deposition cycles, for a total of 8–10 days. Immediately after the first egg deposition, each female with the 4 males was transferred into another similar box for the second egg-laying, and these operations were repeated until the third egg deposition cycle. Eggs were counted under the SZM-2 stereomicroscope in 6 cm Petri dishes containing 1 × 2 mm plastic mesh grid supports. Egg hatching was verified at 8–10 h from collection and all anomalous situations were recorded and photographed with the Nikon digital camera. Statistical analyses on eggs laid by treated and control females for each egg deposition cycle were performed by one-way ANOVA with LSD post hoc comparisons, as previously described. The number of eggs laid for each egg deposition cycle was used to calculate the percentage of Fecundity Inhibition [30] according to the formula [(A − a)/A] × 100, where “A” is the average number of eggs laid by the controls and “a” the average number of eggs laid by the treated females. The Sterility Index in each deposition cycle was calculated and expressed in percentage as follows: 100 − [(a × b)/(A × B)] × 100. In this formula, for each egg deposition cycle, “a” is the average number of eggs laid by all treated females, “b” is the percentage of hatched eggs laid by all treated females, “A” is the average number of eggs laid by all control females, and “B” is the percentage of hatched eggs laid by all control females [30].

2.5. Analysis of Ovarioles by Optical Microscopy

Based on stereomicroscope observations, the ovarioles were isolated and examined by a Nikon Eclipse 80i optical microscope (Nikon Instruments Europe) and photographed by a connected Nikon Digital Sight DS-Fi1 (Nikon Instruments Europe). For each female, the time of emerging from puparium was indicated as T0 and the time of treatment with diofenolan (or acetone for controls) as T0t, after 15 h. Treated and control females were then collected at 30 (T1), 55 (T2) and 75 h (T3) after treatment. The ovaries of 3 females for T0 and T0t and the ovaries of 3 treated and 3 untreated females were examined for T1, T2 and T3. The morphology of all ovarioles of the right side of each female was recorded and images were acquired by the Nikon Digital camera. Morphometric measures on the acquired images (total area follicles, areas of nurse cells and of oocyte) were performed by the image analysis software NIS-Elements Documentation (Nikon Instruments Europe). The morphological alterations detected in ovarioles of treated females were grouped in different morphotypes. The average areas of the follicle regions were expressed as percentages of the total follicle area.

2.6. Mapping of Ovaries

Mapping was performed on a small Petri dish with a black wax base filled by 3 mL sodium cacodylate buffer 0.125 M and 6% sucrose. Ovaries collected at T3 were fixed in an upright position and the number and position of each ovariole were verified under the SZM-2 stereomicroscope. The morphotype and position of each ovariole within the ovary was mapped in treated and control females with a Wacom Bamboo CTH670 graphic tablet (Wacom, Vancouver, WA, USA) with software ArtRage Studio Pro 3.5.5 (ArtRage, Auckland, New Zealand).

2.7. Analyses on Ovarioles

Ovarioles isolated from treated and control females as previously described were prepared for optical microscopy and transmission electron microscopy. The right and left ovaries of 10 females for T0 and T0t, and 20 females (10 treated and 10 controls) for each T1, T2 and T3 time intervals were dissected and fixed for 4 h in 2.5% glutaraldehyde in ice-cold sodium cacodylate buffer 0.125 M, pH 7.3. After rinsing in the same buffer with 6% sucrose, the ovaries were postfixed for 12 h in 1% osmium tetroxide in the same buffer, dehydrated in progressively increasing alcohol solutions (50°, 70°, 80°, 90°, 95°, 100°), 1:1 alcohol 100° and propylene oxide, pure propylene oxide and embedded in resin (a mixture of Araldite, Epon 812 and DDSA with tertiary epoxyamine as an accelerator, Fluka Chemie, Bucks, Switzerland). Each ovary was embedded in a single resin block and the resin was polymerized by slow heating up to 62 °C. For optical microscopy, the ovaries were cut in 1.5 µm semithin sections on Reichert Om U2 ultramicrotome (Reichert, Wien, Austria), stained with 1:1 methylene blue: sodium borate, observed by Nikon Eclipse 80i optical microscope and photographed as previously described. For electron microscopy, 60–70 nm ultrathin sections were obtained by a diamond blade mounted on a Reichert Ultracut E ultramicrotome (Reichert). The sections were collected on 100 mesh grids coated by formvar, contrasted by uranyl acetate and lead citrate, and observed by a Hitachi H800 transmission electron microscope (Hitachi High-Technologies, Krefeld, Germany) at the Electron Microscope Centre of the University of Ferrara.

2.8. Analyses of Corpora Allata

The corpora allata of M. domestica females were examined for morphological and ultrastructural alterations at time intervals T0 (time of emerging from the puparium), T0t (15 h from emerging, time of treatment either with diofenolan or acetone), T1 (45 h from emerging, 30 h after T0t); T2 (70 h from emerging, 55 h after T0t), and T3 (90 h from emerging, 75 h after T0t). For T0 and T0t, 10 females were set aside for each time interval. For T1, T2 and T3, 20 females were set aside for each time interval, 10 treated with the active ingredient, as previously described, and 10 controls. After being anaesthetized by CO2 and painlessly sacrificed, the females were fixed in 2.5% glutaraldehyde in sodium cacodylate buffer 0.125 M, pH 7.3, and dissected under the stereomicroscope detaching the proboscis, the wings, the legs, the scutellum and the ovipositor. The bodies were then placed in a fixative for 4 h at 4 °C, further dissected by removing the scutum and prescutum cuticles, the head and part of the abdomen, and exposing the thorax containing the Weismann ring. The thorax was further fixed for 12 h at 4 °C and prepared for optical and electron microscopy, as previously described. For T0 and T0t, 5 corpora allata for each time interval, and for T1, T2 and T3, 5 corpora allata of treated females and 5 of controls for each time interval were cut in 1.5-µm semithin serial sections and prepared for optical microscopy, for a total of 40 completely seriated organs. The area of corpora allata was measured in the same samples by the image analyzing software NIS-Elements Documentation, previously employed for morphometric analyses of ovarioles. The values of each area were multiplied by the section thickness (1.5 µm) and added to obtain the total volume of the gland. To detect possible hyperplasic and/or hypertrophic conditions, the number of cells in the same corpora allata was also recorded by counting nuclei in semithin serial sections for each time interval, photographed by a Nikon Digital Sight DS-Fi1. Acquired images of corpora allata of each female were orderly visualized in a PowerPoint file for cell counting. Statistical analyses on volume and data of cell numbers in corpora allata were performed by one-way ANOVA with LSD post hoc comparisons, as previously described.
For transmission electron microscopy (TEM), three corpora allata for each T0 and T0t, and 3 corpora allata of treated females and 3 of controls were prepared for each T1, T2 and T3, for a total of 24 organs.

3. Results

3.1. Fecundity Bioassays

Fecundity was measured as the average number of eggs laid by females topically treated with 5, 25, 50 and 75 µg/µL diofenolan in comparison to controls (Table 1).
These tests showed significant differences between control and treated females (F[4, 15] = 90.12; p < 0.0001). Post hoc comparisons showed significant differences among females treated with the lowest dose (5 µg/µL) in comparison to all others (25, 50 and 75 µg/µL) (p < 0.0001). No significant differences were detected among the three highest doses (p > 0.05). In comparison to controls, fecundity in females treated with 5 µg/µL decreased about 32% and in those treated with 25 µg/µL about 66%. The treatments with 50 µg/µL and 75 µg/µL, respectively, caused a 70% and 72% decrease in fecundity (Table 1).

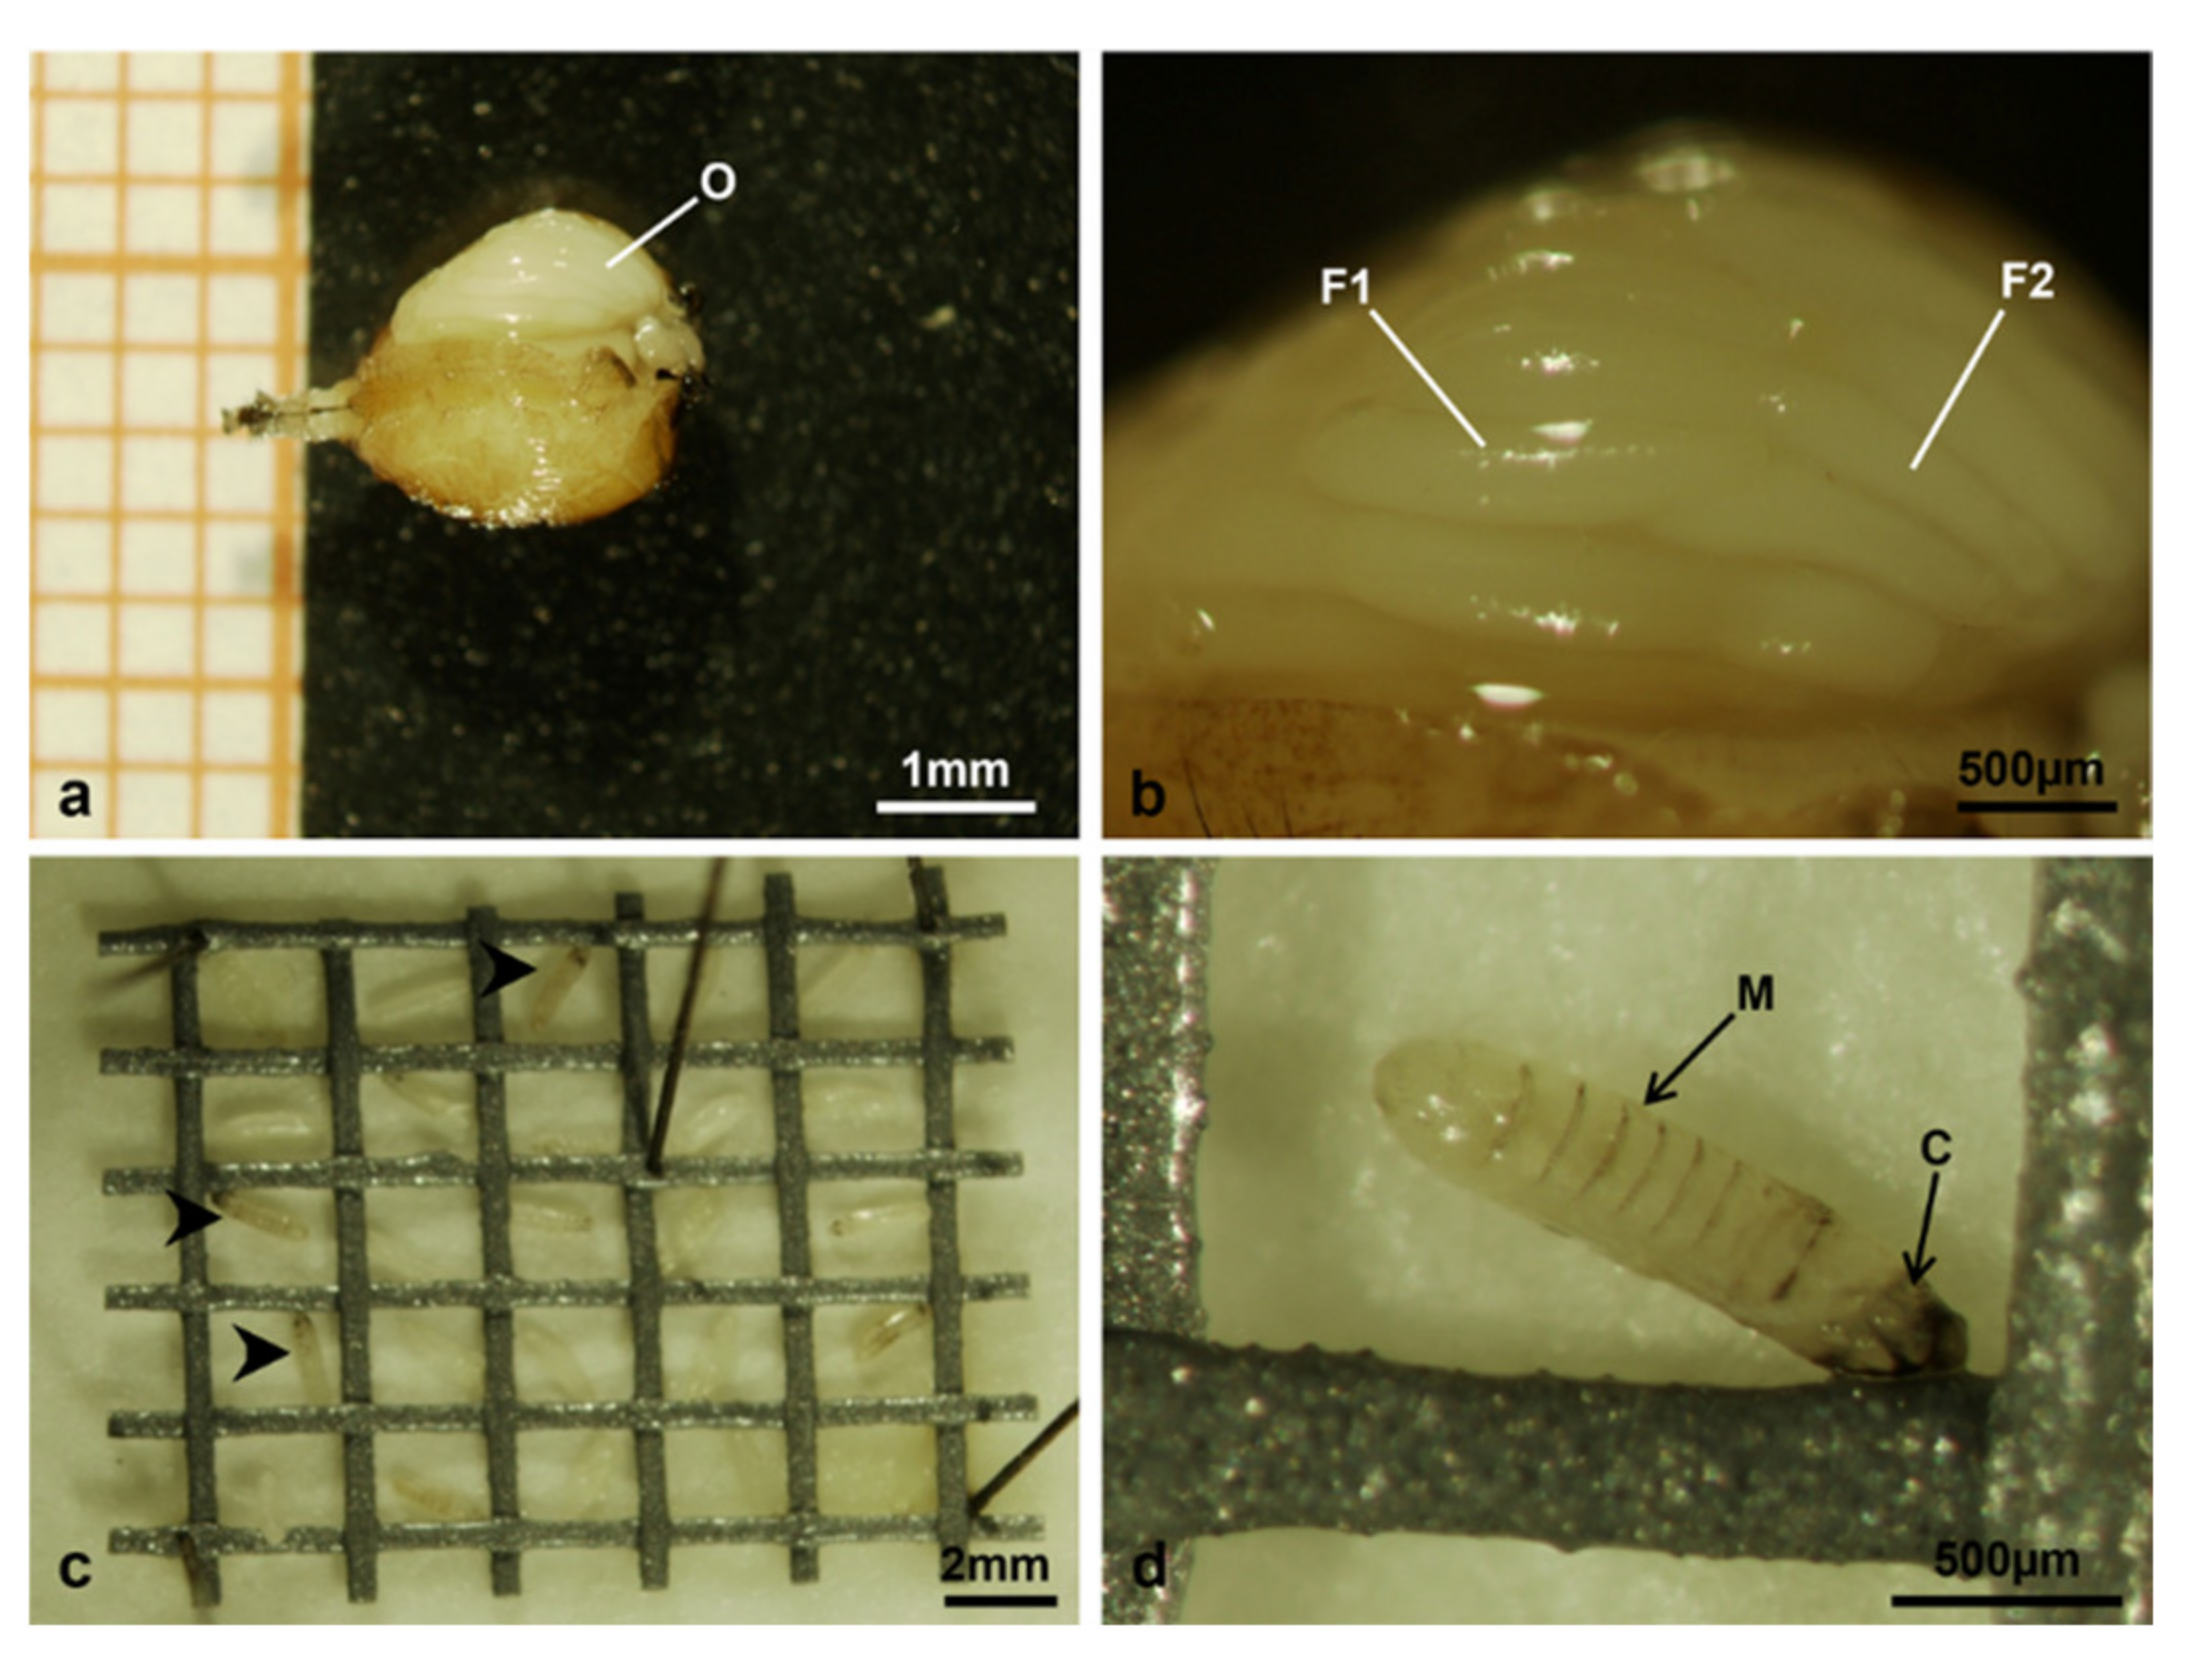
3.2. Stereomicroscope Observations

The ovarioles of all control females had a similar morphology, with a primary follicle containing a mature oocyte ready to be laid and a secondary follicle containing an oocyte in vitellogenesis, surrounded by nurse cells occupying 3/4 of the follicle (Figure 1a). On the contrary, the ovarioles of treated females at 90 h from emerging showed anomalous morphologies, among which ovarioles with hypertrophic secondary follicles (Figure 1b), completely immature ovarioles with only one follicle in vitellogenesis (Figure 1c) and an oocyte occupying about half of the follicle, and a secondary follicle in previtellogenesis. There were also ovarioles with a primary follicle identical to controls, but with a formless mass of cells (Figure 1d), probably an anomalous secondary follicle.

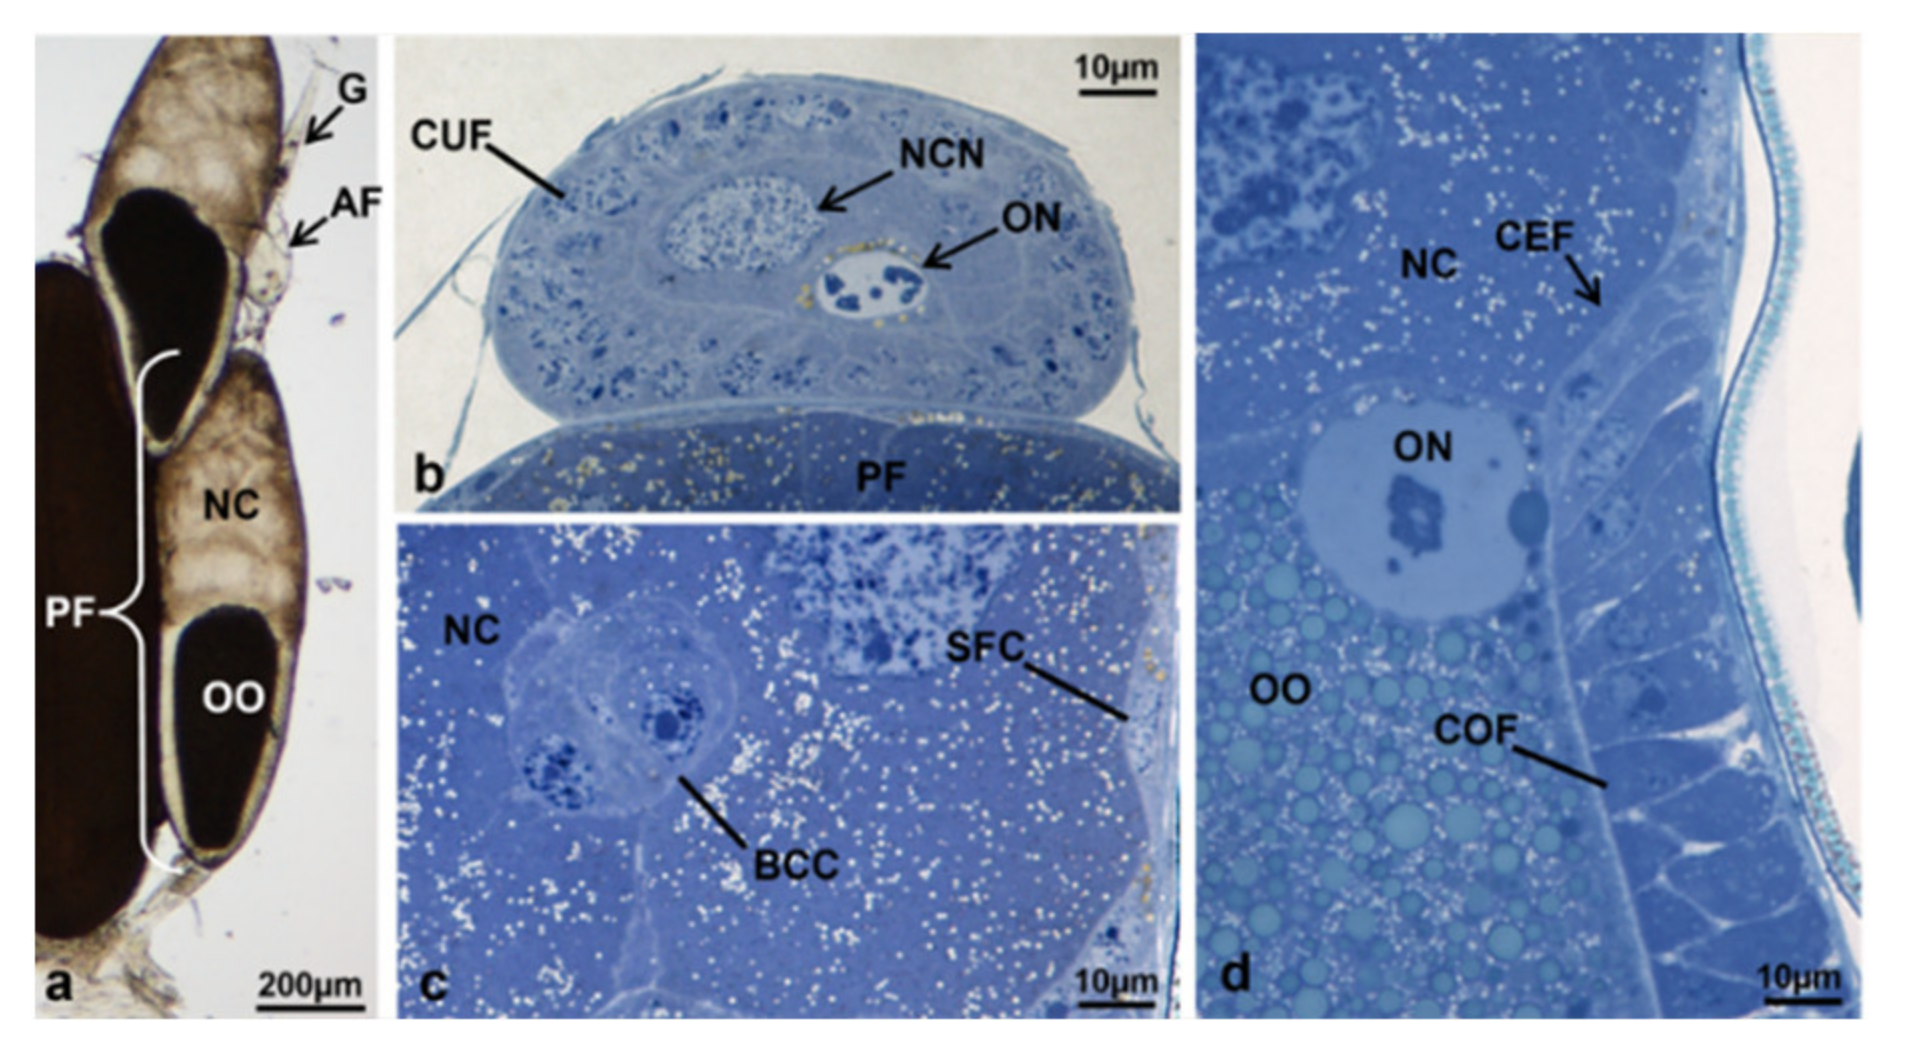
3.3. Ovariole Morphology at Different Exposure Times

The ovaries of females of M. domestica treated with 75 µg/µL diofenolan as described in Materials and Methods were examined by optical microscopy and transmission electron microscopy (TEM). The effects were observed in females at 0 (T0), 15 (T0t), 45 (T1), 70 (T2) and 90 h (T3) from emerging.
The ovaries of treated and control females were surrounded by a peritoneal lamina composed of a cell monolayer crossed by tracheae and tracheoles, closely associated with the epithelial sheath enveloping each ovariole. The sheath, composed of a thin cell layer, included muscle cells (Figure 2).
The germarium and the follicles were surrounded by a basal lamina. Morphological details of ovarioles are reported according to the different time intervals.

3.3.1. T0 (Emerging from Puparium)

In untreated females at emerging (T0), the ovariole was composed of the germarium and the vitellarium, which in turn was composed of only one follicle (Figure 3a).
The anterior end of the germarium was connected to a cylindrical terminal filament, composed of about 12 stacked cells (Figure 3b). The germarium appeared fusiform and located at the anterior end of the ovariole. It was divided into three regions: region 1, containing oogonia and cystoblasts; region 2, containing germ cell cysts; region 3, easily identifiable because of one round germ cell cyst, containing cells with round nuclei, larger than those of regions 1 and 2. A layer of follicle cells in the process of becoming cuboidal surrounded the germ cell cyst on three sides (Figure 3c–e). The posterior side of the germarium was connected to the vitellarium by a cylindrical interfollicular stalk composed of 5–8 somatic cells, flat and stacked (Figure 3f). A uniform layer of cuboidal follicle cells surrounded the round primary follicle. According to the nuclear morphology, two cell types could be identified in the primary follicle, the nurse cells and the oocyte. The nurse cells were located in the anterior part of the follicle and had large round nuclei, with condensed heterochromatin. The oocyte, with a large nucleus, was in the posterior part of the follicle. Large intercellular spaces clearly marked the boundary between nurse cells and the oocyte (Figure 3g).

3.3.2. T0t (15 h from Emerging, Topical Treatment)

Ovarioles at 15 h from emerging, at the time of the topical treatment with diofenolan or with acetone for controls (T0t), was composed of a germarium and a vitellarium containing a primary and a secondary follicle (Figure 3h). The primary follicle was located at the posterior end of the ovariole, and the secondary between the primary follicle and the germarium. The germarium and the secondary follicle had morphology similar to that of T0 (Figure 3i). The primary follicle, elliptic in shape, was about eight times larger than that of the primary follicle in T0. The primary follicle was clearly in vitellogenesis because many lipid droplets, accumulated in the oocyte, were visible as dark areas in freshly made optical preparations (Figure 3j,k). The cells lining the follicle in lateral and anterior sides were still cuboidal, but those in contact with the oocyte were in the process of becoming columnar. Within the primary follicle, the nurse cells, located in the anterior part of the follicle, occupied about 85% of the area and were characterized by large and round euchromatic nuclei with irregular envelopes, small lumps of heterochromatin and a nucleolus near the envelope. The oocyte occupied 7.5% of the total area of the follicle; its eccentric heterochromatic nucleus was smaller in comparison to those of the nurse cells (Figure 3j,k). The remaining part of the primary follicle was occupied by follicle cells.

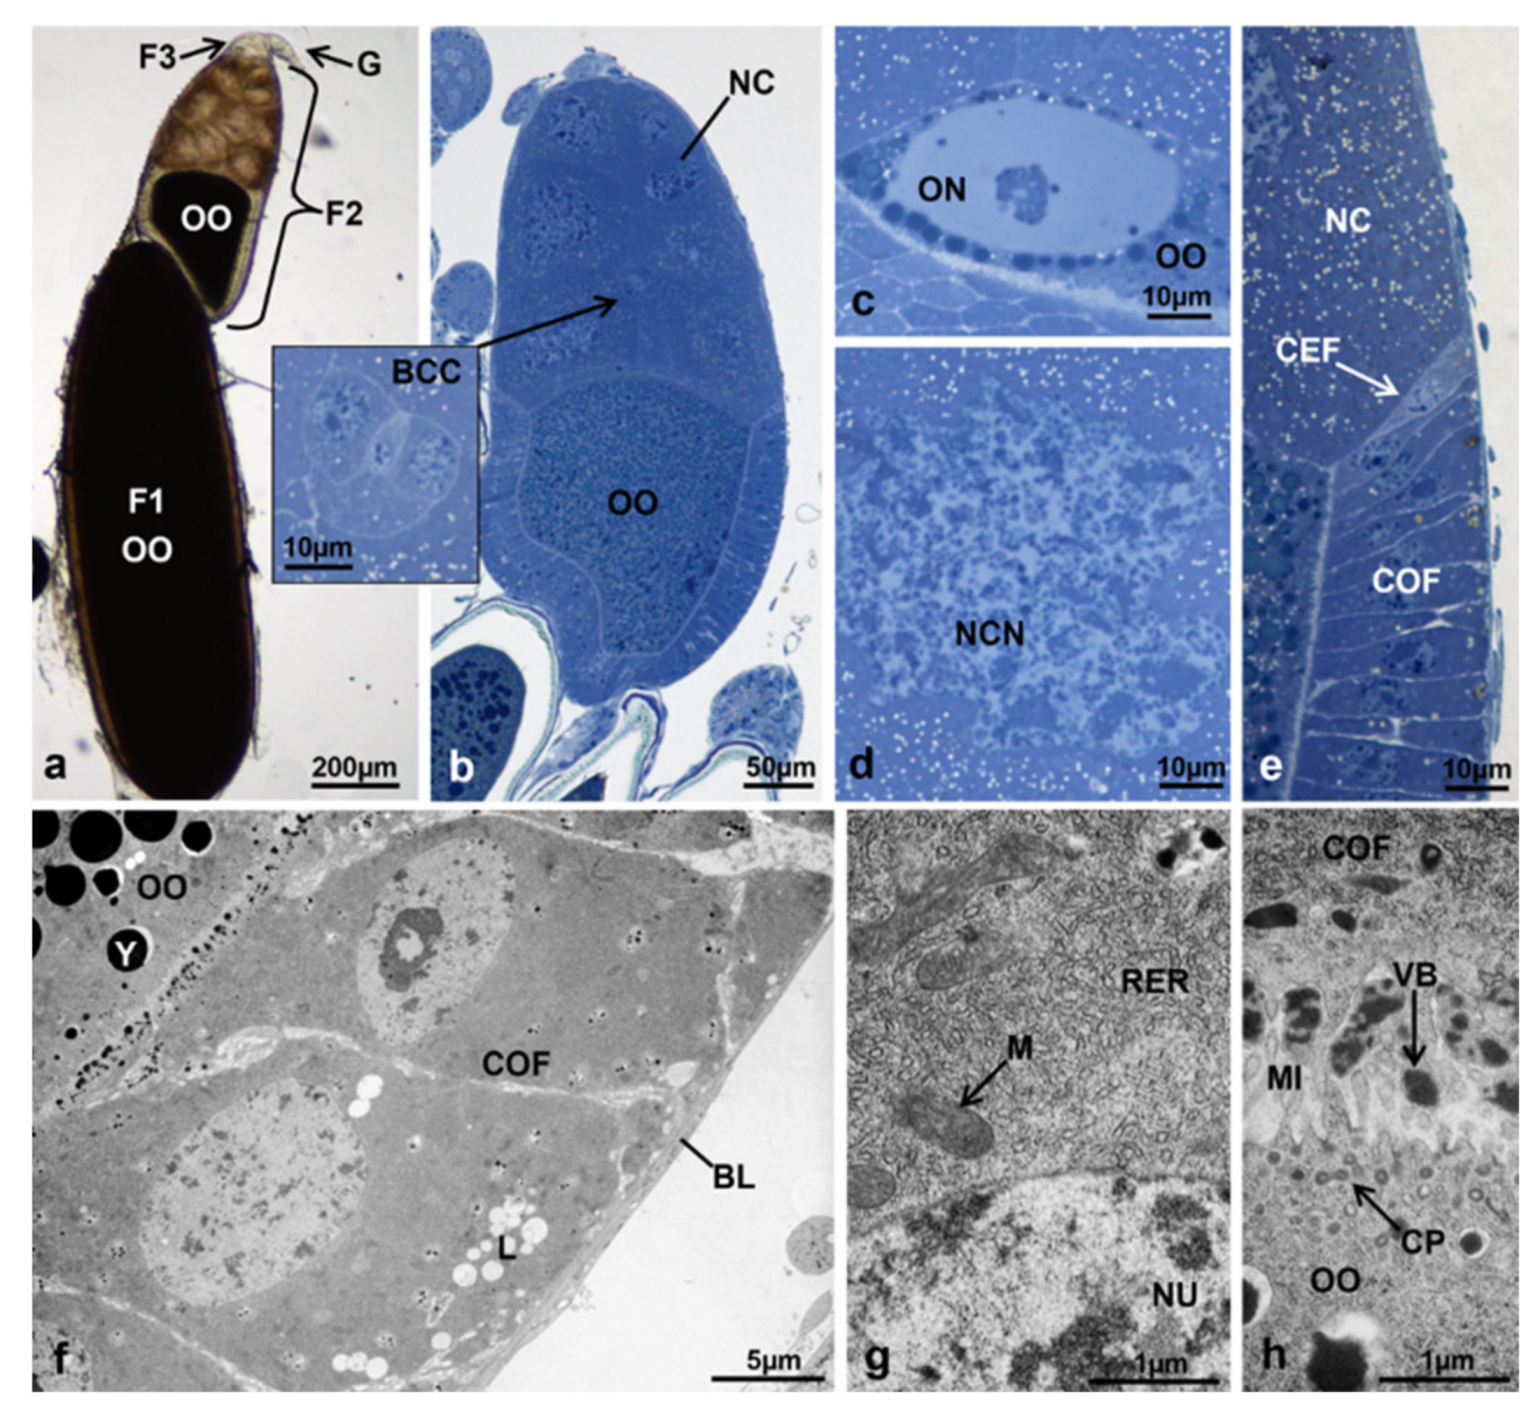
3.3.3. T1 Controls (45 h from Emerging, 30 h after Treatment)

In controls at T1, the ovariole was composed of a germarium and a vitellarium, containing a primary, a secondary and a tertiary follicle (Figure 4a). The germarium had morphology similar to that of T0. The round tertiary follicle was in previtellogenesis because the oocyte could not be clearly distinguished from the other cells. Inside the follicle lined by cuboidal cells, there were only cells with round nuclei (Figure 4b). A uniform layer of cuboidal cells also surrounded the secondary follicle. Two cell types were found inside the secondary follicle, the nurse cells and the oocyte. The nurse cells were located in the anterior part of the follicle and occupied 90% of the total follicle area. They had large round nuclei with irregular envelopes, small lumps of heterochromatin and an eccentric nucleolus. The oocyte occupied only 5.1% of the total follicle area and appeared in vitellogenesis because it contained lipid droplets and had a heterochromatic nucleus (Figure 4c). The primary follicle, in advanced vitellogenesis, was elliptic with the longer axis corresponding to the anteroposterior orientation of the follicle (Figure 4a). The oocyte was located in the posterior region, occupied 41.8% of the total follicle area and had a round nucleus (Figure 4a,d). The nurse cells, located in the anterior region, occupied 46.4% of the total area of the follicle (Figure 4a). They were characterized by large nuclei with irregular envelopes, heterochromatin condensed in irregular lumps (Figure 4e) and uniform cytoplasm rich in lipid droplets (Figure 4f–h). In the primary follicle, four types of cells were detected. The first type consisted of columnar follicle cells, lining the oocyte along the two sides and its base (Figure 4i). The second type consisted of centripetal follicular cells that separated the nurse cell region from the oocyte (Figure 4f). The third type consisted of a border cell cluster derived from follicle cells located in the anterior pole of the follicle: these cells reached the interface nurse cells-oocyte by a migration process (Figure 4g). The fourth type consisted of squamous follicular cells forming an epithelium lining the nurse cell region (Figure 4h).

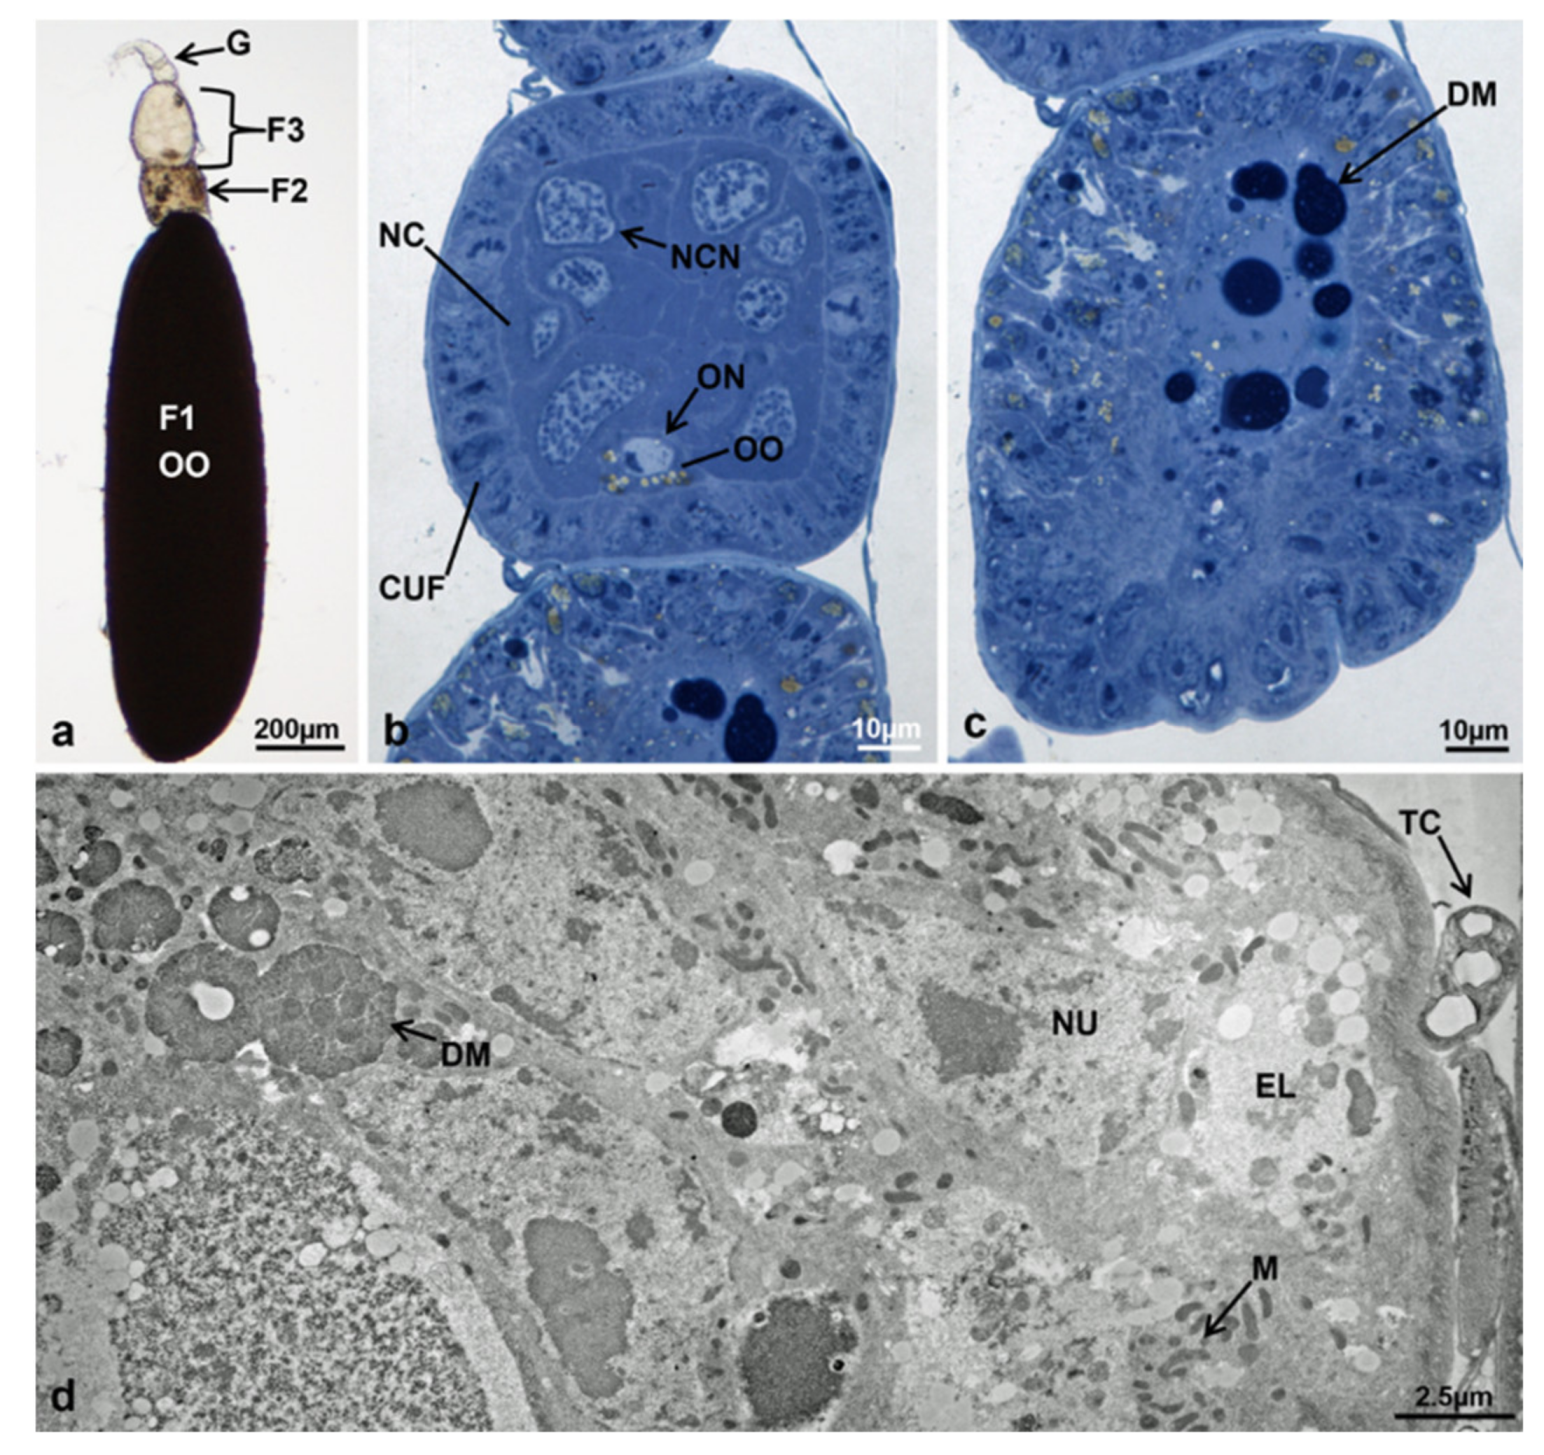
3.3.4. T1 Treated (45 h from Emerging, 30 h after Treatment)

At T1, two ovariole morphotypes (1 and 2) could be identified in treated females. Morphotype 2 was in turn divided into two variants, A and B, because of differences in secondary follicle morphology detectable only by optical microscopy in resin.
Morphotype 1. The ovariole was composed of the germarium and of the primary and secondary follicles (Figure 4j). The germarium, located at the anterior end of the ovariole, had a morphology similar to that of T0 (Figure 4k). The elliptic secondary follicle was lined by a uniform layer of cuboidal cells and had a morphology that was very similar to the secondary follicle of T1 controls. Inside the follicle, there were the nurse cells and the oocyte. The nurse cells, located in the anterior part of the follicle, occupied 91.8% of the total follicle area, and the oocyte, with a cytoplasm rich in lipid droplets, only 3.5% (Figure 4l). In comparison to T1 controls in which the primary follicle was in advanced vitellogenesis and the oocyte occupied 41.7% of the area of the follicle, the primary follicle of morphotype 1 was completely different. It was fully degenerated and contained only an elongated mass of cells, localized inside the epithelial sheath (Figure 4m).
Morphotype 2 (variants A and B). In this morphotype, the ovariole appeared at optical microscopy very similar to that of controls of the same time interval, with a germarium and a primary, secondary and tertiary follicle (Figure 5a). However, at optical microscopy in resin two variants of this morphotype were recognized, A and B, based on the morphology of the secondary follicle. Both variants shared the structure of the germarium and of the primary and tertiary follicles. The germarium had morphology similar to T0, while the tertiary follicle had a morphology similar to T1 controls. Within the secondary follicle, the nurse cells occupied 91.3% of the area and the oocyte in early vitellogenesis only 3.4%. In variant A, the secondary follicle was very similar to the secondary follicle of T1 controls. In variant B, the follicle was different from variant A and from T1 controls, because its cytoplasm was more intensely stained in both nurse cells and the oocyte, with dark regions of variable size in follicle cells. These morphological features could indicate early degenerative stages (Figure 5b,c). The primary follicle had a morphology very similar to that of the primary follicle in T1 controls, with the oocyte occupying 53.1% of the total follicle area and the anterior nurse cells 35.8% (Figure 5a).

3.3.5. T2 Controls (70 h from Emerging, 55 h after Treatment)

Ovaries belonging to T2 controls showed ovarioles with a germarium and three follicles, primary, secondary and tertiary (Figure 6a). The germarium had a morphology similar to that of T0 and the tertiary follicle to that of T1. The elliptic secondary follicle (Figure 6a–c) had a morphology similar to that of the primary follicle at T0t. This follicle was in vitellogenesis because of the presence of lipid droplets in the posterior region (Figure 6b). The nurse cells had large round nuclei and were located in the anterior part of the follicle, occupying 78.4% of it. The oocyte occupied only 7.1% of the total area (Figure 6b,c). The primary follicle was almost completely occupied by the oocyte, due to degeneration of nurse cells. Three main regions were identified in the oocyte: the yolk-rich cytoplasm (ooplasm), the vitelline membrane and the chorion (Figure 6a,d–f). The ooplasm mass, surrounded by the tiny vitelline membrane (Figure 6f), occupied all the inner volume of the oocyte and contained many lipid droplets and other larger droplets of variable size (Figure 6e). At this time interval, the nucleus was no longer visible due to the disappearance of the nuclear envelope. The chorion was clearly visible. In a similar way to nurse cells, also the follicle cells underwent degeneration and were reduced to a thin cell layer in the lateral and posterior side of the oocyte and to a formless cell mass in the anterior part in contact with the secondary follicle. When eggs were laid, the follicle cells and the epithelial sheath formed the corpus luteum (Figure 6d).

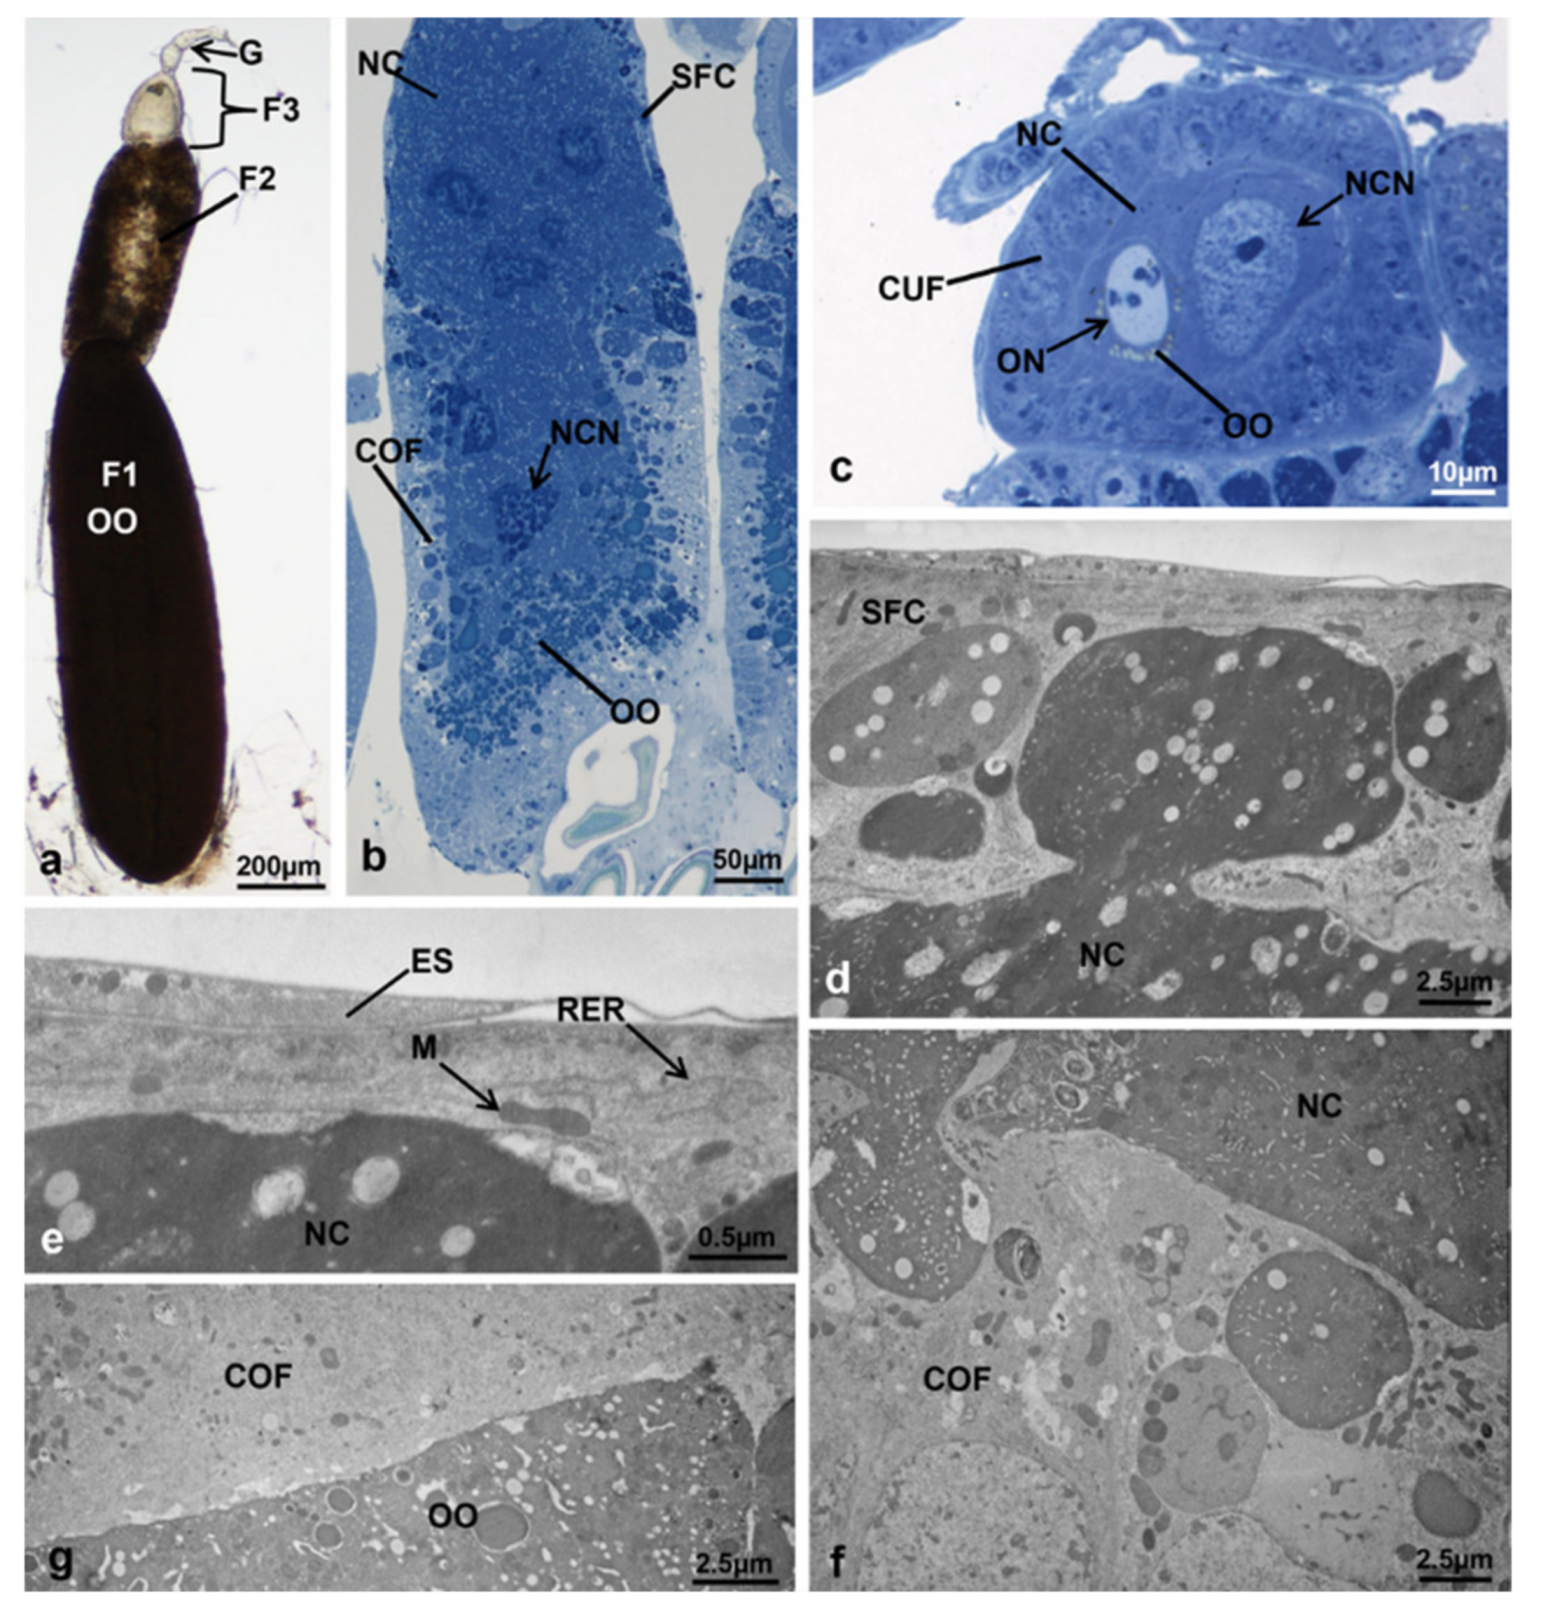
3.3.6. T2 Treated (70 h from Emerging, 55 h after Treatment)

At T2, three ovariole morphotypes (3, 4 and 5) could be identified.
Morphotype 3. Each ovariole was composed of a germarium and a primary, secondary and tertiary follicle, whose general morphology was similar to that of T2 controls but with a more developed secondary follicle (Figure 6g). The germarium, in the anterior part of the ovariole, had a similar morphology to T0. The tertiary follicle (Figure 6h), unlike T2 controls, contained a more developed oocyte, identifiable because of large lipid droplets. The secondary follicle had an elliptic shape, posteriorly deformed by the contact with the primary follicle (Figure 6g,i). As in T2 controls, the nurse cells were localized in the anterior part of the follicle and occupied 76.6% of the entire follicle. The oocyte, in the posterior part, showed clear signs of vitellogenesis and occupied 11.6% of the follicle. As in T2 controls, the follicle cells were cuboidal near the nurse cells and columnar at the oocyte base (Figure 6i–k). The primary follicle had a morphology very similar to that of T2 controls.
Morphotype 4. Each ovariole was composed of a germarium and a primary, secondary and tertiary follicle. The distinctive feature of this morphotype was the secondary follicle, completely different from that of T2 controls (Figure 7a). The germarium had a morphology similar to T0. The tertiary follicle, unlike T2 controls, showed an initial differentiation of the oocyte (Figure 7b). The secondary follicle, characterizing this morphotype, was composed of a cell mass devoid of the typical cells of this stage (oocyte, nurse cells and follicle cells) (Figure 7a,c). Some inner organization was still detectable, such as a cortical layer characterized by lipid droplets and small dark masses, and a central area with wide dark masses. These results support the hypothesis that this follicle was in the degenerative stage (Figure 7c). The primary follicle had a morphology similar to T2 controls (Figure 7a).
Morphotype 5. The ovariole, composed of a germarium and a primary, secondary and tertiary follicle, was similar to morphotype 1, with a developing tertiary follicle and a more advanced secondary follicle (Figure 7d,e). The germarium had a morphology similar to that of T0. The tertiary follicle had a morphology similar to those of morphotypes 3 and 4. In the secondary follicle, the nurse cells, located in the anterior part, occupied 79.9% of the total area, and the oocyte occupied 10.2% (Figure 7e–g). The primary follicle was almost completely degenerated, with only a small oval mass inside the epithelial sheath (Figure 7h).

3.3.7. T3 Controls (90 h from Emerging, 75 h after Treatment)

The ovaries of T3 controls had ovarioles composed of a germarium and a primary, secondary and tertiary follicle (Figure 8a). The germarium had a morphology similar to T0. The tertiary follicle contained an oocyte about the same size as a nurse cell, characterised by a cytoplasm rich in lipid droplets (Figure 8b). The secondary follicle had an elliptic shape, according to the space available, and a morphology similar to that of T2, with the oocyte occupying 11.8% of the total follicle area and the nurse cells 76.7% (Figure 8a,c,d).
Since T3 was the interval showing the most conspicuous alterations, ultrastructure observations were conducted by TEM as described in the Materials and Methods section.
In the secondary follicle, four cell types were identified by TEM: the columnar follicle cells, the cuboidal follicle cells, the oocyte and the nurse cells. The first type, the columnar follicle cells, were located at the oocyte base (Figure 8c), had an electron-dense cytoplasm and endoplasmic reticulum with concentric membranes, often surrounding lipid droplets (Figure 8f). The nuclei were rather elliptic with asymmetric nucleolar content (Figure 8g) and the cell edges facing the basal lamina had irregular invaginations (Figure 8h). The intercellular spaces were clearly visible and the interface with the oocyte had interdigitating microvilli with larger spaces (Figure 8e,i).
The second type, the cuboidal follicle cells, lined the follicle near the nurse cells (Figure 8d and Figure 9a) and had a cytoplasm rich in endoplasmic reticulum, mostly arranged in circles around lipid droplets (Figure 9b). In these cells, the mitochondria were characterised by an electron-dense matrix and their nuclei were roundish with asymmetric nucleolar content (Figure 9c). Irregular invaginations could be observed at the edge of these cells near the basal lamina (Figure 9b). The intercellular spaces were scarcely visible and the interface with nurse cells was rich in interdigitating microvilli with reduced spaces (Figure 9d).
The third cell type, the oocyte (Figure 8a,c), had an electron-dense ooplasm and mitochondria heterogeneously distributed (Figure 8i and Figure 9e), mostly at the interface follicle cells-oocyte and nurse cells-oocyte (Figure 9e). Many lipid and protein droplets were visible in the ooplasm (Figure 8e,i). At the interfaces of the follicle cells-oocyte (Figure 8i) and nurse cells-oocyte (Figure 9f), the oocyte membrane showed many interdigitating microvilli, with wider spaces in comparison to those of the interface follicle cells-nurse cells (Figure 9d,e).
The fourth cell type, the nurse cells, were characterized by an electron-dense cytoplasm with lipid droplets, nuclei with irregular envelopes, lumps of heterochromatin and irregular nucleoli (Figure 8d and Figure 9d,f). The primary follicle had morphology similar to that of T2 controls (Figure 8a).

3.3.8. T3 Treated (90 h from Emerging, 75 h after Treatment)

Four ovariole morphotypes (6, 7, 8, and 9) were identified in the ovaries of T3 treated females.
Morphotype 6. The ovariole was composed of a germarium and a primary, secondary and tertiary follicle (Figure 10a). The germarium had a morphology similar to T0. The tertiary follicle was similar to that of morphotypes 3 and 4. The secondary follicle was much more developed in comparison to that of T3 controls, with the oocyte occupying 43.3% of the entire area and the nurse cells 40% (Figure 10a,b). The oocyte had a nuclear morphology similar to that of the primary follicle in T1 controls (Figure 10c). The nurse cell nuclei had irregular borders with chromatin similar to that of the primary follicle in T1 controls (Figure 10d).
Besides the larger size, the secondary follicle showed another difference in comparison to T3 controls: there were four types of follicle cells, as in the primary follicle of T1 controls. The columnar cells lining the oocyte at the sides and at the base composed an epithelium with intercellular spaces (Figure 10e,f). In these cells, the cytoplasm contained a high amount of rough endoplasmic reticulum and mitochondria of variable shapes, and the elliptic nucleus had variously condensed heterochromatin (Figure 10f,g). The interface follicle cells-oocyte was characterized by many interdigitating microvilli protruding from both cell types. Intense pinocytotic activity was visible in the oocyte membrane (oolemma) marked by the presence of newly formed coated pits. The same interface had many electron-dense vitelline bodies, precursors of the vitelline membrane (Figure 10f,h). The squamous cells were dorsoventrally flattened and composed an epithelium lining the follicle near the nurse cells (Figure 11a). These cells were characterised by a rather electron-lucent cytoplasm with mitochondria of variable size and an electron-dense matrix, and a linear endoplasmic reticulum (Figure 11b).
The interface squamous cells-nurse cells did not show any microvilli (Figure 11b). The basal lamina was still visible on the outside of the follicle (Figure 11a). The border cell cluster, visible at optical microscopy in the process of migrating among nurse cells (Figure 10b, inlay), was characterized by two cell types: the polar anterior cells at the centre of the cluster, and the border cells surrounding them (Figure 11c). The polar anterior cells had irregular nuclei, very large in comparison to the cell size, with lumps of heterochromatin. The cytoplasm was extremely reduced and had small mitochondria with an electron-dense matrix (Figure 11d). The nuclei and cytoplasms of the border cells were much larger than those of polar anterior cells. These nuclei were characterized by heterochromatin condensed in lumps and a central nucleolus (Figure 11c).
Numerous ribosomes, either scattered or associated with the endoplasmic reticulum, were visible in the cytoplasm together with mitochondria with an electron-dense matrix (Figure 11e). The edges of the border cells were irregular with microvilli only in very few zones (Figure 11f). In morphotype 6, the centripetal follicle cells of the secondary follicle began to migrate along the interface oocyte-nurse cells (Figure 10e and Figure 11g). These cells were similar to squamous follicle cells because of an elliptic nucleus, a less electron-dense cytoplasm and mitochondria of variable shape with an electron-dense matrix (Figure 11g and inlay).
As in squamous epithelial cells, no microvilli were visible at the interfaces centripetal cells-oocyte and follicle cells-nurse cells, and the cell borders were clearly distinguishable (Figure 11g and inlay).
The oocyte was different from that of T3 controls because of its intense pinocytotic activity accumulating large electron-dense vesicles (Figure 10h and Figure 11g). However, the primary follicle (Figure 10a) had a similar morphology to the primary follicle of T3 controls.
Morphotype 7. Each ovariole was composed of a germarium and a primary, secondary and tertiary follicle (Figure 12a). As in morphotype 4 at T2, the typical feature of morphotype 7 was the secondary follicle, very anomalous in comparison to T3 controls. The germarium had a morphology similar to that of T0. The tertiary follicle was larger and more developed in comparison to the tertiary follicle of T3 controls. The cuboidal follicle cells, organized in only one layer, surrounded two cell types, the nurse cells and the oocyte. The nurse cells occupied 94.3% of the total follicle area. The oocyte occupied only 2.8% of the total follicle area and had a cytoplasm rich in lipid droplets, marking the entrance in vitellogenesis (Figure 12b).
As the secondary follicle of morphotype 4 at T2, the secondary follicle of morphotype 7 was composed of a cell mass organized in two regions, a cortical and a central one (Figure 12c). The cortical layer was composed of cells (presumably follicular) with irregular borders, nuclei of variable size with abundant heterochromatin organized in a large central mass and many scattered fragments (Figure 12d). At the optical microscopy, the central region was characterized by dark masses, which appeared as being highly electron-dense by TEM (Figure 12d). All these morphological features strongly suggested that the follicle was in the degenerative stage (Figure 12c). The primary follicle (Figure 12a) was similar to that of T3 controls.
Morphotype 8. The ovarioles of this morphotype were composed of a germarium and a primary, secondary and tertiary follicle (Figure 13a). The secondary follicle was highly anomalous in comparison to T3 controls (Figure 13b).
The germarium had a morphology very similar to T0 and the tertiary follicle had a morphology similar to T3 controls (Figure 13c). However, the secondary follicle appeared as a formless mass (Figure 13a,b) in which the same cell types observed with optical microscopy and TEM in T3 controls (follicle cells, nurse cells and oocyte) had markedly altered morphology (Figure 13b). The follicle cells showed only two cell subtypes, the squamous cells bordering the nurse cells (Figure 13b,d,e), and the columnar cells occupying half of the lateral and basal side of the follicle (Figure 13b,f). No centripetal cells and a border cell cluster were observed. The squamous follicle cells had large round electron-dense areas in their cytoplasm (Figure 13d), the columnar follicular cells had electron-lucent areas (Figure 13f), and no interdigitating microvilli were visible at the interface columnar follicular cells-oocyte (Figure 13g), as in T3 controls. The nurse cells with strongly heterochromatic nuclei (Figure 13b) not only invaded the squamous and columnar follicular cell layers (Figure 13d,f) but also most of the region normally occupied by the oocyte and part of the columnar cell layer, segregating the oocyte at the posterior end of the follicle (Figure 13b). All these morphological features strongly suggested a degenerative stage of the follicle. The primary follicle (Figure 13a) had morphology similar to that of T3 controls.
Morphotype 9. This morphotype was composed of a germarium and a vitellarium, in turn, composed of two follicles, called “anterior” and “posterior” because their order of development could not be identified (Figure 14a). The germarium had morphology very similar to T0. The “anterior” follicle (Figure 14b) was similar to the tertiary follicle of T3 controls. The “posterior” (Figure 14a) follicle had a morphology similar to the secondary follicle of morphotype 6 with the same types of cells (Figure 14c,d).

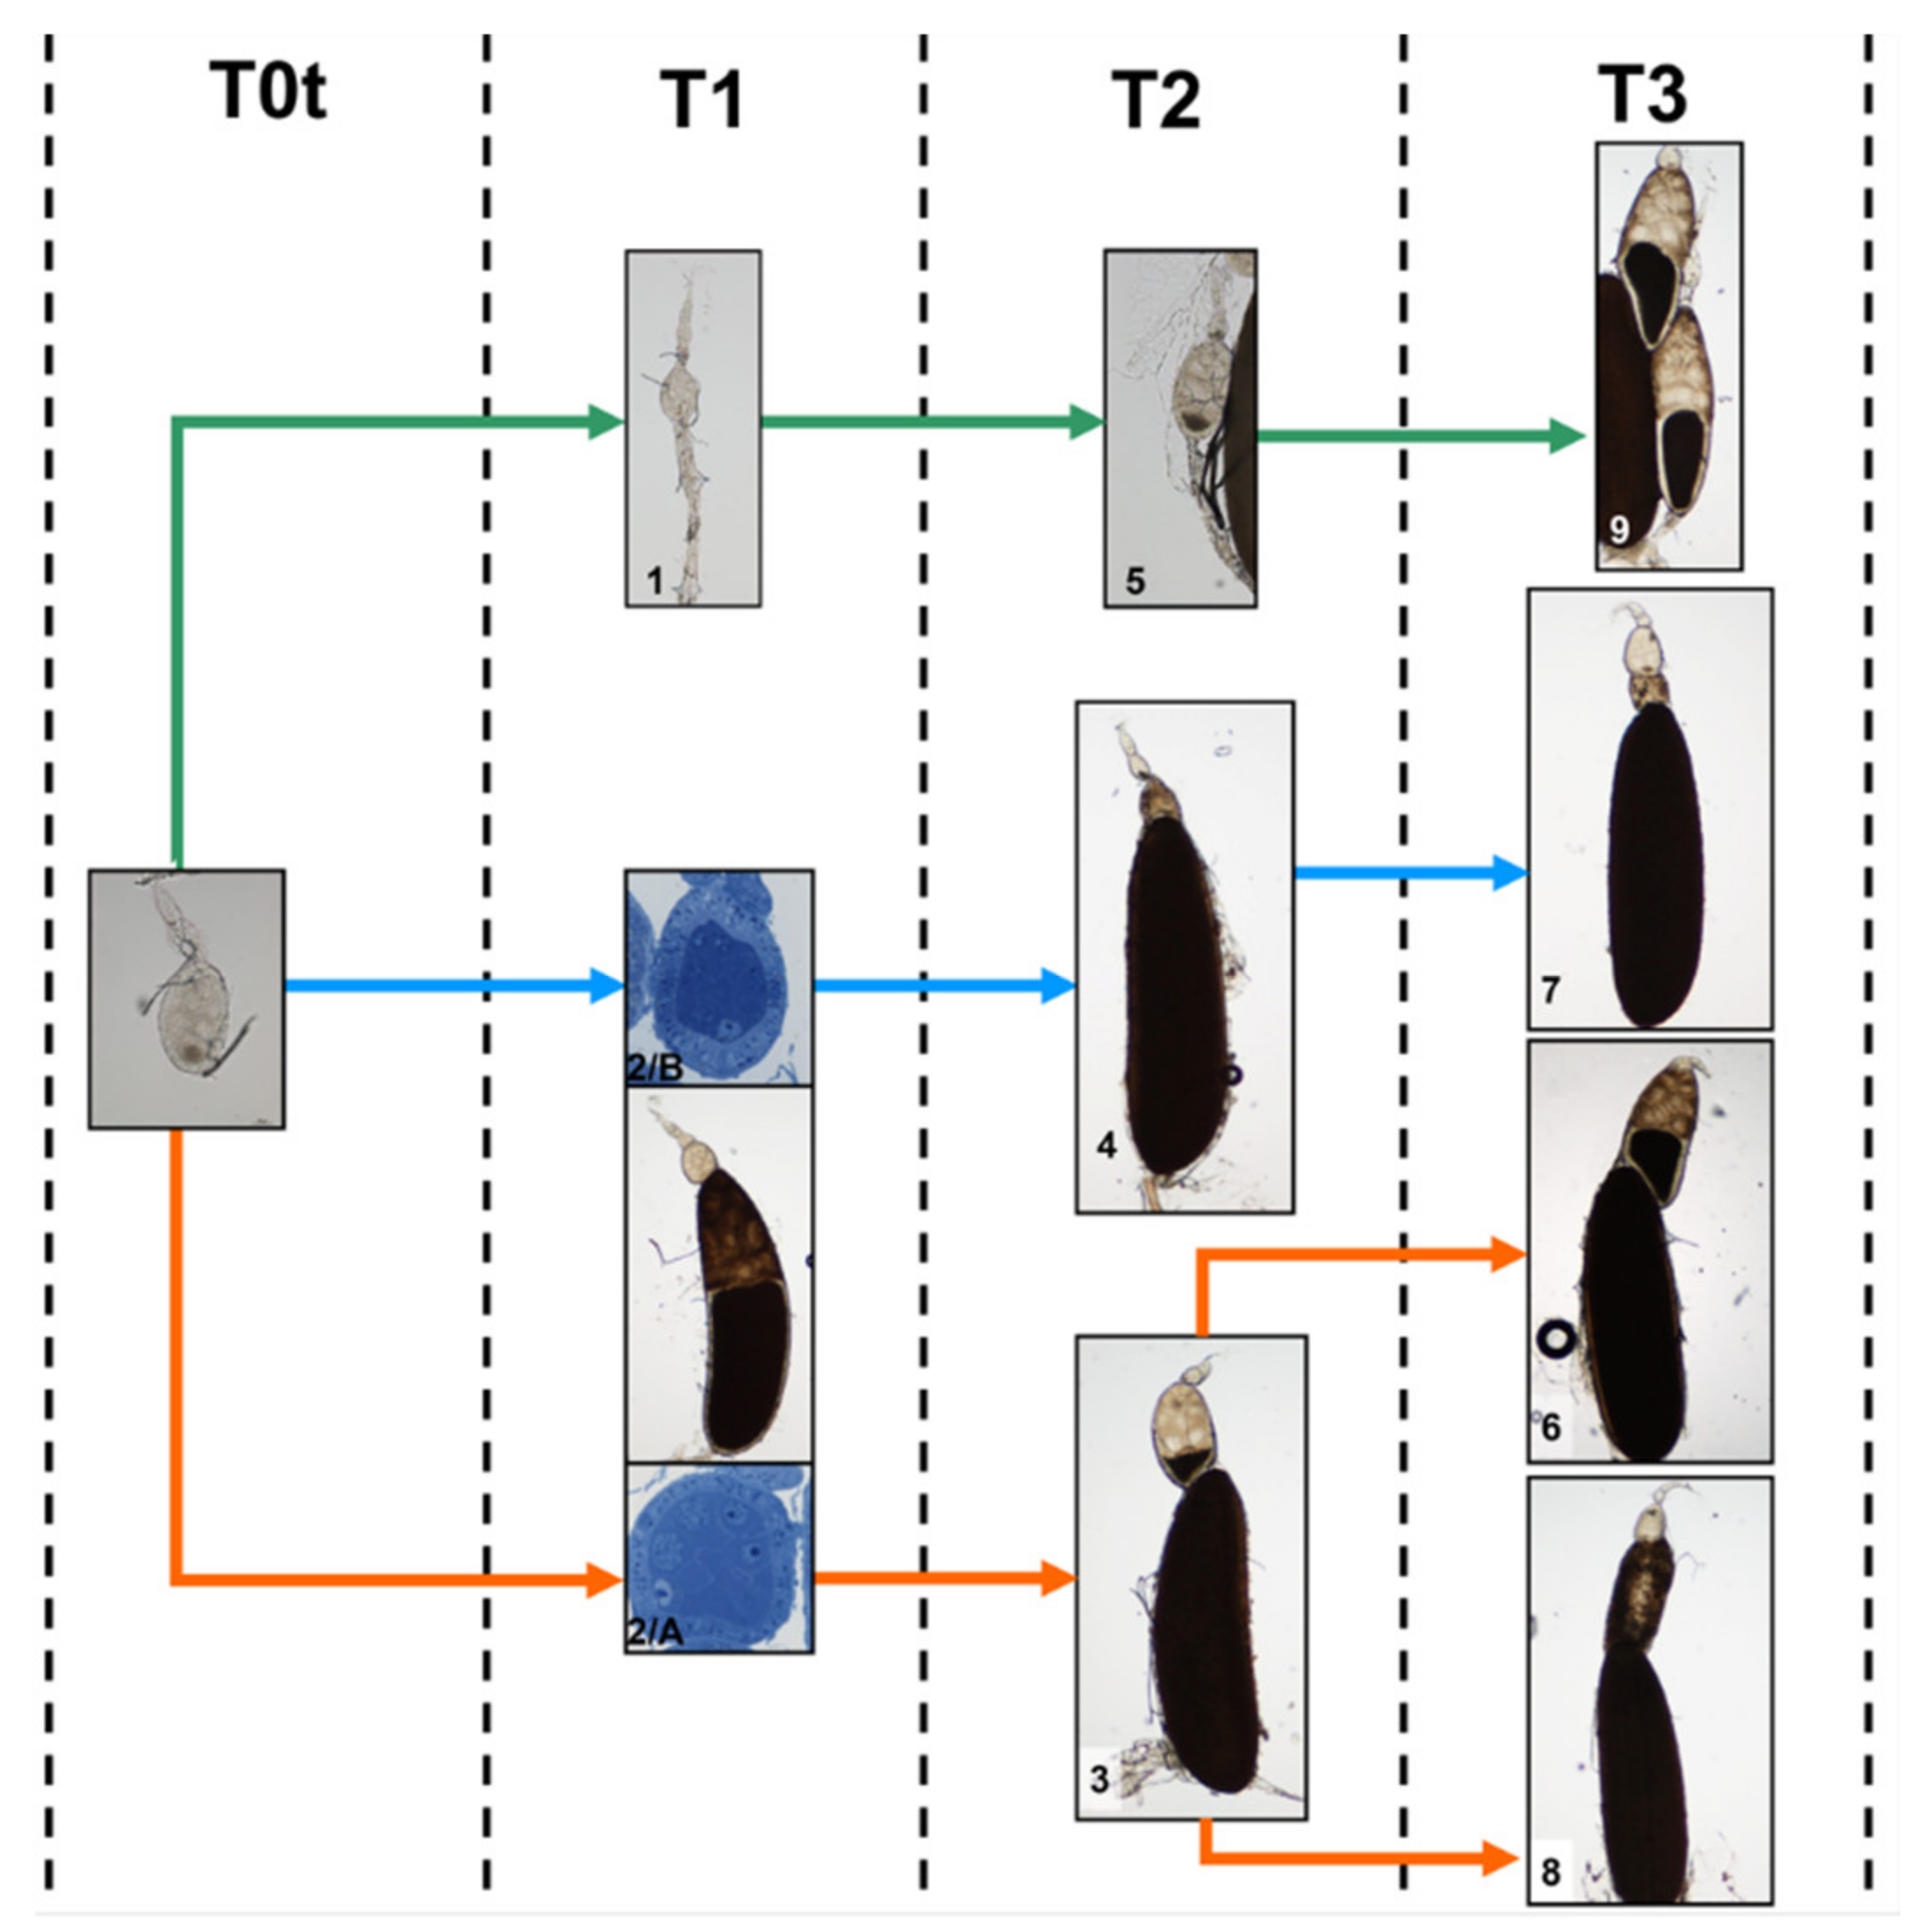
3.4. Paths of Ovariole Transformation

For a dynamic overview of the previously observed morphological alterations and in order to identify hypertrophic or degenerative events, the morphotypes were arranged in succession from T0t (15 h from emerging, time of treatment) to T3 (90 h from emerging) (Figure 15). No anomalies and/or alterations of follicles were visible in the controls from T0t to T3. On the contrary, in treated females, several alterations were visible, mostly in the primary and secondary follicles. The morphotypes characterized by these alterations could be summarized in three “transformation paths” of the ovariole, starting from T0t (Figure 15).
Path A. This path involved morphotypes 1 (T1, 45 h from emerging), 5 (T2, 70 h from emerging) and 9 (T3, 90 h from emerging). These morphotypes had residues of the primary follicle initiating degeneration between T0t and T1; the primary follicle progressively decreased in size and almost disappeared in morphotype 9.
According to morphological data, the following hypothesis may be advanced: morphotype 1 could have become morphotype 5 between T1 and T2, and morphotype 5, in turn, could have become morphotype 9 between T2 and T3.
Path B. This path involved morphotypes 2/B (T1), 4 (T2) and 7 (T3). All these morphotypes had morphological anomalies of the secondary follicle. In morphotype 2/B, the cytoplasm of nurse cells and the oocyte were intensely stained and follicle cells had dark variable aggregates, possibly marking initial degenerative events. Morphotypes 4 and 7 had irregular cell masses indicating degenerative events.
Based on these data, it is likely that morphotype 2/B, showing a secondary follicle with signs of degeneration, advancing between T1 and T2, transforming into morphotype 4 at T2 and maintaining such condition at T3 as morphotype 7.
Path C. This path involved morphotypes 2/A (T1), 3 (T2), 6 and 8 (T3), and the secondary follicle was the most affected: in morphotype 2/A this follicle was very similar to control, in morphotypes 3 and 6 showed a more advanced developmental stage, and in morphotype 8 had a totally altered morphology.
Based on these data, morphotype 2/A had apparently no anomalies that could interfere with its development and transformed into morphotype 3 between T1 and T2. Concerning the secondary follicle, since that of morphotype 3 (T2) was smaller in comparison to that of morphotype 6 (T3), and both morphotypes did not show signs of degeneration, it is likely that morphotype 3 could mature into morphotype 6 (Figure 15).
Since both morphotypes 4 (T2) and 8 (T3) show signs of degeneration but the first one is much smaller than the second one, it is likely that morphotype 3 (and not morphotype 4) could develop into morphotype 8.

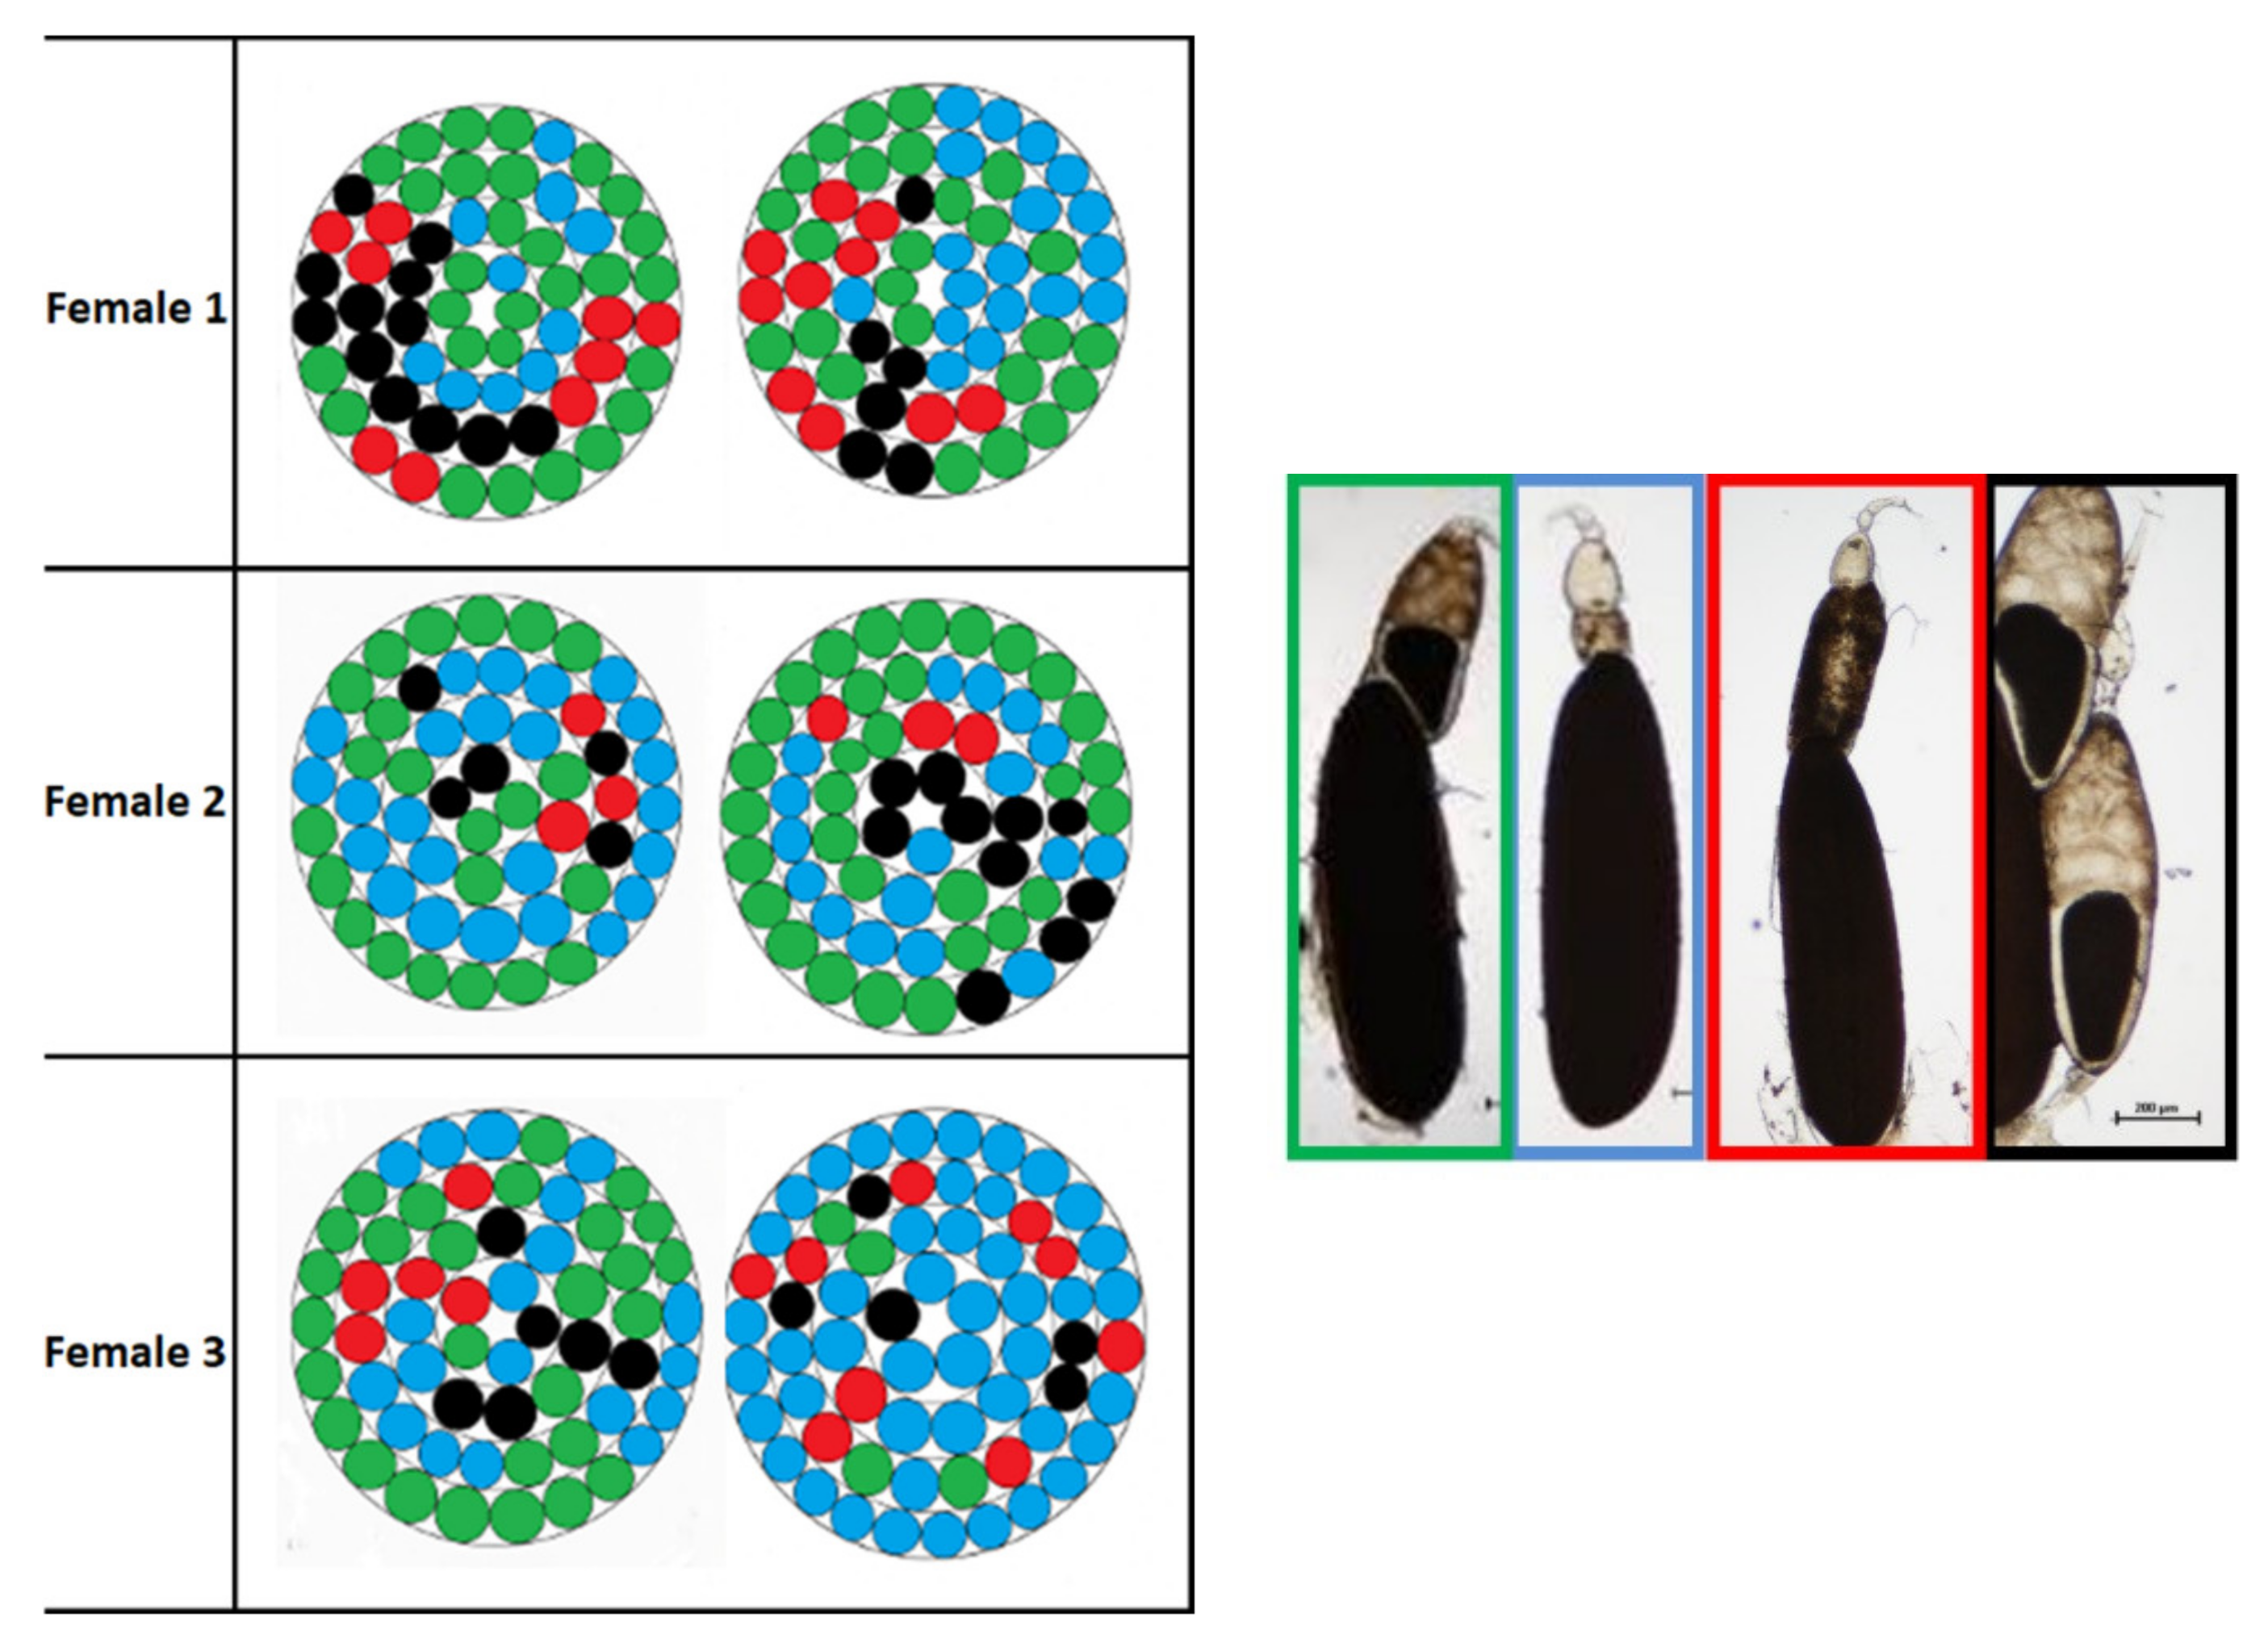
3.5. Ovariole Mapping and Counting

In order to examine the arrangement of the four morphotypes detected at the time interval T3, all ovarioles from both ovaries of females treated with 75 µg/µL diofenolan at T3 (90 h from emerging) were explanted, mapped and counted. A total of 10 females (5 treated and 5 controls) were used to calculate the average number of ovarioles in each ovary and 3 treated females (called 1, 2 and 3) were used for ovariole mapping. The ovaries of the treated females showed an arrangement of the ovarioles in four concentric circles, with average numbers respectively of 23.5, 18.5, 11.5 and 5.2 ovarioles in each circle from outside to inside. The average values of each circle were not significantly different (F[1, 41] = 0.0003; p = 0.99) in comparison to controls (Table 2).
The map of ovariole morphotypes shown in Figure 16 did not reveal any special arrangement of morphotypes in each concentric circle, neither within each ovary nor between an ovary and the contralateral one. Morphotype 6 was the most frequent in females 1 and 2, with percentages respectively 44.9% and 46.5%. In female 3, the percentage of morphotype 6 decreased to 26.5% and morphotype 7 was the most frequent (52.9%). The other two morphotypes (8 and 9) were much less frequent in all three females: percentages ranged from 5.3% to 16.1% for morphotype 8, and from 9.1% to 15.25% for morphotype 9. It was possible to detect some symmetry in females 1 and 2 because of similar percentages of morphotypes in the right and left ovary. However, in female 3, the arrangement of morphotypes was asymmetrical: the left ovary had percentages similar to those of the other two females (48% for morphotype 6, 33% for morphotype 7, 9% for morphotype 8 and 10% for morphotype 9). In the right ovary of female 3, however, the percentages were different: morphotype 7 was the most frequent (71%) and morphotype 6 the least frequent (6%). The other two morphotypes had percentages comparable to those of the ovaries of females 1 and 2 (14% for 8 and 8% for 9, respectively).
Concerning the average number of ovarioles in 5 treated females and 5 controls, examined at time intervals T0t, T1, T2 and T3 (Table 3), no significant differences (F[6, 63] = 0.71; p = 0.64) were observed in control and treated females at all time intervals.

3.6. Fecundity and Hatching at Each Deposition Cycle

The morphological investigations showed alterations and anomalies mostly concerning the secondary and tertiary follicles. These results required further fecundity tests to verify whether the anomalies and the significant decrease in oviposition recorded in the preliminary fecundity tests could be associated with a given egg deposition cycle. Comparing all control females, the number of eggs laid in the three egg deposition cycles ranged from about 60 to about 120, with only one exception, a female laying 86 eggs in the first cycle, 16 in the second and 21 in the third one. Concerning treated females, they all laid eggs in the first egg deposition cycle, although three of them laid a very low number of eggs (7, 9 and 15 eggs, respectively). In the second cycle, four females out of 10 did not lay eggs: three of them respectively laid 98, 100 and 106 eggs in the first cycle, and the fourth one laid only 9 eggs. In the second egg deposition cycle, three females out of 10 laid a similar number of eggs as in the first one. In the third egg deposition cycle, 7 out of 10 treated females laid no eggs. The treated females still laying eggs in the third cycle were only those regularly laying in the first and second cycle. However, in the third cycle, one of these three females laid half the number of eggs in comparison to those laid in the first and second cycle.
The results show that all treated females were able to complete the first egg deposition cycle (with some variability in egg-laying) but only 60% of them were able to complete the second cycle and only 30% of them were able to complete the third cycle.
Concerning the fecundity, measured as the average number of eggs laid in the three egg deposition cycles (Table 4), significant differences (F [1, 55] = 5.72; p = 0.02) were detected between control and treated females. Post hoc comparisons showed significant differences between control and treated females especially for the second (p < 0.0009) and the third (p < 0.0004) egg deposition cycle. Significant differences were also detected in treated females between the first and the second egg deposition cycle (p = 0.014) and between the first and the third egg deposition cycle (p = 0.0037). It is possible to conclude that in controls the fecundity did not change significantly (p > 0.70 for all comparisons) in the three egg deposition cycles, while in treated females a decrease in fertility and a progressive inhibition of fecundity was observed after the first cycle. The inhibition of fecundity, calculated according to Ghoneim et al. [30], in treated females was 22% in the first cycle and increased to 67% in the second cycle and to 75% in the third cycle (Table 4). Stereomicroscope observations of ovaries of treated females, which laid no more eggs after the first cycle, revealed a disruption in the synchrony of development of primary and secondary follicles, especially with a disordered overlapping of follicles at advanced developmental stages (Figure 17a,b). Concerning hatching, in controls, the percentage of eggs hatched in comparison to those laid in each egg deposition cycle was 96% for the first cycle, 98% for the second and 97% for the third (Table 4). On the contrary, in treated females, the percentage of hatching in the first egg deposition cycle was 73% and two females out of 10 laid a very low number of eggs (respectively 9 and 7), among which only one hatched (Table 4 and Table 5). In the second egg deposition cycle, a sharp decrease (49%) in the number of eggs hatched was observed: only one female laid a high number of eggs (124), of which 107 hatched (86%). In the third egg deposition cycle, only three females laid some eggs, whose hatching dropped to 24% (Table 4).
In treated females, the sterility index, that is the relationship between fecundity and hatching, was 41% in the first cycle, 83% in the second and 94% in the third one. These data indicated that with the advancement of egg deposition cycles the treated females were increasingly unable to generate a progeny. When unhatched eggs were analysed under the stereomicroscope, an advanced embryo was visible inside the transparent chorion, with a metameric body and the cephalic end (Figure 17c,d).

3.7. Corpora Allata

In adult females of M. domestica the corpora allata (CA) were fused in one structure, which is part of the Weismann’s ring, dorsal to the aorta and connected by allatocardiac nerves to the corpora cardiaca, ventral to the aorta (Figure 18).
The average cell number and the average volume of corpora allata in each time interval (T0, T0t, T1, T2 and T3) are reported in Table 5.

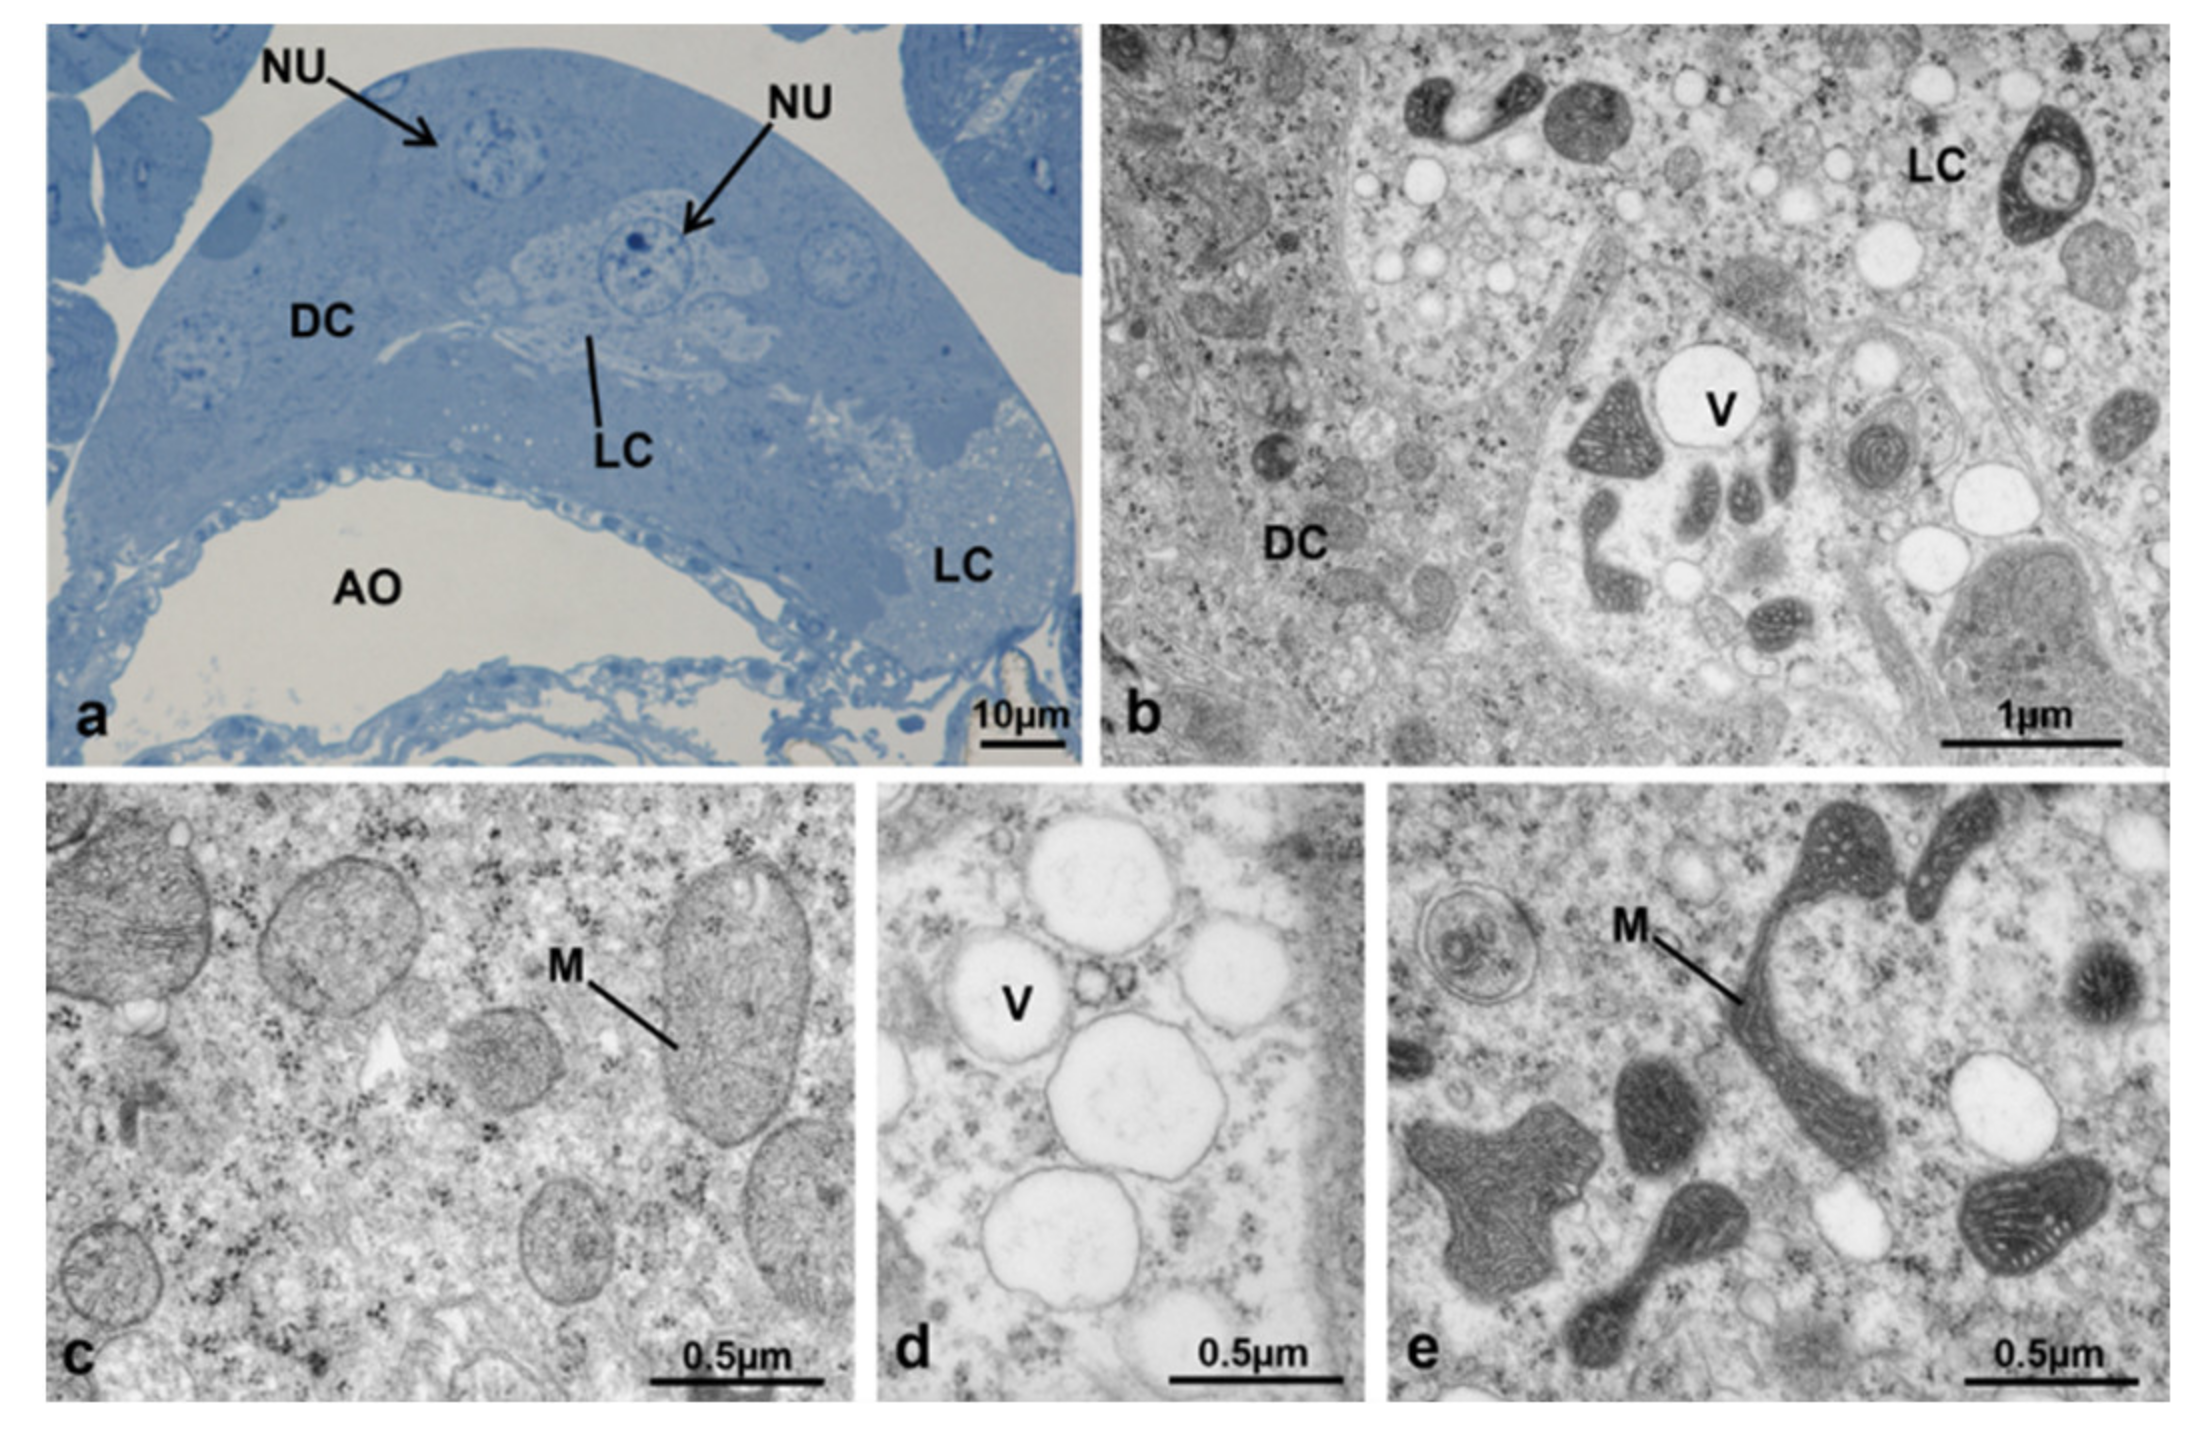
3.7.1. T0 (Emerging from Puparium)

At T0, when the adult female emerged from the puparium, the structure was flat (Figure 19a) and the ultrastructure of the gland revealed highly electron-dense round areas, probably pycnotic nuclei, along its borders (Figure 19a,b). The gland cells were all very similar in shape and size (Figure 19c–e). The membranes of contiguous cells were very close to each other and intensely interdigitating, the intercellular spaces were rare and, when present, moniliform in shape (Figure 19d). The nuclei were round, with heterochromatin condensed in small lumps and a round central nucleolus (Figure 19c). The cytoplasm of these cells was characterized by abundant free ribosomes and mitochondria with elongated or round shapes (Figure 19e).

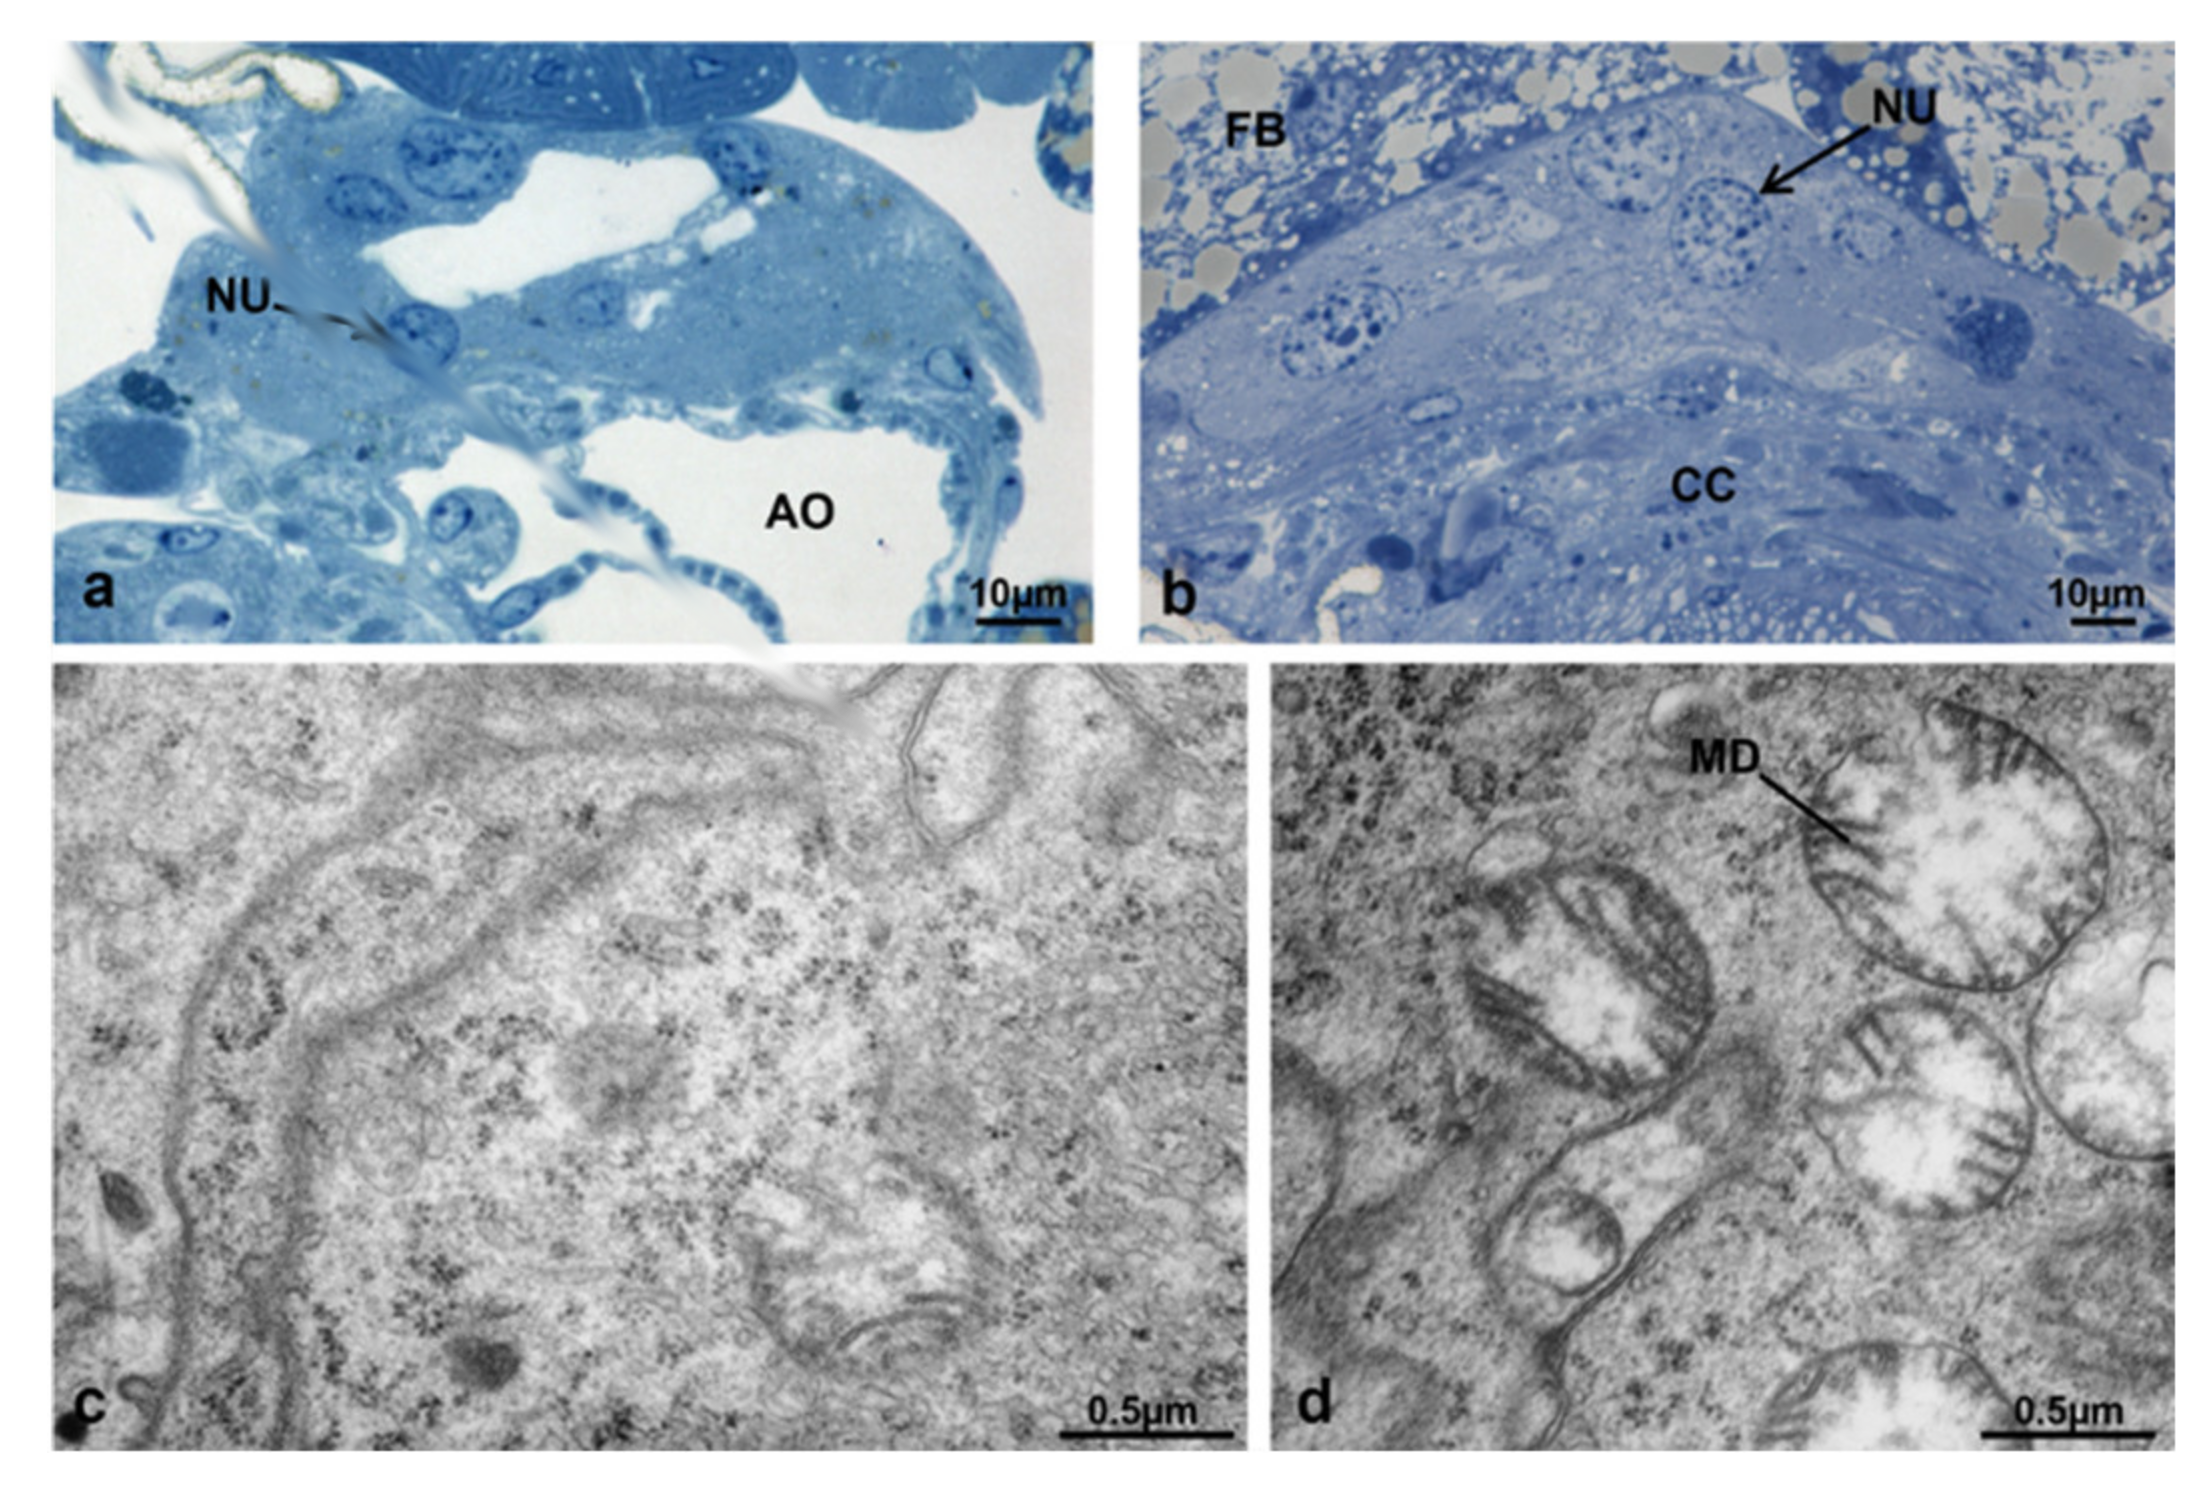
3.7.2. T0t (15 h from Emerging, Topical Treatment)

The structure of CA at T0t appeared flattened dorsoventrally (Figure 20a). All gland cells were morphologically similar (Figure 20b–e), with plasma membranes of contiguous cells very close with thick interdigitations; in some areas, there were wide spaces occupied by a flocculent material (Figure 20b,d). The nuclei were very similar to those of T0 (Figure 20c) and in the cytoplasm, the rough endoplasmic reticulum was more abundant and organized in small flat cisternae. Mitochondria appeared uniformly distributed, with a round or elongated shape and an electron-dense matrix (Figure 20e).

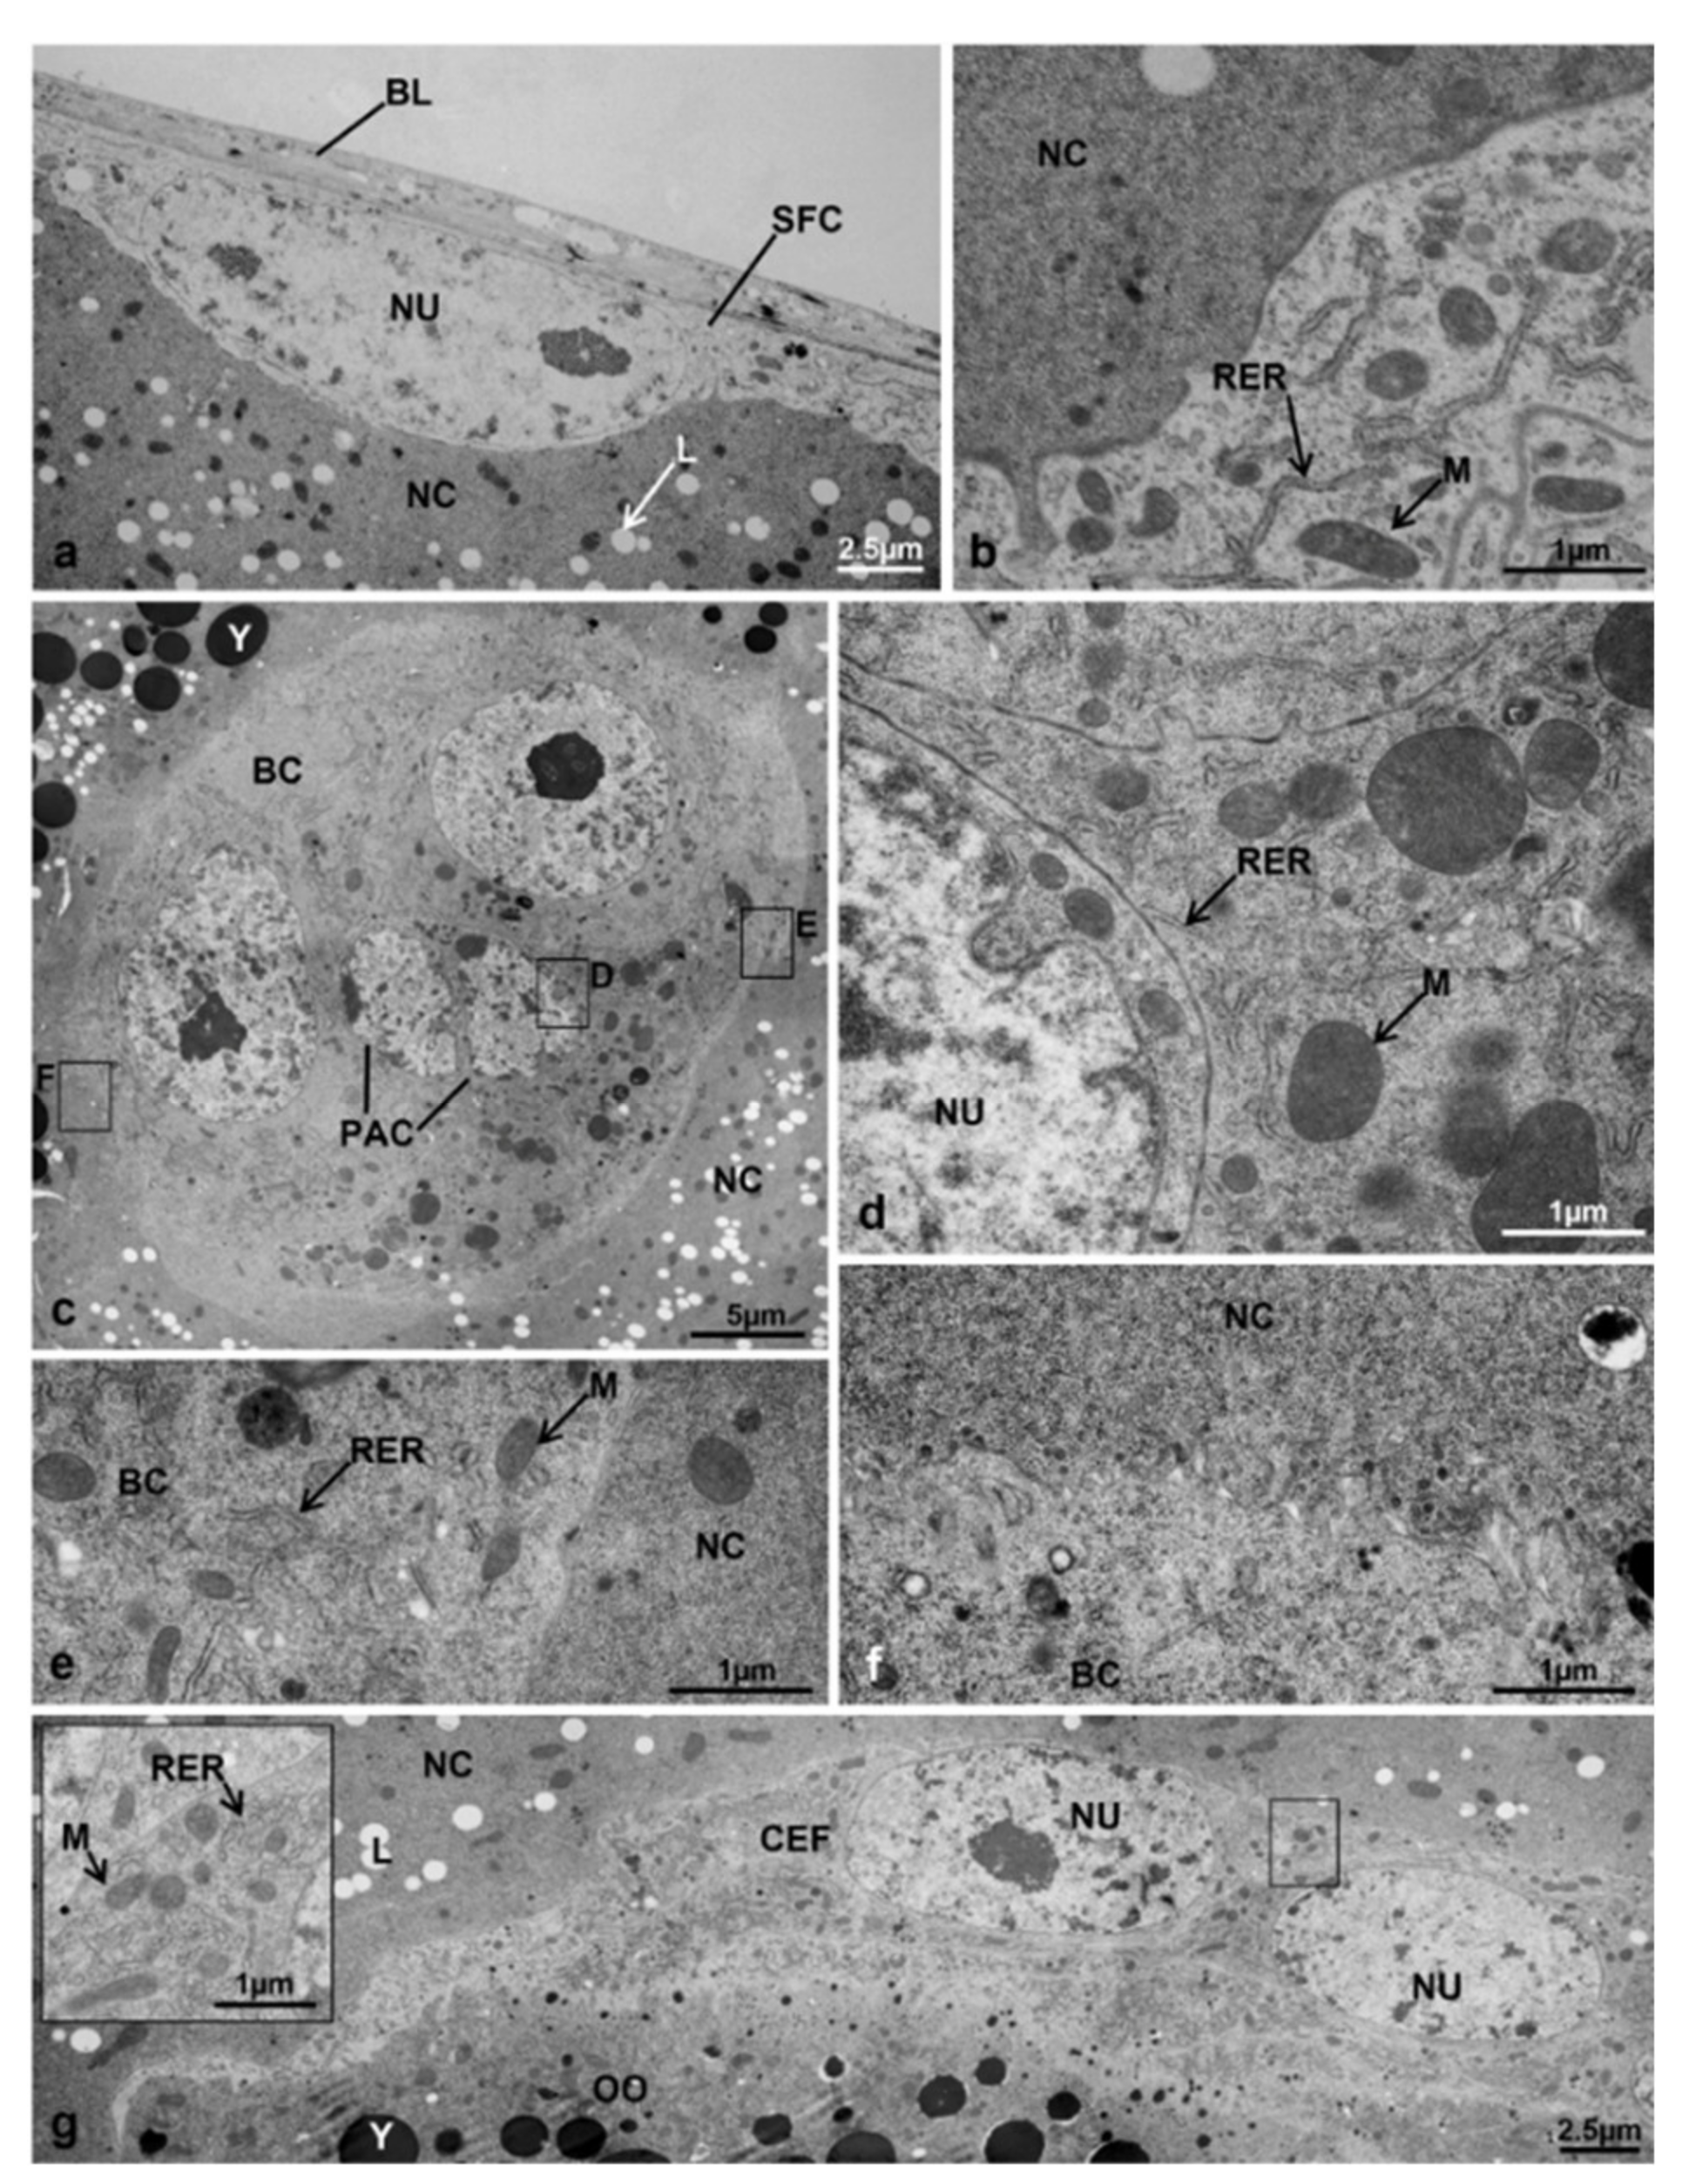
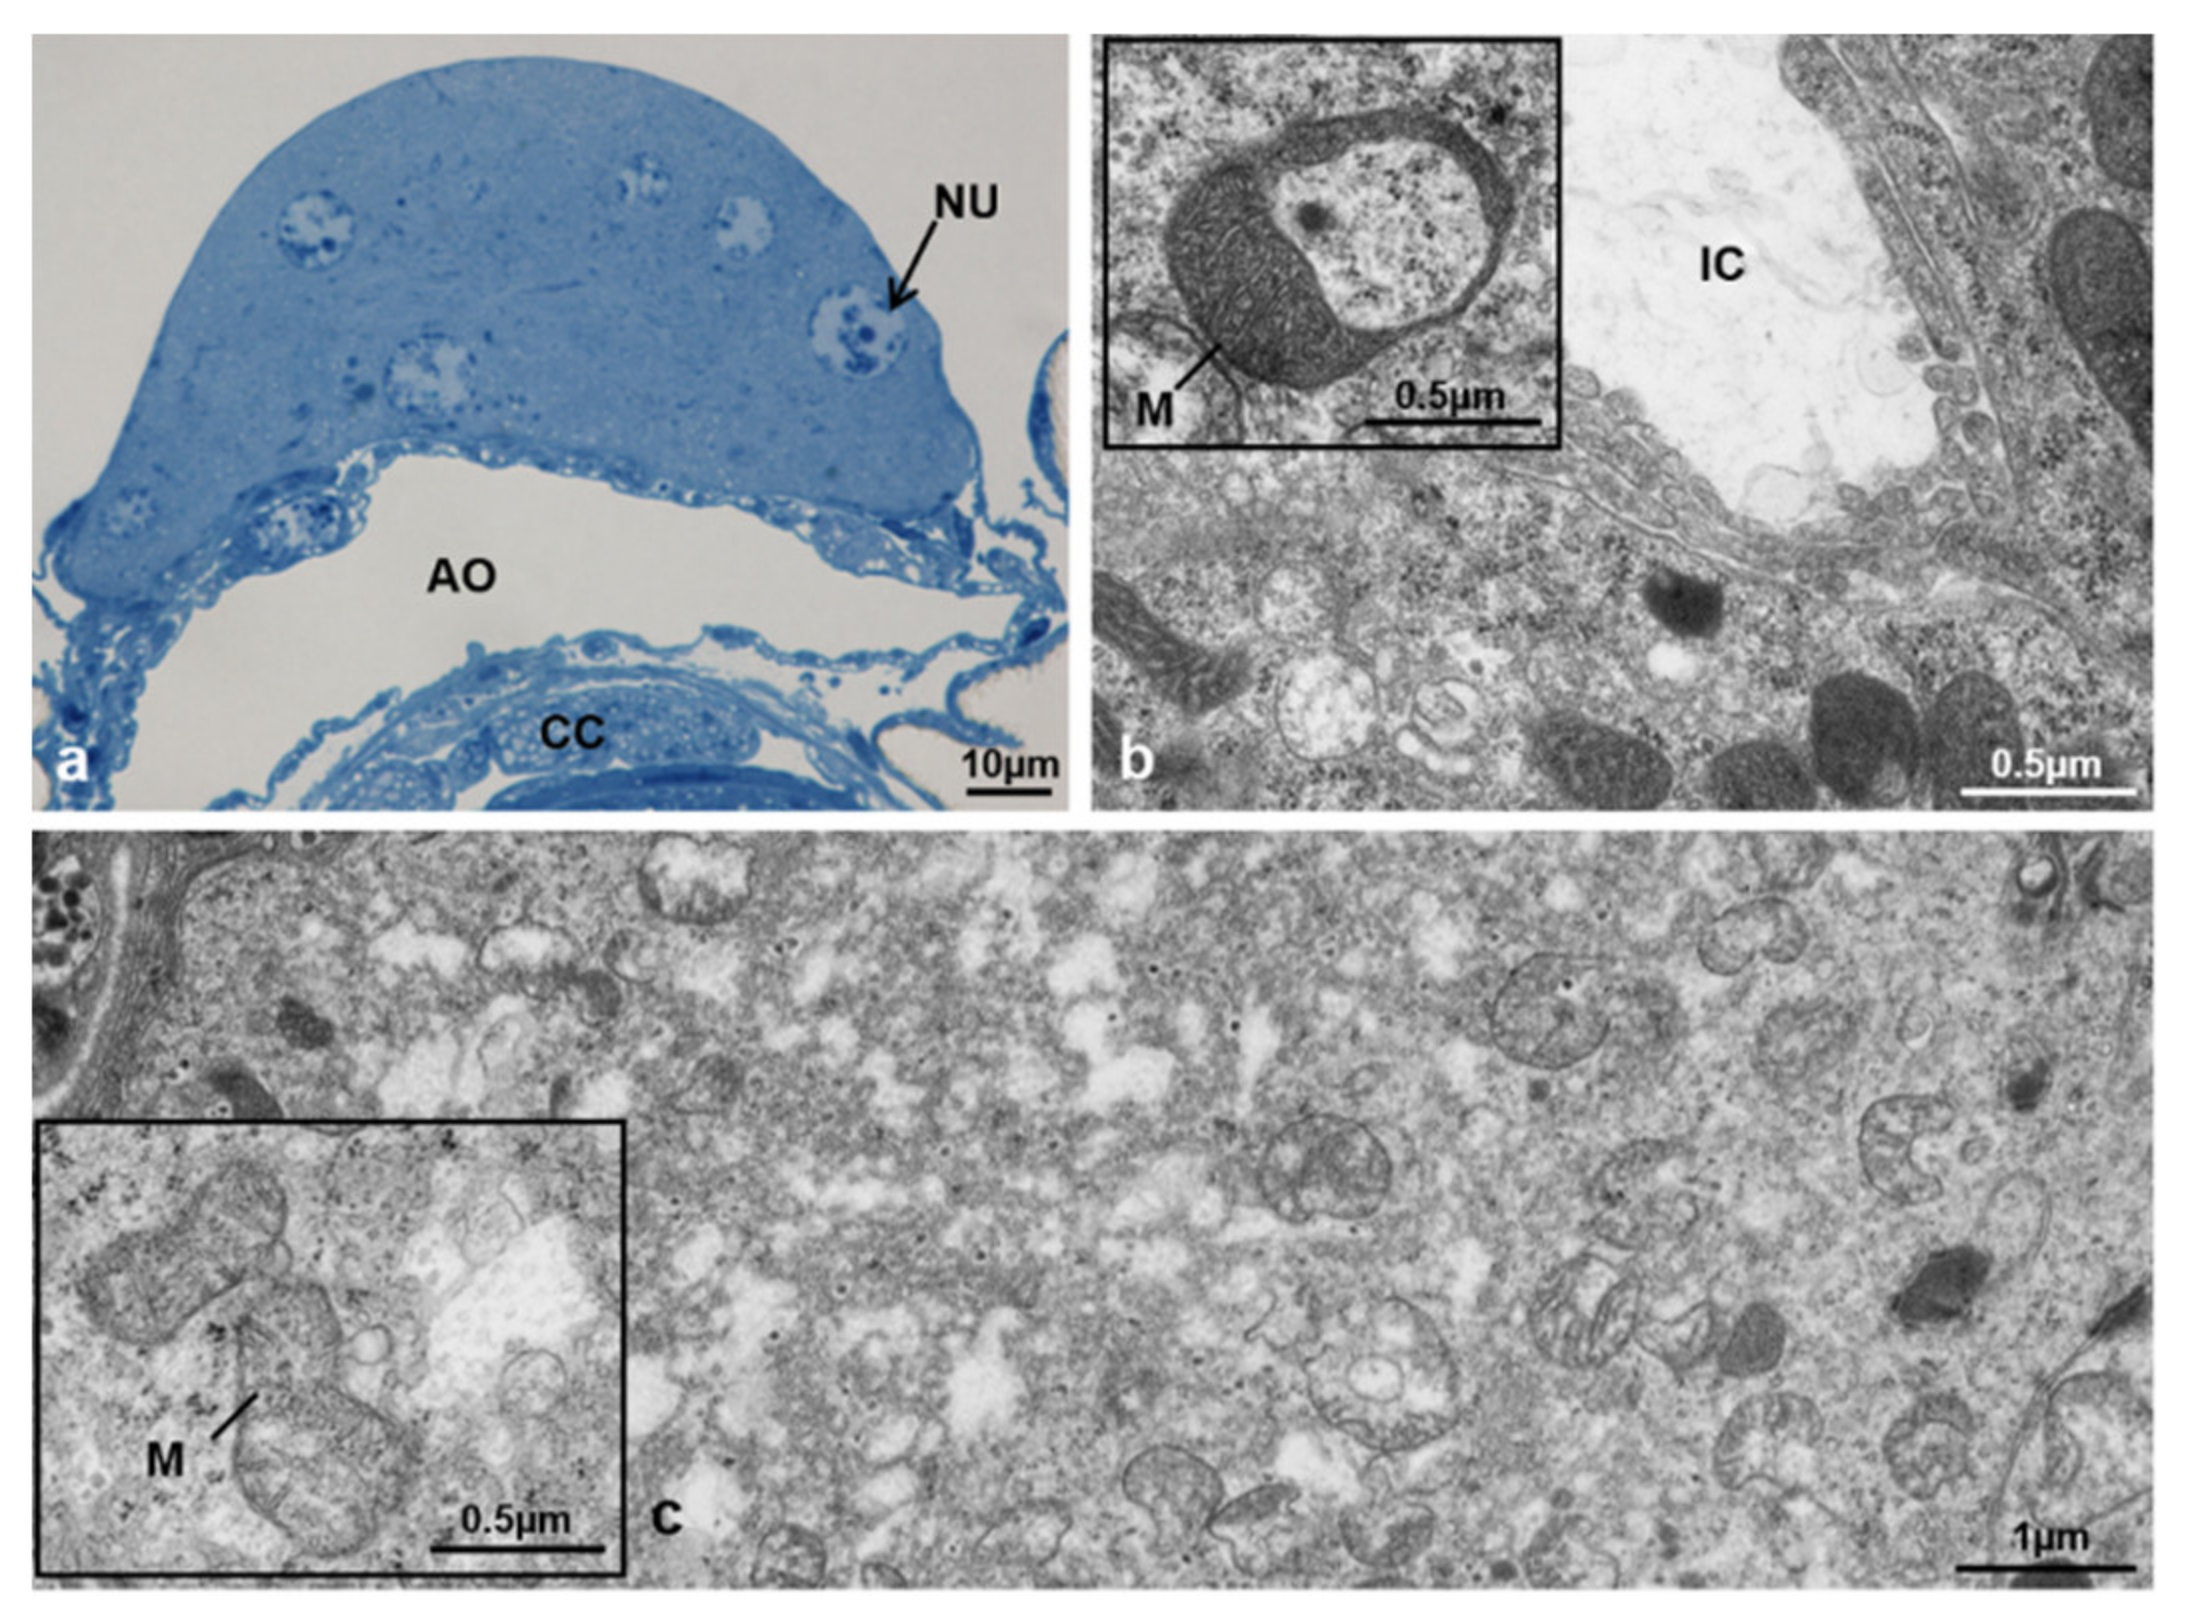
3.7.3. T1 Controls (45 h from Emerging, 30 h after Treatment)

In transverse sections, the CA structure at T1 appeared twice as high in the dorsal-ventral direction in comparison to T0t and two types of cells could be identified by optical microscopy, the dark cells and the light cells (Figure 21a).
The dark cells apparently occupied most of the gland, had round central nuclei (Figure 21b) and a rather compact cytoplasm (Figure 21c). The light cells were located in the central region of the gland, had spherical nuclei and clearly visible nucleoli (Figure 21a), with a less compact cytoplasm and conspicuous vesicles (Figure 21d,e). At the ultrastructural level, the dark and light cells appeared rather similar, but the light cells had a more rarefied cytoplasm, light vesicles and mitochondria with a more electron-dense matrix (Figure 21a–e).

3.7.4. T1 Treated (45 h from Emerging, 30 h after Treatment)

In transverse sections, the structure of CA in treated females at T1 was dorsoventrally flattened and by optical microscopy appeared similar to that observed at T0t (Figure 22a). At this time, the main difference between treated and control females was the inability to distinguish dark and light cells by optical or electron microscopy (Figure 22a–d). The cells forming the CA structure in treated females had strongly convoluted and interdigitating plasma membranes, apparently without intercellular spaces (Figure 22d). The nuclei were round and euchromatic, with heterochromatin condensed in lumps (Figure 22b) and the cytoplasm appeared compact, with swollen mitochondria with clear signs of degeneration, such as incomplete and fragmented cristae (Figure 22c).

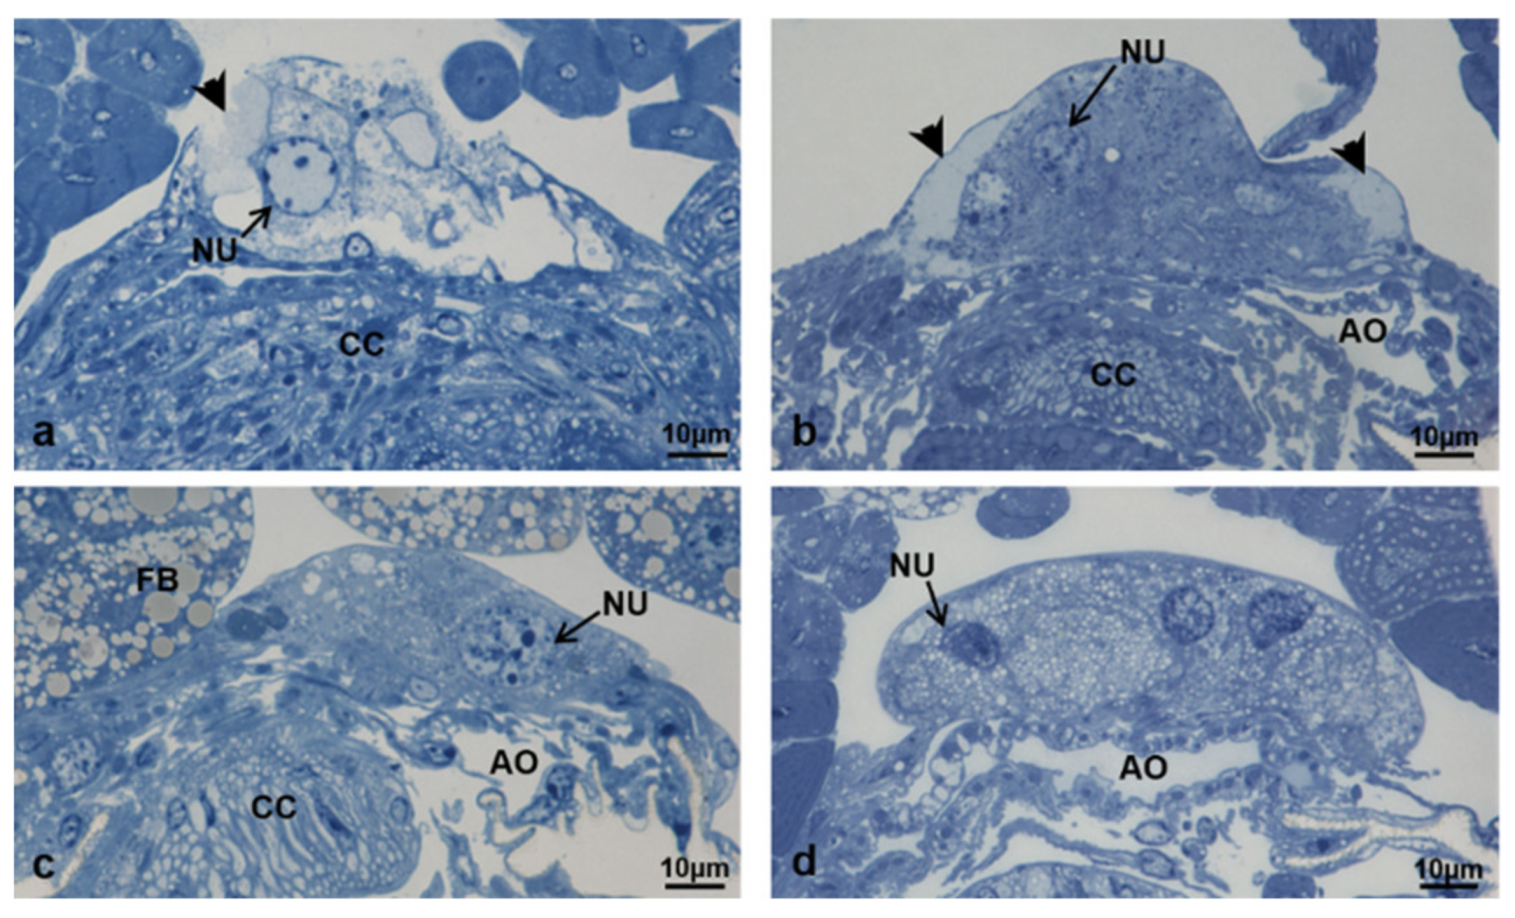
3.7.5. T2 Controls (70 h from Emerging, 55 h after Treatment)

In control females at T2, the CA showed a crescent moon shape in transverse sections (Figure 23a). As in T1, it was possible to identify dark and light cells, at this time by both optical and electron microscopy (Figure 23a,b). The boundaries between these two cell types were intensely interdigitating (Figure 23b). The dark cells which composed most of the gland had round nuclei with heterochromatic condensed in small lumps (Figure 23a). Their cytoplasm was compact, rich in smooth endoplasmic reticulum and free ribosomes, with barrel-shaped mitochondria (Figure 23b,c). The plasma membranes were very close and no intercellular spaces were visible (Figure 23a,c). The light cells were located in the cortical and central region of the gland and were characterized by a round nucleus with heterochromatin distributed in lumps (Figure 23a). The cytoplasm was rarefied, and the morphology of the endoplasmic reticulum (smooth or rough) was clearly identifiable (Figure 23b). A high number of round vesicles of variable size and free ribosomes were visible (Figure 23b,d). Mitochondria had variable size, an extremely electron-dense matrix, and interdigitating tubular cristae containing oval and round inner spaces (Figure 23b,e).

3.7.6. T2 Treated (70 h from Emerging, 55 h after Treatment)

In treated females at T2, the gland often appeared crossed by wide central spaces (Figure 24a) or more flattened in comparison to controls (Figure 24b). As in treated females at T1, no dark or light cells were clearly identifiable. The cells composing the gland at this time had intensely interdigitating membranes. Their cytoplasm was similar to that of the same cells of treated females at T1, but sometimes it appeared rarefied. Mitochondria were swollen and markedly altered, as in T1 (Figure 24c,d).

3.7.7. T3 Controls (90 h from Emerging, 75 h after Treatment)

In transverse sections, the structure of CA showed a crescent moon shape as in T2 but it was no longer possible to distinguish light from dark cells by optical or electron microscopy (Figure 25a). The gland cells at T3 had convoluted and intensely interdigitating cytoplasmic membranes (Figure 25b,c). The nuclei were round, with heterochromatin condensed in lumps near the nuclear envelope and a clearly visible nucleolus (Figure 25a).
The cytoplasm was characterized by abundant smooth endoplasmic reticulum with dense and rarefied areas in the cortical region of the gland and numerous free ribosomes. Mitochondria had an electron-dense matrix (Figure 25b, inlay) and, in cells of the cortical ventral region where the cytoplasm was rarefied, some of them appeared swollen with fragmented cristae (Figure 25c, inlay).

3.7.8. T3 Treated (90 h from Emerging, 75 h after Treatment)

At this time interval, the CA of treated females appeared strongly altered at optical microscopy, with wide lacunae and cells with vesicles of various sizes. (Figure 26a–d). With TEM, it was possible to observe markedly altered nuclei, heterochromatic and with irregular, digitiform or roundish envelopes (Figure 27a,b). The cytoplasm appeared heterogeneous, with regions uniformly rich in round vesicles of variable size (Figure 27c,d), very light regions containing a flocculent material (Figure 27e) and others including mitochondria with clear signs of degeneration (Figure 27f). Due to the great abundance of vesicles and wide areas of light cytoplasm, it was difficult to identify the cell boundaries at this stage.

3.8. Cell Number in Corpora Allata

The results of cell counting in CA of control females and females treated with diofenolan are shown in Table 5. The ANOVA showed significant differences on the average number of cells between control and treated females (F [4, 20] = 8.49, p = 0.0004), especially between T0 and T0t (p = 0.0004), T0t and treated at T1 (p = 0.026), controls and treated at T1 (p = 0.011), T2 (p = 0.003) and T3 (p = 0.02). In control females, no significant differences were detected between the average number of cells composing the CA at T1 and T2 (p = 0.78), and at T2 and T3 (p = 1.00). In treated females, no significant differences were detected between the average number of cells composing the CA at T1 and T2 (p = 0.79), and at T2 and T3 (p = 0.43). The statistical analysis revealed a significant increase in the number of cells of CA between T0 and T0t. In controls, the number of cells was constant at T1, T2 and T3, while in treated ones the number of cells significantly decreased between T0t and T1, but remained constant until T3.

3.9. Volume of Corpora Allata

Data concerning the average volume of CA structure in control females and females treated with diofenolan are shown in Table 5. The ANOVA showed significant differences on the average volume of CA between control and treated females (F [4, 20] = 118.79, p < 0.001), especially between T0 and T0t (p < 0.001), T0t and control at T1 (p < 0.001), control at T1 and control at T2 (p < 0.001), control at T2 and control at T3 (p < 0.001). Significant differences were also found between controls and treated at T1 (p < 0.001), T2 (p < 0.001) and T3 (p < 0.001), and between treated at T1 and treated at T2 (p = 0.021).
Generally, it was possible to detect a significant increase (p < 0.001) in the volume of CA between T0 and T0t. In controls, the volume continued to increase, reached a peak at T2, and then significantly (p < 0.001) decreased at T3. In treated females, no significant volume increase (p = 0.84) was detected between T0t and T1. In treated females at T2, the volume of CA, although significantly higher in comparison to T1 (p = 0.021) and T3 (p = 0.005), did not show any peak comparable to that observed in controls at the same time interval.

4. Discussion

The effects of exposure to diofenolan, a JH-analogue, were investigated on reproductive ability, ovarian and ovariole morphology and corpora allata of adult females of M. domestica by optical and transmission electron microscopy. To date, the studies on the effects of diofenolan on M. domestica are very limited [31]. The study by Amer et al. (2006), cited elsewhere [32,33], was not available online nor through the library services. Among Diptera, this insecticide was previously tested only on Chrysomia megacephala (Fabricius) (Calliphoridae) [34], among Lepidoptera on Papilio demoleus Linnaeus (Papilionidae) [27], Pectinophora gossipiella (Saunders) (Gelechiidae) [35,36] and Spodoptera littoralis (Boisduval) (Noctuidae) [32,33] and among Coleoptera on Rhynchophorus ferrugineus Olivier (Dryophthoridae) [37,38].
Concerning M. domestica, diofenolan was successful in interfering with fecundity at the doses of 25, 50 and 75 µg/µL, with no significant differences. The highest dose (75 µg/µL) was therefore chosen for experiments on ovarian development. The effects of diofenolan treatment on ovarian and ovariole morphology were tested at time intervals T0, T0t, T1, T2 and T3. General alterations of ovarioles were detected at all time intervals except T0 and T0t. Other alterations could be detected in follicles, such as degeneration events, or atresia [39] in the primary follicle, and hypertrophy and atresia in the secondary follicle. The germarium did not appear altered, probably because at T0t (15 h from emerging) most physiological changes had been completed and the insecticide could not affect the development of the tertiary follicle. Within the same ovary, ovarioles with marked degenerations caused abnormal growth of other ovarioles and a loss of synchrony within the ovary, which became heterogeneous.
The alterations of ovarioles could be summarized in nine different morphotypes: 1 and 2 (variant A and B) in T1; 3, 4, and 5 in T2; 6, 7, 8, 9 in T3.
Concerning the mapping of ovarioles composing the concentric circles on the ovary, no specific pattern was detected in the distribution of morphotypes within the same ovary or in the contralateral ovary. The average number of ovarioles was constant at the different time intervals, suggesting that no degenerations involving the entire ovariole occurred after treatment with diofenolan.
From the comparative analysis of all morphotypes, three “paths” of anomalous transformation were detected. In the first path (“precocious degeneration”), the total degeneration of the primary follicle occurred between T0t and T1, followed by hypertrophy of the secondary follicle. In the second path (“intermediate degeneration”), complete degeneration of the secondary follicle occurred between T1 and T2, while the tertiary follicle continued to develop. In the third path (“degeneration/hypertrophy”), the secondary follicle could develop between T2 and T3 along two subpaths, the first one towards hypertrophy, producing an abnormally large follicle, and the second one towards degeneration, leaving space for the development of the tertiary follicle. Among the three transformation paths, the most frequent was path 2, typical of morphotype 7 in T3.
The slight alterations observed in the primary follicle did not appear to affect the development of the follicle and the first egg deposition cycle, in agreement with data on the number of eggs laid and the hatching percentage. However, these alterations affected the second and third egg deposition cycles.
Overall, these data support the hypothesis that in M. domestica the main activity of diofenolan, as JH-analogue, persists for a long time in the insect system, as previously reported in the lemon butterfly, P. demoleus, where the insecticide exerted an inhibitory effect on the late stages of the life cycle [27]. In M. domestica, it is likely that starting from an initial point (or points) of damage (still unidentified), the alterations could spread by a cascade effect to different body parts for a long time. The paths of morphotype transformations show that three separate atresia events occurred at different times: the first one between T0t and T1, the second one initiating at T1 and appearing from T2 onwards, and the third one occurring between T2 and T3.
Concerning eggs laid and hatching in the egg deposition cycles, the results show that treated females were able to lay a number of eggs more or less normally only in the first egg deposition cycle. The three paths of ovariole transformation induced by diofenolan support the data obtained in the experiments concerning fecundity. The main damages observed at the morphological levels in the secondary follicle are in good agreement with the sharp decline in egg-laying detected in the second egg deposition cycle. Concerning the tertiary follicle, probably its development was also affected by diofenolan, since in the third egg deposition cycle a further decrease in the number of eggs laid was detected. Ovary alterations, probably due to the different response of each ovariole to diofenolan treatment, mostly consisted in a loss of synchrony among ovarioles, required for the correct sequence of egg-laying. Probably the secondary follicle, hypertrophic and apparently functional, could continue its development, but the loss of synchronization with the other ovarioles could cause not only anomalies in the tertiary follicles, but also a mechanical impairment of egg-laying: eggs were not able to exit regularly the ovary and the oviduct, and became “clogged” in these anatomical structures. Indeed, females laying very few eggs or none in the second and third egg deposition cycle were found with the abdomen abnormally swollen and an extended ovipositor. Apparently, the long-term effects of diofenolan included mechanical ones: this very interesting activity by the insecticide requires further investigations.
Concerning egg hatching, again, there was a remarkable difference between the percentage of eggs hatched in controls (about 100%) and those hatched in diofenolan treated females along egg deposition cycles (about 24%). The data on eggs laid and hatching agree with those obtained on the percentage of fecundity inhibition, which was 22% in the first egg deposition, 67% in the second and 75% in the third. These data also agree with those obtained on the percentage of sterility (94% in the third egg deposition cycle) and show the high efficiency of diofenolan in affecting the reproductive ability of M. domestica. The interfering effects of diofenolan support the hypothesis that this insecticide acts at different levels (including embryo development) and for a long time.
Very few data are available about the morphology of corpora allata (CA) in M. domestica adults. In other species, CA are known to function in a cyclic way, alternating active and non-active phases [40]. This study reports detailed data on cell number, volume, morphology and ultrastructure of CA in M. domestica.
In control females, the volume of CA increased from T0 to T0t due to cell proliferation (hyperplasia), but the number of cells remained the same from T0 to T3. The subsequent increase in gland volume was therefore due to hypertrophy, namely an increase in cell volume but not of cell number. A previous study reported a relationship between the enlargement of CA and follicle development [41]. Our data show that CA became hypertrophic with a peak of activity in T2, and a decrease in T3, in agreement with cell ultrastructure showing at T3 rarefied cytoplasms and mitochondria in the process of degeneration, associated to initial inactivation of the gland, as in other species [42]. In this study on CA, the appearance of light and dark cells, never previously reported in M. domestica, was observed in T1 and T2 by both optical and electron microscopy. The morphology of these cells could be connected to the intense activity of the gland in these time intervals. In treated females, the cell number in CA decreased from T0t to T1, immediately after the treatment. The number of cells remained low from T1 to T3, thus, probably the gland was no longer able to recover its activity. Indeed, analysing the volume variations in CA of treated females, a slight peak in T2 was observed, probably representing an attempt by the gland to recover activity, based on signals preceding the treatment or not JH-dependent. However, this attempt was not successful and the signs of alterations in T3 were so extensive that it was reasonable to infer a direct transition of the gland from inactivity to degeneration. Therefore, the effects of diofenolan may not be limited to ovaries and ovarioles but may extend to CA, by interfering with their physiological cycles of activation and inactivation. The insecticide could, therefore, “strike” the reproductive activity in the adult female by disrupting the crucial phase of follicle maturation, thus, of egg-laying and hatching. We may also advance the hypothesis that the treatment with diofenolan corresponds to an excess of JH that could inhibit the activation of CA by a feedback mechanism, possibly inducing CA degeneration.

5. Conclusions

In M. domestica, diofenolan exerts a relevant sterilizing action by interfering at several levels with the reproductive activity in females, caused by anomalies of the reproductive apparatus (ovaries and ovarioles). These effects are also detectable on CA because the JH-analogue interferes with physiological cycles of activation and inactivation of this gland. Further investigations should involve the effects of diofenolan on male reproductive activity, followed by suitable field tests.
Based on the results of this study, diofenolan could be employed in integrated pest management techniques aimed to lower the use of other insecticides within sustainable pest defence strategies.

Author Contributions

Conceptualization, M.P.; methodology, M.P. and M.L.; validation, M.P., M.L. and T.B.; formal analysis, M.P., C.S. and M.C.; investigation, M.P. and M.G.M.; data curation, M.P., C.S., M.G.M., M.C., S.K. and T.B.; writing—original draft preparation, M.P. and M.C.; writing—review and editing, M.P., C.S., M.G.M., M.C., S.K., M.L. and T.B.; supervision, M.P., S.K. and T.B. All authors have read and agreed to the published version of the manuscript.

Funding

This research received no funding but the publication costs were covered by grant (ex60%-DiBEST Unical-2020) from the Department of Biology, Ecology and Earth Sciences, University of Calabria, Arcavacata di Rende (Cosenza, Italy) assigned to Professor Teresa Bonacci.

Institutional Review Board Statement

Not applicable.

Informed Consent Statement

Not applicable.

Data Availability Statement

The data supporting this investigation are available from the corresponding author [M.P.] upon reasonable request.

Acknowledgments

The authors owe thanks to Professor Gilberto Grandi for providing relevant suggestions and Massimo Lanfredi, Federica Biolcati and Bruno Semeraro for kind technical assistance.

Conflicts of Interest

The authors declare no conflict of interest.

References

  1. Robinson, W. Urban Insects and Arachnids: A Handbook of Urban Entomology; Cambridge University Press: Cambridge, UK, 2005. [Google Scholar]
  2. Giangaspero, A. Le Mosche di Interesse Veterinario. I Muscidae. Guida alla Conoscenza ed al Riconoscimento; Edizioni Agricole Calderini s.r.l.: Bologna, Italy, 1997. [Google Scholar]
  3. Tremblay, E. Entomologia Applicata. Vol. III: Ditteri Brachiceri (Caliptrati), Sifonatteri e Strepsitteri; Liguori Editore: Napoli, Italy, 1997. [Google Scholar]
  4. Dogra, V.; Aggarwal, A.K. Association of poultry farms with housefly and morbidity: A comparative study from Raipur Rani, Haryana. Indian J. Community Med. 2010, 35, 473–477. [Google Scholar] [CrossRef]
  5. Birkemoe, T.; Sverdrup-Thygeson, A. Stable fly (Stomoxys calcitrans) and house fly (Musca domestica) densities: A comparison of three monitoring methods on pig farms. J. Pest Sci. 2011, 84, 273–280. [Google Scholar] [CrossRef]
  6. Axtell, R.C. Fly management in poultry production: Cultural, biological, and chemical. Poultry Sci. 1986, 65, 657–667. [Google Scholar] [CrossRef]
  7. Gerry, A.C.; Higginbotham, G.E.; Periera, L.N.; Lam, A.; Shelton, C.R. Evaluation of surveillance methods for monitoring house fly abundance and activity on large commercial dairy operations. J. Econom. Entomol. 2011, 104, 1093–1102. [Google Scholar] [CrossRef]
  8. Moon, R.D. Muscid flies (Muscidae). In Medical and Veterinary Entomology, 2nd ed.; Mullen, G.R., Durden, L.A., Eds.; Academic Press: San Diego, CA, USA, 2009; pp. 275–295. [Google Scholar]
  9. Singh, A.; Singh, Z. Incidence of myiasis among humans—A review. Parasitol. Res. 2015, 114, 3183–3199. [Google Scholar] [CrossRef]
  10. Crosskey, R.W. Introduction to the Diptera. In Medical Insects and Arachnids; Lane, R.P., Crosskey, R.W., Eds.; British Museum (Natural History), Chapman and Hall: London, UK, 1993; pp. 51–77. [Google Scholar]
  11. Graczyk, T.K.; Knight, R.; Gilman, R.H.; Cranfield, M.R. The role of non-biting flies in the epidemiology of human infectious diseases. Microbes Infect. 2001, 3, 231–235. [Google Scholar] [CrossRef]
  12. Kubrakiewicz, J.; Biliński, S.M.; Mazurkiewicz, M. Diptera—Ovary structure and oogenesis in midges and flies. Folia Histochem. Cytobiol. 1998, 36, 197–203. [Google Scholar]
  13. Kleine-Schonnefeld, H.; Engels, W. Symmetrical pattern of follicle arrangement in the ovary of Musca domestica (Insecta, Diptera). Zoomorphology 1981, 98, 185–190. [Google Scholar] [CrossRef]
  14. Sakurai, H. Studies on the ovarian development in the housefly, Musca domestica vicina Macquart. I. Stages of oogenesis and the function of the follicle. Jpn J. Med. Sci. Biol. 1973, 26, 239–248. [Google Scholar] [CrossRef] [Green Version]
  15. Ogienko, A.A.; Fedorova, S.A.; Baricheva, E.M. Basic aspects of ovarian development in Drosophila melanogaster. Russ. J. Genet. 2007, 43, 1120–1134. [Google Scholar] [CrossRef]
  16. Trepte, H.-H. Rate of follicle growth, change in follicle volume and stages of macromolecular synthesis during ovarian development in Musca domestica. J. Insect Physiol. 1979, 25, 199–203. [Google Scholar] [CrossRef]
  17. Chaiwong, T.; Sukontason, K.; Chaisri, U.; Kuntalue, B.; Vogtsberger, R.C.; Sukontason, K.L. Ovarian ultrastructure and development of the blow fly, Chrysomya megacephala (Diptera: Calliphoridae). Int. J. Parasitol. Res. 2012, 4, 65–70. [Google Scholar] [CrossRef] [Green Version]
  18. Cassier, P. The corpora allata of insects. Int. Rev. Cytol. 1979, 57, 1–73. [Google Scholar] [CrossRef]
  19. King, R.C. Ovarian Development in Drosophila melanogaster; Academic Press: New York, NY, USA, 1970. [Google Scholar]
  20. Wyatt, G.R. Juvenile hormone in insect reproduction—A paradox? Eur. J. Entomol. 1997, 94, 323–333. [Google Scholar]
  21. Nijhout, H.F. Insect Hormones; Princeton University Press: Princeton, NJ, USA, 1994. [Google Scholar]
  22. Gäde, G.; Hoffmann, K.H.; Spring, J.H. Hormonal regulation in insects: Facts, gaps, and future directions. Physiol. Rev. 1997, 77, 963–1032. [Google Scholar] [CrossRef]
  23. Adams, T.S.; Li, Q.J. Ecdysteroidostatin from the house fly, Musca domestica. Arch. Insect Biochem. Physiol. 1998, 38, 166–176. [Google Scholar] [CrossRef]
  24. Adams, T.S.; Filipi, P.A. Interaction between juvenile hormone, 20-hydroxyecdysone, the corpus cardiacum-allatum complex, and the ovaries in regulating vitellogenin levels in the house fly, Musca domestica. J. Insect Physiol. 1988, 34, 11–19. [Google Scholar] [CrossRef]
  25. Williams, C.M. The juvenile hormone of insects. Nature 1956, 178, 212–213. [Google Scholar] [CrossRef]
  26. Tunaz, H.; Uygun, N. Insect growth regulators for insect pest control. Turk J. Agric. For. 2004, 28, 377–387. [Google Scholar]
  27. Singh, S.; Kumar, K. Diofenolan: A novel insect growth regulator in common citrus butterfly, Papilio demoleus. Phytoparasitica 2011, 39, 205–213. [Google Scholar] [CrossRef]
  28. Di Domenico, D.; Ruggeri, L.; Pampiglione, G. Primo caso italiano di resistenza al larvicida ciromazina da parte di Musca domestica. Avicoltura 2005, 4, 34–37. [Google Scholar]
  29. Pezzi, M.; Lanfredi, M.; Chicca, M.; Tedeschi, P.; Brandolini, V.; Leis, M. Preliminary evaluation of insecticide resistance in a strain of Musca domestica (Diptera: Muscidae) from an intensive chicken farm of Northern Italy. J. Environ. Sci. Health. B 2011, 46, 480–485. [Google Scholar] [CrossRef] [PubMed]
  30. Ghoneim, K.S.; Amer, M.S.; Bream, A.S.; Al-Dali, A.G.; Hamadah, K.S. Effectiveness of Margosan-O and Jojoba on some reproductive aspects of the house fly, Musca domestica (Diptera: Muscidae). Int. J. Agri. Biol. 2007, 9, 338–341. [Google Scholar]
  31. Ghoneim, K.S.; Amer, M.S.; Bream, A.S.; Al-Dali, A.G.; Hamadah, K.S. Developmental and morphogenetic response of the house fly Musca domestica to the CSIs: Lufefuron and diofenolan. Al-Azhar Bull. Sci. 2004, 15, 25–42. [Google Scholar]
  32. Basiouny, A.; Ghoneim, K.; Tanani, M.; Hamadah, K.; Waheeb, H. Disturbed protein content in Egyptian cotton leafworm Spodoptera littoralis (Boisd.) (Lepidoptera: Noctuidae) by some novel chitin synthesis inhibitors. Int. J. Adv. Res. Biol. Sci. 2016, 3, 1–12. [Google Scholar]
  33. Tanani, M.; Ghoneim, K.; Hamadah, K.; Basiouny, A. Waheeb, H. Disruptive effects of some novel chitin synthesis inhibitors on transaminase activity in larval tissues of Spodoptera littoralis (Lepidoptera: Noctuidae). Int. J. Res. Stud. Zool. 2016, 2, 1–12. [Google Scholar]
  34. Singh, S.; Kumar, K. Effect of juvenoids pyriproxyfen and diofenolan on embryogenesis and postembryonic development of blow fly Chrysomya megacephala (Diptera: Calliphoridae) following egg treatment. Parasitol. Res. 2015, 114, 3213–3222. [Google Scholar] [CrossRef] [PubMed]
  35. Tanani, M.A.; Ghoneim, K.; Hassan, H.A.; Bakr, N.A. Perturbation of main body metabolites in the pink bollworm Pectinophora gossypiella (Saunders) (Lepidoptera: Gelechiidae) by the chitin synthesis inhibitors novaluron and diofenolan. Bio Bulletin 2017, 3, 8–21. [Google Scholar]
  36. Tanani, M.A.; Bakr, N.A. Effectiveness of the chitin synthesis inhibitor, diofenolan, on survival and development of the pink bollworm, Pectinophora gossypiella (Saunders) (Lepidoptera: Gelechiidae). J. Entomol. Zool. Stud. 2018, 6, 1209–1219. [Google Scholar]
  37. Ghoneim, K.S.; Bream, A.S.; Tanani, M.A.; Nassar, M.M. Effectiveness of IGRs (CGA-184699) and (CGA-259205) on the respiratory metabolism of the red palm weevil, Rhynchophorus ferrugineus (Coleoptera: Curculionidae). Med. Fac. Landbouww. Univ. Gent 2001, 66/2a, 413–424. [Google Scholar]
  38. Ghoneim, K.S.; Al-Dali, A.G.; Abdel-Ghaffar, A.A. Effectiveness of lufenuron (CGA-184699) and diofenolan (CGA-59205) on the general body metabolism of the red palm weevil, Rhynchophorus ferrugineus (Curculionidae: Coleoptera). Pak. J. Biol. Sci. 2003, 6, 1125–1129. [Google Scholar] [CrossRef] [Green Version]
  39. Trepte, H.-H.; Trepte-Feuerborn, C. Development and physiology of follicular atresia during ovarian growth in the house fly, Musca domestica. J. Insect Physiol. 1980, 26, 329–338. [Google Scholar] [CrossRef]
  40. Chiang, A.-S.; Burns, E.L.; Schal, C. Ovarian regulation of cyclic changes in size and activity of corpus allatum cells in Blattella germanica. J. Insect Physiol. 1991, 37, 907–917. [Google Scholar] [CrossRef]
  41. Sakurai, H. Endocrine control of oögenesis in the housefly, Musca domestica vicina. J. Insect Physiol. 1977, 23, 1295–1302. [Google Scholar] [CrossRef]
  42. Scharrer, B. Histophysiological studies on the corpus allatum of Leucophaea maderae. IV. Ultrastructure during normal activity cycle. Z. Zellforsch. Mikrosk. Anat. 1964, 62, 125–148. [Google Scholar] [CrossRef] [PubMed]
Figure 1. Effects of treatment with diofenolan on ovarioles of Musca domestica. Ovarioles of control females (a), and of females treated with 75 µg/µL diofenolan (bd), examined under the stereomicroscope. (a) Ovarioles with normal morphology; (b) ovariole with hypertrophic secondary follicle; (c) immature ovariole; (d) ovariole with a formless mass. Abbreviations: F1: primary follicle; F2: secondary follicle; FM, formless mass; IMO, immature ovariole.
Sustainability 13 10122 g001
Figure 2. External part of the ovary in M. domestica. (a) Peritoneal lamina and epithelial sheath at optical microscopy. (b) Detail of the peritoneal lamina observed by TEM. (c) Detail of the epithelial sheath observed by TEM. Abbreviations: BL, basal lamina; CF, follicle cells; ES, epithelial sheath; PL, peritoneal lamina; TC, tracheae or tracheoles.
Sustainability 13 10122 g002
Figure 3. Ovariole of M. domestica observed under the optical microscope. (a) Ovariole in toto at T0; (bg) sections of ovarioles at T0. (bf) Details of the germarium from the terminal filament to the interfollicular stalk; (g) primary follicle in toto; (h) ovariole in toto at T0t. (ik) Sections of ovarioles at T0t. (i) Secondary follicle. (j) Detail of the anterior region of the primary follicle. (k) Detail of the posterior region of the primary follicle. Abbreviations: COF: columnar follicular cells; CUF: cuboidal follicular cells; G: germarium; GC: germ cell cyst; IS: interfollicular stalk; NC: nurse cells; NCN: nurse cell nuclei; ON: oocyte nuclei; OO: oocyte; PC: prefollicular cells; R1, R2, R3: regions of the germarium; TF: terminal filament. Other abbreviations as in Figure 1 and Figure 2.
Sustainability 13 10122 g003
Figure 4. Ovariole of M. domestica observed under the optical microscope. (a) Ovariole in toto at T1 in controls. (bi) Sections of ovarioles at T1 in controls. (b) Tertiary follicle. (c) Secondary follicle. (di) Primary follicle. (d) Nucleus of the oocyte. (e) Nucleus of a nurse cell. (f) Interface among oocyte, nurse cells and centripetal cells. (g) Border cell cluster. (h) Interface between nurse cells and squamous follicular cells. (i) Interface between oocyte and columnar follicular cells. (j) Ovariole in toto at T1 in treated females, morphotype 1. (k) Section of the germarium in a morphotype 1 ovariole. (l) Secondary follicle of a morphotype 1 ovariole. (m) Residue of a primary follicle residue in a morphotype 1 ovariole. Abbreviations: BCC, border cell cluster; CEF, centripetal follicular cells; F3, tertiary follicle; PFR, primary follicle residue; SFC, squamous follicular cells. Other abbreviations as in Figure 1, Figure 2 and Figure 3.
Sustainability 13 10122 g004
Figure 5. Ovariole of M. domestica observed under the optical microscope. (a) Ovariole in toto of treated females at T1, morphotype 2. (b) Section of the secondary follicle of a morphotype 2 ovariole, variant A. (c) Section of the secondary follicle of a morphotype 2 ovariole, variant B. DR: dark regions. Other abbreviations as in Figure 1, Figure 3 and Figure 4.
Sustainability 13 10122 g005
Figure 6. Ovariole of M. domestica observed under the optical microscope. (a) Ovariole in toto at T2 in controls. (bf) Sections of ovarioles at T2 in controls. (b) Detail of the posterior region of the secondary follicle. (c) Detail of the anterior lateral region of the secondary follicle. (d) Detail of the anterior region of the primary follicle. (e) Detail of the primary follicle showing the chorion and the ooplasm. (f) Detail of the primary follicle showing the chorion and the vitelline membrane. (g) Ovariole in toto in treated females at T2, morphotype 3. (hk) Sections of ovarioles at T2, morphotype 3. (h) Germarium and tertiary follicle. (i) Germarium, tertiary and secondary follicle. (j) Detail of the posterior region of the secondary follicle. (k) Detail of the lateral region of the secondary follicle. Arrowhead: lipid droplets. Abbreviations: CH: chorion; CL: cells forming the corpus luteum; VM: vitelline membrane. Other abbreviations as in Figure 1, Figure 3 and Figure 4.
Sustainability 13 10122 g006
Figure 7. Ovariole of M. domestica observed under the optical microscope. (a) Ovariole in toto in treated females at T2, morphotype 4. (b) Section of an ovariole at T2, morphotype 4, showing the germarium and the tertiary follicle. (c) Section of an ovariole at T2, morphotype 4, showing the cell mass of the secondary follicle. (d) Ovariole in toto in treated females at T2, morphotype 5. (eh) Sections of ovarioles at T2, morphotype 5. (e) Secondary follicle and primary follicle residues. (f) Detail of the oocyte in the secondary follicle. (g) Detail of the lateral region of the secondary follicle. (h) Primary follicle residue. Abbreviation: DM: dark masses. Other abbreviations as in Figure 1, Figure 2, Figure 3 and Figure 4.
Sustainability 13 10122 g007
Figure 8. (ad) Ovariole of M. domestica observed under the optical microscope. (a) Ovariole in toto at T3 in controls. (b) Tertiary follicle of an ovariole at T3 in controls. (c) Detail of the posterior region of the secondary follicle. (d) Detail of the anterior lateral region of the secondary follicle. (ei) Secondary follicle of ovarioles at T3 in controls observed by TEM. (e) Posterior region of the secondary follicle. (f) Cytoplasm of a columnar follicular cell showing a concentric rough endoplasmic reticulum and some lipid droplets. (g) Nucleus of a columnar follicular cell. (h) Interface between the basal lamina and the columnar follicle cells. (i) Interface between the columnar follicle cells and the oocyte. Abbreviations: IC: intercellular spaces; L: lipid droplets; M: mitochondria; MI: microvilli; NU: nucleus; RER: rough endoplasmic reticulum; Y: yolk spheres. Other abbreviations as in Figure 1, Figure 2, Figure 3 and Figure 4.
Sustainability 13 10122 g008
Figure 9. (af) TEM images of the secondary follicle of ovarioles at T3 from controls. (a) Composite of two images of the anterior region. (b) Cytoplasm of the cuboidal follicular cell showing a concentric rough endoplasmic reticulum and some lipid droplets. (c) Nucleus of a cuboidal follicular cell. (d) Interface between the cuboidal follicle cells and the nurse cells. (e) Interface between follicle cells, oocyte and nurse cells. (f) Interface between the oocyte and the nurse cells. Abbreviations as in Figure 2, Figure 3 and Figure 8.
Sustainability 13 10122 g009
Figure 10. (ae) Ovariole of M. domestica observed under the optical microscope. (a) Ovariole in toto in treated females at T3, morphotype 6. (b) Secondary follicle of an ovariole at T3, morphotype 6; the inlay shows the border cell cluster in migration. (c) Detail of the oocyte nucleus of the secondary follicle. (d) Detail of the nucleus of a nurse cell in the secondary follicle. (e) Interface among follicle cells, nurse cells and the oocyte. (fh) Secondary follicle of ovarioles in treated females at T3, morphotype 6, observed by TEM. (f) Columnar follicular cells. (g) Cytoplasm of a columnar follicular cell showing the rough endoplasmic reticulum and some mitochondria. (h) Interface between the columnar follicle cells and the oocyte. Abbreviations: CP, coated pits; VB, vitelline bodies. Other abbreviations as in Figure 1, Figure 2, Figure 3 and Figure 4 and Figure 8.
Sustainability 13 10122 g010
Figure 11. Ovariole of M. domestica observed by TEM. (ag) Secondary follicle of ovarioles in treated females at T3, morphotype 6. (a) Squamous follicular cells. (b) Detail of the interface between squamous follicular cells and nurse cells. (c) Border cell cluster. (d) Detail of the cytoplasm of a polar cell. (e,f) Interface between the border cells and the nurse cells. (g) Centripetal follicular cells; inlay shows the cytoplasm of centripetal follicular cells. Abbreviations: BC, border cells; PAC, polar anterior cells. Other abbreviations as in Figure 2, Figure 3 and Figure 4 and Figure 8.
Sustainability 13 10122 g011
Figure 12. Ovariole of M. domestica in treated females at T3, morphotype 7. (ac) Optical microscope. (a) Ovariole in toto at T3, morphotype 7. (b) Tertiary follicle of an ovariole at T3, morphotype 7. (c) Secondary follicle in the process of degenerating. (d) Secondary follicle of ovarioles in treated females at T3, morphotype 7, observed by TEM. (d) Cortical region. Abbreviation: EL, electron-lucent regions. Other abbreviations as in Figure 1, Figure 2, Figure 3 and Figure 4, Figure 7 and Figure 8.
Sustainability 13 10122 g012
Figure 13. Ovariole of M. domestica in treated females at T3, morphotype 8. (ac) Optical microscope. (a) Ovariole in toto at T3, morphotype 8. (b) Secondary follicle of an ovariole at T3, morphotype 8. (c) Tertiary follicle. (dg) Secondary follicle of ovarioles in treated females at T3, morphotype 8, observed by TEM. (d) Squamous follicular cell layer invaded by nurse cells. (e) Detail of the interface squamous follicular cells–nurse cells. (f) Columnar follicular cell layer invaded by nurse cells. (g) Detail of the interface columnar follicular cells–oocyte, showing the absence of microvilli. Abbreviations as in Figure 1, Figure 2, Figure 3 and Figure 4 and Figure 8.
Sustainability 13 10122 g013
Figure 14. Ovariole of M. domestica in treated females at T3, morphotype 9, observed under the optical microscope. (a) Ovariole in toto at T3, morphotype 9. (b) “Anterior” follicle. (c) Border cell cluster in migration within the “posterior” follicle of the ovariole in T3, morphotype 9. (d) Detail of the interface among follicle cells, the oocyte and the nurse cells. Abbreviation: AF, anterior follicle; PF, posterior follicle. Other abbreviations as in Figure 3 and Figure 4.
Sustainability 13 10122 g014
Figure 15. “Transformation paths” of the ovarioles in treated females from T0t (15 h from emerging, time of treatment) to T1 (45 h from emerging, 30 h from treatment), T2 (70 h from emerging, 55 h from treatment) and T3 (90 h from emerging, 75 h from treatment). Numbers indicate the morphotypes. Path A—green, path B—blue, path C—orange.
Sustainability 13 10122 g015
Figure 16. Map of the morphotypes in right and left ovary of three treated females at T3. Morphotype 6 is shown in green, morphotype 7 in blue, morphotype 8 in red and morphotype 9 in black.
Sustainability 13 10122 g016
Figure 17. Musca domestica observed under the stereomicroscope. (a) Ventral side of a swollen abdomen of a treated female dead after laying eggs only in the first egg deposition cycle: the exposed ovarioles are visible at the top. (b) Detail of the exposed ovarioles in A, showing the disordered overlapping of follicles at advanced developmental stages. (c) Egg grid showing several unhatched eggs, indicated by arrowheads. (d) Detail of an unhatched egg. Abbreviations: C, cephalic end; F1 and F2 respectively primary and secondary follicle; M, metameric body; O, ovary.
Sustainability 13 10122 g017
Figure 18. Transverse section of the prothorax of an adult female of M. domestica observed under the optical microscope, showing the position of the Weismann’s ring. Abbreviations: AG, anterior gut; AO, aorta; AS, air sac; CA, corpora allata; CC, corpora cardiaca; CN, cervical nerve; CNC, cephalothoracic nerve cord; FB, fat bodies; MU, muscles; VESC, ventral sclerites.
Sustainability 13 10122 g018
Figure 19. Corpora allata of M. domestica. (a) Transverse section of corpora allata at T0 observed under the optical microscope. (be) Corpora allata at T0 observed by TEM. (b) Pycnotic nucleus. (c) Nucleus of a corpora allata cell. (d) Detail of cytoplasm showing an axon in transverse section. (e) Detail of cytoplasm showing mitochondria. Arrowhead indicates a ribosome. Abbreviations: AX, axon; DE, desmosome; M, mitochondria; NG, neurosecretory granule; NU, nucleus. Other abbreviations as in Figure 18.
Sustainability 13 10122 g019
Figure 20. Corpora allata of M. domestica. (a) Transverse section of corpora allata at T0t observed under the optical microscope. (be) Corpora allata at T0t observed by TEM. (b) Intercellular space. (c) Nucleus of a corpora allata cell. (d) Detail of intercellular space. (e) Detail of cytoplasm showing mitochondria and rough endoplasmic reticulum. Abbreviations: IC, intercellular space; RER, rough endoplasmic reticulum. Other abbreviations as in Figure 18 and Figure 19.
Sustainability 13 10122 g020
Figure 21. Corpora allata of M. domestica. (a) Transverse section of corpora allata of a control female at T1 observed under the optical microscope. (be) Corpora allata of a control female at T1 observed by TEM. (b) Nucleus of a dark cell. (c) Detail of cytoplasm of a dark cell showing mitochondria. (d) Vesicles within a light cell. (e) Transition between a dark cell (on the left) and a light one (on the right); the light cell is characterized by electron-dense mitochondria. Abbreviations: DC, dark cell; LC, light cell; SER, smooth endoplasmic reticulum; V, vesicles. Other abbreviations as in Figure 18 and Figure 19.
Sustainability 13 10122 g021
Figure 22. Corpora allata of M. domestica. (a) Transverse section of corpora allata of a treated female at T1 by optical microscopy. (bd) Corpora allata of a treated female at T1 observed by TEM. (b) Nucleus of a corpora allata cell. (c) Detail of the cytoplasm showing swollen and degenerating mitochondria. (d) Detail of cytoplasm showing an axon and interdigitating membranes. Arrowheads indicate interdigitating plasma membranes. Abbreviations: MD, degenerating mitochondria. Other abbreviations as in Figure 18 and Figure 19.
Sustainability 13 10122 g022
Figure 23. Corpora allata of M. domestica. (a) Transverse section of corpora allata of a control female at T2 observed under the optical microscope. (be) Corpora allata of a control female at T2 observed by TEM. (b) Interface between dark and light cells. (c) Detail of cytoplasm of a dark cell showing mitochondria. (d) Vesicles within a light cell. (e) Detail of cytoplasm of a light cell showing mitochondria. Abbreviations as in Figure 18, Figure 19 and Figure 21.
Sustainability 13 10122 g023
Figure 24. Corpora allata of M. domestica. (a,b) Transverse sections of corpora allata of a treated female at T2 observed under the optical microscope. (a) Wide central spaces are visible inside the corpora allata. (b) Corpora allata of a treated female at T2 in which the light and dark cells are not distinguishable. (c,d) Corpora allata of a treated female at T2 observed by TEM. (c) Cytoplasm of a corpora allata cell, showing rarefied endoplasmic reticulum. (d) Cytoplasm of a corpora allata cell showing swollen and degenerating mitochondria. Abbreviations as in Figure 18, Figure 19 and Figure 22.
Sustainability 13 10122 g024
Figure 25. Corpora allata of M. domestica. (a) Transverse section of corpora allata of a control female at T3 observed under the optical microscope. (b,c) Corpora allata of a control female at T3 observed by TEM. (b) Cytoplasm of a corpora allata cell; the inlay shows a mitochondrion with highly electron-dense matrix. (c) Rarefied cytoplasm in a corpora allata cell; the inlay shows swollen mitochondria. Abbreviations as in Figure 18, Figure 19 and Figure 20.
Sustainability 13 10122 g025
Figure 26. Corpora allata of M. domestica. (ad) Transverse sections of corpora allata from four treated females at T3 observed under the optical microscope. Arrowheads indicate wide lacunae. Abbreviations as in Figure 18 and Figure 19.
Sustainability 13 10122 g026
Figure 27. Corpora allata of M. domestica. (af) Corpora allata from treated females at T3 observed by TEM. (a) Nucleus with irregular envelope. (b) Nucleus with roundish envelope. (c) Cytoplasm homogeneously rich in round vesicles of variable size. (d) Detail of the light round vesicles in the cytoplasm. (e) Heterogeneous cytoplasm with very light regions containing a flocculent material. (f) Detail of a less rarefied area within the heterogeneous cytoplasm. Arrowhead: digitiform nuclear envelope. Abbreviations as in Figure 21.
Sustainability 13 10122 g027
Table 1. Fecundity (F) measured as the average egg number ± SD laid by control females (0 µg/µL of diofenolan, treated only with acetone) and females treated with different concentrations of diofenolan (DC), and Fecundity Inhibition (FI) in treated females, expressed in percentage. Each control and the treated group was replicated four times with 10 females each.
DC (µg/µL)F ± SDFI (%)
Control (0)2461.3 ± 330.8---
51668.6 ± 82.132
25837.3 ± 76.566
50736.0 ± 52.570
75690.0 ± 86.972
Table 2. Average number of ovarioles (ON) ± SD in each of the four concentric circles of ovaries in control and treated females at T3 (90 h from emerging).
ON ± SD
I° CircleII° CircleIII° CircleIV° Circle
Control24.2 ± 1.218.5 ± 1.011.5 ± 1.05.2 ± 0.8
Treated24.2 ± 1.018.2 ± 1.511.5 ± 0.85.2 ± 0.8
Table 3. Average number of ovarioles (ON) ± SD in ovaries of females at T0t (15 h from emerging, time of the topical treatment, either with diofenolan or with acetone for controls), and of control and treated females at time intervals T1 (45 h from emerging, 30 h after T0t), T2 (70 h from emerging, 55 h after T0t), and T3 (90 h from emerging, 75 h after T0t).
Time IntervalsON ± SD
T0t--60.1 ± 2.0
T1Control58.7 ± 2.9
Treated58.8 ± 1.8
T2Control59.8 ± 2.4
Treated58.3 ± 3.4
T3Control59.7 ± 2.1
Treated59.0 ± 2.5
Table 4. Synthesis of reproductive ability of M. domestica females after treatment with diofenolan. Fecundity in egg deposition cycle (FC) ± SD = average number of eggs laid for egg deposition cycle in control and treated females. Fecundity Inhibition (FI) = (average number of eggs laid by controls per cycle–average number of eggs laid by treated females per cycle/average number of eggs laid by controls per cycle) x100. Hatching in each deposition cycle (HC) ± SD = average number of eggs hatched for egg deposition cycle in control and treated females. Hatching (H) = (total number of eggs hatched for cycle x100)/total number of eggs laid for cycle. Sterility Index in each deposition cycle (SI) = 100 − (fecundity in treated x hatching in treated/fecundity in controls x hatching in controls) x100. EC, egg deposition cycle.
ECFC ± SDFI (%)HC ± SDH (%)SI (%)
Control
(n = 10)
90.2 ± 19.0---86.9 ± 19.496---
87.4 ± 33.8 ---85.3 ± 34.198---
83.8 ± 33.0---81.4 ± 32.297---
Treated
(n = 10)
70.8 ± 45.12251.4 ± 36.717341
29.2 ± 44.8 6714.3 ± 33.174983
20.9 ± 38.8755.0 ± 10.22494
Table 5. The average number of cells (CN) per corpora allata ± SD and total volume of the gland (V) ± SD (in µm3) in control and treated females at different time intervals. The time intervals were T0 (time of emerging from the puparium), T0t (15 h from emerging, time of treatment either with diofenolan or acetone), T1 (45 h from emerging, 30 h after T0t), T2 (70 h from emerging, 55 h after T0t), and T3 (90 h from emerging, 75 h after T0t). For T0 and T0t, 5 females were tested, for T1, T2 and T3 each time interval, 5 control and 5 treated females were tested.
Time Intervals CN ± SDV ± SD
T0 ---16.4± 1.1110.8 ± 8.4 × 10³
T0t---19.4 ± 1.1158.2 ± 12.3 × 10³
T1Control19.6 ± 1.1205.6 ± 14.4 × 10³
Treated17.6 ± 1.5160.1 ± 13.6 × 10³
T2Control19.8 ± 1.3323.4 ± 17.8 × 10³
Treated17.4 ± 0.9184.4 ± 17.2 × 10³
T3Control19.8 ± 1.3214.1 ± 24.0 × 10³
Treated18.0 ± 1.0153.8 ± 21.1 × 10³
Publisher’s Note: MDPI stays neutral with regard to jurisdictional claims in published maps and institutional affiliations.

