Article

The Effect of Nitrogen Fertilization on the Yield, Quality and Fatty Acid Composition of Opuntia ficus-indica Seed Oil

1
Department of Sustainable Food Systems and Development, University of the Free State, Bloemfontein 9301, South Africa
2
Department of Soil, Crop and Climate Sciences, University of the Free State, Bloemfontein 9301, South Africa
3
Department of Animal, Pasture and Grassland Sciences, University of the Free State, Bloemfontein 9301, South Africa
*
Author to whom correspondence should be addressed.
Sustainability 2021, 13(18), 10123; https://doi.org/10.3390/su131810123
Submission received: 30 July 2021 / Revised: 29 August 2021 / Accepted: 31 August 2021 / Published: 9 September 2021
(This article belongs to the Special Issue Sustainable Food Systems and Circular Bioeconomy)

Abstract

:
Cactus pears are nutritious, drought-tolerant plants that flourish in hot and arid regions. All its plant parts can be consumed by humans and animals. Fruit seed oil production is an important emerging industry in South Africa. As part of an initiative to promote cactus pears as multi-functional crops, dual-purpose cultivars should be identified, and their production increased. The aim of this study was to investigate the role of nitrogen (N) fertilizer on the seed oil yield and quality of Opuntia ficus-indica. The project encompassed a trial using N fertilization from three N sources (limestone ammonium nitrate, ammonium sulfate, urea) and four N application levels (0, 60, 120, 240 kg ha−1). Oil was quantitatively extracted from the seed using the Folch method; fatty acids were quantified using a Varian 430-GC. Seed oil content significantly increased (p = 0.035) with increased N fertilization rates; the oil yield ranged between 7.96 and 9.54%. The composition of the main fatty acids (oleic, palmitic, cis-vaccenic and stearic acid) was significantly influenced; oleic and stearic acid were significantly increased by higher fertilization levels whereas a reducing trend was observed in palmitic and cis-vaccenic acid levels. The highest content fatty acid, linoleic acid, was not significantly influenced.

1. Introduction

Spineless Burbank Opuntia ficus-indica is one of the most popular cactus pear species that grow in the arid and semi-arid regions of South Africa and is a noteworthy food source for humans and animals in these regions [1,2,3]. Fruit pulp processing of cactus pear leads to the discarding of the peels and seed as waste. New sources of oil and meal have been produced from these waste products [4,5]. Cactus pear fruits are valued for their distinctive flavour and aroma in addition to the nutritional properties of the oil in their seed. The Morado cultivar is one of the most popular cultivars in South Africa in relation to both human and animal consumption and food processing [6]. The existing varieties in South Africa are from the Burbank (spineless) varieties which were initially imported in 1914 for forage [3]. The annual production volume of cactus pear fruits in South Africa is 20–25 t ha−1, under normal dry land conditions [2,3,6].
The cactus pear fruit is very nutritious, not only because of the high polyunsaturated fatty acid (82%) content in its seed oil, but the fruit has also been found to have antioxidant properties [7,8,9], because of the presence of betalains, ascorbic acid and carotenoids [10]. There is great variation in the number of seed, ranging from 120 to 350 per fruit [11]. The hard-coated seed, from which the oil is extracted, make up 5–10% of the fruit weight [12]. The oil makes up approximately 17% of the seed mass [13]. The oil is characterized as a low oil content seed oil, and is principally composed of unsaturated fatty acids, linoleic (61–69%) and oleic acid (12–16%) and is also composed of saturated fatty acids (18%), stearic (11–16%) and palmitic acid (3–4%), which occur at much lower amounts [14,15,16,17,18,19]. The human body is naturally unable to manufacture essential fatty acids such as the omega-3 and omega-6 fatty acids, therefore these fatty acids should be included in the diet. Oils are the main source of these very important fatty acids [20]. Cactus pear seed oil has a high level of unsaturation that makes it a potential health oil that must be further explored [14]. Its physical and chemical characteristics show similarities to other fruit/vegetable oils such as grape seed oil (linoleic acid: 68–78%; palmitic acid: 5–11%; stearic acid: 3–6%) and rape seed oil (linoleic acid: 61%; palmitic acid: 4%; stearic acid: 2%) [14,15,19]. Fatty acids such as palmitoleic acid and arachidic acid have been observed in much fewer quantities in cactus pear seed oil [21]. Other compounds found in this precious oil include β-sitosterol and γ-tocopherol [7].
Because of its high unsaturation, oxidation reactions are prone to have a negative effect on the cactus pear seed oil quality and measures should be implemented to prevent this occurrence [22]. For successful production of cactus pear fruit, management agricultural practices such as pest, disease, and weed control; pruning, thinning, irrigation, and organic/mineral nutrition are needed [23,24].
Nitrogen (N) is an important nutrient for vegetative growth, development and reproduction. N is so important because it is the main component of chlorophyll, a compound that converts light energy into chemical energy in the process of photosynthesis. N is also a vital component of amino acids, the building blocks of proteins (structural and enzymatic), energy transfer compounds such as ATP (adenosine triphosphate), and nucleic acids such as DNA (deoxyribonucleic acid). Most plants get most of the N from the soil in the form of nitrate (NO3) or ammonium (NH4+). However, the supply is limited, and plants must compete with various soil microorganisms for available N. In addition, the crops harvested each year remove a large amount of N [25]. N is the most limited nutrient in cacti, with the highest N values found in young and fertile cladodes [26]. In productive agriculture, the use of N fertilizers overcomes the N limit imposed by the environment [25].
Organic and inorganic fertilizer research has mostly centered the attention around the influence it has on fruit yield and quality [27,28], as well as off-season fruit yield [29,30,31,32,33,34]. A number of reports have shown no effects of soil applications of NPK (nitrogen, phosphorous and potassium) either on fruit yield or quality features of cactus pears at time of gathering of crops [27,35]. Fruit sugar concentration has been found to be the only exception, where higher sugar concentrations in fruit from NPK-fertilized plants have been found than from the fruit that have not undergone NPK-fertilization. It was found that cladode magnesium concentration had a significant influence on fruit sugar concentration [36]. The fertilizer effects on fruit postharvest life have not received much attention.
From this observation, Zegbe et al. [34] studied the effect of soil applied NPK on fruit quality attributes after three or four weeks of storage at room conditions for ‘Cristalina’ cactus pear, native to Mexico. The study was done over a period of three years. Fruit quality attributes evaluated after storage were flesh firmness (FF), total soluble solid concentration (TSSC) and dry matter concentration of pulp (DMCP). FF produced similar results in all treatments for all three years. The TSSC and DMCP had the same values between the different treatments. Lower TSSC and DMCP values were observed when higher quantities of N were applied. It was concluded that NPK fertilizer treatments produced incompatible results; thus, more research is required in order to address the effect of the fertilizer on the fruit quality of cactus pear.
Crops use N from the soil as nitrate (NO3) or ammonium (NH4⁺), but most crops prefer a combination of the two forms. Limestone ammonium nitrate (LAN) contains 28% N, ammonium sulfate (AmSul) contains 21% N, and urea contains 46% N. The N in LAN and AmSul is readily available to the plant for uptake, although not necessarily at the ideal nitrate-N:ammonium-N ratio. Urea differs from other N sources in that it must be converted to NH4⁺ by urease. This process is called hydrolysis. The NH4⁺ produced by this process then undergoes a nitrification process to produce NO3. The nitrate-N:ammonium-N ratio of LAN is 50/50, which is close to the preferred ratio for most crops. LAN is suitable for band placement and broadcasting applications due to its very low toxicity and low volatile effects. AmSul is a low-cost fertilizer most commonly used for alkaline soils. When introduced into moist soil, NH4⁺ ions are released. This produces a small amount of acid, which reduces the pH balance of the soil [37]. Urea is commonly used in solid and liquid fertilizers and has the characteristics of relatively easy handling and storage, making it the most important solid N fertilizer material in the world [38]. The current fertilizer recommendation available in South Africa is for fruit production of cactus pear. The N recommended is 60 and 90 kg N ha−1 for 2- and 3-year-old trees respectively. It is also recommended to apply between 13 and 16 kg ha−1 phosphorus (P) and 60 and 80 kg ha−1 potassium (K) to 2- and 3-year-old trees, respectively [39].
The overall purpose of this field trial was to investigate the role of N fertilizer on cladode yield, fruit yield and quality. Currently, there are no recommendations for fodder or seed oil production. The purpose of the current study was therefore to determine which N fertilizer source (LAN, AmSul and urea) (Omnia Holdings Ltd., Johannesburg, South Africa; Kynoch Fertilizers, Johannesburg, South Africa) and level (0, 60, 120 and 240 kg ha−1) has the most significant effect on oil content and fatty acid composition of cactus pear seed. The null hypothesis (H0) is that N fertilization will improve the yield and quality of cactus pear seed oil. The alternative hypothesis (Ha) is that N fertilization will have no effect on the yield and quality of cactus pear seed oil.

2. Materials and Methods

2.1. Fruit Collection

The cactus pear orchard (cv. Morado) was established in 2016 on the West Campus of the University of the Free State (UFS) in Bloemfontein (29°06′06.2″ S 26°10′25.2″ E), South Africa under rainfed conditions. The area is located within a semi-arid climate of the revised Köppen Climate Classification [40], with hot summer days (for the past 30 years, the annual (January–December) average maximum temperature has been 24.4 °C) and cold dry winters (for the past 30 years, the annual (January–December) average minimum temperature has been 7.5 °C) often with severe frost. The annual rainfall average is 559 mm (for the past 30 years) [41]. Most rainfall is seen in February with 91.4 mm of precipitation [40]. The soil is classified as a Bainsvlei form [42] and a summary of the topsoil’s physical and chemical properties is indicated in Table 1.
The recommended fertilization program [39] was followed for the first season before the fertilization trial started in 2017/2018 season. In 2017/18 different nitrogen levels were applied (0, 60, 120, 240 kg ha1) and the same levels was also applied in the 2018/19 production season. The same three N sources namely limestone ammonium nitrate (LAN) (Omnia Holdings Ltd., Johannesburg, South Africa), ammonium sulfate (AmSul) (Omnia Holdings Ltd., South Africa) and urea (Kynoch Fertilizer, Johannesburg, South Africa), were used in both production seasons. A two-factor experiment (3 N sources × 4 N levels) was used and the trial was laid out as a randomized complete block design (RCBD). Each treatment combination was replicated three times with each replication consisting of four data plants. The N treatments were split up into 4 applications, starting in October/December (2017 and 2018) and February/April (2018 and 2019) of each production season. The fertilizer was diluted in 20 L water and applied to each plant individually to ensure that it is well washed into the soil before volatilization of the nitrogen could take place. All the trees received the recommended P and K according to the age of the plants in the beginning of each growth season [39]. Superphosphate (10.5%) and potassium chloride (50%) was used as sources for P and K, respectively. All orchard practices were done according to the guidelines for cactus pear fruit production in South Africa [39]
Fruit used for this study was harvested in February 2019. Fruit collection was done at the beginning of the ripening period, at 50% color break stage (skin coloring). Fifty fruits per replication were randomly collected from the two middle data plants. The fruits were weighed and frozen at −20 °C until further sample preparation.

2.2. Extraction of the Seed

The frozen fruit was allowed to thaw at room temperature. The fruits were blended in distilled water using a Milex 4-in-1 household liquidizer. After rinsing the liquidized fruit pulp slurry four times with water, a sieve was used to strain the liquid. The seed were dried over a period of one week at approximately 25 °C after which they were ground using a household Kenwood coffee grinder and the seed flour was frozen until further analysis (−20 °C) [43].

2.3. Lipid Extraction

Total lipid was quantitatively extracted from 2.5 g of ground cactus pear seed, according to the method of Folch et al. [44], using chloroform and methanol at a ratio of 2:1. An antioxidant, butylated hydroxytoluene, was added at a concentration of 0.001% to the chloroform: methanol mixture. A rotary evaporator was used to dry the fat extracts under vacuum and the extracts were dried overnight in a vacuum oven at 50 °C, using phosphorus pentoxide as moisture adsorbent. Total extractable fat was determined gravimetrically and expressed as %fat (w/w) per 100 g seed. The fat free dry matter (FFDM) content was determined by weighing the residue on a pre-weighed filter paper, used for Folch extraction, after drying. By determining the difference in weight, the FFDM could be expressed as %FFDM (w/w) per 100 g seed. The moisture content of the seed was determined by subtraction (100%–%lipid–%FFDM) and expressed as %moisture (w/w) per 100 g seed. The extracted fat was stored in a polytop (glass vial, with push-in top) under a blanket of Nand frozen at −20 °C pending fatty acid analyses.

2.4. Fatty Acids Analysis

A lipid aliquot (20 mg) of lipid was transferred into a Teflon-lined screw-top test tube by means of a glass pasteur pipette. Fatty acids were transesterified to form methyl esters using 0.5 N NaOH in methanol and 14% boron trifluoride in methanol [45,46,47].
Fatty acid methyl esters from fat were quantified using a Varian 430 flame ionization GC (Scientific Supply Services, Johannesburg, South Africa), with a fused silica capillary column, Chrompack CPSIL 88 (100 m length, 0.25 mm ID, 0.2 μm film thicknesses) (Scientific Supply Services, Johannesburg, South Africa). Analysis was performed using an initial isothermic period (40 °C for 2 min). Thereafter, temperature was increased at a rate of 4 °C/min to 230 °C. Finally, an isothermic period of 230 °C for 10 min followed. Fatty acid methyl esters (FAME) n-hexane (1 μL) were injected into the column using a Varian CP 8400 Autosampler (Scientific Supply Services, Johannesburg, South Africa). The injection port and detector were both maintained at 250 °C. Hydrogen, at 45 psi, was used as the carrier gas, while N was employed as the makeup gas. Galaxy Chromatography Software (version 1.9) recorded the chromatograms. FAME samples were identified by comparing the retention times of FAME peaks from samples with those of standards obtained from Supelco (Supelco 37 Component Fame Mix 47885-U, Sigma-Aldrich Aston Manor, Pretoria, South Africa). All other reagents and solvents were of analytical grade and obtained from Merck Chemicals (Pty Ltd., Halfway House, Johannesburg, South Africa). Fatty acids were expressed as the proportion of each individual fatty acid to the total of all fatty acids present in the sample. The following fatty acid combinations were calculated: omega-3 (n-3) fatty acids, omega-6 (n-6) fatty acids, total saturated fatty acids (SFA), total monounsaturated fatty acids (MUFA), polyunsaturated fatty acids (PUFA), PUFA/SFA ratio (P/S) and n-6/n-3 ratio.

2.5. Statistical Analysis

Data obtained for the lipid quality properties of cactus pear seed from different fertilizer source and fertilizer levels treatments were entered into an Excel spreadsheet. The NCSS Statistical Software package (version 11.0.20) was used for statistical analysis. The means and standard deviations and coefficients of variation were calculated for each treatment. Analysis of variance (ANOVA) was used to detect significant differences (p < 0.05) between different fertilizer treatment combinations. The Tukey-Kramer multiple comparison test was used to identify differences between treatment means. The multivariate statistical procedure, principal component analysis (PCA) was used to investigate and simplify the relationship between fertilizer source and fertilizer level treatments and measured variable.

3. Results and Discussion

3.1. Chemical Composition

3.1.1. Oil Content

Table 2 shows the effect of limestone ammonium nitrate (LAN), urea and ammonium sulfate (AmSul) applied at different levels on the oil, fat free dry matter (FFDM) and moisture content of Morado seed. As shown in Table 2, N levels from different N sources had a significant (p = 0.035) effect on the oil content. There is still no research on the effects of N fertilization on Opuntia ficus-indica seed oil content. However, previous studies showed that N fertilization can significantly affect the oil content of other crops such as tobacco, olives and sunflowers [48,49,50]. A significant difference existed between the oil content of seed from plants not receiving any N (control) (8.15%) and the seed of plants that were treated with urea at 240 kg N ha−1 (9.54%). The oil content of seed from plants that were treated with AmSul at 60 kg ha−1 (7.96%) was significantly lower than the seed of plants treated with urea at 240 kg ha−1 (9.54%). There was no significant difference observed between the other treatments, but the oil content of the seed tends to increase as N level increase. A similar trend was observed with tobacco; its seed oil content significantly increased with increased N fertilization levels (120, 180, 150 kg N ha−1) compared to the control (90 kg N ha−1). However, unlike Opuntia ficus-indica seed oil, tobacco seed oil content decreased at the highest N fertilization level (180 kg N ha−1), indicating that tobacco is sensitive to oversupply of nutrients [48]. In contrast, a previous study showed that five N fertilization levels (0, 50, 100, 150 and 200 kg N ha−1) had no significant effect for canola oil content. A reduced oil content was recorded for canola which received the highest N supply, while a high oil content was recorded for unfertilized canola [51].

3.1.2. Fat Free Dry Matter (FFDM) Content

As shown in Table 2, N levels from different N sources were significant (p = 0.003) for the FFDM content. A significant difference in the FFDM content exists between seed from plants not treated with N (89.23%) and those seed from plants treated with urea at 240 kg N ha−1 (85.79%). A significant difference existed between the FFDM of seed from plants treated with LAN at 60 kg N ha−1 (90.58%), AmSul at 60 kg N ha−1 (91.12%) and urea applied at 240 kg N ha−1 (85.79%). There was no significant difference observed between the other treatments and the FFDM contents ranged from 85.79% for urea applied at 240 kg N ha−1 to 91.12% for AmSul applied at 60 kg ha−1. Although FFDM contents were not significantly different among most of the treatments, most values were lower than that of the control, indicating the possibility that N fertilization may result with a lower FFDM content. This could be a valuable development as more oil can be expressed from the seeds. Due to the FFDM rich protein content, it was found to be an alternative to animal feed. The FFDM remaining after oil extraction can be sun dried and then ground into animal meal. [11]. It could be observed that the lower the level of the fertiliser, the higher the FFDM content tends to be.

3.1.3. Moisture Content

As shown in Table 2, N levels from different N sources were significant (p = 0.002) for moisture content of the seed. Amongst the treated samples, a significant difference existed between LAN 60 (0.78%), AmSul 60 (0.92%), urea 120 (4.44%), and urea 240 (4.67%). The authors believe that the low moisture contents of LAN 60 and AmSul 60 were due to the samples being drier at the point of analysis. Although moisture contents were not significantly different among the other treatments, the moisture content for the N treated plants was higher than that of the control, and therefore it is possible that N fertiliser may increase the moisture content of the seed. It is known from previous findings that if moisture content of cactus pear seed is high, the fat content tends to be low [52]. This could be an unwanted development since a low moisture content is more favourable. It could be observed that the higher the level of the fertiliser, the higher the moisture content tended to be. A similar phenomenon was observed in terms of the fertiliser level and the oil content. A high moisture content did not result in a low oil content in these results; the FFDM is the only factor that decreased in content.

3.2. The Effect of LAN, Urea and AmSul and Their Different Levels on the Fatty Acid Profile of Cactus Pear Seed Oil

Fertilizer source and level had a significant effect on the following fatty acids, (Table 3) C14:0, C16:0, C16:1c9, C17:0, C18:0, C18:1c9, C18:1c7 and C20:3c8,11,14 (n-6). Five fatty acids present at the highest content in the seed oil from the control treatment (in descending order) are; C18:2c9,12 (n-6) (linoleic acid), C16:0 (palmitic acid), C18:1c9 (oleic acid), C18:1c7 (cis-vaccenic acid) and C18:0 (stearic acid). Linoleic acid and oleic acid are the main components of unsaturated fatty acids and can be used as indicators of the nutritional value of seed oils [48]. No significant difference (p = 0.396) existed between the fatty acid C18:2c9,12 (n-6) for any of the fertilizer-treatments. The C18:2c9,12 (n-6) contents ranged from 61.72% for AmSul 60 to 62.09% for AmSul 120. C18:2c9,12 (n-6) of tobacco seed oil was also not significantly different under four N levels. Except for the linolenic acid content, which significantly increased at higher N application levels, N fertilization levels only had a small effect on the fatty acid composition of tobacco seed oil [48].
Although C18:2c9,12 (n-6) contents were not significantly different among the treatments, the content was higher in seed from plants treated with urea at 240 kg ha−1 (62.06%) and with AmSul at 120 kg N ha−1 (62.09%). Significant differences (p = 0.002) existed between the fatty acid C16:0 (13.95%) content of seed from plants not receiving any N and where AmSul was applied at 240 (13.70%) and 120 kg N ha−1 (13.71%), LAN at 240 kg N ha−1 (13.71%) and urea at 240 kg N ha−1 (13.71%). The C16:0 contents ranged from 13.70% for seed from plants that were treated with AmSul at 240 kg N ha−1 to 13.85% for urea at 60 kg N ha−1. Although C16:0 contents were significantly different among most of the treatments, no values were higher than that of the control. It is possible that adding a N application resulted in a decrease of palmitic acid content. A decrease in saturated fatty acids is a good development because an increase in saturated fatty acid intake leads to an increase in the body’s total low-density lipoprotein (LDL) cholesterol concentration, thereby significantly increasing the risk of heart attack and stroke [53].
Significant differences (p < 0.001) existed between the fatty acid C18:1c9 (12.88%) of the oil from seed of the plants not treated with any N and most of the seed from the fertilizer treated plants which includes seed from plants treated with 60 (13.19%) and 240 kg N ha−1 (13.23%) applied as LAN, urea applied at 120 kg N ha−1 (13.20%) or AmSul at 60 (13.31%) and 240 kg N ha−1 (13.25%). The C18:1c9 contents ranged from 13.15% for 60 kg N ha−1 applied as urea to 13.31% for AmSul applied at 60 kg N ha−1. Previous studies (no N application) found a very high mean C18:1c9 composition of 19.41% for the Morado × Bloemfontein interaction [43,52]. A more recent study of cold-pressed oil (no N application) found a C18:1c9 fatty acid content of 13.51%, which is slightly higher than that of the current study’s control treatment (12.88%) [54]. Not all C18:1c9 contents were significantly different among all the treatments; all values were higher than that of the control. It is possible that N fertilisation can result in higher oleic acid content.
Significant differences (p < 0.001) existed between the fatty acid C18:1c7 (6.11%) content of the seed of the control plants that was significantly higher than the C18:1c7 fatty acid content of seed from the plants treated with LAN at 120 (6.03%) or 240 kg ha−1 (6.01%) or urea at 120 kg N ha−1 (6.02%). The C18:1c7 contents ranged from 5.98% for 240 to 6.07% for 60 kg N ha−1 applied as urea. Although C18:1c7 contents were significantly different among some of the treatments, no values were higher than that of the control. It is possible that N fertiliser applications may result in lower cis-vaccenic acid content.
Significant differences (p < 0.001) existed between the fatty acid C18:0 (3.05%) content of the seed of the control plants and the seed of most of the fertilizer treatments except for urea 60 (3.12%), AmSul applied at 120 (3.13%) and 240 kg N ha−1 (3.15%). The C18:0 contents ranged from 5.98% for 240 to 6.07% 60 kg N ha−1 applied as urea. Although not all C18:0 contents were significantly different among all the treatments, all values were higher than that of the control. It is possible that N application may resulted in a higher stearic acid content. It seems that, the higher the N level applied (LAN applied at 240 kg N ha−1, urea at 240 kg ha−1, 120 or 240 kg N ha−1 AmSul), the more likely a significant difference existed between the SFA content of seed from the control plants and the N treated plants. PUFA responded negatively (decreased) when grown under higher N levels irrespective of the source. On the contrary, SFA and MUFA acids responded positively (increased) when grown under higher N levels. We expected the main fatty acid, linoleic acid, of the different treatments to have had a significant difference to the control. However, the treatments had an effect on the minor fatty acids, such as SFA (as will be discussed in the next section).

3.3. Fatty Acid Ratios of Cactus Pear Seed Oil

Table 4 shows the effect of LAN, urea and AmSul on the fatty acid ratios of cactus pear seed oil. Fertilizer source and level had no significant (p = 0.232) effect on the total SFA content. The SFA range was between 17.35% for AmSul 120 to 17.57% for LAN 60. This SFA range shows similarity to the SFA values for the 2010 and 2011 seasons (no N application), which was 17.55% for ‘Morado’ [52]. The MUFA composition was also not significantly influenced by N fertilizer sources or level (p = 0.103) (Table 4).
Fertilizer source and level also had no significant (p = 0.393) effect on PUFA content (Table 4). Although not significant, seed of the plants treated with urea at 240 kg N ha−1 and seed of ammonium suphate at 120 kg N ha−1 contained the highest PUFA. De Wit et al. [52] found a PUFA value of 62.20% for ‘Morado’ in the 2010 and 2011 seasons (no N application). The omega-6 ratio ranged between 61.85 and 62.22% for AmSul applied at 60 or 120 kg N ha−1, respectively, making these oils a good source of omega-6 fatty acids. This omega-6 ratio shows similarity to the mean omega-6 value (61.99%) of the 2010 and 2011 season [52] but differs to the mean omega-6 value (63.40%) reported by a recent study [54]. The lowest PUFA/SFA ratio was observed where plants were treated with LAN at 60 kg N ha−1 or 120 kg N ha−1 applied as urea, with both of them yielding a 3.56% PUFA/SFA ratio and with the highest ratio observed where AmSul was applied at 120 kg N ha−1 (3.62%). This PUFA/SFA range shows similarity to the PUFA/SFA mean ratio of the 2010 and 2011 seasons [52]. Omega-3 fatty acids occurred at very low levels and did not differ significantly (p = 0.559) between fertilizer source and fertilization levels (Table 4). Plants treated with AmSul at 120 kg N ha−1 produced seed with a high PUFA, n-6 and PUFA/SFA content. This result is supported by Kheir et al. [55], who observed that higher N levels increased the proportion of PUFAs and decreased the SFAs of flaxseed oil.

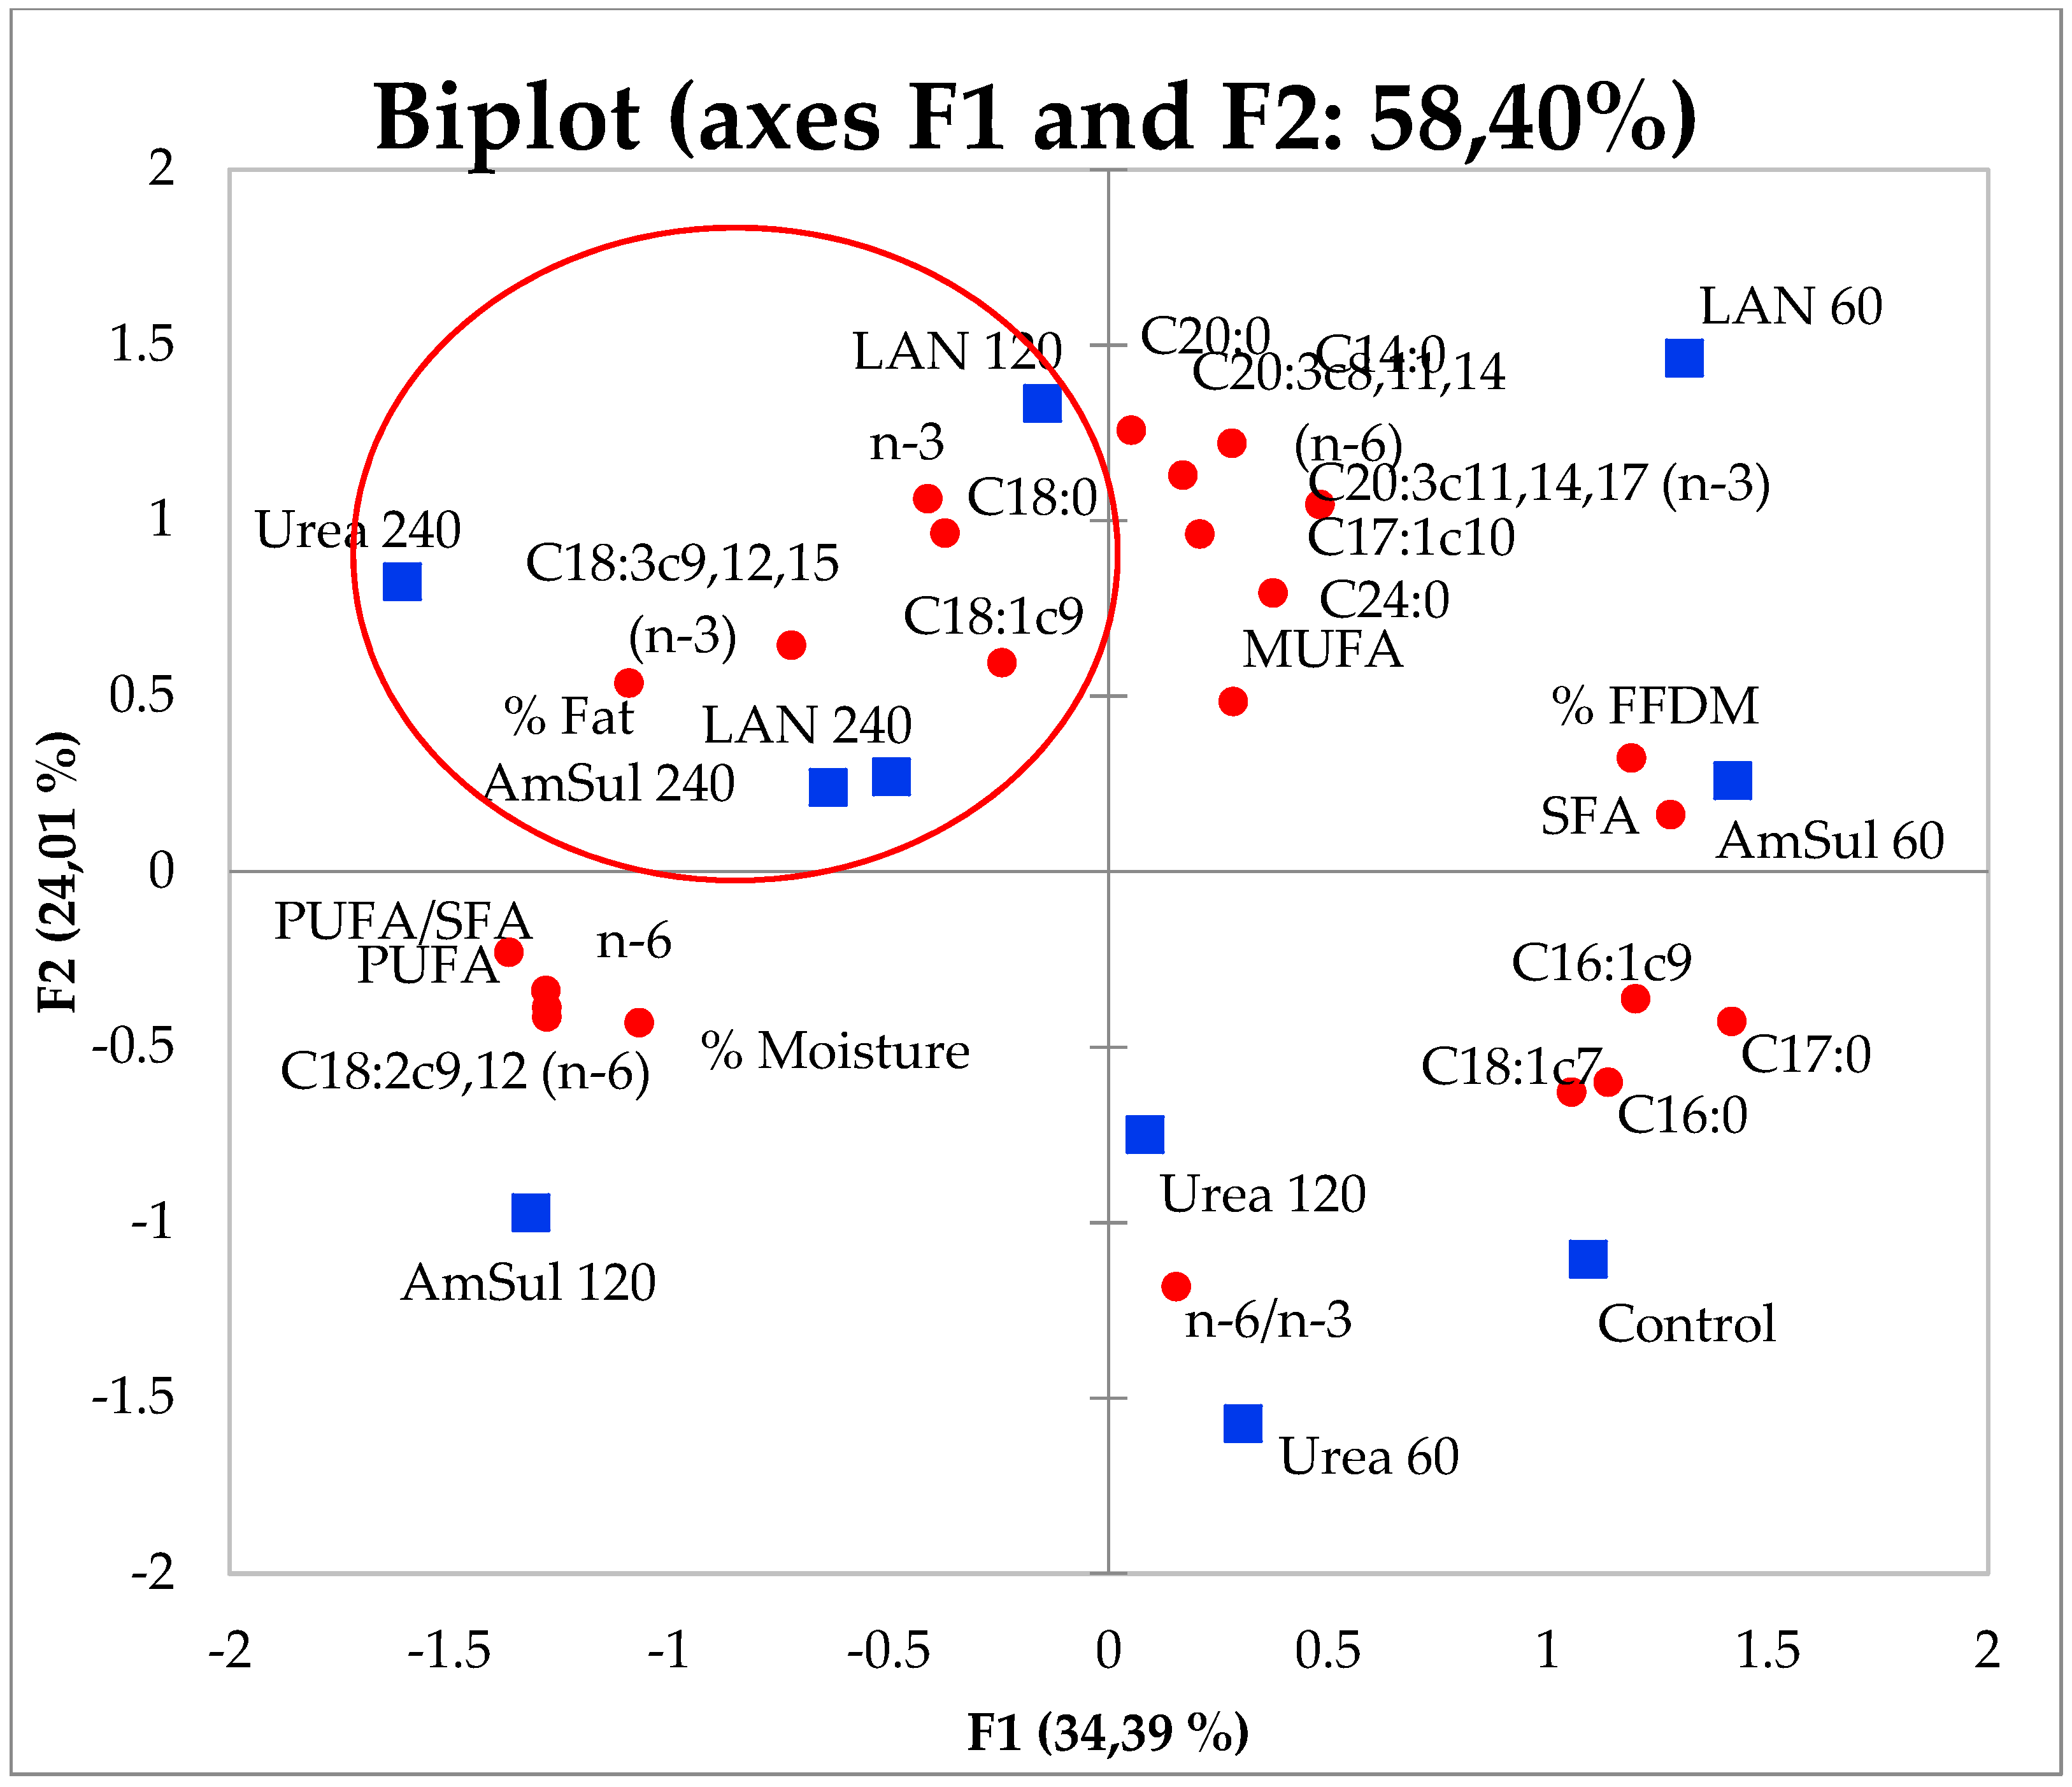
3.4. Principal Component Analysis (PCA)

The PCA for fertilizer source, fertilization level and all measured attributes (Chemical composition: %fat, %FFDM, %moisture. Fatty acids: C14:0, C16:0, C16:1c9, C17:0, C17:1c10, C18:0, C18:1c9, C18:1c7, C18:2c9,12 (n-6), C20:0, C18:3c9,12,15 (n-3), C20:3c8,11,14 (n-6), C20:3c11,14,17 (n-3), C24:0. Fatty acid ratios: SFA, MUFA, PUFA, n-6, n-3, PUFA/SFA, n-6/n-3) of cactus pear seed and cactus pear seed oil is given in Figure 1.
Principal component analysis (PCA) reduces a large number of inconsistencies to a small number of main factors. The variation is therefore explained in terms of factors that are common to all variables and in terms of factors unique to each variable, whereby principal components of the interactions are defined [56]. The interaction is explained in the form of a biplot display where principal component scores are plotted against each other [57]. Through this biplot, the types of N treatments are correlated with specific parameters, such as chemical properties and fatty acid contents. The aim of the PCA is to identify N treatments that yield high oil content and that are characterized by a good fatty acid composition. Those N treatments will therefore show association with those specific attributes on the biplot.
The PCA for fertilizer source, fertilization level and all statistically significantly measured attributes (Chemical composition: %fat, %FFDM, %moisture. Fatty acids: C16:0, C16:1c9, C17:0, C18:0, C18:1c9, C18:1c7, C20:3c8,11,14 (n-6), C24:0) of cactus pear seed and cactus pear seed oil is given in Figure 2.
Factors 1 and 2 of the PCA explained 58.40% of the variation (Figure 1) and Factors 1 and 2 of the PCA explained 72.9% of the variation (Figure 2). From both biplots, it is clear that the fertilizer source and fertilization level are linked in clusters, through shared characteristics. These N treatments are associated because of specific variables (%fat, %FFDM, %moisture, prominent fatty acids), simplifying the selection of N treatments with desired specific quality traits. Figure 1 is indicative of the association of all measured attributes with the fertilizer source and fertilization level, while Figure 2 indicates the association of all statistically significant measured attributes of cactus pear seed oil.
Regarding the oil content, a good number of N treatments showed association with this parameter. These include urea 240, LAN 240, AmSul 120, LAN 120 and urea 120 (indicated in the oval), which obtained among the highest oil contents (Table 2). Other N treatments which were not associated with the oil content parameter were AmSul 60 and LAN 60, indicating that they are low oil content N treatments.
The moisture content was linked to treatments such as urea 240, urea 120, urea 60 and LAN 240. This association was also in agreement with the results shown in Table 2, which shows that these fertiliser sources and fertilizer levels were among those that recorded high moisture contents. Low moisture contents were observed in N treatments that are detached from this cluster including LAN 60 and AmSul 60.
Fertilizer source and fertilizer levels showing a high C18:2c9,12 (Table 2) content were AmSul 120, AmSul 240 and LAN 240, which are grouped in close proximity with C18:2c9,12. This fatty acid was not statistically significant in the results; hence it does not appear in Figure 2 (72.90% variation). Another identified N treatment is urea 240, which recorded the second highest C18:2c9,12 content compared to other treatments as shown in Table 3. Due to the relationship between the C18:2c9,12 and the PUFA and omega-6 ratios, similar N treatments were identified with these ratios as they were also in the same vicinity.
The C18:1c9 is linked with N treatments LAN 240, AmSul 60 and AmSul 240. This fatty acid is the main MUFA and is grouped closely with MUFA on the biplot. This therefore means that both the C18:1c9 and the MUFA will characterize similar N treatments. This fatty acid is located on the opposite side of the C18:2c9,12, justifying the negative correlation observed for these fatty acids against each other (as shown in Table 3).
The C18:0 is associated with LAN 240 and urea 240. Urea 60 is not characterized by this fatty acid since they appear on opposite sides of the biplot. The control and urea 60 are high in C16:0 (Figure 2). PUFA/SFA ratio is best linked to AmSul 120, AmSul 240 and LAN 240, indicating that these cultivars possessed high ratios since these are high in C18:2c9,12 and low in SFA (Figure 1).

4. Conclusions

N fertilisation has an effect on the yield and fatty acid composition of cactus pear seed oil. Oil content significantly increased with increased N fertilization levels. The main fatty acids composition was also significantly influenced by both N source and N level, while the highest content fatty acid, linoleic acid, however, was not significantly influenced. It can therefore be concluded that N fertilization promoted an increased oil and SFA content but was detrimental to the linoleic acid content. A high moisture content did not result in a low oil content in these results. The FFDM is the only factor that decreased in content.
Although N fertilization is mostly aimed to increase the N content in cladodes, the increased seed oil content of the seed is noteworthy. This increased oil yield will benefit and add value to producers of cactus pears in arid and semi-arid conditions.

Author Contributions

Conceptualization, M.d.W. and H.F. and G.C.; methodology, V.N. and A.H.; software, A.H.; validation, A.H. and M.d.W.; formal analysis, V.N. and A.H.; data curation, V.N., M.d.W. and A.H.; writing—original draft preparation, V.N.; writing—review and editing, M.d.W. and A.H.; supervision, M.d.W.; project administration, M.d.W.; funding acquisition, M.d.W. All authors have read and agreed to the published version of the manuscript.

Funding

This research has no funding.

Institutional Review Board Statement

Not applicable.

Informed Consent Statement

Not applicable.

Data Availability Statement

Not applicable.

Conflicts of Interest

The authors declare no conflict of interest.

References

  1. Wessels, A.B. Spine-Less Prickly Pear; Perskor Publishers: Johannesburg, South Africa, 1988; pp. 21–24. [Google Scholar]
  2. Ramakatane, M.E. Root dynamics and water studies on Opuntia ficus-indica and O. robusta. Master′s Thesis, University of the Free State, Bloemfontein, South Africa, 2003. [Google Scholar]
  3. Potgieter, J.P.; Mashope, B.K. Cactus pear (Opuntia spp.) germplasm conservation in South Africa. Acta Hortic. 2009, 811, 47–54. [Google Scholar] [CrossRef]
  4. Feugang, J.M.; Konarski, P.; Zou, D.; Stintzing, F.C.; Zou, C. Nutritional and medicinal use of cactus pear (Opuntia spp.) cladodes and fruits. Front Biosci. 2006, 11, 2574–2589. [Google Scholar] [CrossRef] [PubMed]
  5. Habibi, Y.; Heux, L.; Mahrouz, M.; Vignon, M.R. Morphological and structural study of seed pericarp of Opuntia ficus-indica prickly pear fruits. Carbohydr. Polym. 2008, 72, 102–112. [Google Scholar] [CrossRef]
  6. Ledwaba, C.R.; Mmbi, N.E.; Maphahla, V.V.; Ngwepe, M.R.; Dikgwatlhe, S.B. Comparison of Fruit Quality Characteristics of 24 Cactus Pear Cultivars with Different Pulp Colours at Mara ADC, Limpopo; Limpopo Department of Agriculture: Limpopo, South Africa, 2012.
  7. Ramadan, M.F.; Mörsel, J.T. Oil cactus pear (Opuntia ficus-indica L.). Food Chem. 2003, 82, 339–345. [Google Scholar] [CrossRef]
  8. Ramadan, M.F.; Mörsel, J.T. Lipid profile of prickly pear pulp fractions. JFAE 2003, 1, 66–70. [Google Scholar]
  9. Al-Juhaimi, F.; Özcan, M.M. Determination of some mineral contents of prickly pear (Opuntia ficus-indica L.) seed flours. Environ. Monit. Assess. 2013, 185, 3659–3663. [Google Scholar] [CrossRef]
  10. Du Toit, A.; de Wit, M.; Osthoff, G.; Hugo, A. Antioxidant content and capacity of fruit from different colour cactus pear (O. ficus-indica and O. robusta) cultivars. Acta Hortic. 2015, 1067, 187–192. [Google Scholar] [CrossRef]
  11. Nobel, P.S. Cacti: Biology and Uses, 1st ed.; University of California Press, Ltd.: Berkeley, CA, USA, 2002; pp. 1–291. [Google Scholar]
  12. Cantwell, M. Agricultural ecology, cultivation and uses of cactus pears. Plant Production and Protection Paper 132. In Agro-Ecology, Cultivation and Uses of Cactus Pear; Barbera, G., Inglese, P., Pimiento-Barrios, E., Eds.; FAO: Rome, Italy, 1995; pp. 120–136. [Google Scholar]
  13. Sawaya, W.N.; Khalil, J.K.; Al-Mohammad, M.M. Nutritive value of prickly pear seeds, Opuntia ficus-indica. Plant Foods Hum. Nutr. 1983, 33, 91–97. [Google Scholar] [CrossRef]
  14. Labuschagne, M.T.; Hugo, A. Oil content and fatty acid composition of cactus pear seed compared with cotton and grape seed. J. Food Biochem. 2010, 34, 93–100. [Google Scholar] [CrossRef]
  15. Matthäus, B.; Özcan, M.M. Habitat effects on yield, fatty acid composition and tocopherol contents of prickly pear (Opuntia ficus-indica L.) seed oils. Sci. Hortic. 2011, 131, 95–98. [Google Scholar] [CrossRef]
  16. Sawaya, W.N.; Khan, P. Chemical characterization of prickly pear seed oil, Opuntia ficus-indica. J. Food Sci. 1982, 47, 2060–2061. [Google Scholar] [CrossRef]
  17. Salvo, F.; Galati, E.M.; Lo Curto, S.; Tripodo, M.M. Chemical characterization of Opuntia ficus-indica seed oil. Acta Hortic. 2002, 581, 283–289. [Google Scholar] [CrossRef]
  18. Coşkuner, Y.N.; Tekin, A. Monitoring of seed composition of prickly pear (Opuntia ficus-indica) fruits during maturation period. J. Sci. Food Agric. 2003, 83, 846–849. [Google Scholar] [CrossRef]
  19. Ennouri, M.; Evelyn, B.; Laurence, M.; Hamadi, A. Fatty acid composition and rheological behavior of prickly pear seed oils. Food Chem. 2005, 93, 431–437. [Google Scholar] [CrossRef]
  20. Lee, D. Essential Fatty Acids; Woodlands Publishing Inc.: Pleasant Grove, UT, USA, 1997; pp. 6–32. [Google Scholar]
  21. García Pantaleón, G.D.; Flores Ortiz, M.; Moreno Álvarez, M.; Belén Camacho, D.; Medina Martínez, C.; Ojeda Escalona, C.E.; Padrón Pereira, C.A. Chemical, biochemical, and fatty acids composition of seeds of Opuntia boldinghii Britton et Rose. J. Prof. Assoc. Cactus Dev. 2009, 11, 45–52. [Google Scholar]
  22. Knothe, G.; Dunn, R.O. Dependence of oil stability index of fatty compounds on their structure and concentration and presence of metals. J. Am. Oil Chem. Soc. 2003, 80, 1021–1026. [Google Scholar] [CrossRef]
  23. Pimienta-Barrios, E. El Nopal Tunero; Universidad de Guadalajara: Guadalajara, Mexico, 1990. [Google Scholar]
  24. Inglese, P. Orchard planting and management. Plant Production and Protection Paper 132. In Agro-Ecology, Cultivation and Uses of Cactus Pear; Barbera, G., Inglese, P., Pimienta-Barrios, E., Eds.; FAO: Rome, Italy, 1995; pp. 78–90. [Google Scholar]
  25. Hopkins, W.G.; Hüner, N.P.A. Nitrogen assimilation. In Introduction to Plant Physiology, 4th ed.; Witt, K., Foxman, J., Muriello, L., Eds.; John Wiley & Sons, Inc.: Hoboken, NJ, USA, 2008; pp. 195–211. [Google Scholar]
  26. Nobel, P.S. Nutrient levels in cacti: Relation to nocturnal acid accumulation and growth. Am. J. Bot. 1983, 70, 1244–1253. [Google Scholar] [CrossRef]
  27. Gathaara, G.N.; Felker, P.; Land, M. Influence of nitrogen and phosphorus application on Opuntia engelmanii tissue N and P concentrations, biomass production and fruit yields. J. Arid Environ. 1989, 16, 337–346. [Google Scholar] [CrossRef]
  28. Claassens, A.S.; Wessels, A.B. The fertilizer requirements of cactus pear (Opuntia ficus-indica) under summer rainfall conditions in South Africa. Acta Hortic. 1997, 438, 83–95. [Google Scholar] [CrossRef]
  29. Nerd, A.; Karady, A.; Mizrahi, Y. Irrigation, fertilization, and polyethylene covers influence bud development in prickly pear. Hort. Sci. 1989, 24, 773–775. [Google Scholar]
  30. Nerd, A.; Karady, A.; Mizrahi, Y. Out-of-season prickly pear: Fruit characteristics and effect of fertilization and short drought on productivity. Hort. Sci. 1991, 26, 527–529. [Google Scholar] [CrossRef] [Green Version]
  31. Nerd, A.; Mizrahi, Y. Effect of nitrogen fertilization and organ removal on rebudding in Opuntia ficus-indica (L.) Miller. Scientia Hortic. 1994, 59, 115–122. [Google Scholar] [CrossRef]
  32. Inglese, P.; Barbera, G.; La Mantia, T. Seasonal reproductive and vegetative growth patterns and resource allocation during cactus pear fruit growth. Hort. Sci. 1999, 34, 69–72. [Google Scholar] [CrossRef] [Green Version]
  33. Zegbe, J.A.; Mena-Covarrubias, J. Retraso de la cosecha en nopal tunero cv. Cristalina. Rev. Chapingo Ser. Hortic. 2008, 13, 85–90. [Google Scholar] [CrossRef]
  34. Zegbe, J.A.; Serna-Pérez, A.; Mena-Covarrubias, J. Soil applications of NPK affect fruit quality and shelf-life of ‘Cristalina’ cactus pear. Fruits 2015, 70, 297–302. [Google Scholar] [CrossRef] [Green Version]
  35. Galizzi, F.A.; Felker, P.; González, C.; Gardiner, D. Correlation between soil and cladode nutrient concentrations and fruit yield and quality in cactus pear, Opuntia ficus-indica, in a traditional farm setting in Argentina. J. Arid Environ. 2004, 59, 115–132. [Google Scholar] [CrossRef]
  36. Karim, R.; Felker, P.; Bingam, R.L. Correlations between cactus pear (Opuntia spp.) cladode nutrient concentrations and fruit yield and quality. Ann. Arid Zone 1998, 37, 159–171. [Google Scholar]
  37. FERTASA. Fertilizer Handbook, 7th ed.; FERTASA: Pretoria, South Africa, 2016; pp. 112–127. [Google Scholar]
  38. Grain SA Fertilizer Report 11. Available online: https://www.grainsa.co.za/upload/report_files/Kunsmisverslag-Volledig.pdf (accessed on 21 July 2021).
  39. Potgieter, J.P. Guidelines for the Cultivation of Spine-Less Cactus Pears for Fruit Production, 2nd ed.; Group 7 Trust Printers: Sinoville, South Africa, 1997. [Google Scholar]
  40. Kruger, A.C. Climate of South Africa: Climatic Regions; South African Weather Service: Pretoria, South Africa, 2004; pp. 24–25. [Google Scholar]
  41. Coetzer, G.; Fouche, H. Fruit yield and quality of cactus pear (Opuntia spp.) cultivars in the Central Free State, South Africa. Acta Hortic. 2015, 1067, 89–95. [Google Scholar] [CrossRef]
  42. Soil Classification Working Group. Memoirs on the Agricultural Natural Resources of South Africa No 15. In Soil Classification: A Taxonomic System for South Africa; Department of Agricultural Development: Pretoria, South Africa, 1991; p. 257. [Google Scholar]
  43. De Wit, M.; Hugo, A.; Shongwe, N.; van der Merwe, R. Effect of cultivar, season and locality on lipid content and fatty acid composition of cactus pear seed oil. S. Afr. J. Plant Soil. 2016, 33, 279–288. [Google Scholar] [CrossRef]
  44. Folch, J.; Lees, M.; Sloane-Stanley, G.H. A simple method for the isolation and purification of total lipids from animal tissue. J. Biol. Chem. 1957, 226, 497–509. [Google Scholar] [CrossRef]
  45. Slover, H.T.; Lanza, E. Quantitative analysis of food fatty acids by capillary gas chromatography. J. Am. Oil Chem. Soc. 1979, 56, 933–943. [Google Scholar] [CrossRef]
  46. Diaz, M.T.; Alvarez, I.; De La Fuente, J.; Sanudo, C.; Campo, M.M.; Oliver, M.A.; Font i Furnols, M.; Montossi, F.; San Julian, R.; Nute, G.R.; et al. Fatty acid composition of meat from typical lamb production systems of Spain, United Kingdom, Germany and Uruguay. Meat Sci. 2005, 71, 256–263. [Google Scholar] [CrossRef]
  47. Hur, S.J.; Ye, B.W.; Lee, J.L.; Ha, Y.L.; Park, G.B.; Joo, S.T. Effects of conjugated linoleic acid on color and lipid oxidation of beef patties during cold storage. Meat Sci. 2004, 66, 771–775. [Google Scholar] [CrossRef]
  48. Lin, Y.; Kong, D.; Wang, Z.; Chen, Y.; Yang, Z.; Wu, C.; Yang, H.; Chen, L. Nitrogen application modifies the seed and oil yields and fatty acid composition of Nicotiana tabacum. Hort. Sci. 2020, 55, 1898–1902. Available online: https://journals.ashs.org/hortsci/view/journals/hortsci/55/12/article-p1898.xml (accessed on 20 August 2021). [CrossRef]
  49. Elbadawy, N.; Hegazi, E.; Yehia, T.; Abourayya, M.; Mahmoud, T. Effect of nitrogen fertilizer on yield, fruit quality and oil content in manzanillo olive trees. J. Arid Land Stud. 2016, 26, 175–177. [Google Scholar] [CrossRef]
  50. Zheljazkov, V.D.; Vick, B.A.; Baldwin, B.S.; Buehring, N.; Astatkie, T.; Johnson, B. Oil content and saturated fatty acids in sunflower as a function of planting date, nitrogen, and hybrid. Agron. J. 2009, 101, 1003–1011. [Google Scholar] [CrossRef] [Green Version]
  51. Aminpanah, H. Effect of nitrogen rate on seed yield, protein and oil content of two canola (Brassica napus L.) cultivars. ACAS 2013, 101, 183–190. [Google Scholar]
  52. De Wit, M.; Hugo, A.; Shongwe, N. South African cactus pear seed oil: A comprehensive study on 42 spineless burbank Opuntia ficus-indica and Opuntia robusta cultivars. Eur. J. Lipid Sci. Technol. 2018, 120, 1700343. [Google Scholar] [CrossRef]
  53. Siri-Tarino, P.W.; Sun, Q.; Hu, F.B.; Krauss, R.M. Saturated fatty acids and risk of coronary heart disease: Modulation by replacement nutrients. Curr. Atheroscler. Rep. 2010, 12, 384–390. [Google Scholar] [CrossRef] [Green Version]
  54. De Wit, M.; Motsamai, V.K.; Hugo, A. Cold-pressed cactus pear seed oil: Quality and stability. Grasa. Aceite. 2021, 72, e415. [Google Scholar] [CrossRef]
  55. Kheir, N.F.; Harb, E.Z.; Moursi, H.A.; El-Gayar, S.H. Effect of salinity and fertilization on flax plants (Linum usitatissimum L.). II. chemical composition. Bull. Fac. Agric. 1991, 42, 57–70. [Google Scholar]
  56. Crossa, J. Statistical analyses of multi-locational trials. Adv. Agron. 1990, 44, 55–85. [Google Scholar] [CrossRef]
  57. Tsige, G.K. Genetic Diversity Analysis and Genotype X Environment Interaction in Ethopia Mustard. Ph.D. Thesis, University of the Free State, Bloemfontein, South Africa, 2002. [Google Scholar]
Figure 1. PCA Biplot of fertilizer source (blue squares), fertilization level (blue squares) and all measured attributes (red bullets) (Chemical composition, Fatty acids and Fatty acid ratios) of cactus pear seed and cactus pear seed oil.
Sustainability 13 10123 g001
Figure 2. PCA Biplot of fertilizer source (blue squares), fertilization level (blue squares) and all statistically significantly measured attributes (red dots) (Chemical composition and Fatty acids) of cactus pear seed and cactus pear seed oil.
Sustainability 13 10123 g002
Table 1. A summary of physical and chemical characteristics of the topsoil.
Property *
Clay (%)27
pH (KCl)7.1
Nutrients (mg kg−1)
P (NaHCO3)7.8
Ca (NH4OAc)4126
Mg (NH4OAc)727.0
K (NH4OAc)164.1
Na (NH4OAc)81.2
* Determined with standard procedures.
Table 2. The effect of nitrogen (N) source (LAN, AmSul and Urea) and level (0, 60, 120 and 240 kg ha−1) on the chemical properties of cactus pear seed of ‘Morado’ (g/100 g).
TreatmentControl (0)LAN 60LAN 120LAN 240Urea 60Urea 120Urea 240AmSul 60AmSul 120AmSul 240Sign. Level
% Fat8.15 a ± 0.608.64 ab ± 0.448.73 ab ± 0.618.89 ab ± 0.888.38 ab ± 0.758.65 ab ± 0.829.54 b ± 0.847.96 a ± 0.678.75 ab ± 0.888.21 ab ± 1.05p = 0.035
% FFDM89.23 b ± 2.3690.58 b ± 2.6788.30 ab ± 1.6388.07 ab ± 1.7188.35 ab ± 2.3186.91 ab ± 0.6885.79 a ± 1.2791.12 b ± 0.7788.55 ab ± 1.2688.85 ab ± 3.18p = 0.003
% Moisture2.69 ab ± 1.950.78 a ± 0.462.97 ab ± 1.673.03 ab ± 1.623.27 ab ± 1.824.44 b ± 0.414.67 b ± 1.380.92 a ± 0.312.70 ab ± 1.962.94 ab ± 2.19p = 0.002
a, b, ab Means with different superscripts in the same row differ significantly. LAN = Limestone ammonium nitrate, AmSul = Ammonium sulfate, FFDM = Fat free dry matter.
Table 3. The effect of fertilizer source (LAN, AmSul and Urea) and N fertilization level (0, 60, 120 and 240 kg ha−1) on the fatty acid profile of cactus pear seed oil (% of total fatty acids).
TreatmentControlLAN 60LAN 120LAN 240Urea 60Urea 120Urea 240AmSul 60AmSul 120AmSul 240Sign. Level
C14:00.07 ab ± 0.020.09 b ± 0.020.08 ab ± 0.020.06 ab ± 0.020.06 a ± 0.020.07 ab ± 0.010.08 ab ± 0.020.08 ab ± 0.020.06 ab ± 0.020.09 ab ± 0.01p = 0.044
C16:013.95 b ± 0.1713.82 ab ± 0.0713.78 ab ± 0.1013.71 a ± 0.0713.85 ab ± 0.1613.83 ab ± 0.0613.71 a ± 0.0913.79 ab ± 0.1913.71 a ± 0.0813.70 a ± 0.12p = 0.002
C16:1c90.68 b ± 0.020.66 ab ± 0.020.65 a ± 0.010.64 a ± 0.020.65 a ± 0.010.65 a ± 0.010.64 a ± 0.010.66 ab ± 0.010.64 a ± 0.010.64 a ± 0.01p < 0.001
C17:00.17 c ± 0.010.16 bc ± 0.010.14 ab ± 0.010.14 ab ± 0.020.16 bc ± 0.010.15 abc ± 0.020.13 a ± 0.010.16 bc ± 0.010.13 ab ± 0.010.14 abc ± 0.01p < 0.001
C17:1c100.05 ± 0.010.05 ± 0.010.05 ± 0.010.04 ± 0.010.04 ± 0.010.04 ± 0.010.05 ± 0.010.04 ± 0.010.04 ± 0.010.05 ± 0.01p = 0.271
C18:03.05 a ± 0.053.17 b ± 0.103.18 b ± 0.033.21 b ± 0.073.12 ab ± 0.043.19 b ± 0.083.21 b ± 0.013.20 b ± 0.073.13 ab ± 0.063.15 ab ± 0.02p < 0.001
C18:1c912.88 a ± 0.0913.19 b ± 0.1213.16 ab ± 0.1113.23 b ± 0.0913.15 ab ± 0.2413.20 b ± 0.2813.17 ab ± 0.1613.31 b ± 0.0513.16 ab ± 0.3613.25 b ± 0.25p < 0.001
C18:1c76.11 c ± 0.056.06 abc ± 0.036.03 ab ± 0.066.01 ab ± 0.056.07 bc ± 0.046.02 ab ± 0.045.98 a ± 0.036.06 abc ± 0.036.05 abc ± 0.036.05 abc ± 0.05p ≤ 0.001
C18:2c9,12 (n-6)61.96 ± 0.1561.79 ± 0.3261.91 ± 0.2261.93 ± 0.1861.91 ± 0.1961.86 ± 0.3662.06 ± 0.1861.72 ± 0.1562.09 ± 0.3661.94 ± 0.25p = 0.396
C20:00.22 ± 0.010.23 ± 0.010.23 ± 0.010.23 ± 0.010.22 ± 0.010.22 ± 0.010.22 ± 0.010.22 ± 0.010.22 ± 0.010.22 ± 0.01p = 0.121
C18:3c9,12,15 (n-3)0.39 ± 0.010.39 ± 0.010.40 ± 0.010.39 ± 0.010.39 ± 0.010.39 ± 0.010.40 ± 0.010.39 ± 0.010.40 ± 0.010.40 ± 0.01p = 0.650
C20:3c8,11,14 (n-6)0.13 ab ± 0.010.13 ab ± 0.010.13 ab ± 0.010.13 b ± 0.010.12 a ± 0.010.12 ab ± 0.010.13 ab ± 0.010.13 ab ± 0.010.13 ab ± 0.010.13 ab ± 0.01p = 0.024
C20:3c11,14,17 (n-3)0.15 ± 0.010.16 ± 0.010.16 ± 0.010.15 ± 0.010.15 ± 0.010.15 ± 0.010.16 ± 0.010.15 ± 0.010.15 ± 0.010.15 ± 0.01p = 0.206
C24:00.10 ± 0.010.10 ± 0.010.10 ± 0.010.10 ± 0.010.10 ± 0.010.10 ± 0.010.10 ± 0.010.10 ± 0.010.10 ± 0.010.10 ± 0.01p = 0.105
a, b, c Means with different superscripts in the same row differ significantly.
Table 4. The effect of fertilizer source (LAN, AmSul and Urea) and fertilization level (0, 60, 120 and 240 kg ha−1) on the fatty acid ratios of cactus pear seed oil (% of total fatty acids within the specific ratio).
TreatmentControlLAN 60LAN 120LAN 240Urea 60Urea 120Urea 240AmSul 60AmSul 120AmSul 240Sign. Level
SFA17.56 ± 0.1917.57 ± 0.1917.51 ± 0.1317.45 ± 0.1117.51 ± 0.1617.56 ± 0.1217.45 ± 0.0917.55 ± 0.1817.35 ± 0.0517.40 ± 0.11p = 0.232
MUFA19.72 ± 0.1219.96 ± 0.1419.89 ± 0.1619.92 ± 0.0619.91 ± 0.2719.91 ± 0.2719.84 ± 0.1820.07 ± 0.0319.89 ± 0.3519.99 ± 0.26p = 0.103
PUFA62.63 ± 0.1562.47 ± 0.3162.60 ± 0.2162.60 ± 0.1862.57 ± 0.2062.52 ± 0.3662.75 ± 0.1962.39 ± 0.1662.77 ± 0.3762.62 ± 0.26p = 0.393
n-662.09 ± 0.1561.92 ± 0.3162.04 ± 0.2262.06 ± 0.1862.03 ± 0.2061.98 ± 0.3662.19 ± 0.1961.85 ± 0.1562.22 ± 0.3762.07 ± 0.25p = 0.403
n-30.54 ± 0.010.55 ± 0.010.56 ± 0.020.54 ± 0.010.54 ± 0.010.54 ± 0.010.56 ± 0.010.54 ± 0.010.55 ± 0.010.55 ± 0.02p = 0.559
PUFA/SFA3.57 ± 0.043.56 ± 0.063.58 ± 0.033.59 ± 0.033.57 ± 0.033.56 ± 0.043.60 ± 0.023.55 ± 0.053.62 ± 0.033.60 ± 0.03p = 0.242
n-6/n-3114.98 ± 2.23112.58 ± 3.13110.79 ± 3.30114.93 ± 2.10114.87 ± 1.77114.78 ± 2.89111.05 ± 1.55114.54 ± 1.75113.13 ± 2.03112.85 ± 2.92p = 0.616
SFA = Saturated fatty acids, MUFA = Monounsaturated fatty acids, PUFA = Polyunsaturated fatty acids.
Publisher’s Note: MDPI stays neutral with regard to jurisdictional claims in published maps and institutional affiliations.

