
Measuring the Supply of Ecosystem Services from Alternative Soil and Nutrient Management Practices: A Transdisciplinary, Field-Scale Approach

 , , , , and
Abstract
:1. Introduction
2. Materials and Methods
2.1. Overview of Methodological Approach
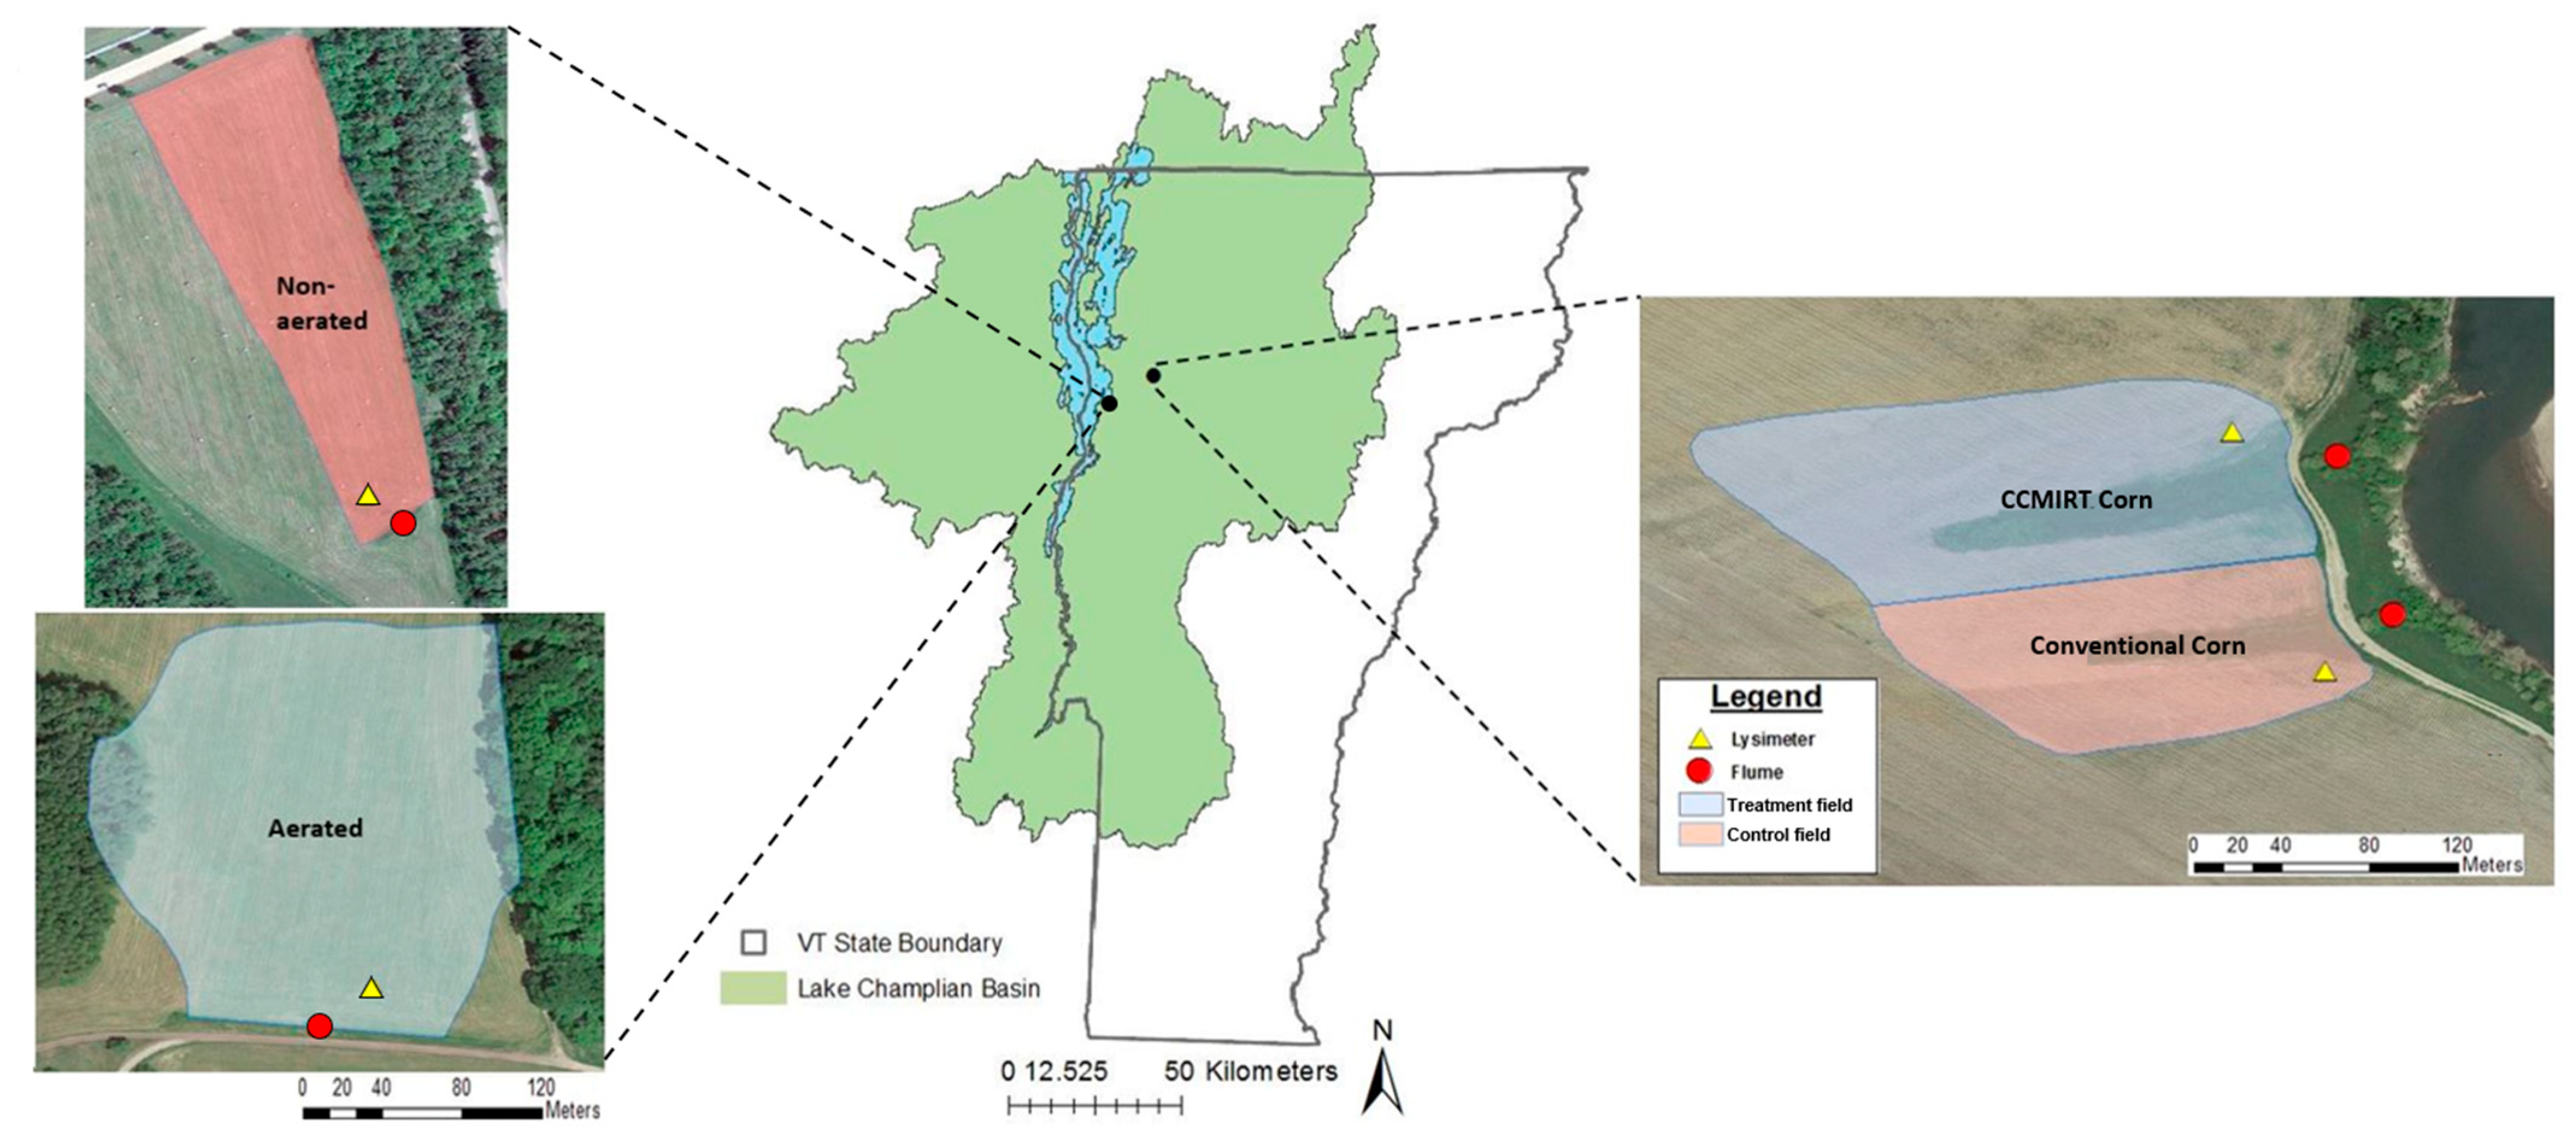
2.2. Study Area—Field-Scale Paired Watersheds
2.3. Edge-of-Field Surface and Subsurface Water Quality Monitoring
2.4. Soil Health Measurements
2.5. Greenhouse Gas Emissions Monitoring
2.6. Economic Data Collection and Analysis
2.7. Yield, Forage and Manure Measurement
2.8. Measuring the Supply of Ecosystem Services
2.8.1. Food Production
2.8.2. Clean Water
2.8.3. Climate Stabilization
2.8.4. Flood Risk Mitigation
2.8.5. Farm Resilience to Extreme Weather
2.8.6. Soil Health
2.9. Transdisciplinary Integration of Farmers’ Knowledge
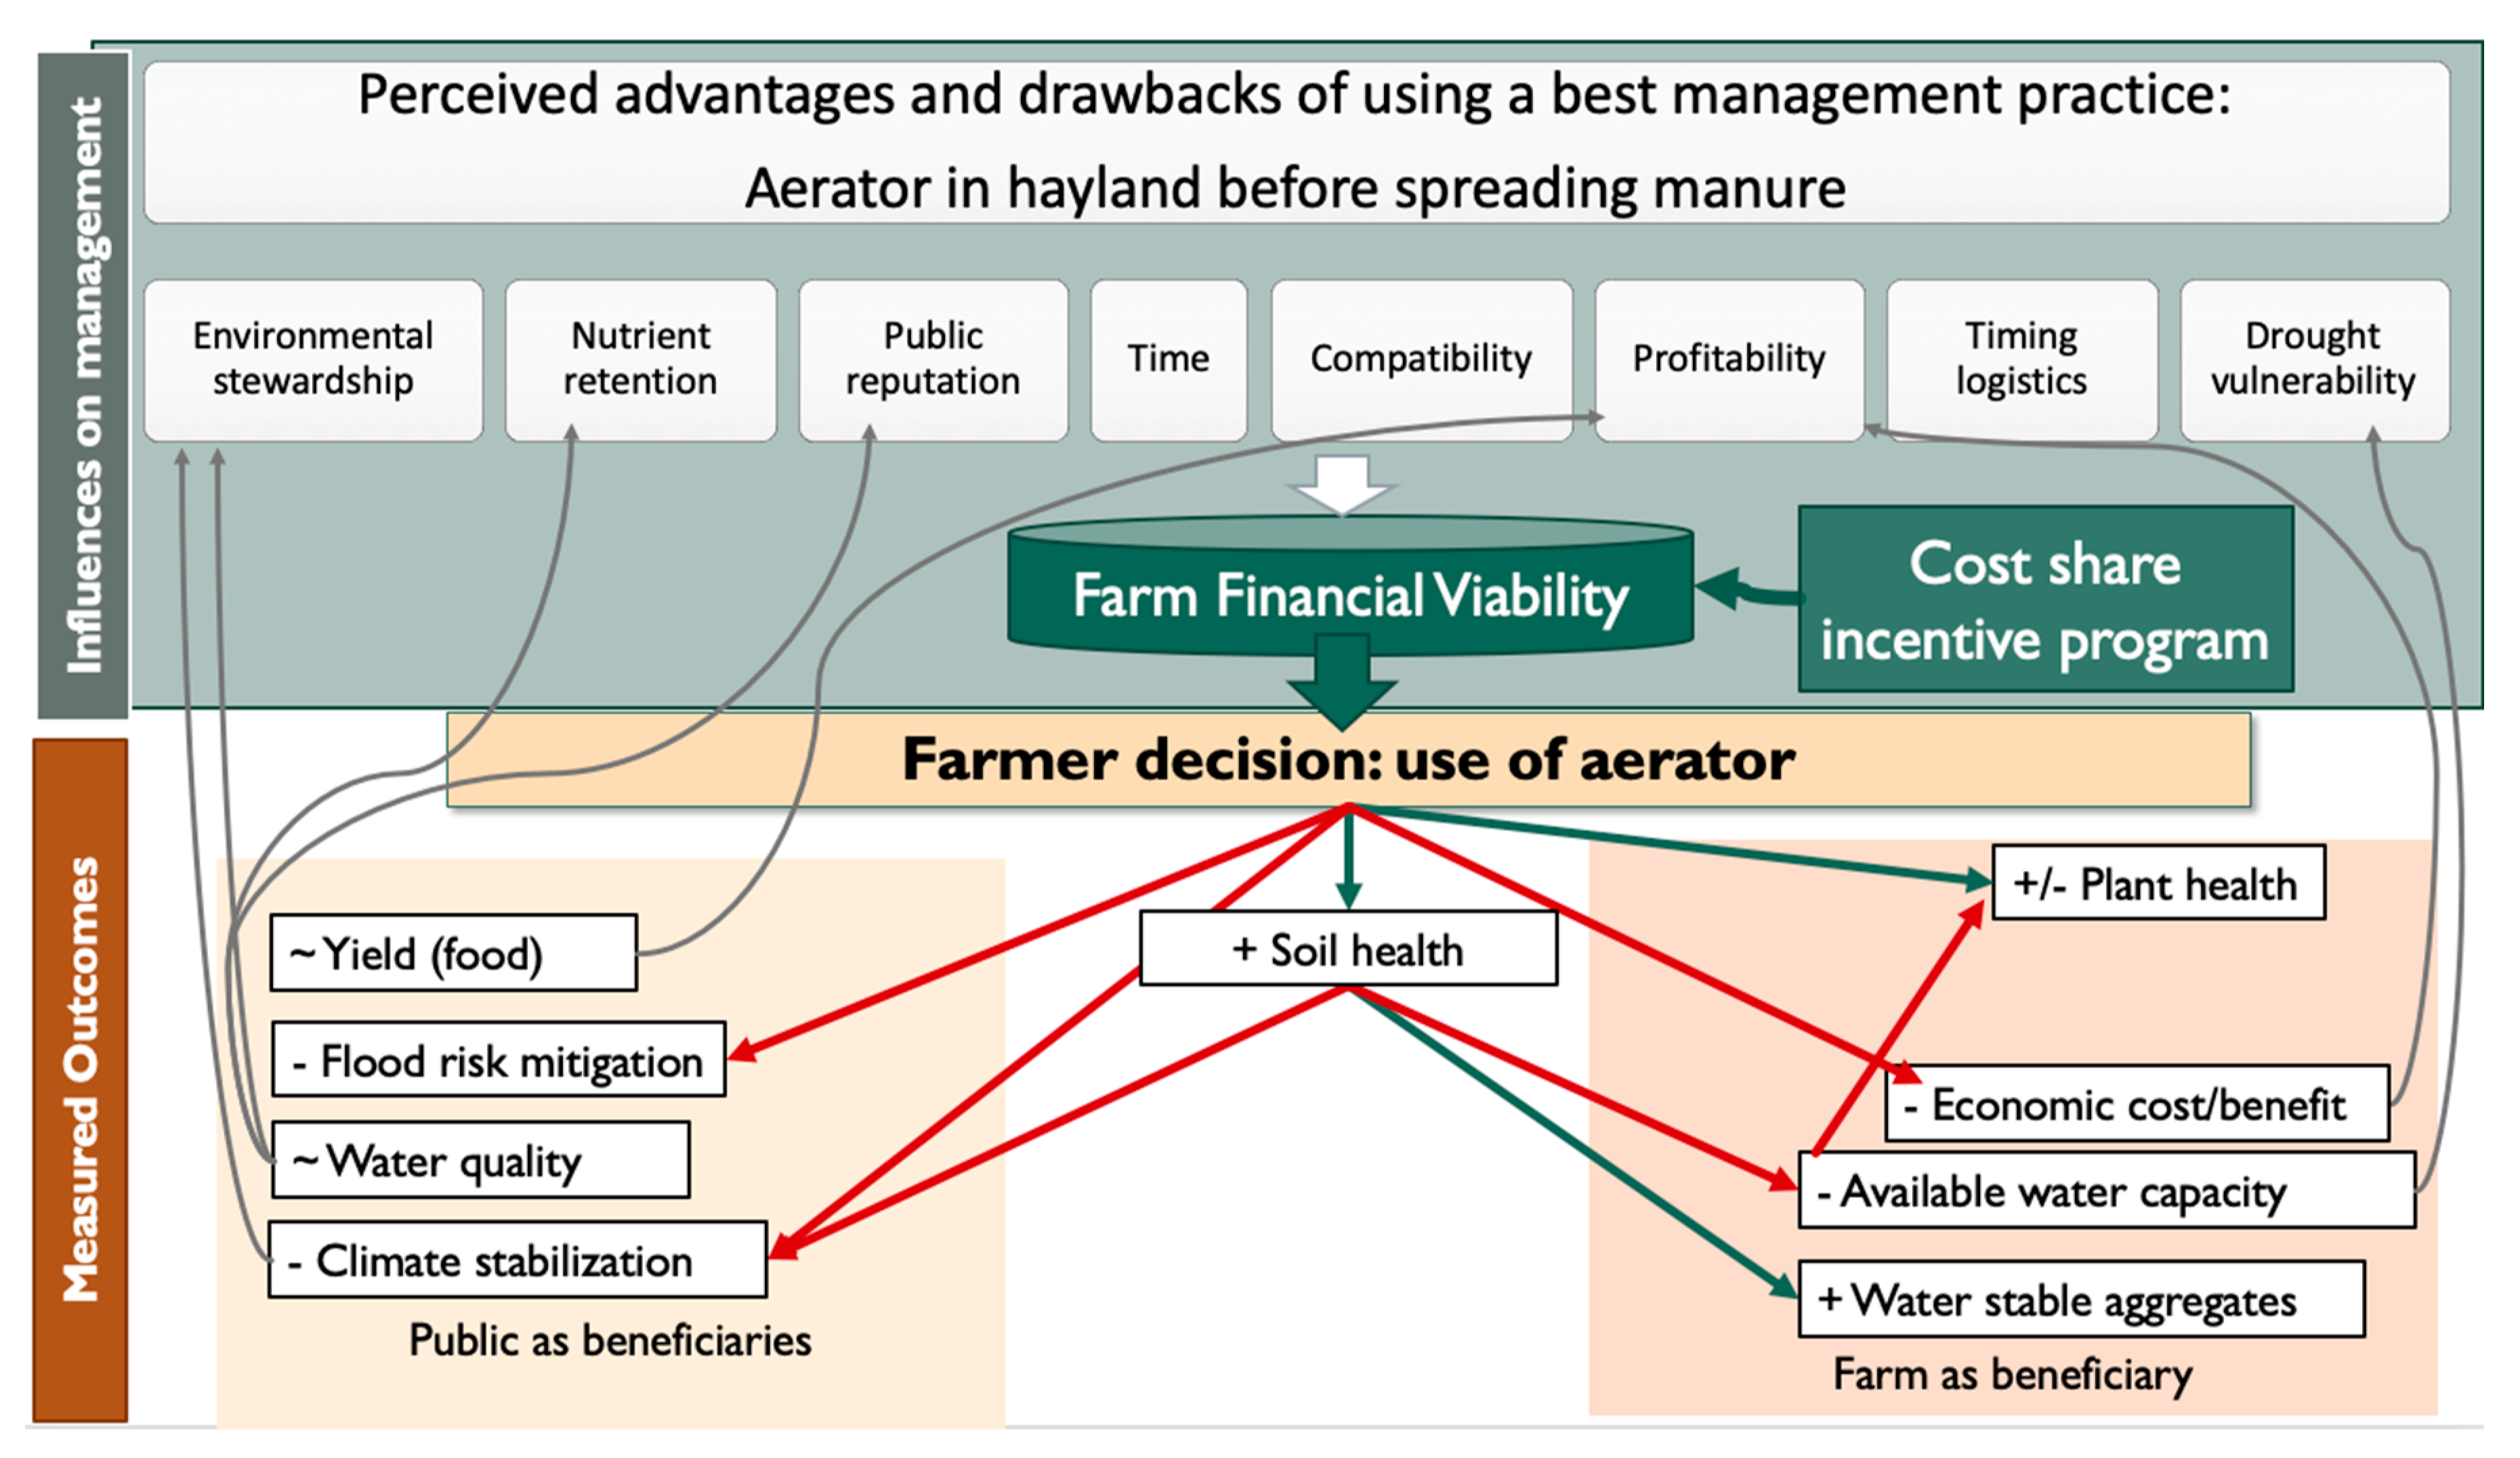
2.10. Causal Loop Diagrams
3. Results
3.1. Summary of Ecosystem Services Provisioning for Each Practice
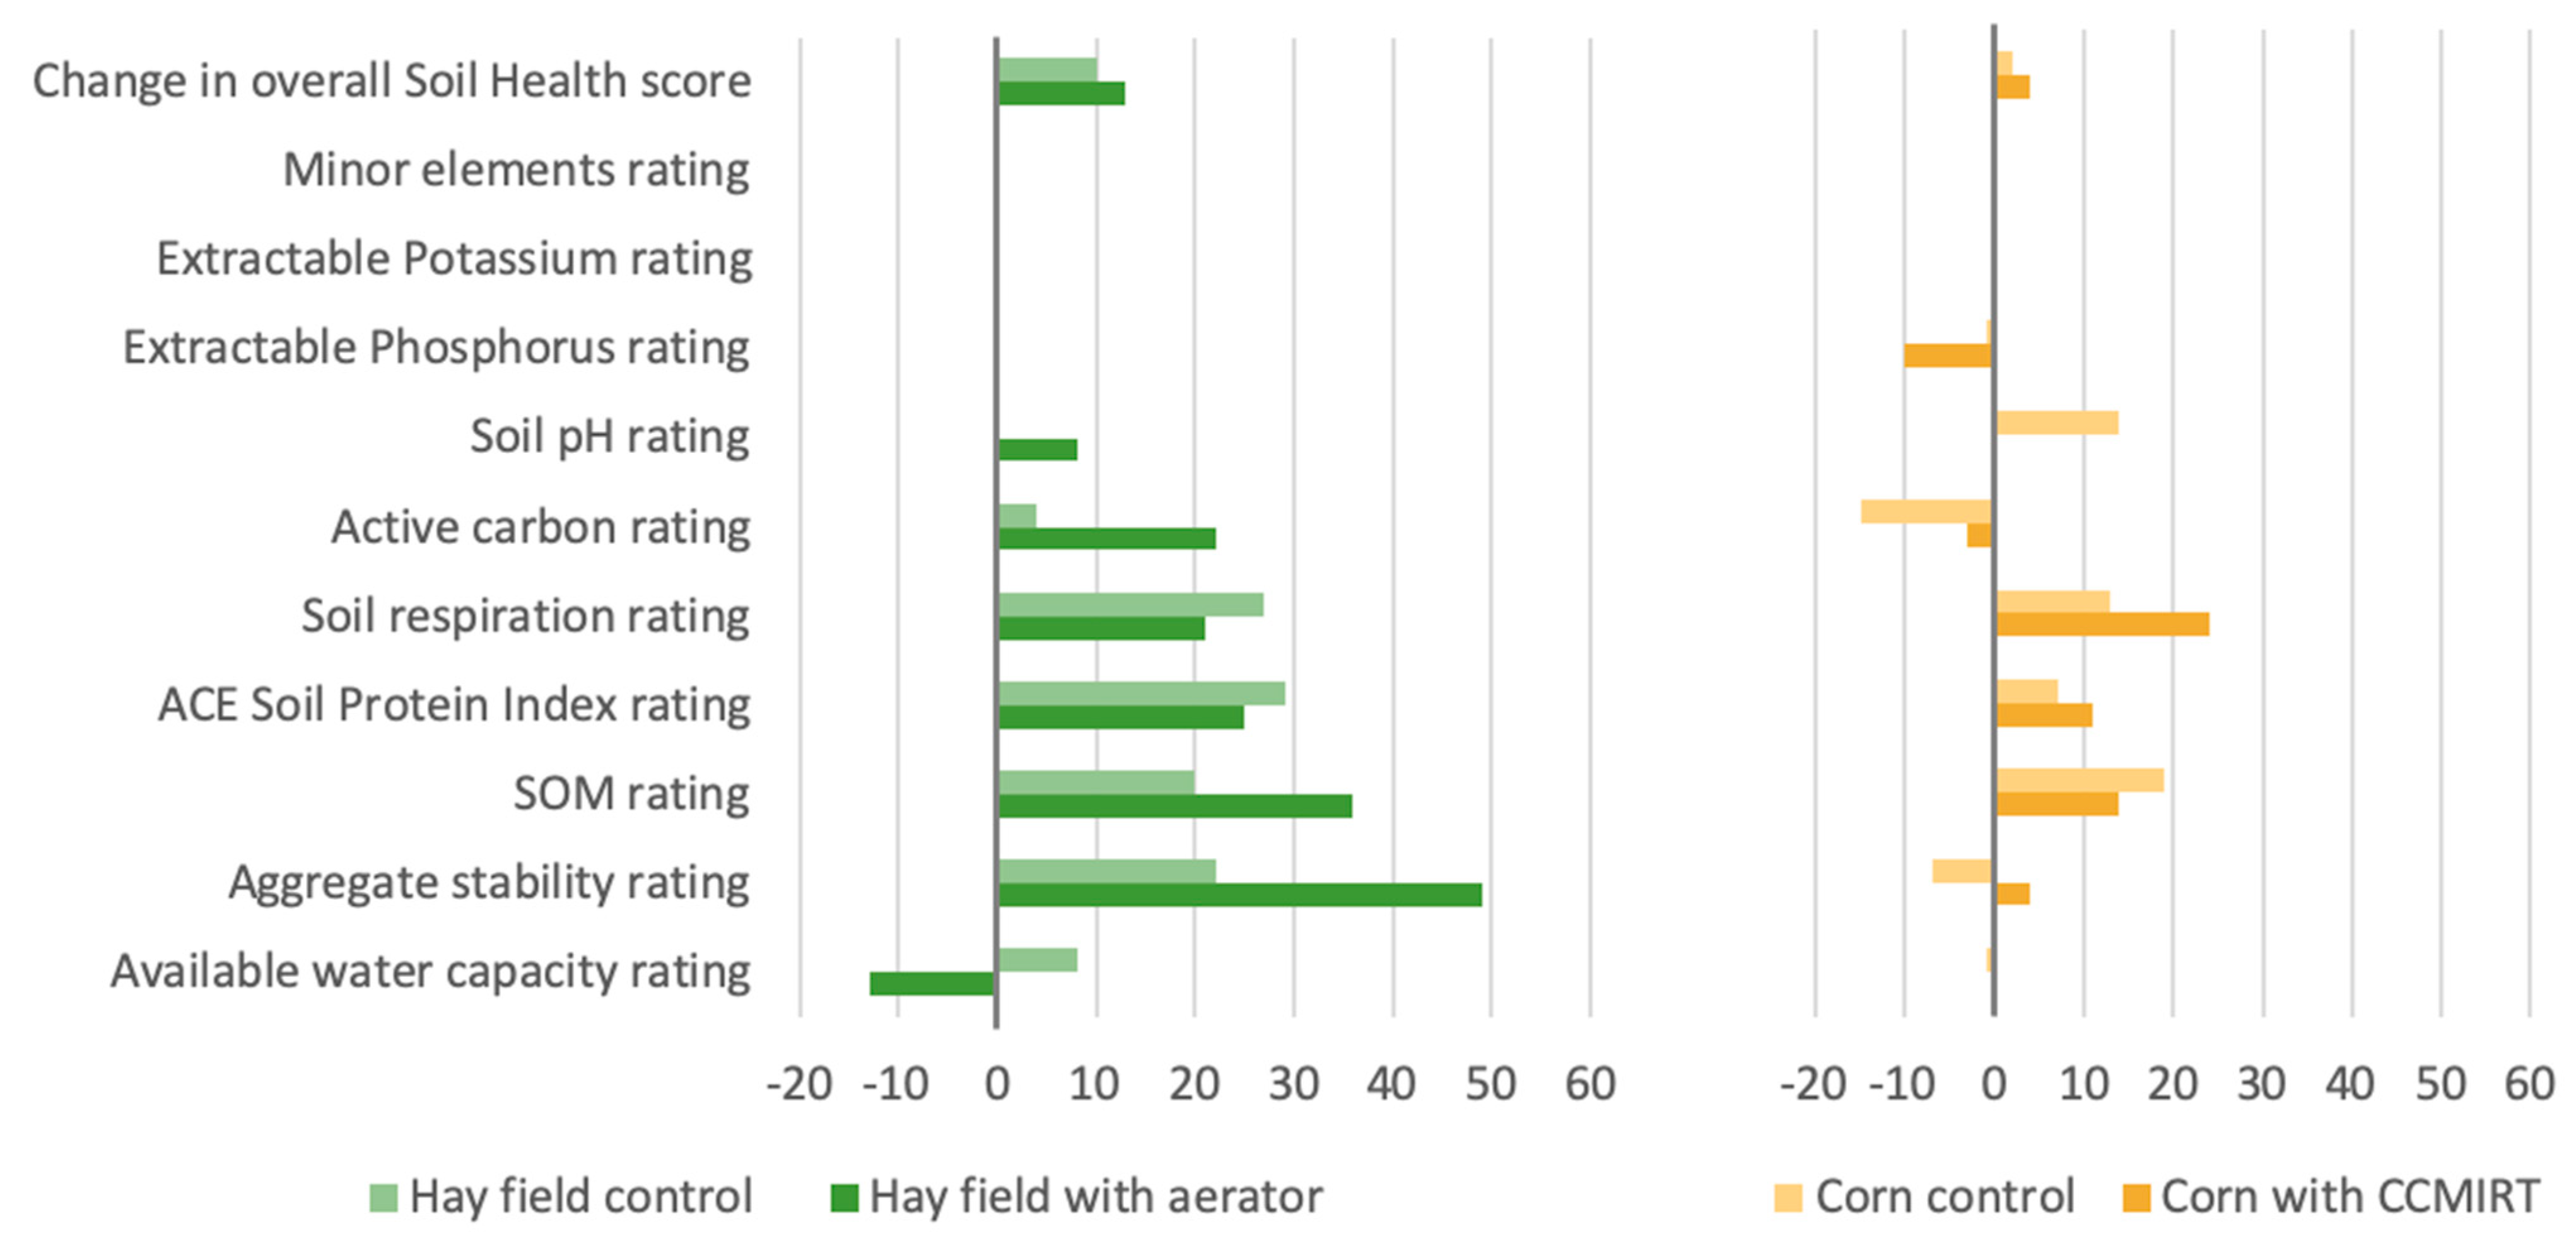
3.2. Soil Health
3.3. Farm Resilience to Extreme Precipitation
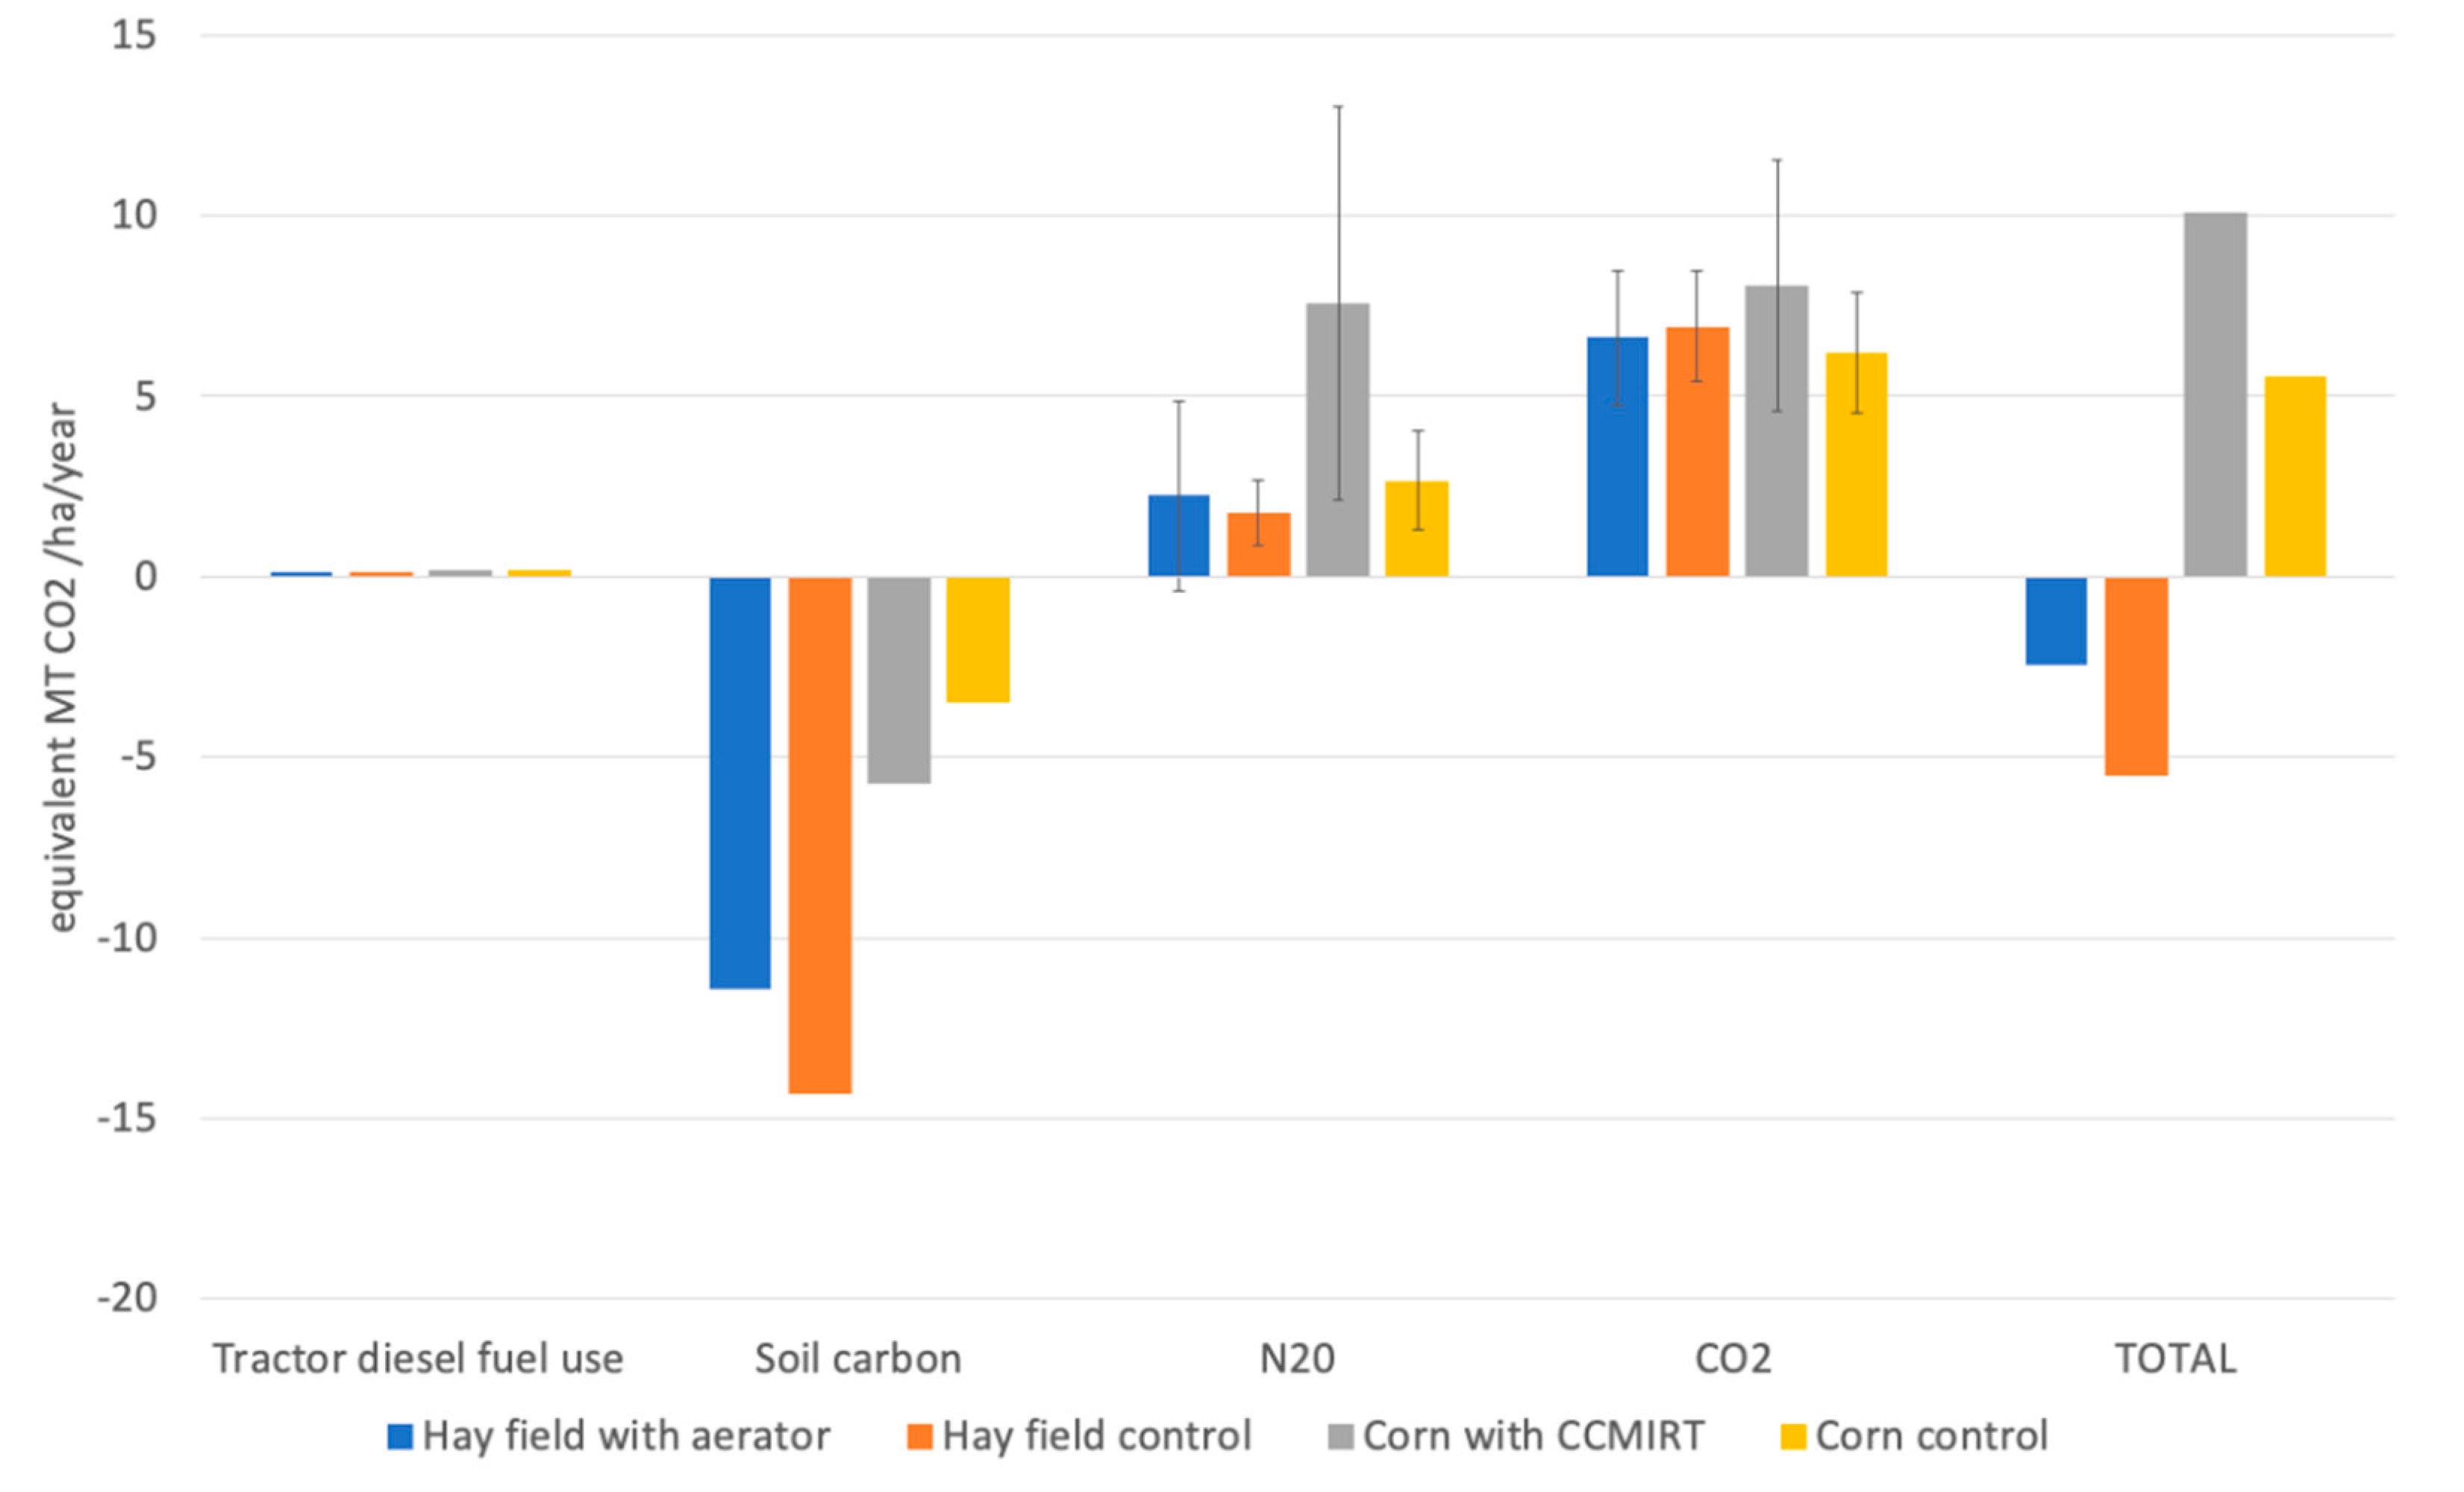
3.4. Climate Stabilization
3.5. Clean Water
3.6. Flood Risk Mitigation
3.7. Food Provisioning
3.8. Economic Cost–Benefit Analysis
3.9. Farmers’ Perspectives
3.9.1. Influences on Decision Making
3.9.2. Farm Considerations
3.9.3. Stewardship and Landscape Multifunctionality
3.9.4. External Pressures: Financial Climate and Drought
3.9.5. Adaptive Management
3.9.6. Invisible Pathways
3.9.7. Participatory Analysis
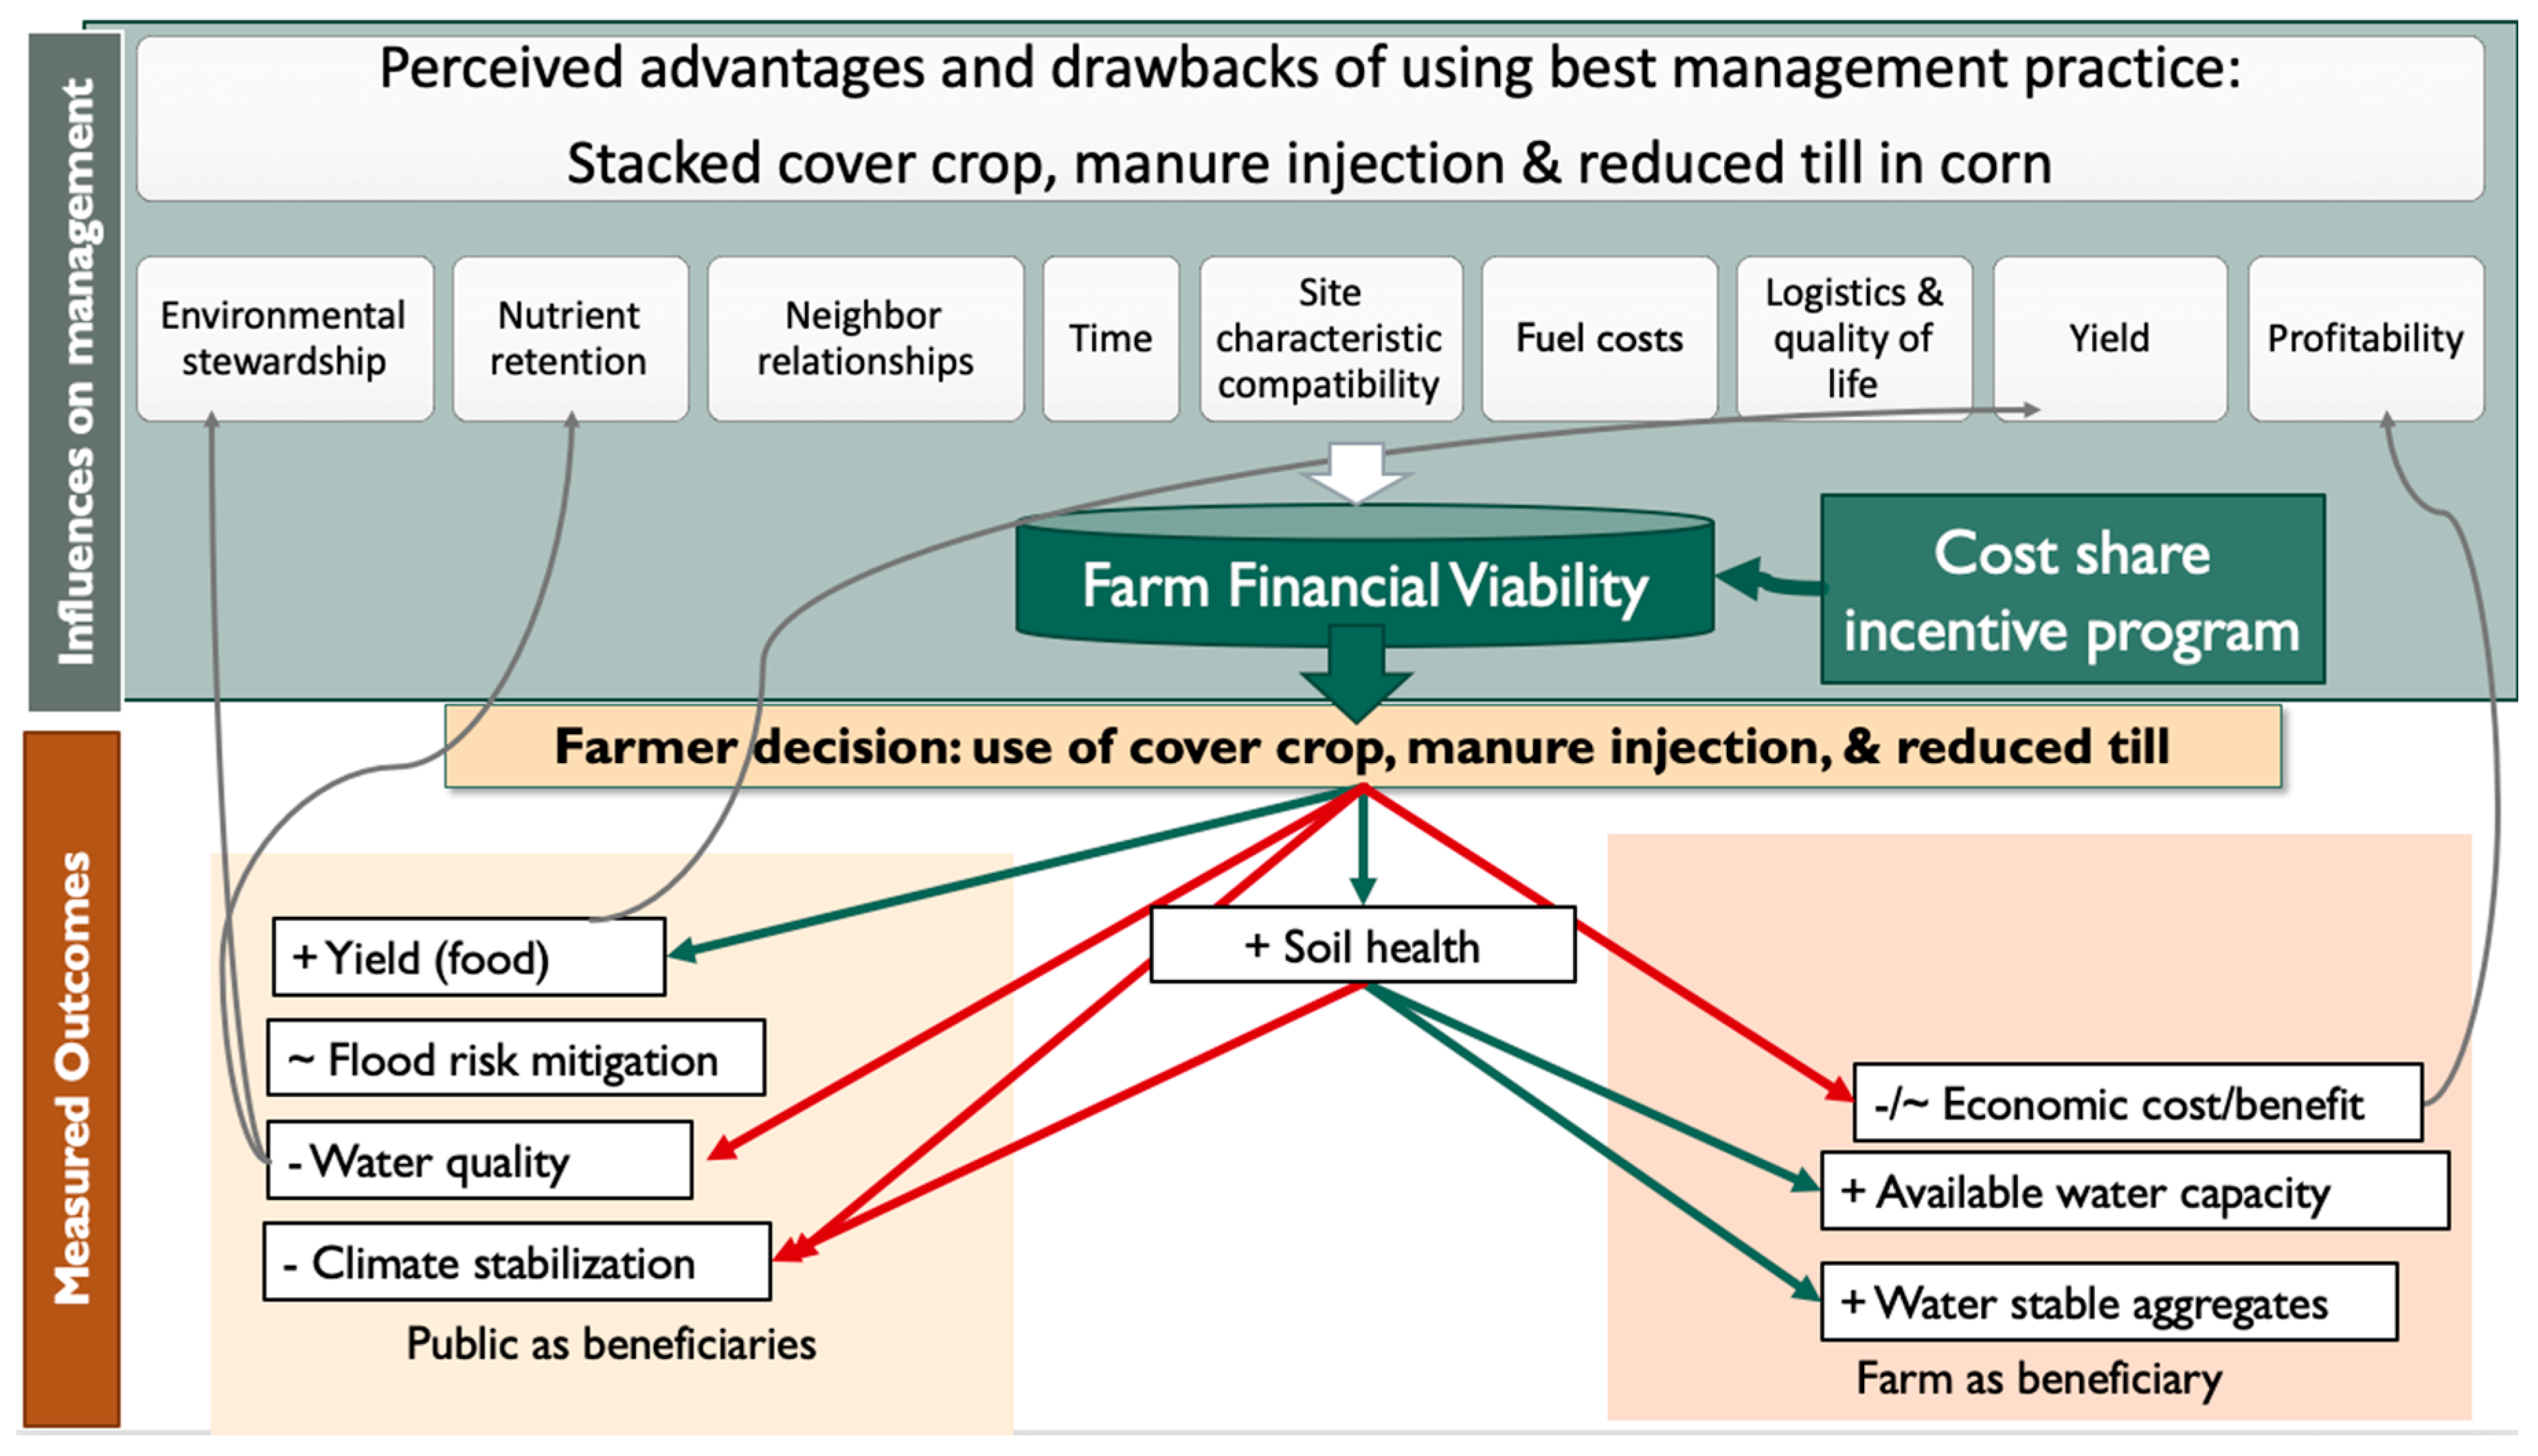
3.10. Causal Loop Diagrams
4. Discussion
4.1. Main Findings
4.2. Biophysical Outcomes
4.3. Social and Economic Elements
4.4. Integrative Elements
4.5. Limitations
4.6. Future Research and Implications
5. Conclusions
Supplementary Materials
Author Contributions
Funding
Institutional Review Board Statement
Informed Consent Statement
Data Availability Statement
Acknowledgments
Conflicts of Interest
References
- Foley, J.A.; Ramankutty, N.; Brauman, K.A.; Cassidy, E.S.; Gerber, J.S.; Johnston, M.; Mueller, N.D.; O’Connell, C.; Ray, D.K.; West, P.C.; et al. Solutions for a cultivated planet. Nature 2011, 478, 337–342. [Google Scholar] [CrossRef] [Green Version]
- Power, A.G. Ecosystem services and agriculture: Tradeoffs and synergies. Philos. Trans. R. Soc. B Biol. Sci. 2010, 365, 2959–2971. [Google Scholar] [CrossRef] [PubMed]
- Zhang, W.; Ricketts, T.H.; Kremen, C.; Carney, K.; Swinton, S.M. Ecosystem services and dis-services to agriculture. Ecol. Econ. 2007, 64, 253–260. [Google Scholar] [CrossRef] [Green Version]
- Millennium Ecosystem Assessment, M. Ecosystems and Human Well-being: Synthesis; Island Press: Washington, DC, USA, 2005; ISBN 1597260401. [Google Scholar]
- Bennett, E.M.; Peterson, G.D.; Gordon, L.J. Understanding relationships among multiple ecosystem services. Ecol. Lett. 2009, 12, 1394–1404. [Google Scholar] [CrossRef] [PubMed]
- Cord, A.F.; Bartkowski, B.; Beckmann, M.; Dittrich, A.; Hermans-Neumann, K.; Kaim, A.; Lienhoop, N.; Locher-Krause, K.; Priess, J.; Schröter-Schlaack, C.; et al. Towards systematic analyses of ecosystem service trade-offs and synergies: Main concepts, methods and the road ahead. Ecosyst. Serv. 2017, 28, 264–272. [Google Scholar] [CrossRef]
- Kremen, C.; Iles, A.; Bacon, C. Diversified Farming Systems: An Agroecological, Systems-based. Ecol. Soc. 2012, 17, 44. [Google Scholar] [CrossRef]
- Palm, C.; Blanco-Canqui, H.; DeClerck, F.; Gatere, L.; Grace, P. Conservation agriculture and ecosystem services: An overview. Agric. Ecosyst. Environ. 2014, 187, 87–105. [Google Scholar] [CrossRef] [Green Version]
- Pretty, J.; Guijt, I.; Scoones, I.; Thompson, J. Regenerating Agriculture: The agroecology of low-external input and community-based development. In Policies for a Small Planet; Routledge: Oxfordshire, UK, 2019; pp. 91–123. [Google Scholar]
- Minasny, B.; Malone, B.P.; McBratney, A.B.; Angers, D.A.; Arrouays, D.; Chambers, A.; Chaplot, V.; Chen, Z.S.; Cheng, K.; Das, B.S.; et al. Soil carbon 4 per mille. Geoderma 2017, 292, 59–86. [Google Scholar] [CrossRef]
- FAO. Agroecological and Other Innovative Approaches for Sustainable Agriculture and Food Systems that Enhance Food Security and Nutrition; High Level Panel of Experts on Food Security and Nutrition: Rome, Italy, 2019; pp. 1–162. [Google Scholar]
- Ontl, T.A.; Schulte, L.A. Soil Carbon Storage. Nat. Educ. Knowl. 2012, 3, 35. [Google Scholar]
- Soil Health and Climate Change; Soil Biology; Singh, B.P.; Cowie, A.L.; Chan, K.Y. (Eds.) Soil Biology; Springer Berlin Heidelberg: Berlin/Heidelberg, Germany, 2011; Volume 29, ISBN 978-3-642-20255-1. [Google Scholar]
- Lal, R. Beyond COP21: Potential and challenges of the “4 per Thousand” initiative. J. Soil Water Conserv. 2016, 71, 20A–25A. [Google Scholar] [CrossRef]
- Duncan, E.W.; Osmond, D.L.; Shober, A.L.; Starr, L.; Tomlinson, P.; Kovar, J.L.; Moorman, T.B.; Peterson, H.M.; Fiorellino, N.M.; Reid, K. Phosphorus and Soil Health Management Practices. Agric. Environ. Lett. 2019, 4, 190014. [Google Scholar] [CrossRef] [Green Version]
- Dodd, R.J.; Sharpley, A.N. Conservation practice effectiveness and adoption: Unintended consequences and implications for sustainable phosphorus management. Nutr. Cycl. Agroecosystems 2016, 104, 373–392. [Google Scholar] [CrossRef]
- Jarvie, H.P.; Johnson, L.T.; Sharpley, A.N.; Smith, D.R.; Baker, D.B.; Bruulsema, T.W.; Confesor, R. Increased Soluble Phosphorus Loads to Lake Erie: Unintended Consequences of Conservation Practices? J. Environ. Qual. 2017, 46, 123–132. [Google Scholar] [CrossRef] [PubMed] [Green Version]
- Macdonald, G.K.; Jarvie, H.P.; Withers, P.J.A.; Doody, D.G.; Keeler, B.L.; Haygarth, P.M.; Johnson, L.T.; Mcdowell, R.W.; Miyittah, M.K.; Powers, S.M.; et al. Guiding phosphorus stewardship for multiple ecosystem services. Ecosyst. Health Sustain. 2016, 2, e01251. [Google Scholar] [CrossRef] [Green Version]
- Ozlu, E.; Kumar, S. Response of surface GHG fluxes to long-term manure and inorganic fertilizer application in corn and soybean rotation. Sci. Total Environ. 2018, 626, 817–825. [Google Scholar] [CrossRef]
- Adair, E.C.; Barbieri, L.; Schiavone, K.; Darby, H.M. Manure Application Decisions Impact Nitrous Oxide and Carbon Dioxide Emissions during Non-Growing Season Thaws. Soil Sci. Soc. Am. J. 2019, 83, 163–172. [Google Scholar] [CrossRef]
- Osmond, D.; Meals, D.; Hoag, D.; Arabi, M.; Luloff, A.; Jennings, G.; McFarland, M.; Spooner, J.; Sharpley, A.; Line, D. Improving conservation practices programming to protect water quality in agricultural watersheds: Lessons learned from the National Institute of Food and Agriculture-Conservation Effects Assessment Project. J. Soil Water Conserv. 2012, 67, 122A–127A. [Google Scholar] [CrossRef] [Green Version]
- Zhou, M.; Zhu, B.; Wang, S.; Zhu, X.; Vereecken, H.; Brüggemann, N. Stimulation of N2O emission by manure application to agricultural soils may largely offset carbon benefits: A global meta-analysis. Glob. Chang. Biol. 2017, 23, 4068–4083. [Google Scholar] [CrossRef]
- Reicosky, D.C. Tillage-Induced CO2 Emission from Soil; Kluwer Academic Publishers: London, UK, 1997; Volume 49. [Google Scholar]
- Schipanski, M.E.; Barbercheck, M.; Douglas, M.R.; Finney, D.M.; Haider, K.; Kaye, J.P.; Kemanian, A.R.; Mortensen, D.A.; Ryan, M.R.; Tooker, J.; et al. A framework for evaluating ecosystem services provided by cover crops in agroecosystems. Agric. Syst. 2014, 125, 12–22. [Google Scholar] [CrossRef]
- Boeraeve, F.; Dendoncker, N.; Cornélis, J.T.; Degrune, F.; Dufrêne, M. Contribution of agroecological farming systems to the delivery of ecosystem services. J. Environ. Manag. 2020, 260, 109576. [Google Scholar] [CrossRef]
- Robertson, G.P.; Gross, K.L.; Hamilton, S.K.; Landis, D.A.; Schmidt, T.M.; Snapp, S.S.; Swinton, S.M. Farming for ecosystem services: An ecological approach to production agriculture. Bioscience 2014, 64, 404–415. [Google Scholar] [CrossRef]
- Francis, C.; Lieblein, G.; Gliessman, S.; Breland, T.A.; Creamer, N.; Harwood, R.; Salomonsson, L.; Helenius, J.; Rickerl, D.; Salvador, R.; et al. Agroecology: The ecology of food systems. J. Sustain. Agric. 2003, 22, 99–118. [Google Scholar] [CrossRef]
- Ernesto Méndez, V.; Bacon, C.M.; Cohen, R. Agroecology as a transdisciplinary, participatory, and action-oriented approach. Agroecol. Sustain. Food Syst. 2013, 37, 3–18. [Google Scholar]
- Dendoncker, N.; Boeraeve, F.; Crouzat, E.; Dufrêne, M.; König, A.; Barnaud, C. How can integrated valuation of ecosystem services help understanding and steering agroecological transitions? Ecol. Soc. 2018, 23, 12. [Google Scholar] [CrossRef] [Green Version]
- Drinkwater, L.E. Cropping Systems Rsearch: Reconsidering Agricultural Experimental Approaches. Horttechnology 2002, 12, 355–361. [Google Scholar] [CrossRef] [Green Version]
- Johnson, K.A.; Polasky, S.; Nelson, E.; Pennington, D. Uncertainty in ecosystem services valuation and implications for assessing land use tradeoffs: An agricultural case study in the Minnesota River Basin. Ecol. Econ. 2012, 79, 71–79. [Google Scholar] [CrossRef]
- White, S.S.; Selfa, T. Shifting Lands: Exploring Kansas Farmer Decision-Making in an Era of Climate Change and Biofuels Production. Environ. Manag. 2013, 51, 379–391. [Google Scholar] [CrossRef] [PubMed]
- Rogers, E. Diffusion of Innovations, 5th ed.; Free Press: New York, NY, USA, 2003; ISBN 9780743222099. [Google Scholar]
- Wejnert, B. Integrating Models of Diffusion of Innovations: A Conceptual Framework. Source Annu. Rev. Sociol. 2002, 28, 297–326. [Google Scholar] [CrossRef] [Green Version]
- Liu, J.; Dietz, T.; Carpenter, S.R.; Alberti, M.; Folke, C.; Moran, E.; Pell, A.N.; Deadman, P.; Kratz, T.; Lubchenco, J.; et al. Complexity of Coupled Human and Natural Systems. Science 2007, 317, 1513–1516. [Google Scholar] [CrossRef] [Green Version]
- VAAFM. Soil Conservation Practice and Payment for Ecosystem Services Working Group Report. Prepared for the Vermont General Assembly in Accordance with Act No 83, Section 3, 2019; VAAFM: Montpelier, VT, USA, 2020. [Google Scholar]
- EPA. Phosphorus TMDLs for Vermont Segments of Lake Champlain, June 17, 2016; EPA: Washington, DC, USA, 2016. [Google Scholar]
- Sherman, M. (Ed.) Imagining Vermont: Vision and Values for the Future. Final Report on the Council of the Future of Vermont; Ver-mont Council on Rural Development: Montpelier, VT, USA, 2009. [Google Scholar]
- VPR. VermontPBS Vermont Rural LIfe Survey. Available online: http://projects.vpr.org/rural-life-survey-2019-vpr-vermont-pbs (accessed on 9 September 2020).
- Moser, M.; Hyman, J.; Schmidt, F. Looking Ahead: Vermonters’ Values and Concerns; Full Report; University of Vermont: Burlington, VT, USA, 2008. [Google Scholar]
- Sevoian, N. Working Lands Enterprise Initiative Webinar; Working Lands Enterprise Initiative: Montpelier, VT, USA, 2016; Chapter 1. [Google Scholar]
- EPA. Paired Watershed Study Design (No. 841-F-93-009); United States Environmental Protection Agency: Washington, DC, USA, 1993. [Google Scholar]
- Wironen, M.B.; Bennett, E.M.; Erickson, J.D. Phosphorus flows and legacy accumulation in an animal-dominated agricultural region from 1925 to 2012. Glob. Environ. Chang. 2018, 50, 88–99. [Google Scholar] [CrossRef]
- Twombly, C.R.; Faulkner, J.W.; Hurley, S.E. The effects of soil aeration prior to dairy manure application on edge-of-field hydrology and nutrient fluxes in cold climate hayland agroecosystems. J. Soil Water Conserv. 2021, 76, 1–13. [Google Scholar] [CrossRef]
- Schindelbeck, R.R.; Moebius-Clune, B.N.; Moebius-Clune, D.J.; Kurtz, K.S.; van Es, H.M. Cornell Soil Health Laboratory Com-prehensive Assessment of Soil Health Standard Operating Procedures; Cornell Univ.: Ithaca, NY, USA, 2016. [Google Scholar]
- The Northeast Coordinating Committee for Soil Testing. Recommended Soil Testing Procedures for the Northeastern United States, 3rd ed.; Northeastern Regional Publication No. 493; University of Delaware: Newark, DE, USA, 2009. [Google Scholar]
- Iqbal, J.; Castellano, M.J.; Parkin, T.B. Evaluation of photoacoustic infrared spectroscopy for simultaneous measurement of N 2 O and CO2 gas concentrations and fluxes at the soil surface. Glob. Chang. Biol. 2013, 19, 327–336. [Google Scholar] [CrossRef] [PubMed] [Green Version]
- Parkin, T.B.; Ventrea, R.T. Chamber-based trace gas flux measurement. In Sampling Protocols; Follett, R.F., Ed.; Elsevier B.V.: Amsterdam, The Netherlands, 2010; Chapter 3; pp. 1–39. [Google Scholar]
- Dittmer, K.M.; Darby, H.M.; Goeschel, T.R.; Adair, E.C. Benefits and tradeoffs of reduced tillage and manure application methods in a Zea mays silage system. J. Environ. Qual. 2020, 49, 1236–1250. [Google Scholar] [CrossRef]
- Borchers, H.W. Pracma: Practical Numerical Math Functions. R Package Version 2.3.3. 2021. Available online: https://cran.r-project.org/web/packages/pracma/index.html (accessed on 3 January 2021).
- Pike, A. Pennsylvania’s 2016 Machinery Custom Rates. Available online: https://www.nass.usda.gov/Statistics_by_State/Pennsylvania/Publications/Machinery_Custom_Rates/2016 Custom Rates.pdf (accessed on 15 September 2020).
- Steinhilber, P.; Shipley, P.; Vvedenskaya, A. Estimating Corn Silage (NM-1); University of Maryland Extension: College Park, MD, USA, 2016; pp. 2–7. [Google Scholar]
- Dale, V.H.; Polasky, S. Measures of the effects of agricultural practices on ecosystem services. Ecol. Econ. 2007, 64, 286–296. [Google Scholar] [CrossRef]
- Olander, L.P.; Johnston, R.J.; Tallis, H.; Kagan, J.; Maguire, L.A.; Polasky, S.; Urban, D.; Boyd, J.; Wainger, L.; Palmer, M. Benefit relevant indicators: Ecosystem services measures that link ecological and social outcomes. Ecol. Indic. 2018, 85, 1262–1272. [Google Scholar] [CrossRef]
- Hammond Wagner, C.; Gourevitch, J.; Horner, K.; Kinnebrew, E.; Maden, B.; Recchia, E.; White, A.; Wiegman, A.; Ricketts, T.; Roy, E.; et al. Issue Paper Payment for Ecosystem Services for Vermont; Gund Institute for Environment at the University of Vermont: Burlington, VT, USA, 2019. [Google Scholar]
- USDA. Soil Survey Staff Web Soil Survey; USDA: Wasington, DC, USA, 2020. [Google Scholar]
- Pribyl, D.W. Geoderma A critical review of the conventional SOC to SOM conversion factor. Geoderma 2010, 156, 75–83. [Google Scholar] [CrossRef]
- Downs, H.W.; Hansen, R.W. Fact Sheet No. Farm and Ranch Series|Equipment; Oklahoma State University: Stillwater, OK, USA, 1998. [Google Scholar]
- Lazarus, W.F. Machinery Cost Estimates; Department of Agricultural and Consumer Economics: Urbana, IL, USA, 2012. [Google Scholar]
- US EIA, U.E.I.A. Carbon Dioxide Emissions Coefficients. Available online: https://www.eia.gov/environment/emissions/co2_vol_mass.php (accessed on 15 September 2020).
- Moebius-Clune, B.N.; Moebius-Clune, D.J.; Gugino, B.K.; Idowu, O.J.; Schindelbeck, R.R.; Ristow, A.J.; Van Es, H.M.; Thies, J.E.; Shayler, H.A.; McBride, M.B.; et al. Comprehensive Assessment of Soil Health—The Cornell Framework; Cornell University: Ithaca, NY, USA, 2016; ISBN 0967650763. [Google Scholar]
- Hsieh, H.F.; Shannon, S.E. Three approaches to qualitative content analysis. Qual. Health Res. 2005, 15, 1277–1288. [Google Scholar] [CrossRef] [PubMed]
- Conner, D.S.; Levine, R. Circles of Association: The Connections of Community-Based Food Systems. J. Hunger Environ. Nutr. 2007, 1, 5–25. [Google Scholar] [CrossRef]
- Angelstam, P.; Andersson, K.; Annerstedt, M.; Axelsson, R.; Elbakidze, M.; Garrido, P.; Grahn, P.; Jönsson, K.I.; Pedersen, S.; Schlyter, P.; et al. Solving Problems in Social–Ecological Systems: Definition, Practice and Barriers of Transdisciplinary Research. Ambio 2013, 42, 254–265. [Google Scholar] [CrossRef] [Green Version]
- Schimel, D.S.; Braswell, B.H.; Holland, E.A.; McKeown, R.; Ojima, D.S.; Painter, T.H.; Parton, W.J.; Townsend, A.R. Climatic, edaphic, and biotic controls over storage and turnover of carbon in soils. Global Biogeochem. Cycles 1994, 8, 279–293. [Google Scholar] [CrossRef] [Green Version]
- Adhikari, K.; Hartemink, A.E. Linking soils to ecosystem services—A global review. Geoderma 2016, 262, 101–111. [Google Scholar] [CrossRef]
- Paustian, K.; Larson, E.; Kent, J.; Marx, E.; Swan, A. Soil C Sequestration as a Biological Negative Emission Strategy. Front. Clim. 2019, 1, 8. [Google Scholar] [CrossRef]
- Aguilera, E.; Lassaletta, L.; Gattinger, A.; Gimeno, B.S. Managing soil carbon for climate change mitigation and adaptation in Mediterranean cropping systems: A meta-analysis. Agric. Ecosyst. Environ. 2013, 168, 25–36. [Google Scholar] [CrossRef]
- White, K.E.; Brennan, E.B.; Cavigelli, M.A.; Smith, R.F. Winter cover crops increase readily decomposable soil carbon, but compost drives total soil carbon during eight years of intensive, organic vegetable production in California. PLoS ONE 2020, 15, e0228677. [Google Scholar] [CrossRef] [PubMed]
- Gattinger, A.; Muller, A.; Haeni, M.; Skinner, C.; Fliessbach, A.; Buchmann, N.; Mader, P.; Stolze, M.; Smith, P.; Scialabba, N.E.-H.; et al. Enhanced top soil carbon stocks under organic farming. Proc. Natl. Acad. Sci. USA 2012, 109, 18226–18231. [Google Scholar] [CrossRef] [PubMed] [Green Version]
- Cavalcante, J.S.; Favaretto, N.; Dieckow, J.; Cherobim, V.F.; Barth, G. Long-term surface application of dairy liquid manure to soil under no-till improves carbon and nitrogen stocks. Eur. J. Soil Sci. 2019, 71, 1132–1143. [Google Scholar] [CrossRef]
- Carlisle, L. Factors influencing farmer adoption of soil health practices in the United States: A narrative review. Agroecol. Sustain. Food Syst. 2016, 40, 583–613. [Google Scholar] [CrossRef]
- Clements, R.S.; Birthisel, S.K.; Daigneault, A.; Gallandt, E.; Johnson, D.; Wentworth, T.; Niles, M.T. Climate change in the context of whole-farming systems: Opportunities for improved outreach. Clim. Change 2021, 166, 40. [Google Scholar] [CrossRef]
- Ross, C.; Grubinger, V.; Nihart, A.; Chapin, E.; Everhart, N.; Gleason, L.; Richardson, N.; Costello, P.; Kahler, E.; Asch, A. A 2018 Exploration of the Future of Vermont Agriculture Join the Conversation; University of Vermont Extension: Burlington, VT, USA, 2018. [Google Scholar]
- Newell, B.R.; McDonald, R.I.; Brewer, M.; Hayes, B.K. The psychology of environmental decisions. Annu. Rev. Environ. Resour. 2014, 39, 443–467. [Google Scholar] [CrossRef] [Green Version]
- Lal, R. Soil carbon management and climate change. Carbon Manag. 2013, 4, 439–462. [Google Scholar] [CrossRef]
- Paustian, K.; Collier, S.; Baldock, J.; Burgess, R.; Creque, J.; Delonge, M.; Dungait, J.; Ellert, B.; Frank, S.; Goddard, T.; et al. Quantifying Soil Carbon Measurement for Agricultural Soils Management: A Consensus View from Science. 2017. Available online: https://jahnresearchgroup.webhosting.cals.wisc.edu/wp-content/uploads/sites/223/2017/08/1.-Quantifying_soil_carbon_measurement_for_agricultural_soils_management_17.09.05.pdf (accessed on 20 September 2020).
- Robertson, G.P.; Klingensmith, K.M.; Klug, M.J.; Paul, E.A.; Crum, J.R. Soil Resources, Microbial Activity, and Primary Production Across an Agricultural Ecosystem. Ecol. Appl. 1997, 7, 158. [Google Scholar] [CrossRef]
- PCC. IPCC Guidelines for National Greenhouse Gas Inventories. Volume 4: Agriculture, Forestry and Other Land Use; Intergov-ernmental Panel on Climate Change: Hayama, Japan, 2006. [Google Scholar]
- Kravchenko, A.N.; Robertson, G.P. Whole-Profile Soil Carbon Stocks: The Danger of Assuming Too Much from Analyses of Too Little. Soil Sci. Soc. Am. J. 2011, 75, 235–240. [Google Scholar] [CrossRef]
- Groffman, P.M.; Butterbach-Bahl, K.; Fulweiler, R.W.; Gold, A.J.; Morse, J.L.; Stander, E.K.; Tague, C.; Tonitto, C.; Vidon, P. Challenges to incorporating spatially and temporally explicit phenomena (hotspots and hot moments) in denitrification models. Biogeochemistry 2009, 93, 49–77. [Google Scholar] [CrossRef]
- Niles, M.T.; Wiltshire, S. Tradeoffs in US dairy manure greenhouse gas emissions, productivity, climate, and manure management strategies. Environ. Res. Commun. 2019, 1, 075003. [Google Scholar] [CrossRef]


| Production Type | Field | Practices | Area (ha) | Mean Slope (%) | Aspect | Soil Type |
|---|---|---|---|---|---|---|
| Corn silage (Zea mays L.) | Conventional (control) | Chisel plow tillage, broadcast manure application, and grassed waterway | 0.8 | 0.06 | N | Limerick silt loam, 34.6% Winooski very fine sandy loam, 65.3% |
| Best Management Practice (treatment) | Cover crop, manure injection, reduced till (CCMIRT), and grassed waterway | 1.7 | 0.12 | S | Limerick silt loam, 85.9% Hadley very fine sandy loam, 7% Winooski very fine sandy loam, 7% | |
| Mixed grass-legume hay (Orchard grass, brome grass, fescue, canary grass, and clover) | Non-Aerated (control) | Broadcast manure application without prior aeration | 2.35 | 3.0 | S | Vergennes clay, 100% |
| Aerated (treatment) | Aeration prior to broadcast manure application | 2.75 | 2.7 | SW | Covington silty clay, 89.4% Palatine silt loam, 1.4% Palatine silt loam, 9.4% |
| Ecosystem Service | Type | Beneficiaries | Dynamic Metrics/Indicators Used |
|---|---|---|---|
| Food production | Provisioning | State and national consumers | Yield |
| Clean water via nutrient retention | Regulating | Champlain Basin | Phosphorus and nitrogen and exports in runoff water, including total and dissolved phosphorus loads in surface and subsurface runoff (TP and TDP), as well as dissolved and total nitrogen loads in surface runoff (TN and TDN) |
| Clean water via nutrient cycling | Champlain Basin | Phosphorus (P) nutrient mass balance | |
| Climate stabilization | Global | Soil organic carbon content (SOC), soil N2O and CO2 emissions, tractor fuel consumption | |
| Downstream flood risk reduction | Watershed | Runoff volumes | |
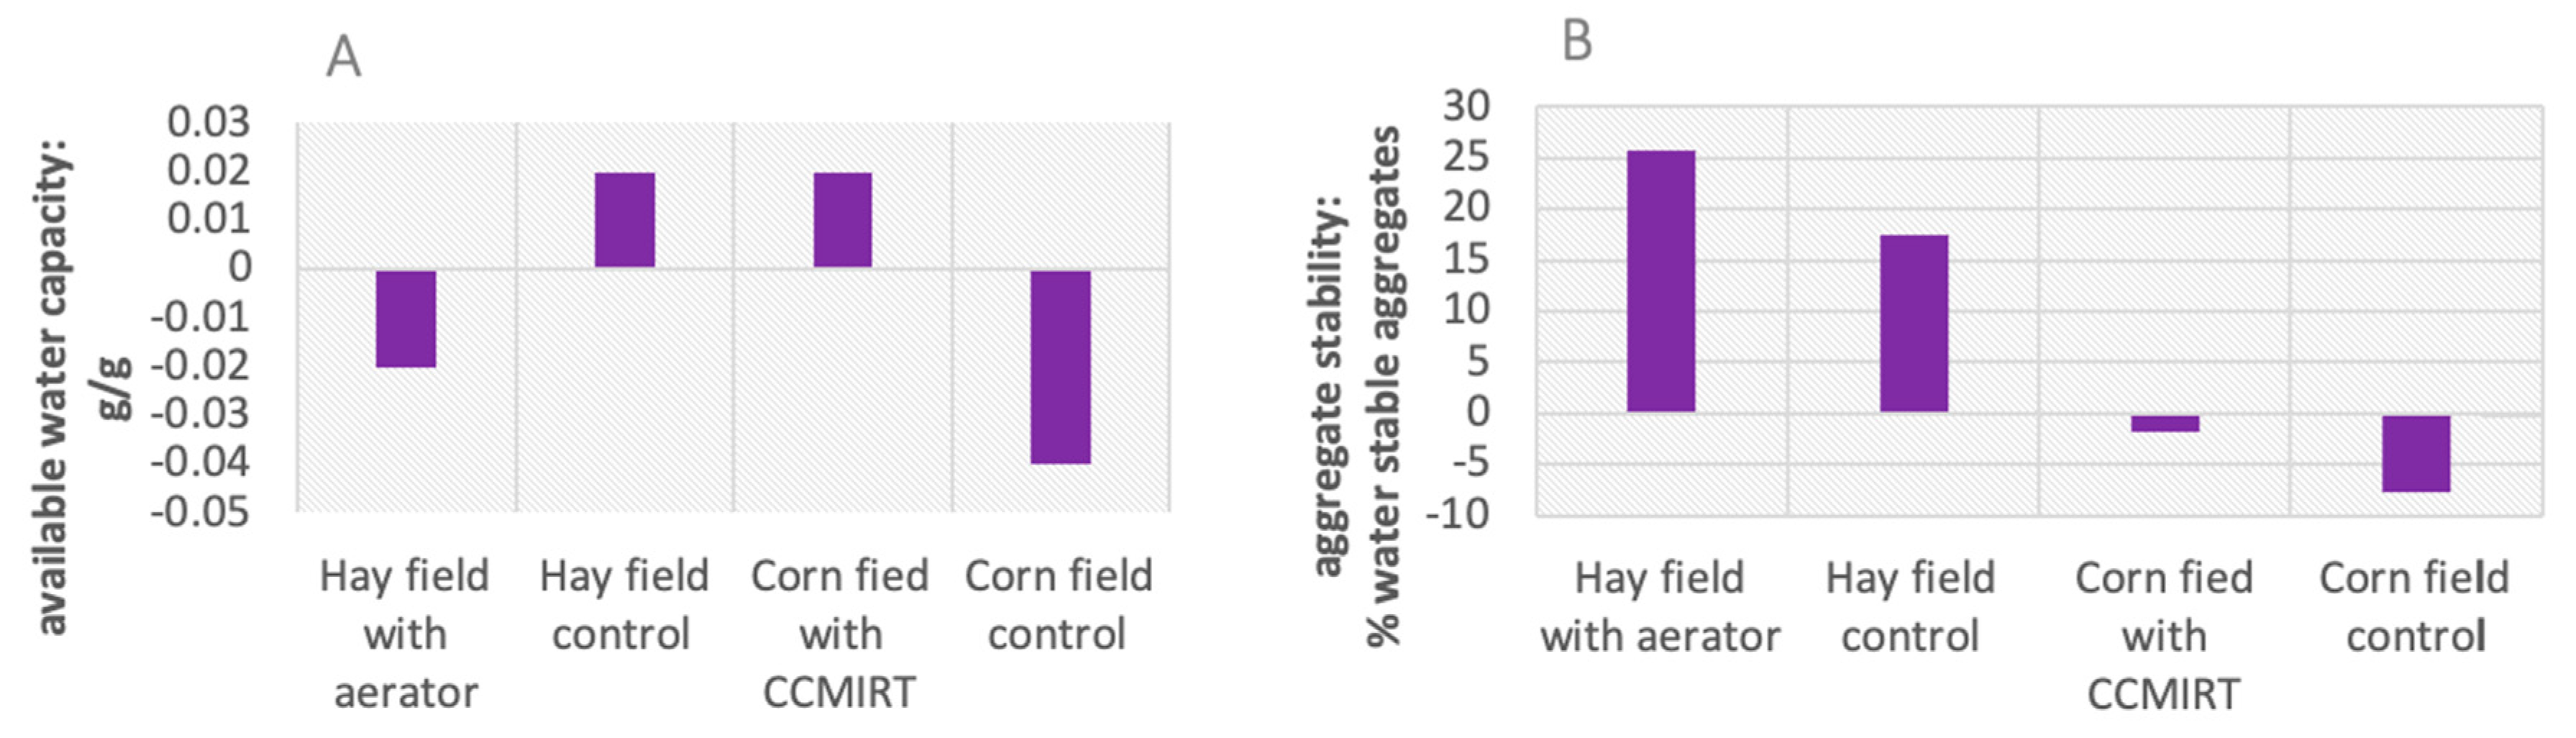
| Farm resilience to extreme weather | Farm | Soil available water capacity, aggregate stability | |
| Soil health | Supporting | Farm | Comprehensive assessment of soil health scores |
| Ecosystem Service | Indicator | Key Findings | Influence on Supply |
|---|---|---|---|
| Food production | Yield | No trend in either direction was discernable based in our data. | ≈ |
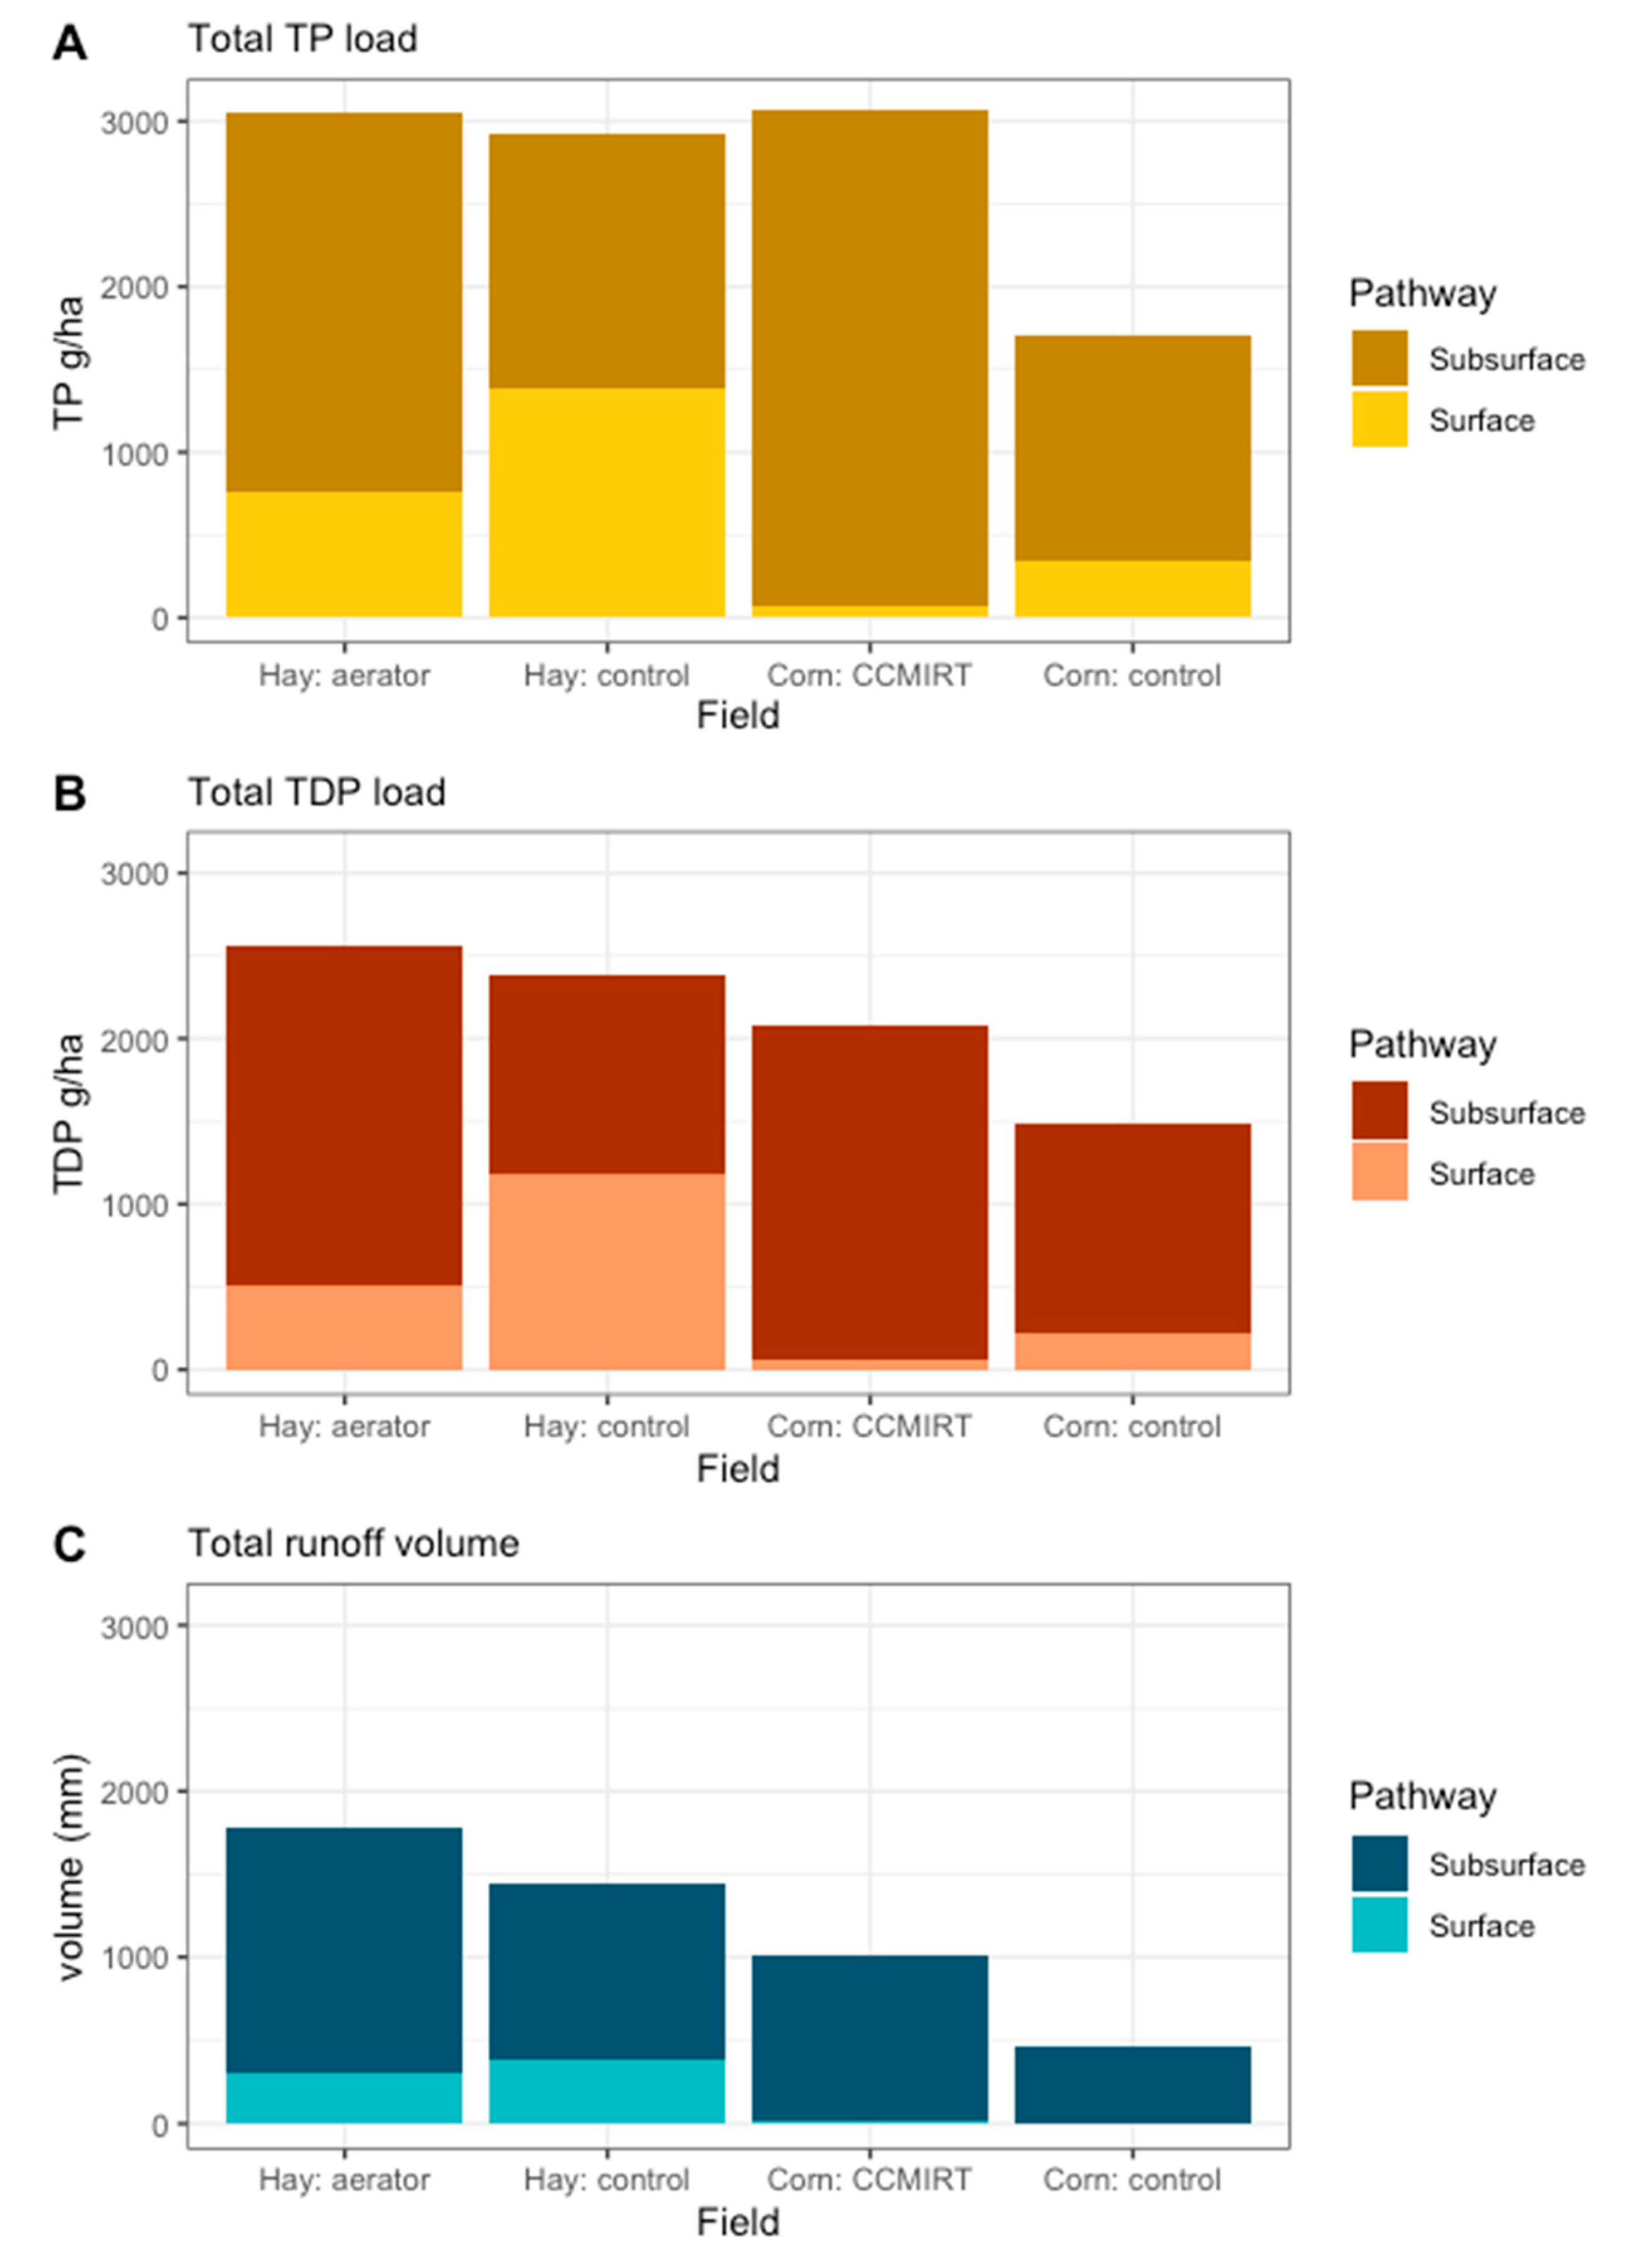
| Clean water via nutrient retention | Phosphorus and nitrogen and exports in runoff water, including total and dissolved phosphorus loads in surface and subsurface runoff, as well as dissolved and total nitrogen loads in surface runoff. | The aerated hay treatment did not have a statistically significant influence on surface runoff nutrient loads compared to control hay field. Subsurface loads were large among all fields. | ≈ |
| Clean water via nutrient cycling | Phosphorus nutrient mass balance | No clear trend in either direction was detected. All fields had both negative and positive annual phosphorus balances during the years which were monitored. | ≈ |
| Climate stabilization | Soil carbon content, soil surface N2O and CO2 emissions, tractor fuel consumption | Increases in soil carbon stocks offset GHG emissions from the soil surface in the treated field, and in the control. The control field was a larger equivalent CO2 sink than the treatment. | − |
| Flood risk mitigation | Surface runoff volumes | Aeration in the hay field paired trial resulted in a 16.2% increase in average event surface runoff volume when compared to the control hay field. | − |
| Farm resilience to extreme weather | Soil available water capacity, aggregate stability | The aerator reduced soil available water capacity, while the non-aerated field experienced increases in available water capacity. The percent of water stable aggregates increased in both hay fields, but more so in the aerated field. | −/+ |
| Soil health | Comprehensive assessment of soil health scores | Both hay fields increased overall soil health. Using an aerator increased soil health more than not using one. | + |
| Ecosystem Service | Indicator | Key Findings | Influence on Supply |
|---|---|---|---|
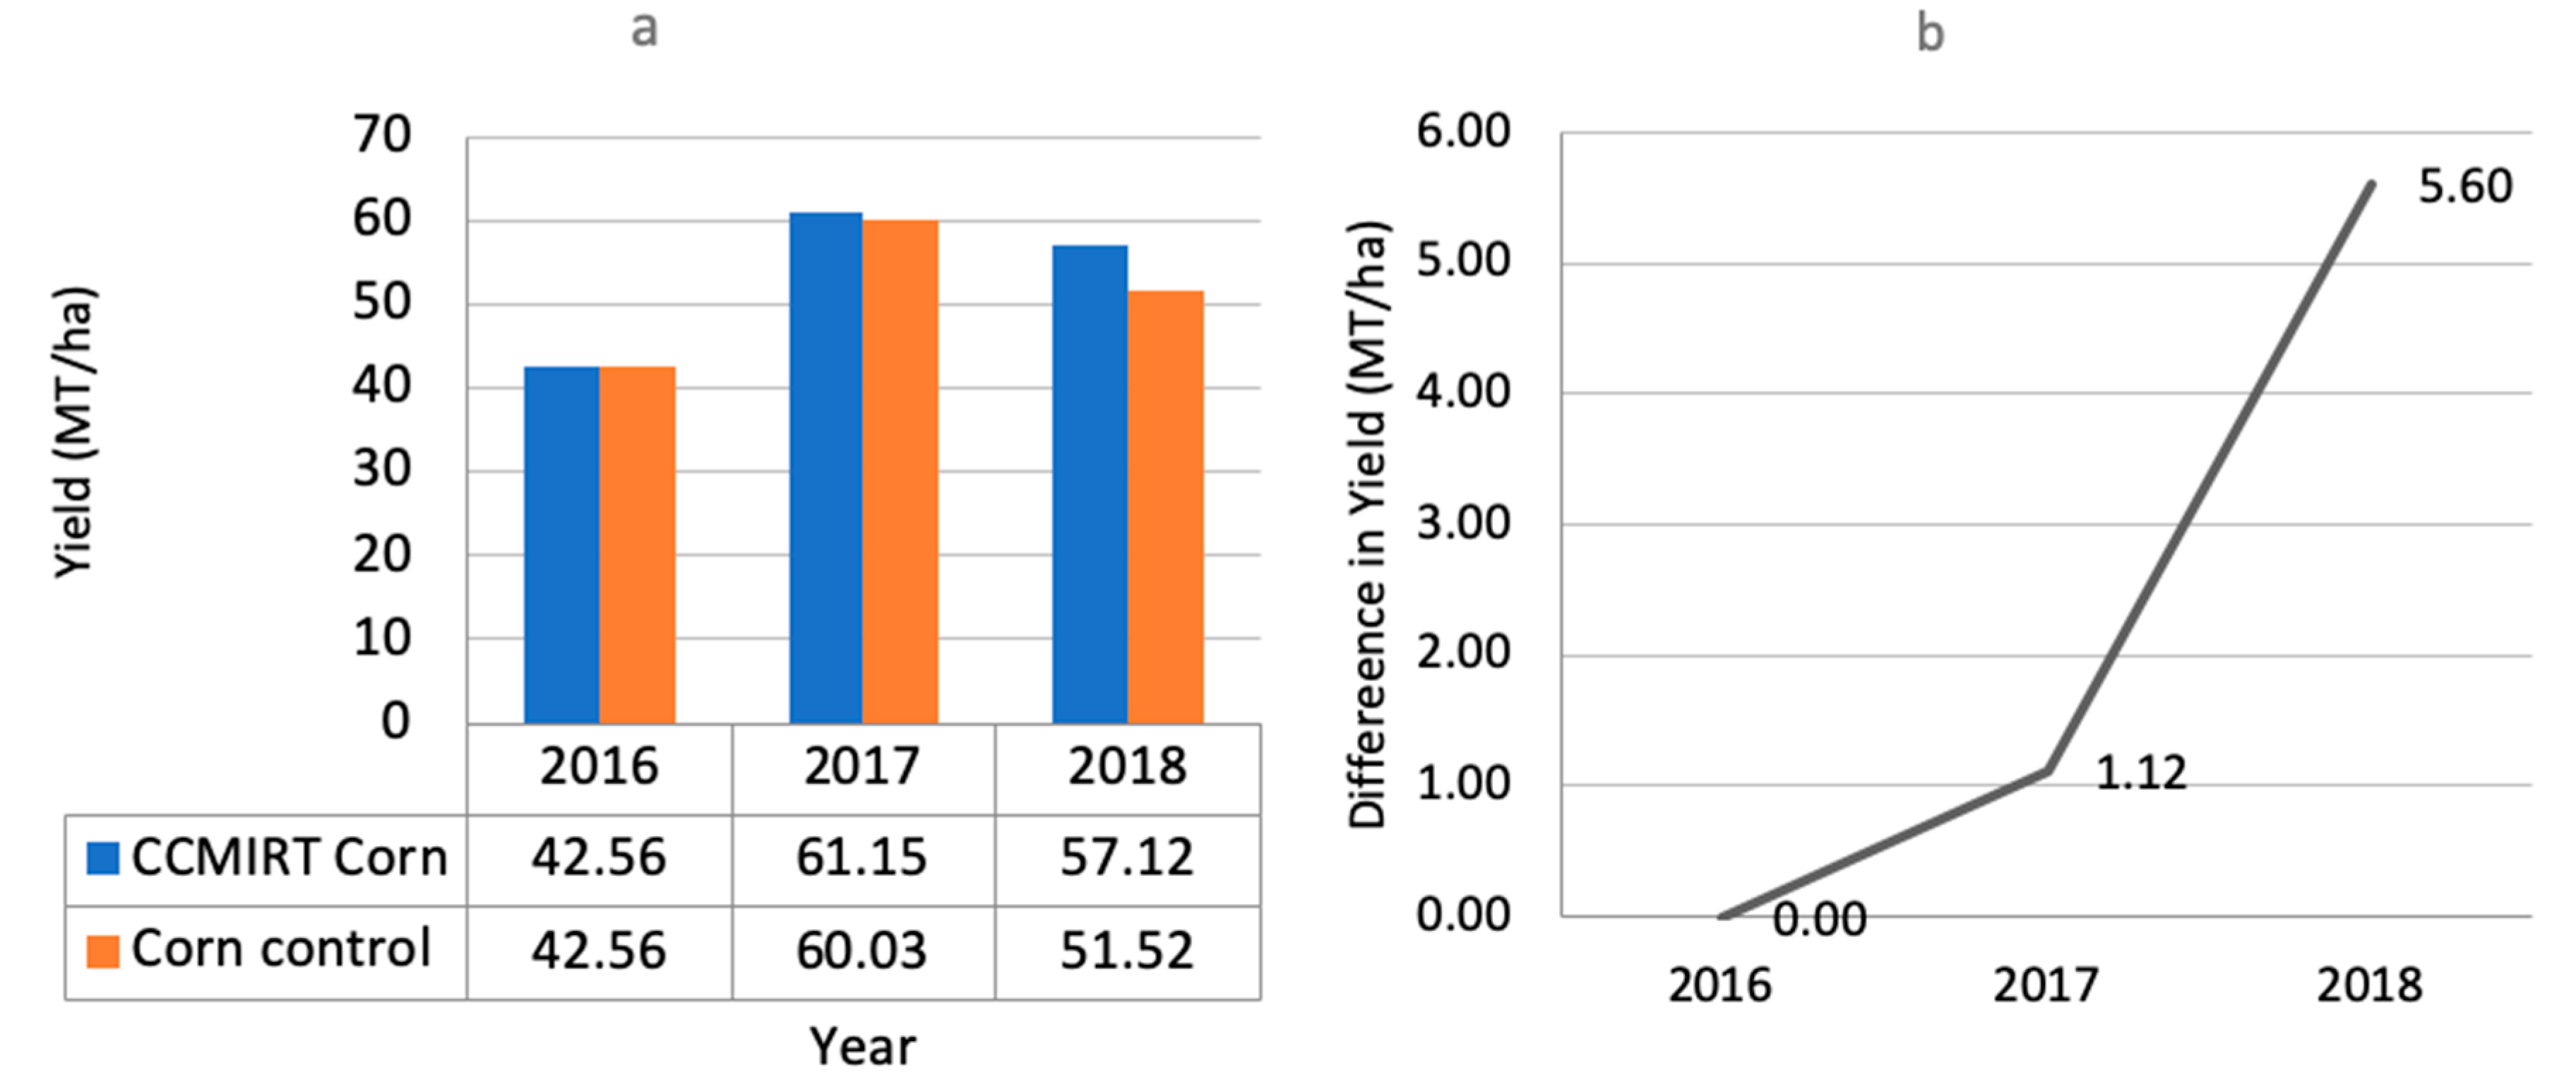
| Food production | Yield | The CCMIRT field increasingly yielded more than the control field over time. | + |
| Clean water via nutrient retention | Phosphorus and nitrogen and exports in runoff water, including total and dissolved phosphorus loads in surface and subsurface runoff, as well as dissolved and total nitrogen loads in surface runoff | The CCMIRT treatment did not have a statistically significant influence on surface TDP, TP or TDN loads, but significantly increased TN loads in surface runoff compared to the control corn field. | ≈/− |
| Clean water via nutrient cycling | Phosphorus nutrient mass balance | No clear trend in either direction was detected. All fields had both negative and positive annual phosphorus balances during the years which were monitored. | ≈ |
| Climate stabilization | Soil carbon content, soil surface N2O and CO2 emissions, tractor fuel consumption | Increases in soil carbon stocks did not offset GHG emissions from the soil surface. The control field had a smaller equivalent CO2 footprint than the CCMIRT. | − |
| Flood risk mitigation | Surface runoff volume | Surface runoff volumes in the paired corn field were not significantly different by treatment. | ≈ |
| Farm resilience to extreme weather | Soil available water capacity, aggregate stability | The CCMIRT increased soil available water capacity, while the control corn field experienced decreases in available water capacity. Water stable aggregate measures declined in both corn fields, but relatively less in the CCMIRT treatment (only by 1.9% in the CCMIRT field and 7.7% in the control field). | +/+ |
| Soil health | Comprehensive assessment of soil health scores | Both corn fields increased overall soil health. The CCMIRT field increased soil health more than the control field. | + |
| Field | Year | Volume (mm) | TP (g/ha) | TDP (g/ha) | |||
|---|---|---|---|---|---|---|---|
| Runoff | Leachate | Runoff | Leachate | Runoff | Leachate | ||
| Control corn field | 2017 | 4.21 | 108 | 166 | 167 | 52.1 | 130 |
| 2018 | 3.83 | 347 | 180 | 1190 | 163 | 1140 | |
| CCMIRT corn field | 2017 | 5.72 | 252 | 38.0 | 531 | 27.4 | 456 |
| 2018 | 5.00 | 743 | 36.5 | 2470 | 30.8 | 1560 | |
| Control hay field | 2017 | 242.1 | 724.1 | 688.56 | 1096.5 | 537.97 | 775.2 |
| 2018 | 146.3 | 333.5 | 701.57 | 439.8 | 648.38 | 416.3 | |
| Aerated hay field | 2017 | 182.1 | 1109.1 | 381.16 | 1909.4 | 219.17 | 1744.3 |
| 2018 | 124.8 | 371.7 | 378.62 | 384.7 | 289.82 | 313.4 | |
| Year by Field | Manure P Applied (kg/ha) | Forage P Harvested (kg/ha) | Balance |
|---|---|---|---|
| Hay field with aerator | |||
| 2016 | 20.8 | 15.9 | 4.9 |
| 2017 | 10.2 | 20.7 | −10.5 |
| 2018 | 14.7 | 12 | 2.7 |
| Control hay field | |||
| 2016 | 22.2 | 16.1 | 6.1 |
| 2017 | 11.1 | 18.9 | −7.8 |
| 2018 | 15.1 | 13.1 | 2 |
| CCMIRT corn Field | |||
| 2017 | 98.4 | 73.5 | 2.7 |
| 2018 | 13.9 | 57.9 | −33.9 |
| Control corn field | |||
| 2017 | 89.8 | 87.1 | 24.9 |
| 2018 | 23.5 | 57.4 | −44 |
Publisher’s Note: MDPI stays neutral with regard to jurisdictional claims in published maps and institutional affiliations. |
© 2021 by the authors. Licensee MDPI, Basel, Switzerland. This article is an open access article distributed under the terms and conditions of the Creative Commons Attribution (CC BY) license (https://creativecommons.org/licenses/by/4.0/).
Share and Cite
White, A.; Faulkner, J.W.; Conner, D.; Barbieri, L.; Adair, E.C.; Niles, M.T.; Mendez, V.E.; Twombly, C.R. Measuring the Supply of Ecosystem Services from Alternative Soil and Nutrient Management Practices: A Transdisciplinary, Field-Scale Approach. Sustainability 2021, 13, 10303. https://doi.org/10.3390/su131810303
White A, Faulkner JW, Conner D, Barbieri L, Adair EC, Niles MT, Mendez VE, Twombly CR. Measuring the Supply of Ecosystem Services from Alternative Soil and Nutrient Management Practices: A Transdisciplinary, Field-Scale Approach. Sustainability. 2021; 13(18):10303. https://doi.org/10.3390/su131810303
Chicago/Turabian StyleWhite, Alissa, Joshua W. Faulkner, David Conner, Lindsay Barbieri, E. Carol Adair, Meredith T. Niles, V. Ernesto Mendez, and Cameron R. Twombly. 2021. "Measuring the Supply of Ecosystem Services from Alternative Soil and Nutrient Management Practices: A Transdisciplinary, Field-Scale Approach" Sustainability 13, no. 18: 10303. https://doi.org/10.3390/su131810303
APA StyleWhite, A., Faulkner, J. W., Conner, D., Barbieri, L., Adair, E. C., Niles, M. T., Mendez, V. E., & Twombly, C. R. (2021). Measuring the Supply of Ecosystem Services from Alternative Soil and Nutrient Management Practices: A Transdisciplinary, Field-Scale Approach. Sustainability, 13(18), 10303. https://doi.org/10.3390/su131810303