Abstract
The scale of agricultural land management was scientifically measured to provide a theoretical reference for improving the efficiency of agricultural land utilization, optimizing the industrial structure, and effectively solving the “three rural problems”. Based on 368 microfarmers’ agricultural land management questionnaire responses, the Cobb–Douglas production function was used to measure the average household size in different zones of Shawan City, Xinjiang, and then to calculate the total scale of moderate management in the region, and to divide the supplementary and reduced zones of arable land. The proposed countermeasures and suggestions for achieving the scale of moderate management from the perspectives of both people and land are presented. The results show the following: (1) the average suitable operating scales of households in the hilly area, the agricultural area in the oasis plain, and the oasis–desert interlace area were 5.15, 9.28, and 7.74 ha, respectively. (2) The moderate total scales of operation in the low hilly area, the middle oasis plain agricultural area, and the lower oasis–desert ecotone were 60,380, 112,510, and 115,500 ha, respectively. (3) Two areas, the low mountainous and hilly areas and the oasis plain farming areas, are supplementary areas of arable land, which should be supplemented by improving the management capacity of farmers, cultivating two new agricultural business entities, increasing land transfers, developing modern agriculture, and reducing the degree of fragmentation of arable land. The oasis–desert staggered area is the area where the scale of arable land is reduced. We should vigorously implement the work of retreating land and reducing water, and guide farmers to engage in secondary and tertiary industries so as to reduce the scale of arable land.
1. Introduction
In the context of building a moderately prosperous society in a well-rounded way, the production and management goals of farmers gradually move from solving the problem of food and clothing to solving the problem of increasing income [1], and it has become inevitable to change from the traditional smallholder production mode to large-scale operation [2,3]. The scale of agricultural land firstly improves its utilization rate by concentrating it to reduce the area of ridges and ditches and avoid wastage; secondly, the scale of agricultural land facilitates mechanized production, saves costs, and increases the income of farmers, thus stabilizing agricultural development [4,5,6]. However, the scale of agricultural land is not the larger the better. Under certain technical conditions, there is always a moderate scale of agricultural land operation, so that the factors (labor, land, capital, and technology) invested by the production and operation units are optimally allocated and the economic profit generated by the agricultural land is the largest, and this scale is the moderate scale of agricultural land operation [7,8,9,10].
At present, the scale of agricultural land under moderate management is still an important part of academic research. Different scales of management produce different benefits in agricultural production. Yuri et al. [11] observed and interviewed the agricultural producers of the Chagas on the Kilimanjaro plateau, suggesting that small-scale farmers can make a living by optimizing crop types and adjusting agricultural land management strategies. Berdegué et al. [12] believed that there was a strong negative correlation between farm yield and scale, that is, with the expansion of agricultural scale, the agricultural yield per hectare of land showed a decreasing trend. In contrast, Bojnec et al. [13] found that larger economic benefits could be obtained under a large scale of management. Summer [14] believes that there is an inflection point in the expansion of business scale; that is, with the expansion of business scale, the production cost shows a downward trend, and once it reaches the critical point, change to production costs will be flat or begin to rise. As the levels of economic development, resource endowment, and market conditions vary greatly from region to region in China, there is no single development path that is suitable for all groups, and the moderate scale of land management is appropriate to most locations. Zhang Hongmei et al. [15] calculated the average household and per capita moderate operating scale of corn, rice, and soybeans in Heilongjiang province based on the goals of stable yield and increasing income. Yang Gangqiao et al. [16] calculated the moderate scale of the average arable land per household in the plain- and mountainous areas of Hubei Province. Wang Zhengbing et al. [17], from the perspective of opportunity cost, discussed the per capita moderate operation scale of rice planting in Jiangxi province when farmers stopped going out to work. Wu Zhenpei [18] calculated the efficiency of different operation scales using data envelopment analysis (DEA), and calculated the appropriate operation scale of farmers’ rice planting in Hunan Province. Wang Rou [19] calculated the extent of moderate scale land management in nine provinces in the middle-east region of China from the two aspects of efficiency and output. Liu Xinping [20,21], Yang Guang [22], Wei Guanghui [23], and Hao Lina et al. [24] used the principle of water–heat balance to measure moderate scale oases in arid (semiarid) areas, and then calculated the extent of moderate scale cultivated land.
Throughout the previous studies that have been conducted in the east-central region of China, most of the results related to moderate-scale agricultural land operations are focused on moderate scale of average household or per capita revenue, most of which were concluded not to reach the moderate scale, and the overall moderate-scale agricultural land cultivated in the region is rarely discussed. In the western arid region, overall agricultural land scale is mainly studied, but the scale measured by the water–heat balance principle is too macro, and the operation scale of micro farmers is not considered enough, so the research results prove difficult in providing targeted guidance for agriculture. In arid areas, the ecological environment is fragile [25], agricultural production conditions are limited by many factors, and farmers have planting as their main source of income. In some regions, agricultural land reclamation is excessive, and there is a situation of excessive scale.
Therefore, it is of great significance to study the appropriate scale of agricultural land operation to employ in arid areas. Based on this, this article takes Shawan City in the northern slope economic zone as an example based on microscopic peasant household survey data to maximize that perspective, uses the Cobb–Douglas production function to measure the worth of moderate-scale cultivation operations, and then calculates the area of land cultivated at a moderate scale to compare to the actual size, divided into supplies and reduce regions. It also puts forward countermeasures and suggestions to realize the moderate scale management of oasis agricultural land from the two aspects of farmers and land, and provides a theoretical reference for the improvement of agricultural land utilization efficiency, the optimization of industrial structure, and the solution to the problem of agriculture, rural areas, and farmers in arid areas.
2. Materials and Methods
2.1. Overview of the Study Area
Shawan City is located in the northern foot of the Tianshan mountains, the southern margin of the Junggar basin, and across the Manas river basin. It is a typical representative of oasis agriculture development in an arid area. Its topography is high in the south and low in the north, and it is divided into three parts: the upper, middle, and lower reaches, due to the influence of topography and landforms. The upper reaches of the middle and high mountains and low hills mainly develop agriculture and animal husbandry; the middle reaches are alluvial and alluvial fan plains where cotton and corn are mainly planted. Downstream is an oasis–desert ecotone where cotton is the main crop [26,27,28]. In 2019, the permanent resident population of Shawan was 202,500 the agricultural population was 99,000 the cultivated land area was 264,800 ha, and the sown area of crops was 157,200 ha.
2.2. Data Sources and Analysis
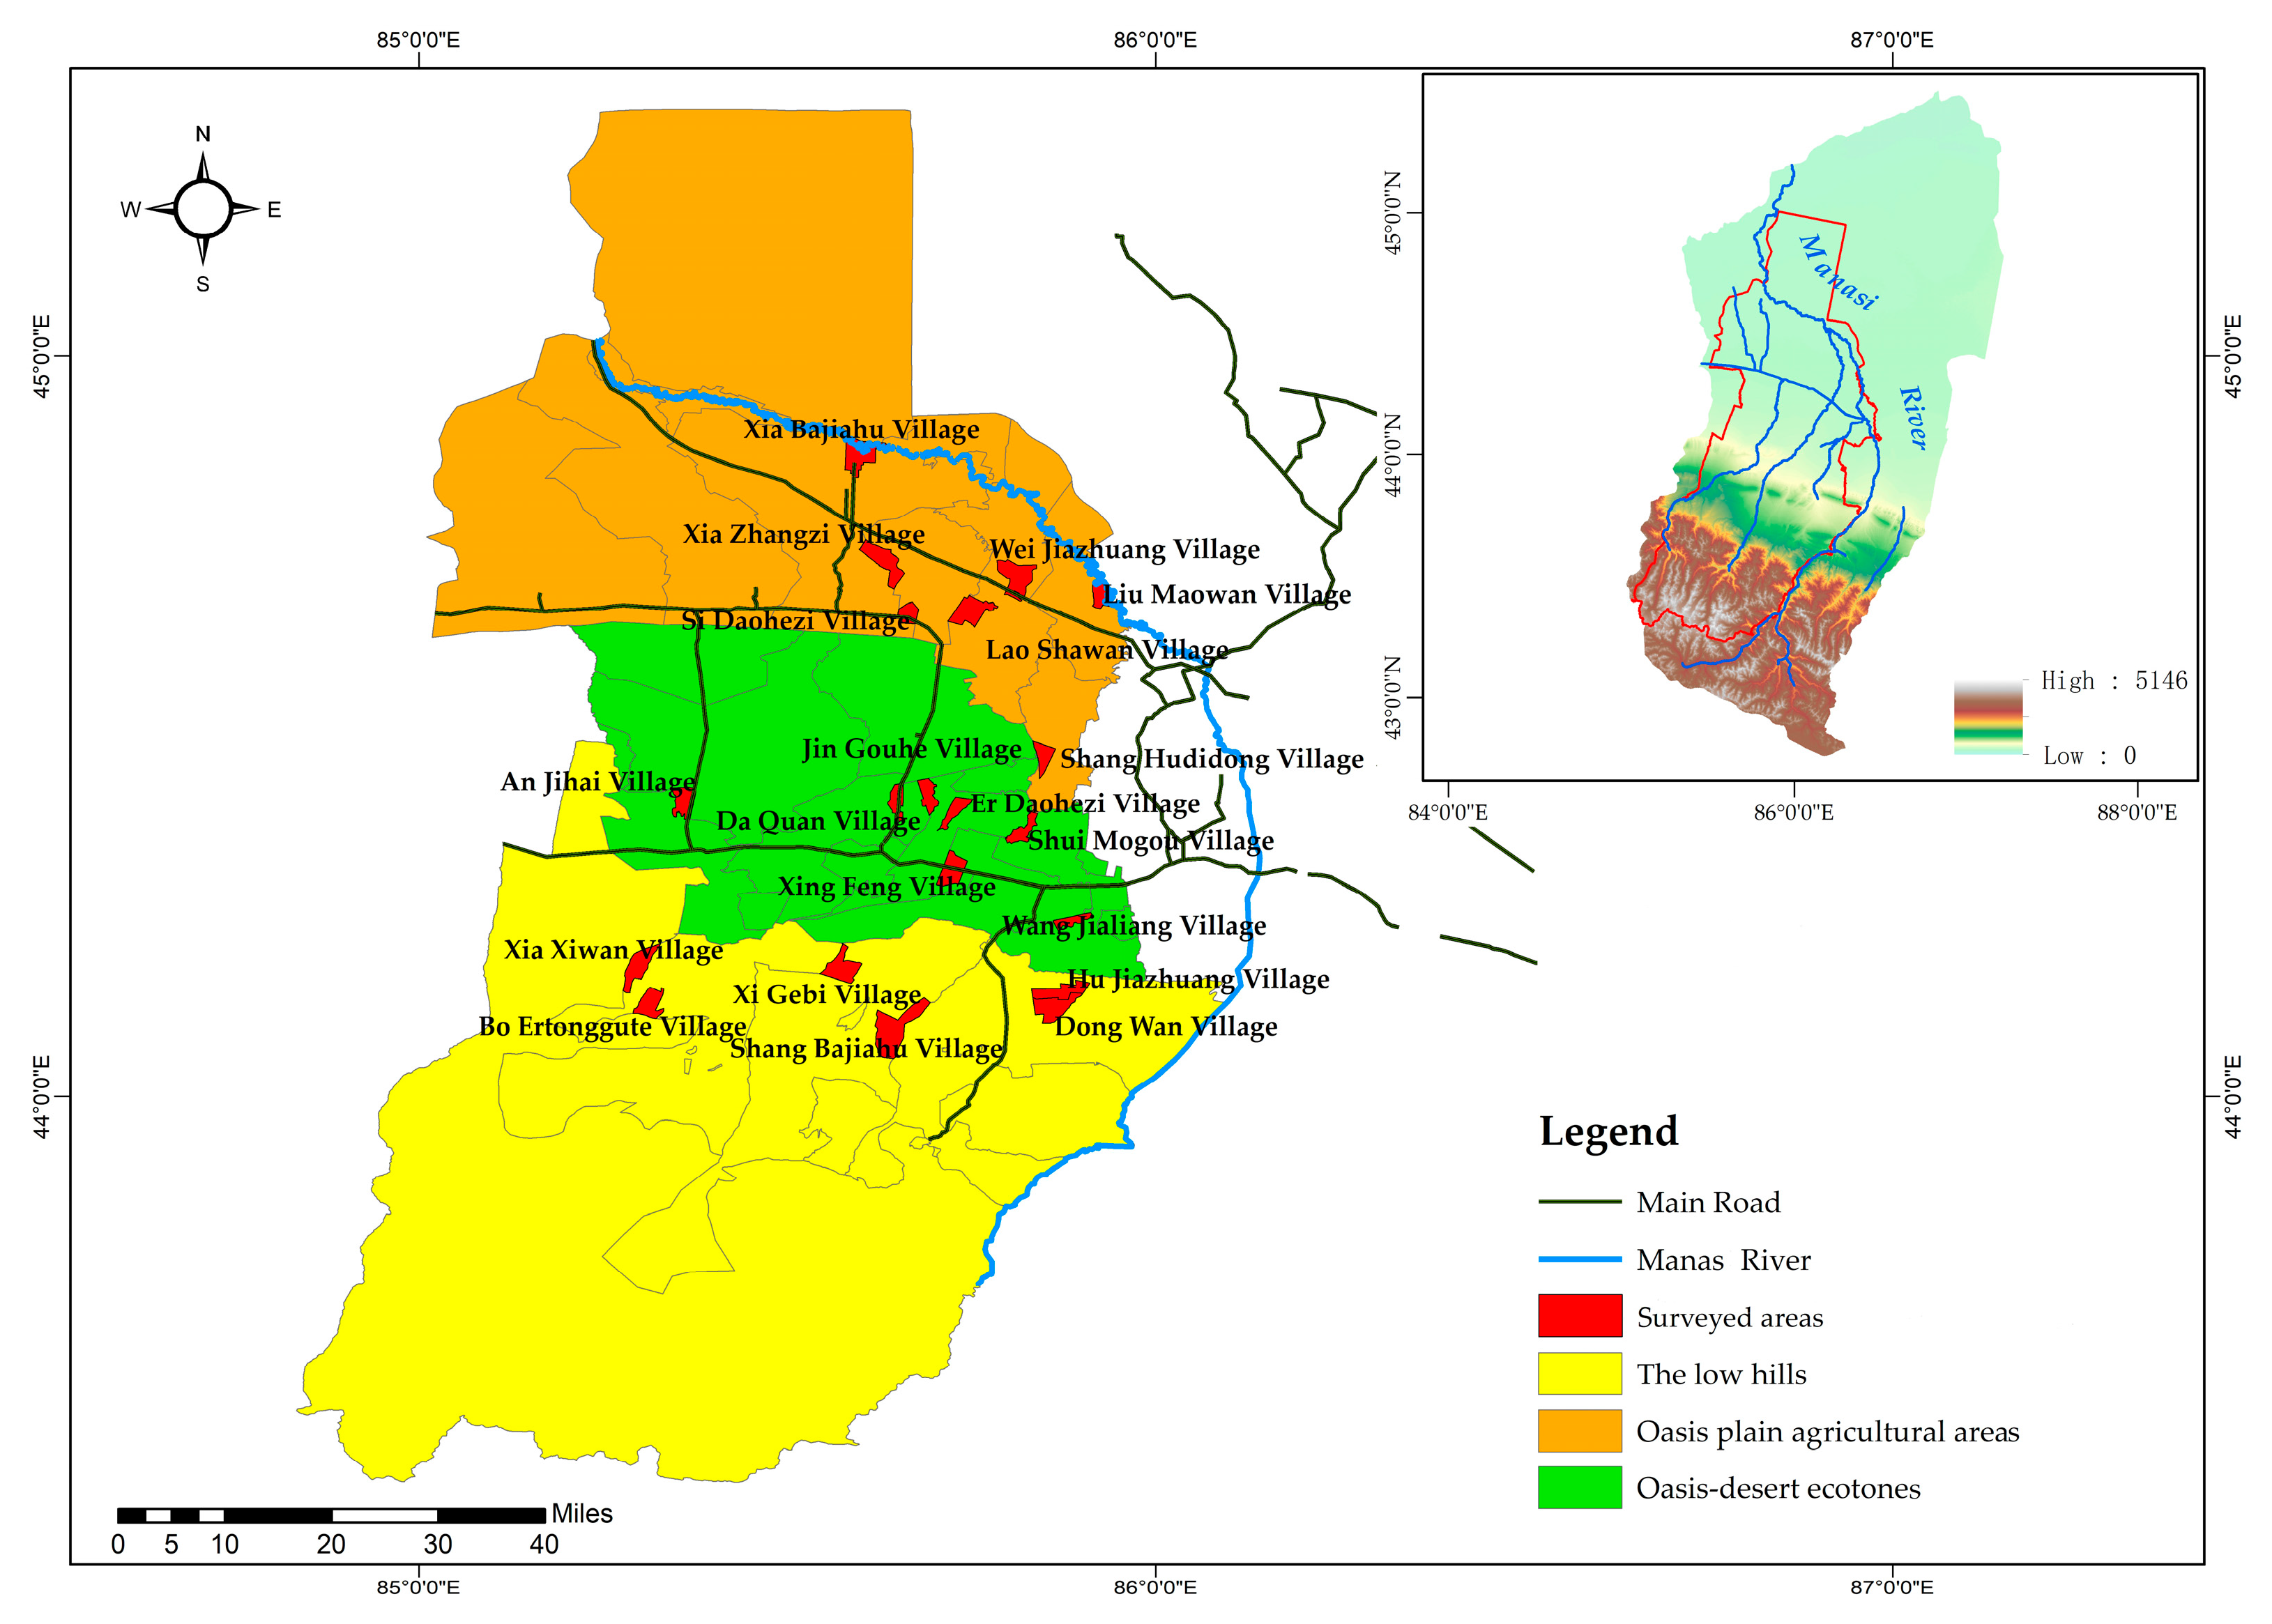
In order to obtain first-hand information, members of the research group completed the design of the questionnaire design on the agricultural land operation scale in Shawan City in early July 2019. The contents of the questionnaire mainly included basic information of farmers, agricultural land production input, and labor input, agricultural land operating area, crop output, economic benefits, and agricultural land circulation status. Due to the large number of villages in the region near Shawan City (241 administrative villages in total), 20 representative villages in different zones of the upper, middle, and lower reaches of the watershed were selected as typical samples, taking into account the completeness of data collection and the representativeness of typical land types (Figure 1).

Figure 1.
Spatial distribution of Shawan City.
The author and associates used the participatory rural appraisal (PRA) method, which is a semi structured research method in which a team of local staff and surveyors use a range of participatory work techniques to understand rural life and rural socioeconomic activities [29]. Emphasis is placed on the whole process of farmer participation, with team members using face-to-face surveys to extract a wide range of views from farmers, to listen more and talk less, not to induce farmers, and to encourage farmers to express their knowledge [30]. The use of this method makes the results actionable and easily accepted by farmers.
Interviews were conducted face-to-face with village cadres and farmers in 20 villages from 15 July to 9 August 2019. A total of 400 questionnaires were distributed, and 368 valid questionnaires were finally screened, including 56 in the low mountain hilly area, 148 in the oasis farming area, and 164 in the oasis–desert intersection.
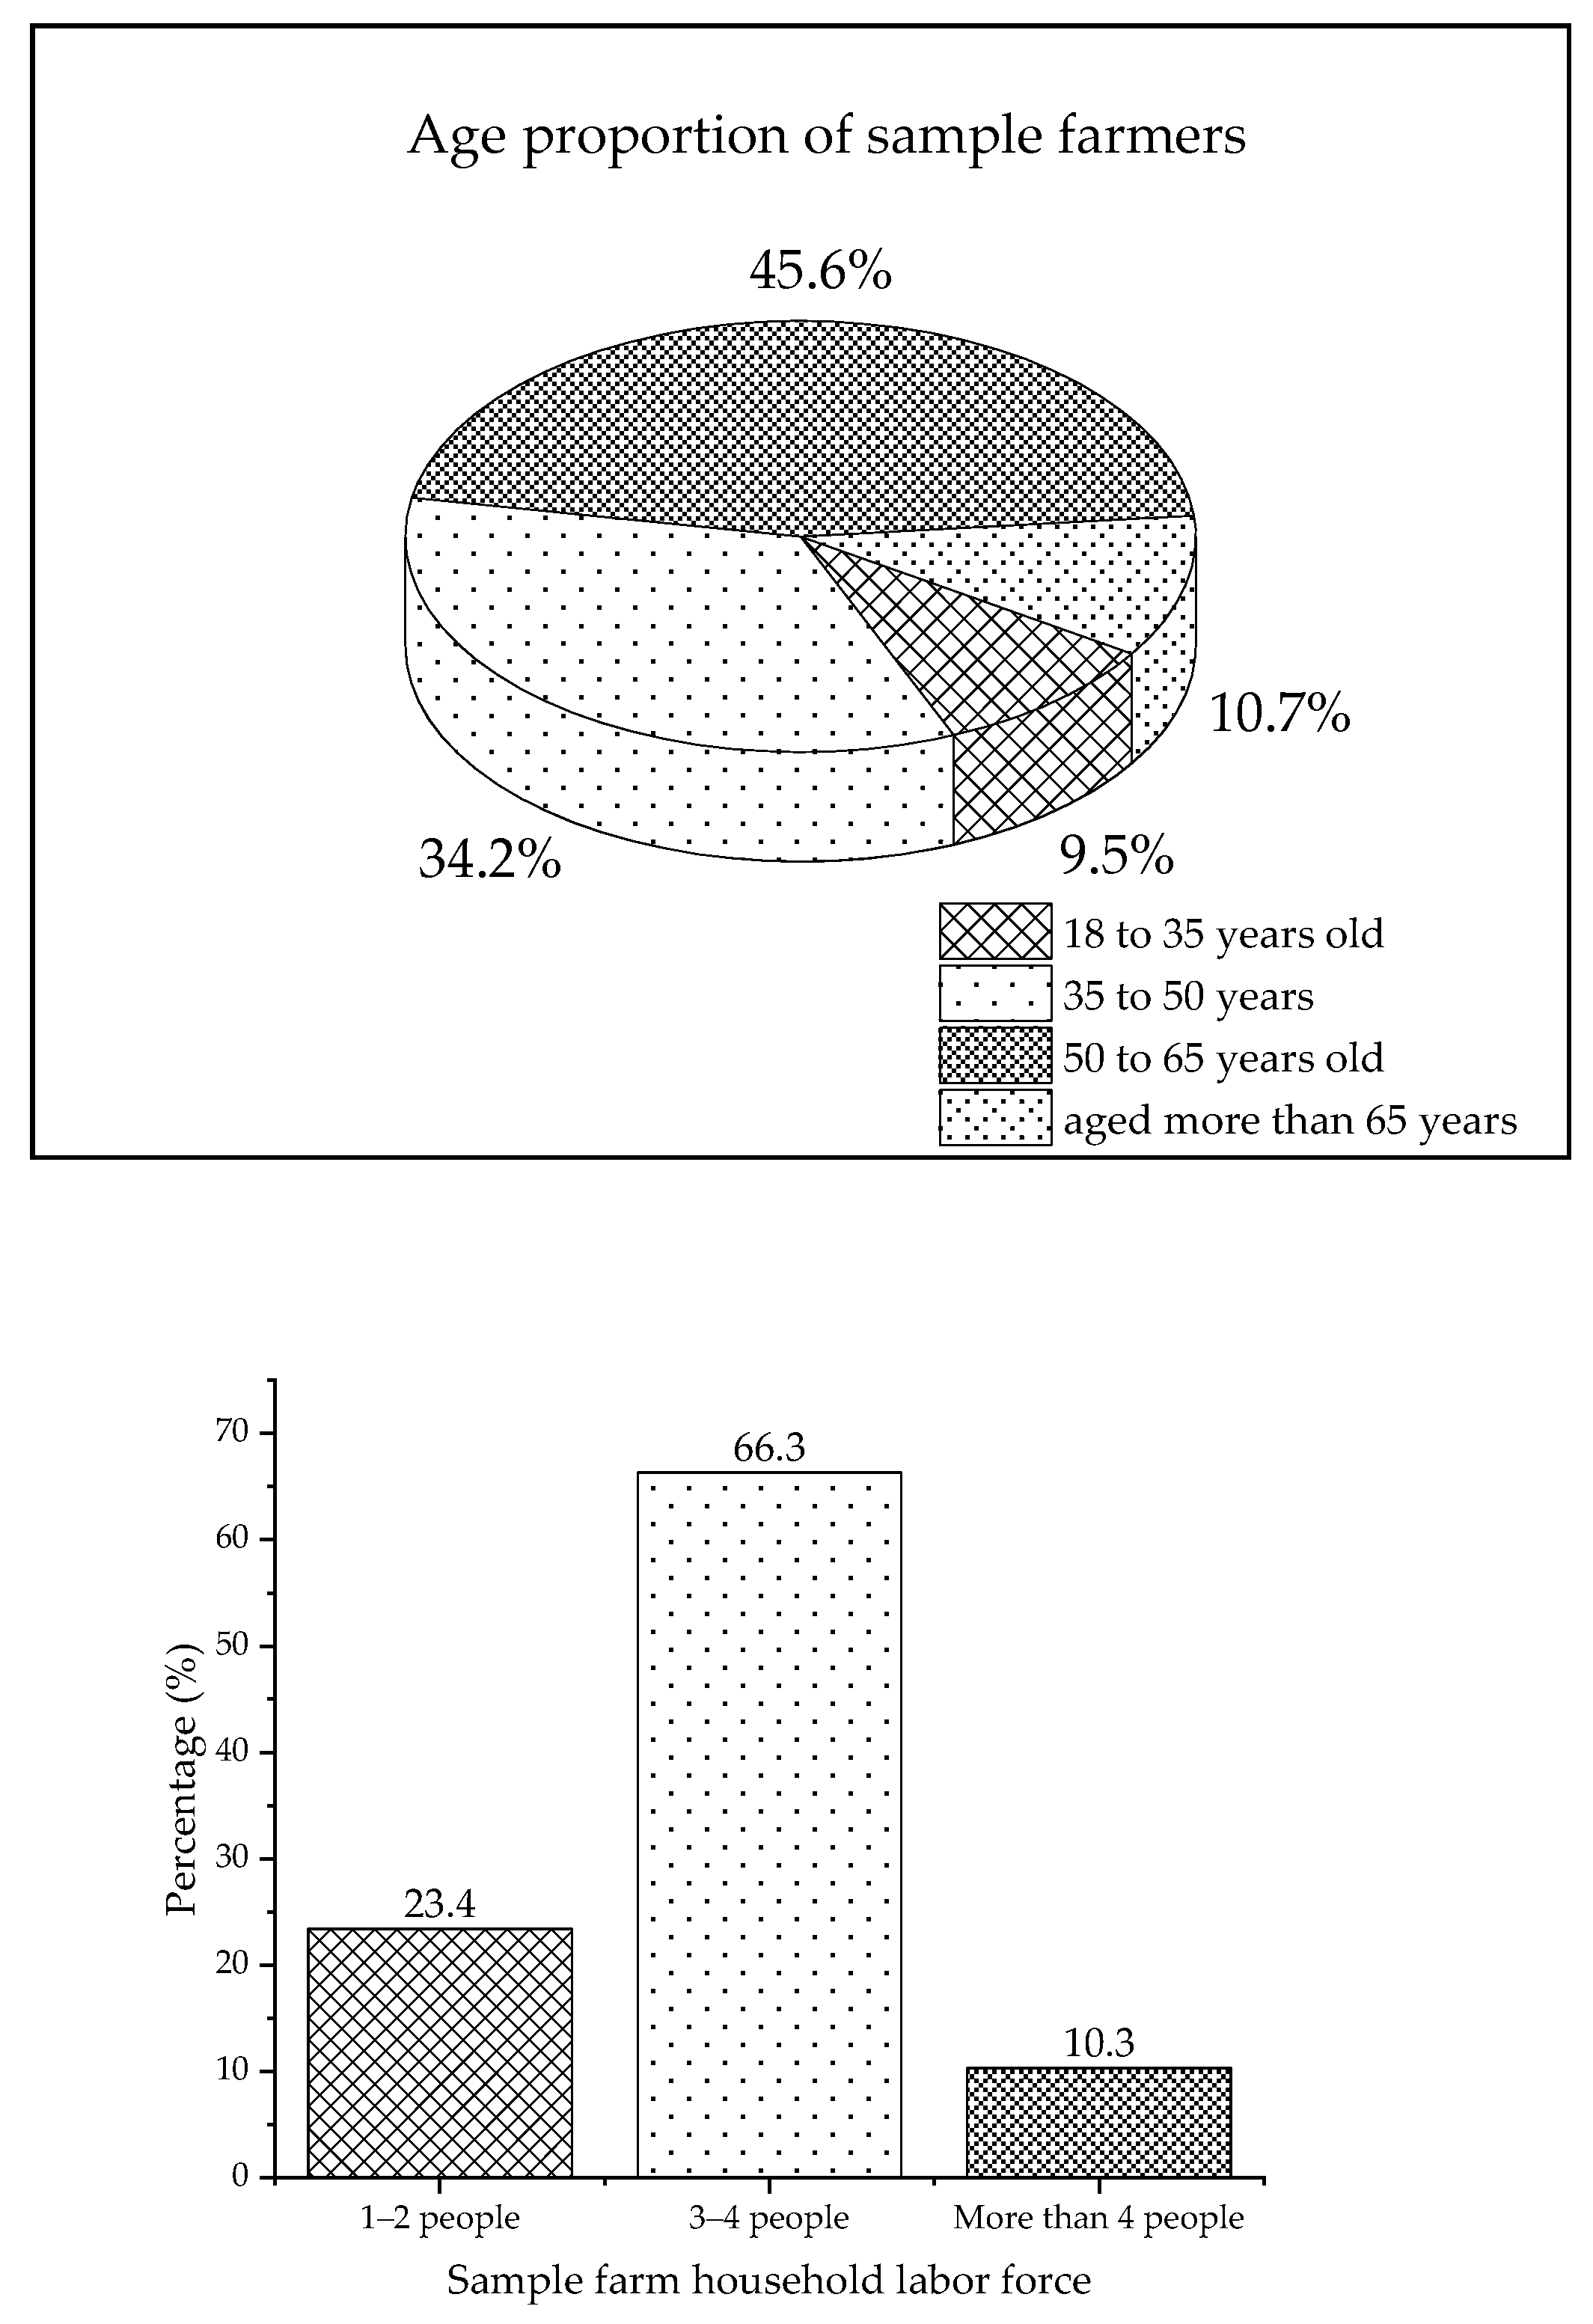
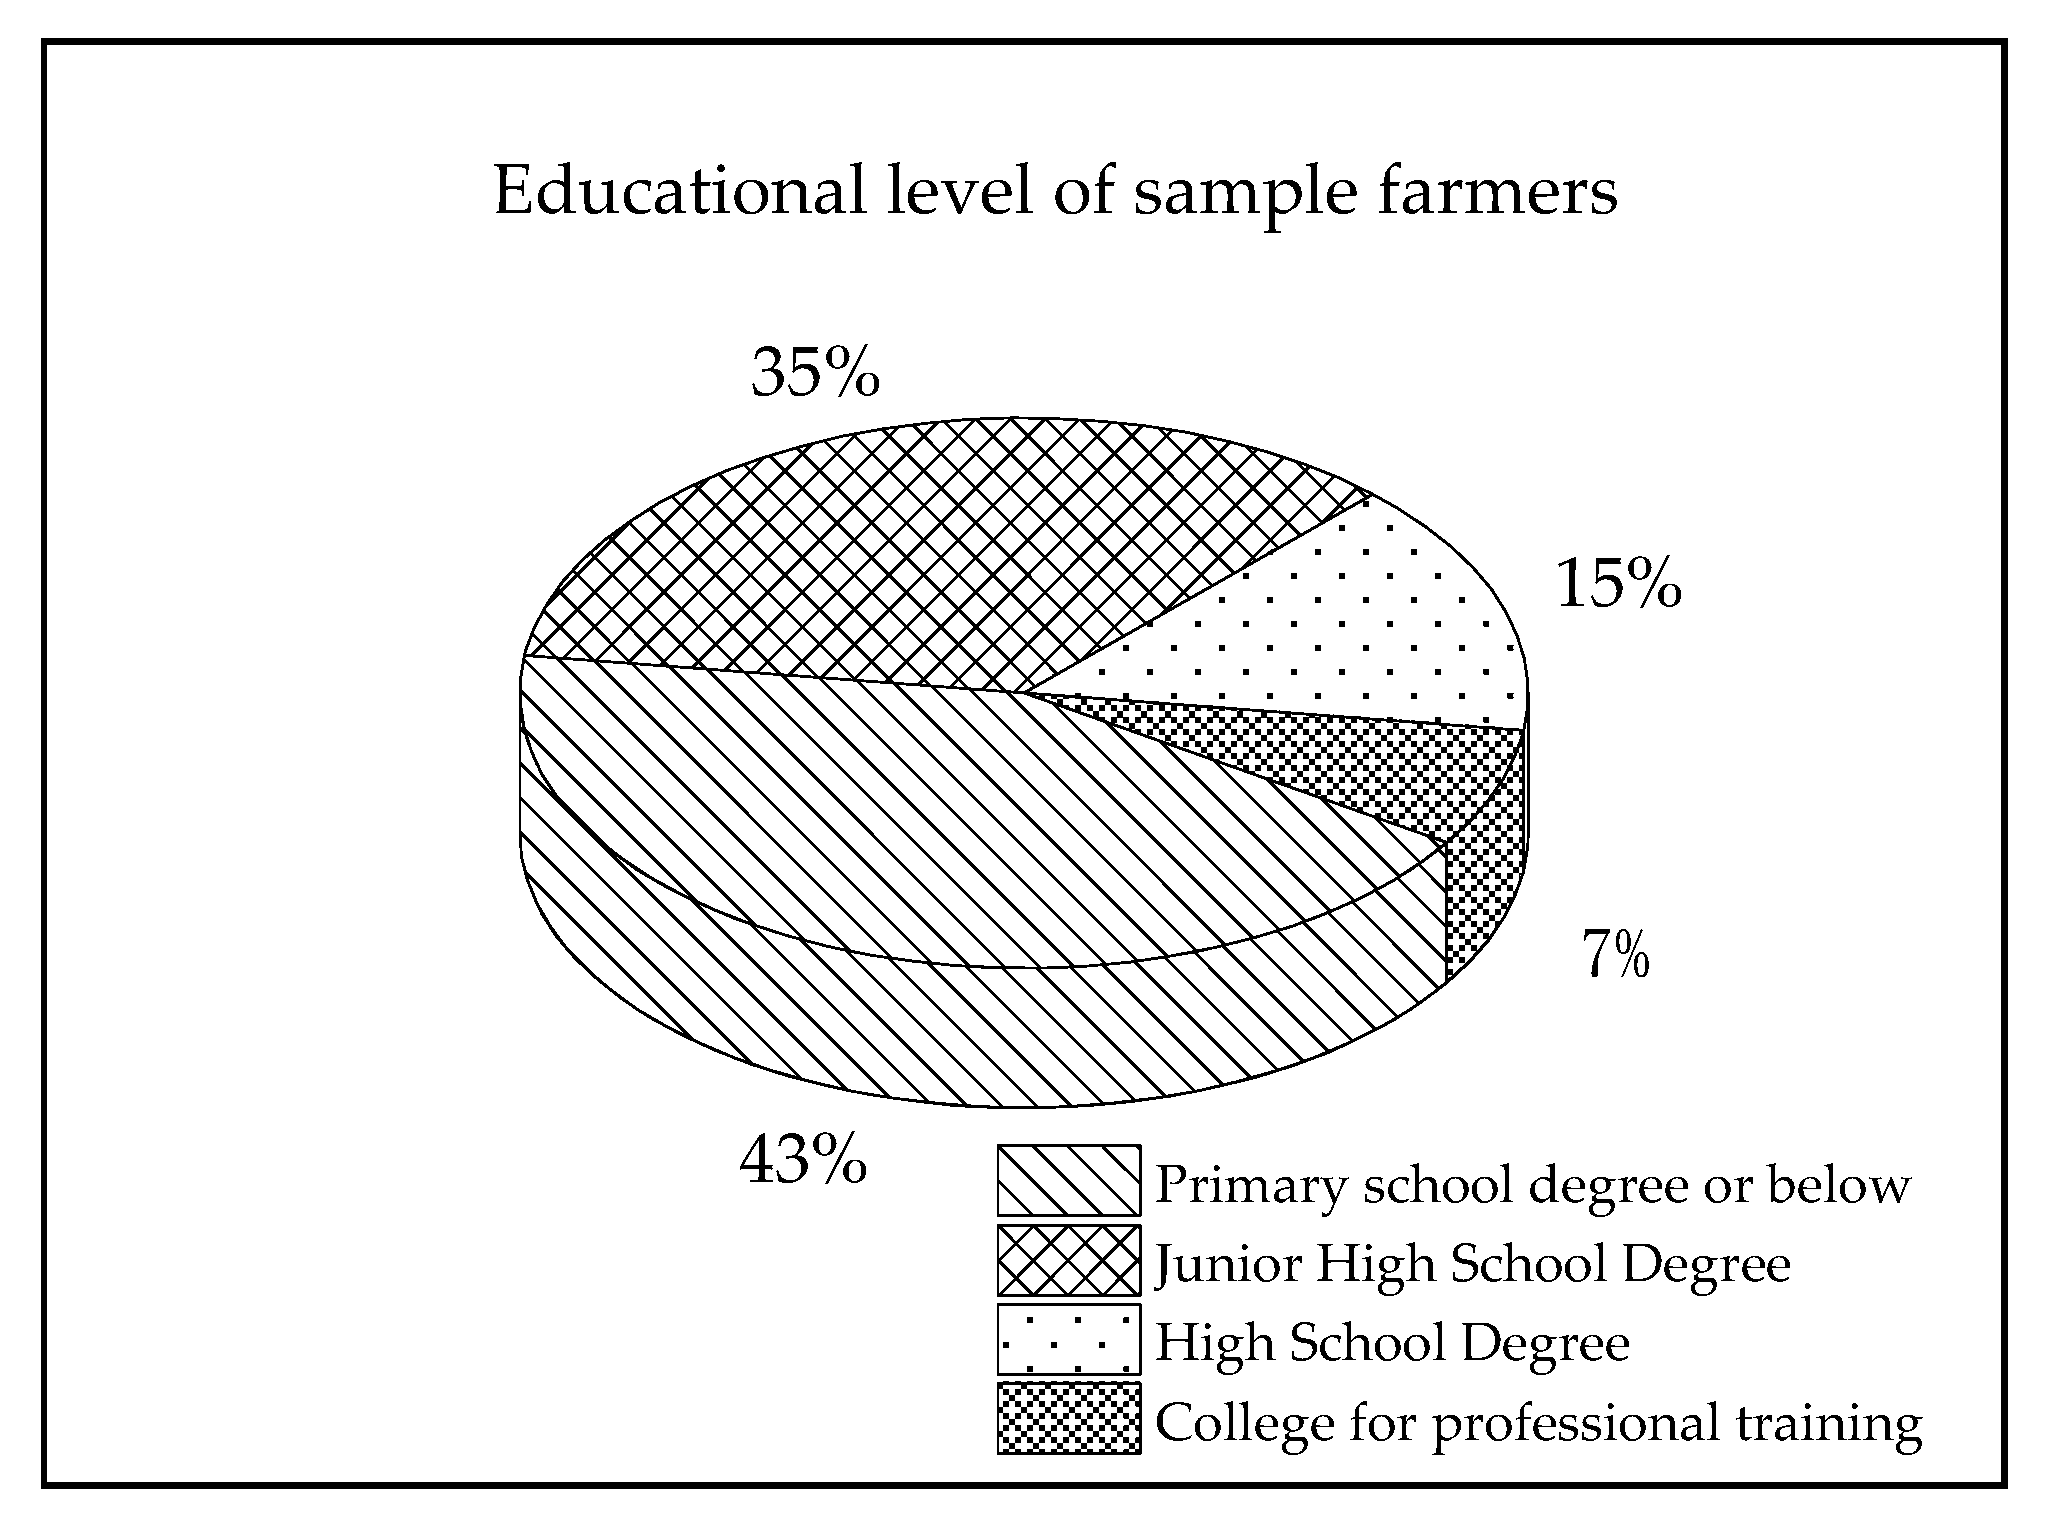
The household characteristics of farmers are shown in Figure 2. Farmers in the sample area were mainly 50–60 years old, accounting for 45.6% of the total sample. The education level was generally low: most of the rural households reported a highest education level attained as either junior high school or primary school education or below, accounting for 43% of the total sample. The majority of the workforce consisted of three to four people (two-generation families with a father and son), accounting for 66.3% of the total sample.
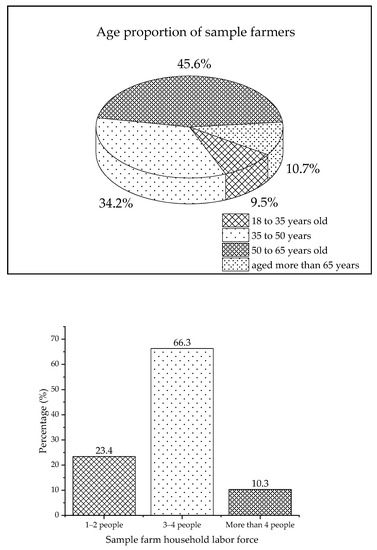
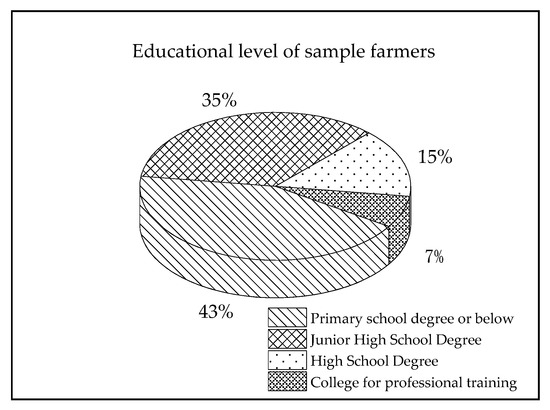
Figure 2.
Household status of sample farmers.
According to the survey, the per capita cultivated land area and the basic information of crop planting are shown in Table 1. The main capital investments of farmers included seeds, machinery and equipment input, water and electricity, pesticide and fertilizer, labor costs, and land transfer rent. Farmers’ income mainly included farmers’ income from farming, agricultural wages, and land transfer rent income. Due to the different natural conditions and operation modes in different regions, the input and output of agricultural land showed obvious differences. The natural conditions of the region affected the types and yield of crops, and the management mode affected the capital input. Based on a large number of questionnaire survey data, the yield, unit price, cost, and net income of the main crops in each area type are summarized below.

Table 1.
Statistical table of yield, unit price, cost, and net income of main crops planted in the sample area.
2.3. Research Methods
2.3.1. Household Average Moderate Scale Operations
The Cobb–Douglas production function is a function to measure the elasticity of production factors. The Cobb–Douglas production function was combined with land, labor, and capital factors in agricultural production, and a certain modification was made to build the following model [31,32,33,34]:
where TR represents the net income of the crop, P represents the market price of the crop, Y represents the total crop production, and C represents the total cost of agricultural production. L, K, and H represent labor input, capital, and land input, respectively. α, β, and γ represent the output elasticity coefficients of labour, capital, and land respectively. A is for all the other factors (climate, level of economic development, etc.) [35].
Here, w is the wage of labor, R is the price at which agricultural products are sold, and n is the rent of land.
By combining the above three formulas, the following formula is obtained:
Then, in order to pursue profit maximization:
Take the derivatives of L, K, and H, and make their reciprocal equal to zero, so:
By calculating the above formula, the equilibrium solution of the equation is:
The calculation formula of per capita moderate cultivated land area is [36,37]:
2.3.2. Moderate Scale Operation of the Total Arable Land Scale and Maximum Irrigated Arable Land
- (1)
- Regional moderate scale operation of the total arable land.
Based on the calculation of the average moderate-scale operation of each household, the total regional moderate-scale operation was calculated in order to compare it to the actual planting scale and control the total cultivated land area [2,38]. The actual planting scale was summarized by consulting the statistical yearbook, and the total moderate-scale operation planting was [39]:
where S is the total scale of moderate operation and planting, in ha; R is the total population, in people; Shj average area of cultivated land per household, in ha; and L is the household’s labor force.
- (2)
- The maximum scale of irrigated agricultural land allowed.
Considering the limitation of water and resource shortages in arid areas, the maximum irrigated area was introduced to control the cultivated area from the perspective of water resources limitation [40]. The total amount of agricultural water in Shawan was divided into the average irrigation quota of crops to determine the maximum arable area that could be irrigated. The calculation formula was [41,42]:
where G is the maximum irrigated area, in ha; N is the target value of agricultural water consumption set by Shawan City, in m3; W is the crop irrigation quota, in m3/ha; and Ssj is the actual total planting scale in Shawan City, in ha. Theoretically, in order to ensure the balance of soil and water, the actual planting area should be less than or equal to the maximum irrigation scale.
3. Results and Analysis
3.1. Moderate Business Scale for Each Household
Based on the Cobb–Douglas production function, the questionnaire was analyzed with Eviews v10.0. The estimated values of the α, β, and γ parameters of the Cobb–Douglas production function were obtained, and then the elasticity coefficient of agricultural land output was determined. According to the actual survey data, the local actual situation, and the data required by the sample, the values that did not meet the requirements were deleted, and the data required by the function were sorted by partition and classification, as follows: Y (agricultural production), L (the amount of labor in agricultural production), and K (capital inputs including chemical fertilizers, pesticides, irrigation water, contracted land rent, hired workers, and agricultural machinery); the numerical generation of H (grown) data was added into the equation as a system of linear equations, using the least squares fit to solve (Table 2). From the regression results, the R2 of all three regions was greater than 0.9, indicating a good fit of the model to the sample, while the p-value was less than 0.05, indicating that the regression effect was significant at the significance level of 0.05. The analysis of the results is meaningful.
Table 2.
C-D model parameter estimation table.
The results showed that when all the other factors (climate, economic development level, etc.) were 3.5323, the crop yield increased by 17.81%, 40.23%, and 51.61% for every 1% input of labor, capital, and land. When α + β + γ > 1, the present stage for increasing reward to total output was positively influence through continued input of labor, capital, and land. Land had the largest influence on the increase from input to output, under existing production technology. Expanding the scale of agricultural land and increasing capital investment would be conducive to increasing crop yield and improving farmers’ incomes. According to the field survey of the sample households in the hilly area, the average wage of the labor force in this area was 3500–4500 RMB/month, and the average land rent was 6750 RMB/ha. According to the formula above, the moderate per capita operating scale of this area was 1.72 ha.
Similarly, ln A = 2.3482, α = 0.1031, β = 0.3323, and γ = 0.6521 in the agricultural area of oasis plain, that is, when all other factors were 2.3482, the output elasticity of the labor force was 0.1031, the output elasticity of capital was 0.3323, and the output elasticity of land was 0.6521, which was an increasing return type. An increase in planted acreage had the largest impact on crop yield, followed by the amount of capital input. According to the field investigation of the sample households in the oasis agricultural area, the average wage of the labor force in this area was 5000–6000 RMB. Using the average of 5500 RMB, the average land rent of this area was 11,250 RMB/ha, and the moderate per capita operating scale of this area was 3.09 ha.
ln A = 1.4342, α = 0.1310, β = 0.2214, and γ = −0.6845 in oasis–desert ecotone. The sum of the output elasticity coefficient was 0.3321, less than 1, which belongs to the diminishing return type. The continuous input of the labor, capital, and land factors had a negative impact on the total output. In particular, the input of land had a great negative impact on the output. According to the field investigation of the sample households in the oasis–desert interlace area, the average wage of the labor force in this area was 4500–5000 RMB, the average land rent was 10,125 RMB/ha, and the moderate per capita operating scale was 2.58 ha.
The calculation results were far from scale of the land currently operated by farmers. Farmers in the low mountainous area currently operate 1.07 hm2 of arable land per capita, which was 0.65 hm2 less than the moderate scale, while farmers in the oasis farming area operated 1.09 hm2 less than the moderate scale, while farmers in the oasis–desert intersection operated 0.75 hm2 above the moderate scale. Therefore, this paper compares the overall moderate management scale of each region with the actual scale, and controls the moderate management scale of agricultural land in terms of total scale, so that this paper’s findings can be implemented in each region.
3.2. Total and Maximum Irrigation Scale for Regional Modest Operations
Using an equation to derive the total scale of moderate management of land in each district, the total scale of moderately managed land in the upstream low hill area was 60.38 thousand ha, the total scale of moderately managed land in the midstream plain agricultural area was 112.51 thousand ha, and the total scale of moderately managed land in the downstream oasis–desert interlacing area was 115,500 ha. By consulting the 2019 Xinjiang yearbook and the Shawan yearbook in Shawan City, where it is located, the cultivation area of each township in the upper, middle, and lower reaches was summarized, and the existing cultivated land areas in the upper low hill area, the middle plain agricultural area, and the lower oasis–desert interlacing area were 28,600, 47,700, and 188,400 ha, respectively.
As can be seen from Figure 3, the actual cultivation scale in the upstream low hill area of Shawan City was 31,780 ha less than the total scale of moderate management, the existing arable land area in the midstream plain farming area was 64,810 ha less than the total scale of moderate management, and the downstream oasis–desert intersection area and exceeded the total scale of moderate management by 72,900 ha.
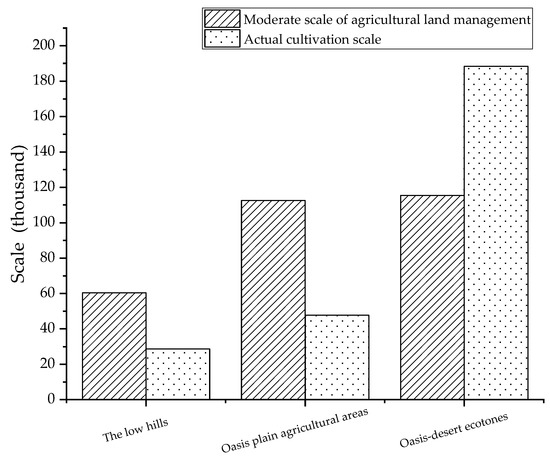
Figure 3.
Comparison between the total scale of moderate management and the actual planting scale.
The upstream and midstream areas have not yet reached the total moderate scale of management, and are thus “supplementary” scale areas. In order to increase the area of arable land to the appropriate scale of management, land consolidation measures should be vigorously implemented. According to Fan Zili et al. [43], the net arable land coefficient is 0.76 in the upstream low hills of Shawan, 0.82 in the midstream plain alluvial fan area, and 0.84–0.85 in the downstream oasis–desert interlacing area. The higher the net arable land coefficient, the lower the degree of arable land fragmentation. Specifically, the rugged terrain of the upper high mountainous areas and the excessive slope of most of the land make it unsuitable for large-scale cultivation, while the low mountainous, hilly, and oasis plain areas have a large amount of gap land and sandwiched wasteland between the various fields, thus requiring unified integration. In addition, there are a large number of field bumps, abandoned ditches, redundant roads, and reserved land at the heads of the fields (reserved land for machinery turning) within the field plots, and consolidating these fragmented plots into arable land could increase the area of arable land by 10–15% [43].
According to the 2019 Total Water Use Control Plan of Shawan City, the target value for agricultural water is 557.20 million m3. According to the Xinjiang Agricultural Water Quota standard (released in 2012), the crop types and areas of each township in Shawan City were counted, and the allowable irrigated area of Shawan City was 207,400 ha. Obviously, both the actual planting scale and the amount of land needed to meet moderate-scale operations exceeds the maximum allowable irrigation, making this area belong to the cultivation scale reduction zone. Compared with the upper and middle reaches, the cultivated land of the lower reaches has a larger adjustment space. Differing from the hilly area and the agricultural area of the oasis plain, which are limited by land shortage, the downstream oasis–desert cross area is the most serious area of groundwater overexploitation due to the great efforts of land reclamation in the early years. In the past 20 years, the overall rate of decline of the underground water table in Shawan City was 1.72 m/a [44]. As early as 2012, Xinjiang implemented land degradation and water reduction measures to reduce the unreasonable occupation of land and the use of water resources in order to solve the problem of groundwater overexploitation. While reducing the irrigated area, efficient water-saving irrigation measures were established to reduce agricultural water consumption and realize the sustainable utilization of groundwater resources. To protect the water and soil balance and decrease the over-exploitation of groundwater, the area downstream beyond the moderate scale area of 72,900 ha of arable land should actively implement the “back to decrease water” [45] protocol, particularly with respect to the groundwater in the “severe” area of cultivated land, which contains poor quality cultivated land and suffers from cultivated land salinization. It should be a priority to reduce the irrigated area to keep the balance of soil and water conservation, to ensure the ecological security of the area, and to achieve a moderate scale of operation [46].
4. Discussion
Although the research in this paper has achieved certain results, in view of the authors’ limited knowledge and the limited scope of the survey, there are still some elements to be improved.
- (1)
- It was difficult to obtain data on the production costs and returns of farmers in remote areas during the survey, making the sample size small, which may have led to some deviations in the results of measuring the scale of moderate agricultural land management. It is possible to establish an information monitoring system about agricultural production costs and returns and to develop cell phone software for agricultural production management information recording to lay the foundation for conducting long-term cost and return research on agricultural production.
- (2)
- This paper used the Cobb–Douglas production function to consider the moderate-scale agricultural land operations of farmers in the arid zone, but with the changing spatial and temporal conditions in the study area, agricultural production is also changing, so the effective application time of the derived parameters is short. Therefore, in a later study, we will select the agricultural production data of the study area for several consecutive years to accurately calculate the moderate-scale farmed agricultural land in the average state based on the long-term costs and returns of farmers.
5. Conclusions and Policy Recommendations
Based on the research data of 368 farmers, this paper used the Cobb–Douglas production function to calculate the appropriate scale of agricultural land and the total scale of moderate management in the upstream low hill area, the midstream oasis plain area, and the downstream oasis–desert interlacing area in Shawan City, and drew the following conclusions.
- (1)
- The appropriate scale of farming in the upstream low hill area is 5.15 ha, the appropriate scale of farming in the midstream oasis plain area is 9.28 ha, and the appropriate scale of farming in the downstream oasis–desert intersection area is 7.74 ha.
- (2)
- The total scale of moderate management in the upstream low hill area is 60,380 ha, the total scale of moderate management in the midstream oasis plain farming area is 112,510 ha, and the total scale of moderate management in the downstream oasis–desert intersection area is 115,500 ha.
The low mountainous and hilly areas and the oasis plain agricultural areas belong to supplementary-scale agricultural land. In order to promote these two regions to reach the appropriate scale of agricultural land management, we propose the following countermeasures and suggestions from the perspective of both people and land:
- (1)
- Develop agricultural knowledge and technology training to improve farmers’ management capacity. The field survey found that only 15.3 per cent of farmers had received technical training, while others were willing to receive training but had no way to do so, so there is a need to establish a three-tier agricultural technology and knowledge training institution at 1 city, 3 + 9 townships, and ‘N’ villages. In addition, experts can be invited to guide farmers in the field to solve planting problems, so that farmers can master planting techniques and become more motivated to contract more land and promote large-scale operations.
- (2)
- Cultivate two new types of agricultural business subjects. First, cultivate new young agricultural business subjects. In the actual survey, 62% of farmers were unwilling to transfer their land, and farmers had a strong sense of love for the land, while only 1/5 of the young laborers in the village chose to work in the city. The aging of the agricultural workforce is mainly due to the reluctance of young people to enter the land and of old people to leave the land. The government can guide them to work in the service industry, where they can take up less labor-intensive jobs. For the young laborers, the government needs to increase preferential policies so young people who return to their hometowns to work in agriculture can receive some preferential treatment. Secondly, the new business model is of business subjects. Cultivate and develop new business model subjects such as farmers’ professional cooperatives, leading agricultural enterprises, large agricultural households, and family farms, and allow all kinds of financial and private capital, social groups, and enterprises to participate in land transfer. Guide the development of new business subjects in the direction of social enterprise alliances and industrialized groups. Promote large-scale, organized, and market-oriented production in agriculture and improve the economic efficiency of agriculture.
- (3)
- Increase land transfer efforts. Break the siloed information model and realize the transparency of information on agricultural land transfer to promote smooth land transfers. In the sample area, 53% of the farmers transferred (contracted) land through third-party referrals with closed information on land transfer and no formal transfer procedures. Open and transparent information on land transfers would help to facilitate land transfers and thus achieve moderate-scale operations. The Shawan municipality can establish a unified management platform for land transfer and set up professional departments in each village to manage the transfer platform, whose main tasks would be to register information on land transferred by farmers, sign transfer agreements, and protect the interests of both parties involved in the transfer. A land transfer management app with real-time management can also be developed, to note and measure land information, allowing farmers to keep an eye on transfer dynamics. Such a standardized land transfer market is conducive to building a transparent land transfer price system, allowing farmers willing to contract or transfer to obtain first-hand information on the transfer, reducing transaction costs, allowing both sides of the transaction to become beneficiaries, and promoting the development of moderate-scale operations.
- (4)
- Develop modern agriculture and improve planting returns. Shawan City should actively cooperate with universities and research institutes to develop research on high-quality crop varieties. High-quality crop varieties, with their ability to adapt to bad weather and pest resistance, will greatly improve the yield of the harvest per unit area and will also reduce the cost of fighting diseases and pests. Secondly, innovative crop cultivation techniques and the full use of mechanized production will reduce production costs and increase the net returns of farmers’ cultivations. The increase in returns is a positive feedback effect, which will help farmers to expand their cultivation area and thus achieve moderate scale operation of agricultural land.
- (5)
- Reduce the fragmentation of arable land and strengthen land integration. Reducing fragmentation is carried out in terms of both agricultural infrastructure and arable land plots. According to the topography and natural conditions of the region, irregular fields, roads, and ditches would be broken up, and the layout of agricultural infrastructure would be reconstructed according to the principles of saving land, cost, and water. In addition, small plots of scattered land could be combined into large plots of land through land swaps, thus increasing the area of cultivated land and achieving a moderate scale of operation.
For the downstream areas, the arable land has exceeded the moderate scale of operation, and they should vigorously promote the retreat of land to reduce water guidelines; to carry this out requires staging from a pilot program through implementation, beginning with simple steps before the difficult ones, organized by type and batch. Under the basic conditions of the plot area, the number of electromechanical wells, and the quality of the arable land, we should first reduce the area of arable land by retiring (fallowing) non-30-year responsibility fields with serious groundwater overexploitation, poor quality of arable land, and a high degree of desertification. The reduction in arable land will also release more labor, and the farmers will be given compensation for the retired land while they being guided to engage in secondary and tertiary industries so that the income of the retired farmers will not be lower than their original income from agricultural production, so that the retired, zero rebound effect can be achieved.
Author Contributions
Conceptualization, X.Y.; methodology, Y.W., G.Y.; software, X.Y.; validation, X.Y.; formal analysis, G.Y.; investigation, F.L.; resources, Y.W.; data curation, X.Y.; writing—original draft preparation, X.Y.; writing—review and editing, Y.W., G.Y.; visualization, N.L.; supervision, Y.W.; project administration, Y.W., G.Y.; funding acquisition, Y.W. All authors have read and agreed to the published version of the manuscript.
Funding
This research was funded by the Shihezi University High-level Talents Research Start Project (Project Numbers: RCZK2018C41), and the Corps Key Areas of Science and Technology Research Program Projects (Project Number: 2021AB021).
Institutional Review Board Statement
Not applicable.
Informed Consent Statement
Not applicable.
Data Availability Statement
Not applicable.
Conflicts of Interest
The authors declare no conflict of interest.
References
- Zou, J.T.; Ma, D.F.; Liu, X.Q. Problem of scale economic quality of agricultural land management in China. Res. Agric. Mod. 2003, 24, 133–136. [Google Scholar]
- Wei, X.; Wang, N.; Luo, P.; Yang, J.; Zhang, J.; Lin, K. Spatiotemporal Assessment of Land Marketization and Its Driving Forces for Sustainable Urban–Rural Development in Shaanxi Province in China. Sustainability 2021, 13, 7755. [Google Scholar] [CrossRef]
- Wang, M.M.; Liu, Y.; Chen, S. Payoffs to scale, output profits and production costs in the perspective of agricultural moder-ate scale operation—A study based on 354 rice farmers in the Jianghan plain. J. Agrotech. Econ. 2017, 83–94. [Google Scholar] [CrossRef]
- Xu, Q.; Yin, R.L. Literature review on the issues of proper scale management of farmland in China. China Land Sci. 2010, 24, 75–81. [Google Scholar]
- Liu, L.H.; Liu, Y. A game-theory based research in the family farm to realize land moderate scale management. China Popul. Resour. Environ. 2018, 28, 150–157. [Google Scholar]
- Melland, A.; Fenton, O.; Jordan, P. Effects of agricultural land management changes on surface water quality: A review of meso-scale catchment research. Environ. Sci. Policy 2018, 84, 19–25. [Google Scholar] [CrossRef]
- Zhou, M.; Huang, S.L.; Zhang, Y.; Lin, J. Moderate scale of agricultural land management and its restraining factor in hei-longjiang province. J. Arid Land Resour. Environ. 2018, 32, 37–41. [Google Scholar]
- Han, J.; Liu, S.; Zhang, S.; Liu, Y. Influence of aging of agricultural labor force on large-scale management of land. Resour. Sci. 2019, 41, 2284–2295. [Google Scholar]
- Liu, Q.; Yang, W.J. Impacts of agricultural production services on land scale management: From the perspective of farmer’s behavior. J. China Agric. Univ. 2016, 21, 188–197. [Google Scholar]
- Wang, Y.H.; Li, X.B.; Xin, L.J.; Tan, M.H.; Li, W. The impact of farm land management scale on agricultural labor productivi-ty in china and its regional differentiation. J. Nat. Resour. 2017, 32, 539–552. [Google Scholar]
- Ichinose, Y.; Higuchi, H.; Kubo, R.; Nishigaki, T.; Kilasara, M.; Shinjo, H.; Funakawa, S. Adaptation of farmland management strategies to maintain livelihood by the Chagga people in the Kilimanjaro highlands. Agric. Syst. 2020, 181, 102829. [Google Scholar] [CrossRef]
- Berdegué, J.A.; Fuentealba, R. Latin America: The state of smallholders in agriculture. IFAD Conf. New Dir. Smallhold. Agric. 2011, 1, 1–37. [Google Scholar]
- Bojnec, S.; Latruffe, L. Farm size, agricultural subsidies and farm performance in Slovenia. Land Use Policy 2012, 32, 207–217. [Google Scholar] [CrossRef]
- Sumner, D.A. American Farms Keep Growing: Size, Productivity, and Policy. J. Econ. Perspect. 2014, 28, 147–166. [Google Scholar] [CrossRef] [Green Version]
- Zhang, H.M.; Song, G.; Gao, J. Moderate scale of farmers’ cultivated land: Stable production and income increase in Hei-longjiang province. J. Arid. Land Resour. Environ. 2018, 32, 23–29. [Google Scholar]
- Yang, G.Q.; Hu, L.; Wang, W.X. Moderate scale of farmers’ cultivated land management and its performance: An empirical analysis based on questionnaire survey of rural households in 6 counties in Hubei province. Resour. Sci. 2011, 33, 505–512. [Google Scholar]
- Wang, Z.P. Study on the Rational Planting Scale of Rice under Opportunity Cost: A Case Study of Heling Village in Linchuan District, Fuzhou City, Jiangxi Province. Available online: https://kns.cnki.net/kcms/detail/detail.aspx?dbcode=CMFD&dbname=CMFD202101&filename=1020366456.nh&uniplatform=NZKPT&v=yYlgIPhu5p%25mmd2FkzrOLrjKVwoQfv5s3lY6MTKYe8BsFw0n1N7SjQWIlaVUMAJXgoTGN (accessed on 12 September 2021).
- Wu, Z.P. A theoretical and empirical research on appropriate scale agricultural operation—A case study of rice planting scale in hunan province. Chin. Acad. Agric. Sci. 2011. [Google Scholar] [CrossRef]
- Wang, R. Studie on the Calculation of the Modeerate Land Management Scale and Its Influencing Factors from the Perspec-tive of Farmer. Available online: https://kns.cnki.net/kcms/detail/detail.aspx?dbcode=CJFD&dbname=CJFD2011&filename=NCJJ201103003&uniplatform=NZKPT&v=OFSD8lpMd6TAFhx1FVpXW5pqhFUX26%25mmd2FskgZKQ%25mmd2BPotrv6JLu1ab8c1g4pK9bsJAmc (accessed on 12 September 2021).
- Liu, X.P.; Han, T.K. Analysis on the moderate-scale eco-economy of the croplands in arid areas—A case study in Xinjiang. Arid Land Geogr. 2004, 431–436. [Google Scholar] [CrossRef]
- Liu, X.P.; Zhu, Y.T.; Luo, Q.S. Empirical analysis on the moderate scale of farmland in Xinjiang asis. J. Arid Land Resour. Environ. 2007, 75–80. [Google Scholar] [CrossRef]
- Yang, G.; Li, F.; Chen, D.; He, X.; Xue, L.; Long, A. Assessment of changes in oasis scale and water management in the arid Manas River Basin, north western China. Sci. Total. Environ. 2019, 691, 506–515. [Google Scholar] [CrossRef]
- Wei, G.H.; Zhang, L.C.; Jiang, Z.Y.; Xue, L.Q. Appropriate scale and stability of oasis in Aksu river basin. J. Arid. Land Resour. Environ. 2018, 32, 87–92. [Google Scholar]
- Hao, L.N.; Su, X.L. Determination for suitable scale of oasis and cultivated land in middle reaches of heihe river basin. Trans. Chin. Soc. Agric. Eng. 2015, 31, 262–268. [Google Scholar]
- Zhu, Y.; Luo, P.; Zhang, S.; Sun, B. Spatiotemporal Analysis of Hydrological Variations and Their Impacts on Vegetation in Semiarid Areas from Multiple Satellite Data. Remote. Sens. 2020, 12, 4177. [Google Scholar] [CrossRef]
- Bai, X.Y.; Liu, Y.K.; Yang, W.C.; Fu, J.X.; Li, Y.; Li, Z. Characteristics and attribution of vegetation coverage change in the Manas river basin, Xinjiang. J. Soil Water Conserv. 2020, 34, 192–197+210. [Google Scholar]
- Li, H.P.; Xu, L.P.; Guo, P.; Liu, L. Analysis of landscape pattern evolution characteristic and terrain gradient feature from 1990 to 2010 in the Manas river basin, Xinjiang. Res. Soil Water Conserv. 2015, 22, 273–278. [Google Scholar]
- Wei, H.; Xu, L.P.; Li, X.P.; Xue, K. Variation characteristics of vegetation coverage based on terrain factors in the Manas river basin. Chin. J. Agrometeorol. 2018, 39, 814–824. [Google Scholar]
- Hu, Y.C.; Wu, S.F.; Wang, J. Evaluation of farmers’ income effect in immigration regions of ecological resettlement project in Guangxi province. Trans. Chin. Soc. Agric. Eng. 2016, 32, 264–270. [Google Scholar]
- Liang, L.T.; Zhai, B. Environmental impacts of farmer households’ land use behaviors via the methods of PRA and LCA. China Land Sci. 2015, 29, 84–92. [Google Scholar]
- Battese, G.E. A note on the estimation of cobb-douglas production functions when some explanatory variables have zero values. J. Agric. Econ. 1997, 48, 250–252. [Google Scholar] [CrossRef]
- Houthakker, H.S. The Pareto Distribution and the Cobb-Douglas Production Function in Activity Analysis. Rev. Econ. Stud. 1955, 23, 27. [Google Scholar] [CrossRef]
- Vîlcu, G.E. A geometric perspective on the generalized Cobb–Douglas production functions. Appl. Math. Lett. 2011, 24, 777–783. [Google Scholar] [CrossRef] [Green Version]
- Singh, A.K.; Narayanan, K.; Sharma, P. Effect of climatic factors on cash crop farming in India: An application of Cobb-Douglas production function model. Int. J. Agric. Resour. Gov. Ecol. 2017, 13, 175. [Google Scholar]
- Wei, T. Impact of energy efficiency gains on output and energy use with Cobb–Douglas production function. Energy Policy 2007, 35, 2023–2030. [Google Scholar] [CrossRef]
- Yuan, C.; Liu, S.; Wu, J. Research on energy-saving effect of technological progress based on Cobb–Douglas production function. Energy Policy 2009, 37, 2842–2846. [Google Scholar] [CrossRef]
- Yuan, Z. Analysis of agricultural input-output based on Cobb–Douglas production function in Hebei Province, North China. Afr. J. Microbiol. Res. 2011, 5. [Google Scholar] [CrossRef]
- Lan, Y.; Xiong, B.Y.; Yi, Z.H. The dynamic mechanism of land management right circulation of family farm. Res. Agric. Mod. 2018, 39, 610–616. [Google Scholar]
- Snyder, S.A.; Kilgore, M.A. The Influence of Multiple Ownership Interests and Decision-Making Networks on the Management of Family Forest Lands: Evidence from the United States. Small-Scale For. 2017, 17, 1–23. [Google Scholar] [CrossRef]
- Khan, Z.I.; Ahmad, K.; Ashraf, M.; Parveen, R.; Bibi, Z.; Mustafa, I.; Noorka, I.R.; Tahir, H.M.; Akram, N.A.; Ullah, M.F.; et al. Risk assessment of heavy metal and metalloid toxicity through a contaminated vegetable (Cucurbita maxima) from wastewater irrigated area: A case study for a site-specific risk assessment in Jhang, Pakistan. Hum. Ecol. Risk Assess. Int. J. 2015, 22, 86–98. [Google Scholar] [CrossRef]
- Snyder, S.A.; Ma, Z.; Floress, K.; Clarke, M. Relationships between absenteeism, conservation group membership, and land management among family forest owners. Land Use Policy 2019, 91, 104407. [Google Scholar] [CrossRef]
- Glasnovic, Z.; Margeta, J. Maximum Area That Can Be Economically Irrigated by Solar Photovoltaic Pumping System. J. Irrig. Drain. Eng. 2009, 135, 44–49. [Google Scholar] [CrossRef]
- Fan, Z.L.; Yu, P.J.; Qiao, M.; Xu, H.L.; Zhang, P.; Zhang, Q.Q.; Fu, J.Y. Comprehensive improvement of cultivated land for ecological protection to agriculture in arid areas: A case of Manas river basin of Xinjiang. Arid Land Geogr. 2012, 35, 772–777. [Google Scholar]
- Liu, J.; Yang, P.N.; Kan, J.; Gao, Y.Y. Dynamic trend and driving factors of groundwater in shawan irrigated district under changing environment. Water Sav. Irrig. 2019, 53–58. [Google Scholar] [CrossRef]
- Zhang, Y.; Luo, P.; Zhao, S.; Kang, S.; Wang, P.; Zhou, M.; Lyu, J. Control and remediation methods for eutrophic lakes in the past 30 years. Water Sci. Technol. 2020, 81, 1099–1113. [Google Scholar] [CrossRef]
- Lyu, J.; Mo, S.; Luo, P.; Zhou, M.; Shen, B.; Nover, D. A quantitative assessment of hydrological responses to climate change and human activities at spatiotemporal within a typical catchment on the Loess Plateau, China. Quat. Int. 2019, 527, 1–11. [Google Scholar] [CrossRef]

Publisher’s Note: MDPI stays neutral with regard to jurisdictional claims in published maps and institutional affiliations. |
© 2021 by the authors. Licensee MDPI, Basel, Switzerland. This article is an open access article distributed under the terms and conditions of the Creative Commons Attribution (CC BY) license (https://creativecommons.org/licenses/by/4.0/).