Article

Constructing a Sustainable and Dynamic Promotion Model for Fresh Foods Based on a Digital Transformation Framework

1
Department of Marketing and Distribution Management, National Kaohsiung University of Science and Technology, Kaohsiung 824, Taiwan
2
College of Management, National Kaohsiung University of Science and Technology, Kaohsiung 824, Taiwan
3
Department of Information Management, Asia Eastern University of Science and Technology, New Taipei 220, Taiwan
*
Author to whom correspondence should be addressed.
Sustainability 2021, 13(19), 10687; https://doi.org/10.3390/su131910687
Submission received: 12 August 2021 / Revised: 21 September 2021 / Accepted: 23 September 2021 / Published: 26 September 2021

Abstract

:
The emergence of digital technology has compelled the retail industry to develop innovative and sustainable business models to predict and respond to consumer behavior. However, most enterprises are crippled with doubt, lacking frameworks and methods for moving forward. This study establishes a five-step decision-making framework for digital transformation in the retail industry and verifies it using real data from convenience stores in Taiwan. Data from residential type and cultural and educational type convenience stores, which together account for 75% of all stores, underwent a one-year simulation analysis according to the following three decision models for promotions: the shelf-life extended scrap model (SES), the fixed remaining duration model (FRD), and the dynamic promotion decision model (DPD). The results indicated that the DPD model reduced scrap in residential type stores by 12.88% and increased profit by 15.43%. In cultural and educational stores, the DPD model reduced scrap by 10.78% and increased profit by 7.63%. The implementation of the DPD model in convenience stores can bring additional revenue to operators, and at the same time address the problem of food waste. With the full use of resources, sustainable operation can be turned into a concrete and feasible management decision-making plan.

1. Introduction

The digital transformation triggered by the popularity of the Internet and related information technology is of global economic concern. According to the International Data Corporation (IDC) [1], global expenditure on digital transformation-related technologies and services amounted to USD 1.18 trillion and is expected to increase year on year to USD 1.97 trillion by 2023; this is indicative of a growth in demand. For enterprises, digital transformation has become an indispensable component of sustainable commerce [2]. To improve profitability, businesses should not only continue to retain consumers through business model changes and innovations [3], but also better understand the purchasing process of consumers by leveraging big data [4]. The formulation and implementation of digital transformation should be the main focus of digital organizations [5]. Related research, however, merely introduces the transformation strategies of certain enterprises without delineating a clear decision framework congruent with the transformation process [3,6]. Additionally, although some successful cases are outlined in the literature [5,7], specific examples to simulate and verify the benefits of digital transformation plans are lacking [8].
Around a third of the world’s food is lost or wasted annually [9]. There has been a significant change in the global perception of the problem. Food loss and food waste have indeed become an issue of great public concern. The 2030 Agenda for Sustainable Development reflects an increased global awareness of the problem. The objective of the Sustainable Development Goals is to halve per capita global food waste at retail and consumer levels by 2030 as well as reduce food losses along the production and supply chains. In Taiwan, the local Food and Drug Administration measured the yearly wastage of fresh food products at 30,000 metric tons, up to a third of which comes from convenience stores (CVS) and restaurants. Reducing such waste is a global public issue [10,11]. In response, many CVS in Taiwan have been striving to harness artificial intelligence (AI) and data science to predict sale volumes of fresh food products and reduce scrap.
However, because of variables such as the wide variety of fresh food products, the brief shelf life, and the sheer complexity of the task, those goals remain unattained. The changes in lifestyles and social structure have led to rising fresh food sales, and if existing methods for ordering and promotion continue, the problems will not be solved. This study focuses on residential and cultural and educational store types, collecting data from 19 August 2019, to 4 September 2020. Data content includes the sales date, sales period, sales quantity, and sales amount of 11 items among the four best-selling categories of fresh food products: salad, lunch, sushi hand rolls, and rice balls. The business hours of residential stores are 24 h, while cultural and educational stores are open from 7 a.m. to 12 p.m.
To address the challenges in terms of digital transformation and food waste, this study establishes a decision framework for digital transformation in the retail industry, and then constructs and verifies three promotion plans for fresh food products using real-world data. CVS sales data were employed to predict the quantities of eleven items among the four categories of fresh food commodities in residential, cultural, and educational CVS. The items included two items of salad, three items of lunch, two items of sushi hand rolls, and four items of rice balls. This study compiled a large amount of literature and theories related to digital transformation, and put forward a digital transformation decision-making framework suitable for the retail industry. However, most of the previous literature lacked empirical cases. Therefore, this study deals with the issue of the scrapping of fresh food to successfully verify that the digital transformation decision-making framework proposed by this research is indeed feasible and has significant benefits. The study also provides feasible and effective digital transformation decision suggestions for retailers.

2. Literature Review

2.1. Digital Transformation of the Retail Industry

Digital transformation has become a popular topic. Executives in all industries use digital advances such as analytics, mobility, social media, and smart embedded devices as well as improvements in traditional technologies, such as ERP, to enhance customer relationships, internal processes, and value propositions [12]. Two subjects for research on digital transformation are: the impact of digital transformation on society and enterprises [13] and the provision of strategies and models for enterprise transformation [3]. With the passage of time and evolution of technology, the definition of digital transformation has expanded to include the connections between information technology and emerging technologies in consumers and companies [2]. For example, digital technology is changing the structure of consumers and enterprises through social media and networks [14]. Digital transformation has begun to focus on the operational mode and organizational structure of enterprises. Digital transformation has also affected the business model, processes, relationships, and products of enterprises, and it can improve the performance and scale of enterprises [15]. Digital transformation as an enterprise changes the establishment of innovative business models, customer experiences, and operation models through information technology and the provision of innovative goods or services to customers [16]. In recent years, the impact of digital transformation has become more comprehensive. Emerging technologies and data not only change consumers and enterprises, but also the ecological circles of entire industries, including upstream and downstream businesses. Digital innovation has transformed the landscape of enterprise structures, practices, values, and beliefs as well as relationships between organizations, ecosystems, suppliers, and consumers [6]. With the development of e-commerce and virtual channels, consumers have shifted from physical channels to online channels and multi-channel communications [17]. In comparison to traditional physical channels, multiple channels try to provide consumers with a seamless experience, aiming to better meet their needs and increase purchase intention [18]. The rise of e-commerce, therefore, not only challenges the traditional retail industry’s existing norms, but creates opportunities for new businesses to enter the market while simultaneously exerting pressure on the existing industry to transform and raise their level of service. However, business strategies are not necessarily consumer-centric, which may result in a reduction in the quality of experience of the original physical stores and little improvement in the performance of e-commerce.
However, digital transformation in the retail industry has affected not only e-commerce but other sectors as well. Recently, the traditional retail industry has transformed itself into smart retail, adopting various technologies to assist consumers in their operations. For example, retailers have introduced self-service to reduce queuing times and electronic labels that can increase the stay time of consumers and clarify information on commodities and offers. Grewal et al. [19] proposed the following five key developments for the retail industry in the future: (1) accelerated decision-making by technology and tools, (2) decision direction provided by visual displays and commodity forms, (3) the relationship between consumption status and the degree of participation, (4) the collection and use of big data, and (5) data analysis and profitability. Accordingly, it can be asserted that the following three factors are important for the development of the retail industry: (1) placing consumers at the center, (2) the application of science and technology, and (3) the collection, analysis, and application of data.
With the development of the Internet, the application of global communication, and the emergence of new technologies such as artificial intelligence (AI), blockchain, big data, cloud computing, Internet of Things (IoT), network security, and robotics, the retail industry has gradually applied technology for digital transformation. Combined with new business models (such as subscription) and big data prediction analysis, these technologies not only have a profound impact on industry [20], but also change the shopping process of consumers [21]. With such powerful driving forces, digital transformation in the retail industry should only accelerate in the coming years. The retail industry is continually testing innovations to improve shopping experience [22]. Intelligent technology should enable users to learn from each other and create value between people and machines [23]. Accordingly, enterprises can apply technology to enhance customer experiences, create a higher quality of life for customers, and even transform business models to enhance the competitiveness of digital transformation. Enterprises should start from core values and be assisted by smart technology and posit that successful digital transformations will soon be realized [24]. For example, Amazon’s unmanned stores, Facebook’s popularity, Alibaba, Taobao and Tmall, and Apple’s services are all user-centered or customer-centered, assisted by big data and technology throughout the supply chain and other elements.

2.2. Digital Transformation in FamilyMart

Taiwan FamilyMart was founded in 1988. A joint venture between Japan FamilyMart and local enterprises, it is mainly engaged in the operation and development of convenience stores. FamilyMart led Taiwanese channel operators to launch a digital membership system in 2016. My FamiPay, a self-owned payment tool, was launched in 2017 and integrated with an app the following year so that payment, collection points, and invoice carriers could be integrated. The launch of the Technology Concept Store in 2018 was a concrete demonstration of FamilyMart’s digital transformation layout. It aimed at opening up the platform, making it more convenient for shop assistants and more fun for customers, and encouraging better interaction between the two. Table 1 outlines FamilyMart’s introduction and application of the new technology.
FamilyMart is not Taiwan’s largest convenience store. Even so, innovative digital applications have been continuously introduced in recent years, which have facilitated greater brand recognition and brought substantial benefits to the company. Continuous innovation has been integrated into the DNA of all colleagues.
Both Walmart and FamilyMart are constantly trying to introduce new types of intelligent technologies and apply innovative services. In the implementation process, consumers’ feedback, feelings, and various other data are continuously collected, analyzed, and integrated into policies and practices. Their examples illustrate a way to introduce innovative services into the digital transformation of the retail industry. Although these cases are brilliant, there is still a lack of rigorous digital transformation frameworks and verifiable transformation results for the retail industry to learn from.

2.3. Decision Frameworks for Digital Transformation

The literature on digital transformation lacks clear instructions and suggestions in terms of transformation architecture or decision steps. This study presents a decision framework for the digital transformation of the retail industry divided into five steps, as follows: (1) digital transformation business problem identification, (2) digital transformation goal identification, (3) digital transformation plan generation, (4) digital transformation plan evaluation, and (5) digital transformation plan implementation.

2.3.1. Digital Transformation Business Problem Identification

With the development of the Internet, the application of global communications, and the emergence of new technologies, an increasing number of retailers have realized the inevitability of change. The key to the success of enterprise transformation lies in the value proposition and operating mode of the enterprise [25]. Enterprises can deliver new value propositions to consumers through information regarding products and services or change the operating mode through the preferences and needs of consumers. Many factors drive enterprises to carry out digital transformation, including changes in the external environment, internal factors [26], extensive use of technology, competition, and changes in consumer behavior [27]. Nevertheless, regardless of the number or urgency of drivers, most enterprises find it difficult to devise a successful strategy for implementation and enforcement [26]. While enterprises may have an extensive understanding of the nature and influence of digital transformation, they struggle to put it into practice [15].
According to the commonly used decision process, the cross-industry standard process for data mining (CRISP-DM) [28], the first step is the understanding of business problems, used to understand goals and requirements and transform knowledge into the definition of problems. If this step is ignored, digital transformation may be futile, as it is impossible to provide correct answers to incorrect questions. Similarly, the first step in the BADIR process of data analysis is the business question [29]. The authors posited that wrong questions provide useless solutions, and the more direct the questions that address core business problems are defined, the faster the correct answers can be obtained.
To consider the many factors of digital transformation, this study defined the first step of the decision framework for digital transformation in the retail industry as digital transformation business problem identification. Enterprises have a great deal of data that can be analyzed, such as historical sales information, consumer behavior changes, and future development strategies [30]. They may examine their business model using quantitative and qualitative tools, such as business canvas, and thereby understand the behavior and intention of consumers through personas and consumer shopper journey maps. They may examine the forces driving the implementation of digital transformation, and in doing so, discover the key factors of success.

2.3.2. Digital Transformation Goal Identification

Drucker [31] advocates management by objectives, which aims to improve organizational performance by clearly defining joint goals and providing feedback on results. Enterprises are human-centric organizations, with all the inherent frailty that the term implies; therefore, attention should be paid when setting goals for the interaction between the desired achievements and the “human” to ensure that objectives and performance standards are appropriate. Drucker [31] proposed eight areas of goal setting to measure the impact on external and internal aspects. Through common SWOT (strengths, weaknesses, opportunities, and threats), five-force analysis, and other analysis tools, he helped enterprises delineate their own advantages and disadvantages to make full use of the existing resources. Maciariello [32] developed a practical system framework based on Drucker’s eight key areas that can help management confirm the goals and verify whether the company’s goals can achieve the expected results. In addition, enterprise goals need to be specific, measurable, achievable, and relevant to the company’s vision. Furthermore, a time limit should be set for completion because clear goals can help enterprises accurately and quickly generate and implement digital transformation plans. The framework of the decision problem builds on the decision goal because decision-makers can identify a direction for their efforts [33]. With goal management theory as the basis, this study defines the second step of the decision-making framework for digital transformation as digital transformation goal identification. Enterprises should express goals clearly, simply, and definitely to promote communication and cooperation between decision-makers and analysis teams.

2.3.3. Digital Transformation Plan Generation

Decision-making must proceed through practical plans for achieving goals and, accordingly, decision-makers should strive for decision-making objectives that enhance the advantages of the plans [33]. Enterprises can increase, expand, and redefine consumer experience value, create new operating modes through creation, utilization, and integration, and generate feasible plans to assist in digital transformation. According to CRISP-DM [28], enterprises should establish decision-making models by understanding and preparing data. Enterprises should transform their own information into enterprise knowledge to assist in subsequent decisions [30]. Data can provide accurate information for enterprises, facilitating faster and wiser decisions [34].
Scholars have differing views on the generation of digital transformation plans. For example, Von Leipzig et al. [3] first proposed a digital transformation plan based on the Plan Do Check Act (PDCA), and then metamorphosed that into something feasible and conducive to implementation. Goerzig et al. [6] envisaged strategies for digital transformation as a macro and micro cycle, developing a strategy based on business problems from which a feasible framework was obtained. They then generated structural feedback through the merging of ideas, tests, and comments to create a cycle of digital transformation strategy construction. The generation of digital transformation plans was divided into the following six steps [5]: (1) idea collection, (2) idea proposal, (3) development of effective proposal, (4) proposal into plan, (5) selection of effective plan, and (6) implementation. Enterprises should generate effective plans according to their goals and use emerging technologies and data to assist in generating multiple feasible plans. Only through the generation of plans can enterprises carry out digital transformation. Accordingly, this study defined the third step of the decision framework for digital transformation in the retail industry as digital transformation plan generation.

2.3.4. Digital Transformation Plan Evaluation

Each plan has particular advantages and disadvantages. According to CRISP-DM, plans should be thoroughly evaluated before deployment to ensure that they can deliver business objectives. With the purple decision analysis framework, Chien [33] proposed finding optimal decisions and implementations through comprehensive judgment and trade-off. Jain et al. [29] held that hypotheses should be established during the decision-making process because each hypothesis may be the answer to the initial business problem, and hypotheses, like the plan proposed in this study, should both suggest evaluation methods dependent upon the purpose and produce executable answers. Von Leipzig et al. [3] indicated that in the process of implementation, enterprises should evaluate the cost structure and business model of plans to ensure suitability, and then select those with greater benefits or lower costs. Of course, different standards for plan evaluation should be adopted for different business problems and purposes. Ailawadi et al. [35] discussed the relationship between promotion decisions and retailers’ performance and found that customer flow, sales level, growth rate, and gross profit rate are key performance indicators used to measure retailers. Accordingly, the evaluation of a digital transformation implementation should be based on past data measured against a standard, congruent with an enterprise’s goals. Through simulation or small-scale tests of multiple plans in the market, the expected results are obtained (or not), and the advantages and disadvantages are evaluated. This, in turn, establishes a standard for subsequent selection by other enterprises. Accordingly, this study defined the fourth step of the decision framework for digital transformation in the retail industry as digital transformation plan evaluation.

2.3.5. Digital Transformation Plan Implementation and Review

According to the CRISP-DM, the final step of the data mining process is implementation. Alternatively, Chien [33] proposed in his analysis framework that the final step in decision-making is decision plus implementation, arguing that decision-making itself cannot exert an effect and can only achieve goals and results through implementation. Von Leipzig et al. [3] developed a conceptual model for digital transformation and the maintenance of competitiveness for customer-oriented enterprises in which implementation is the final step. Likewise, Chanias et al. [5] developed digital transformation strategies for pre-digital organizations, proposing a framework for strategy formulation in which implementation is the final step. Accordingly, this study defined the fifth and final step of the decision framework for digital transformation in the retail industry as digital transformation plan implementation.
In addition, once complete, implementations should be reviewed and judged in terms of the business problems identified in Stage 1. If results do not achieve goals and are open to adjustment and revision, the process from data, information, knowledge, and analysis to the final confirmed information value should be re-examined according to the process of the information value chain [30]. Maciariello [32] indicated that decision-making systems must include a feedback system to test the performance. Plans that are not as effective as expected should be re-examined and feedback should be gathered. Chien [33] declared that decision-making and the external environment are not static for enterprises, so the selection and implementation of decision-making plans should be flexible. With feedback and flexibility in selection and implementation, a plan can be revised and adjusted accordingly.
The decisions and actions of enterprises will produce a great deal of commercial value and additional data [36], and these achievements, good or bad, are important experiences from which companies may gain valuable wisdom for future applications. Figure 1 illustrates the decision-making framework for digital transformation in the retail industry with reference to the literature.

3. Verification Method of Digital Transformation Decision Architecture

The following subsection takes the decision framework for the digital transformation of the retail industry compiled in Section 2.3 and verifies it by collecting data from CVS in Taiwan.

3.1. Digital Transformation Business Problem Identification

The problem of excessive or insufficient orders for fresh food products has been perplexing for convenience store franchisers and franchisees for many years. Recently, changes in lifestyles and social structure have led to rising fresh food sales, and if existing methods for ordering and promotion continue, the problems will not be solved. There are ten types of CVS, among which residential and cultural and educational account for 60% and 15% of all stores, respectively. These two types of stores are open 24 h a day, but the other eight types of stores are not necessarily open 24 h a day. Furthermore, the residential and cultural and educational stores will account for 87% of total sales in 2020, the simulation models of this study are representative. This study focuses on these two main store types, collecting data from 19 August 2019, to 4 September 2020. Data content includes the sales date, sales period, sales quantity, and sales amount of 11 items among the four best-selling categories of fresh food products: salad, lunch, sushi hand rolls, and rice balls. The business hours of residential stores are 24 h, while cultural and educational stores are open from 7 a.m. to 12 p.m.

3.2. Digital Transformation Goal Identification

The dilemma of CVS with regard to fresh food products can be divided into internal and external aspects. Internal problems include food waste, loss of operating profits, and an increase in management costs. External problems include social perception, environmental friendliness, and corporate social responsibility (CSR). Solving the problem related to fresh food commodities can not only improve the performance and cost of operations, but also fulfill CSR. The goals of digital transformation should be specific, measurable, and achievable. Accordingly, in this study, the goals of the case enterprise are to (1) reduce the amount of fresh food scrap and (2) increase profit.

3.3. Digital Transformation Plan Evaluation

This study simulates and compares three promotions (or discount) plans for fresh food products as they approach expiration: the shelf-life extended scrap (SES) model, the fixed remaining duration (FRD) model, and the dynamic promotion decision (DPD) model. The situation conditions, supply, demand, and decision variables for evaluation are as follows:

3.3.1. Variable Description

  • Description of supply variables: Sales data were predicted by a machine learning algorithm, and the result was delineated as the order quantity of the four fresh food products. After the plan passed through the test, the final prediction model was the supply quantity predicted by the SVM model.
  • Description of demand variables: Sales data conditional upon no promotion from 19 August 2019 to 30 November 2019 were collected to fit the sales distribution that had not been promoted before 5 p.m. through the simulation software @ risk. Additionally, sales data conditional upon promotion from 1 December 2019 to 4 September 2020 at a fixed time (5 p.m.) were collected to fit the sales distribution under the promotion after 5 p.m. through the simulation software @ risk.
  • Decision variable description: Each plan underwent a one-year simulation experiment. The supply amount for each day was predicted according to the previous sales volume, weather, and other influencing variables. Plans were evaluated using two indicators: scrap amount and profit. The variables are explained in Table 2.

3.3.2. Plan Scenario Description

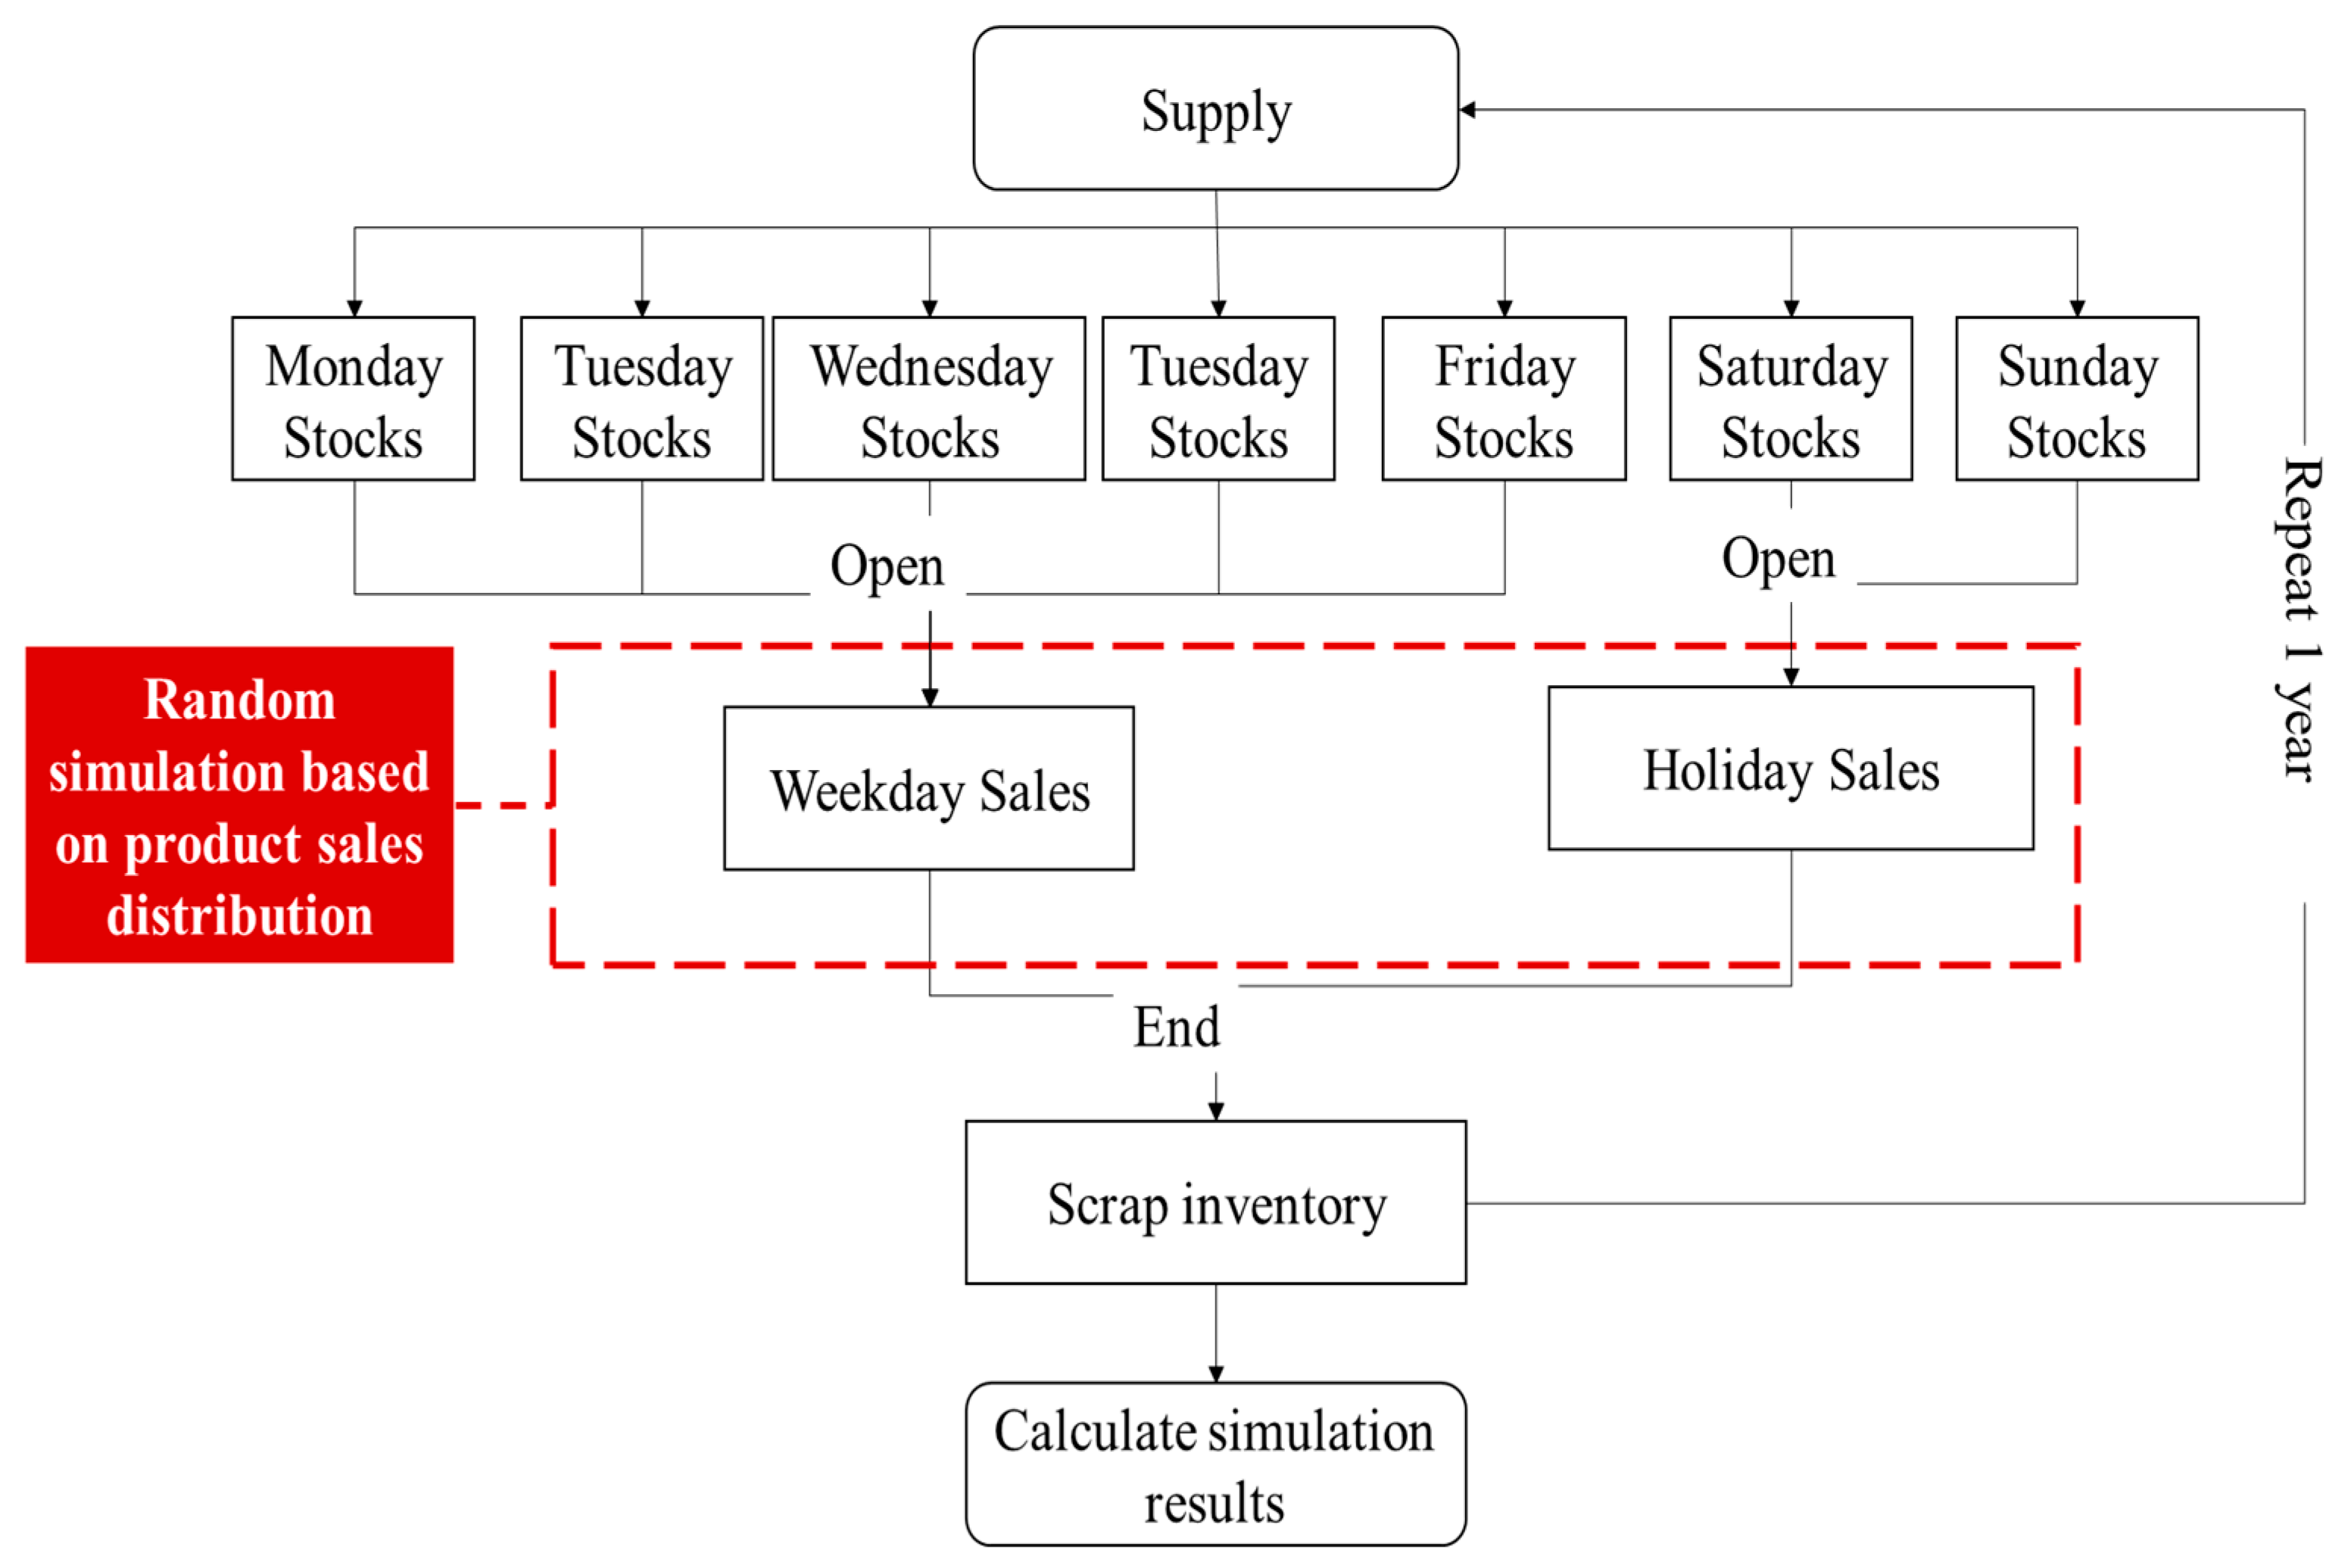
  • SES model: All fresh food products have a designated shelf life. As soon as shelf life expires, products are removed from shelves and scrapped without discount promotion.
    Q 1 = j = 1 m i = 1 n ( O n j S O n j S L n j R n j )
    P 1 = j = 1 m i = 1 n [ ( S O n j + S L n j ) × ( A P n j A C n j ) C P n j × Q 1 ]
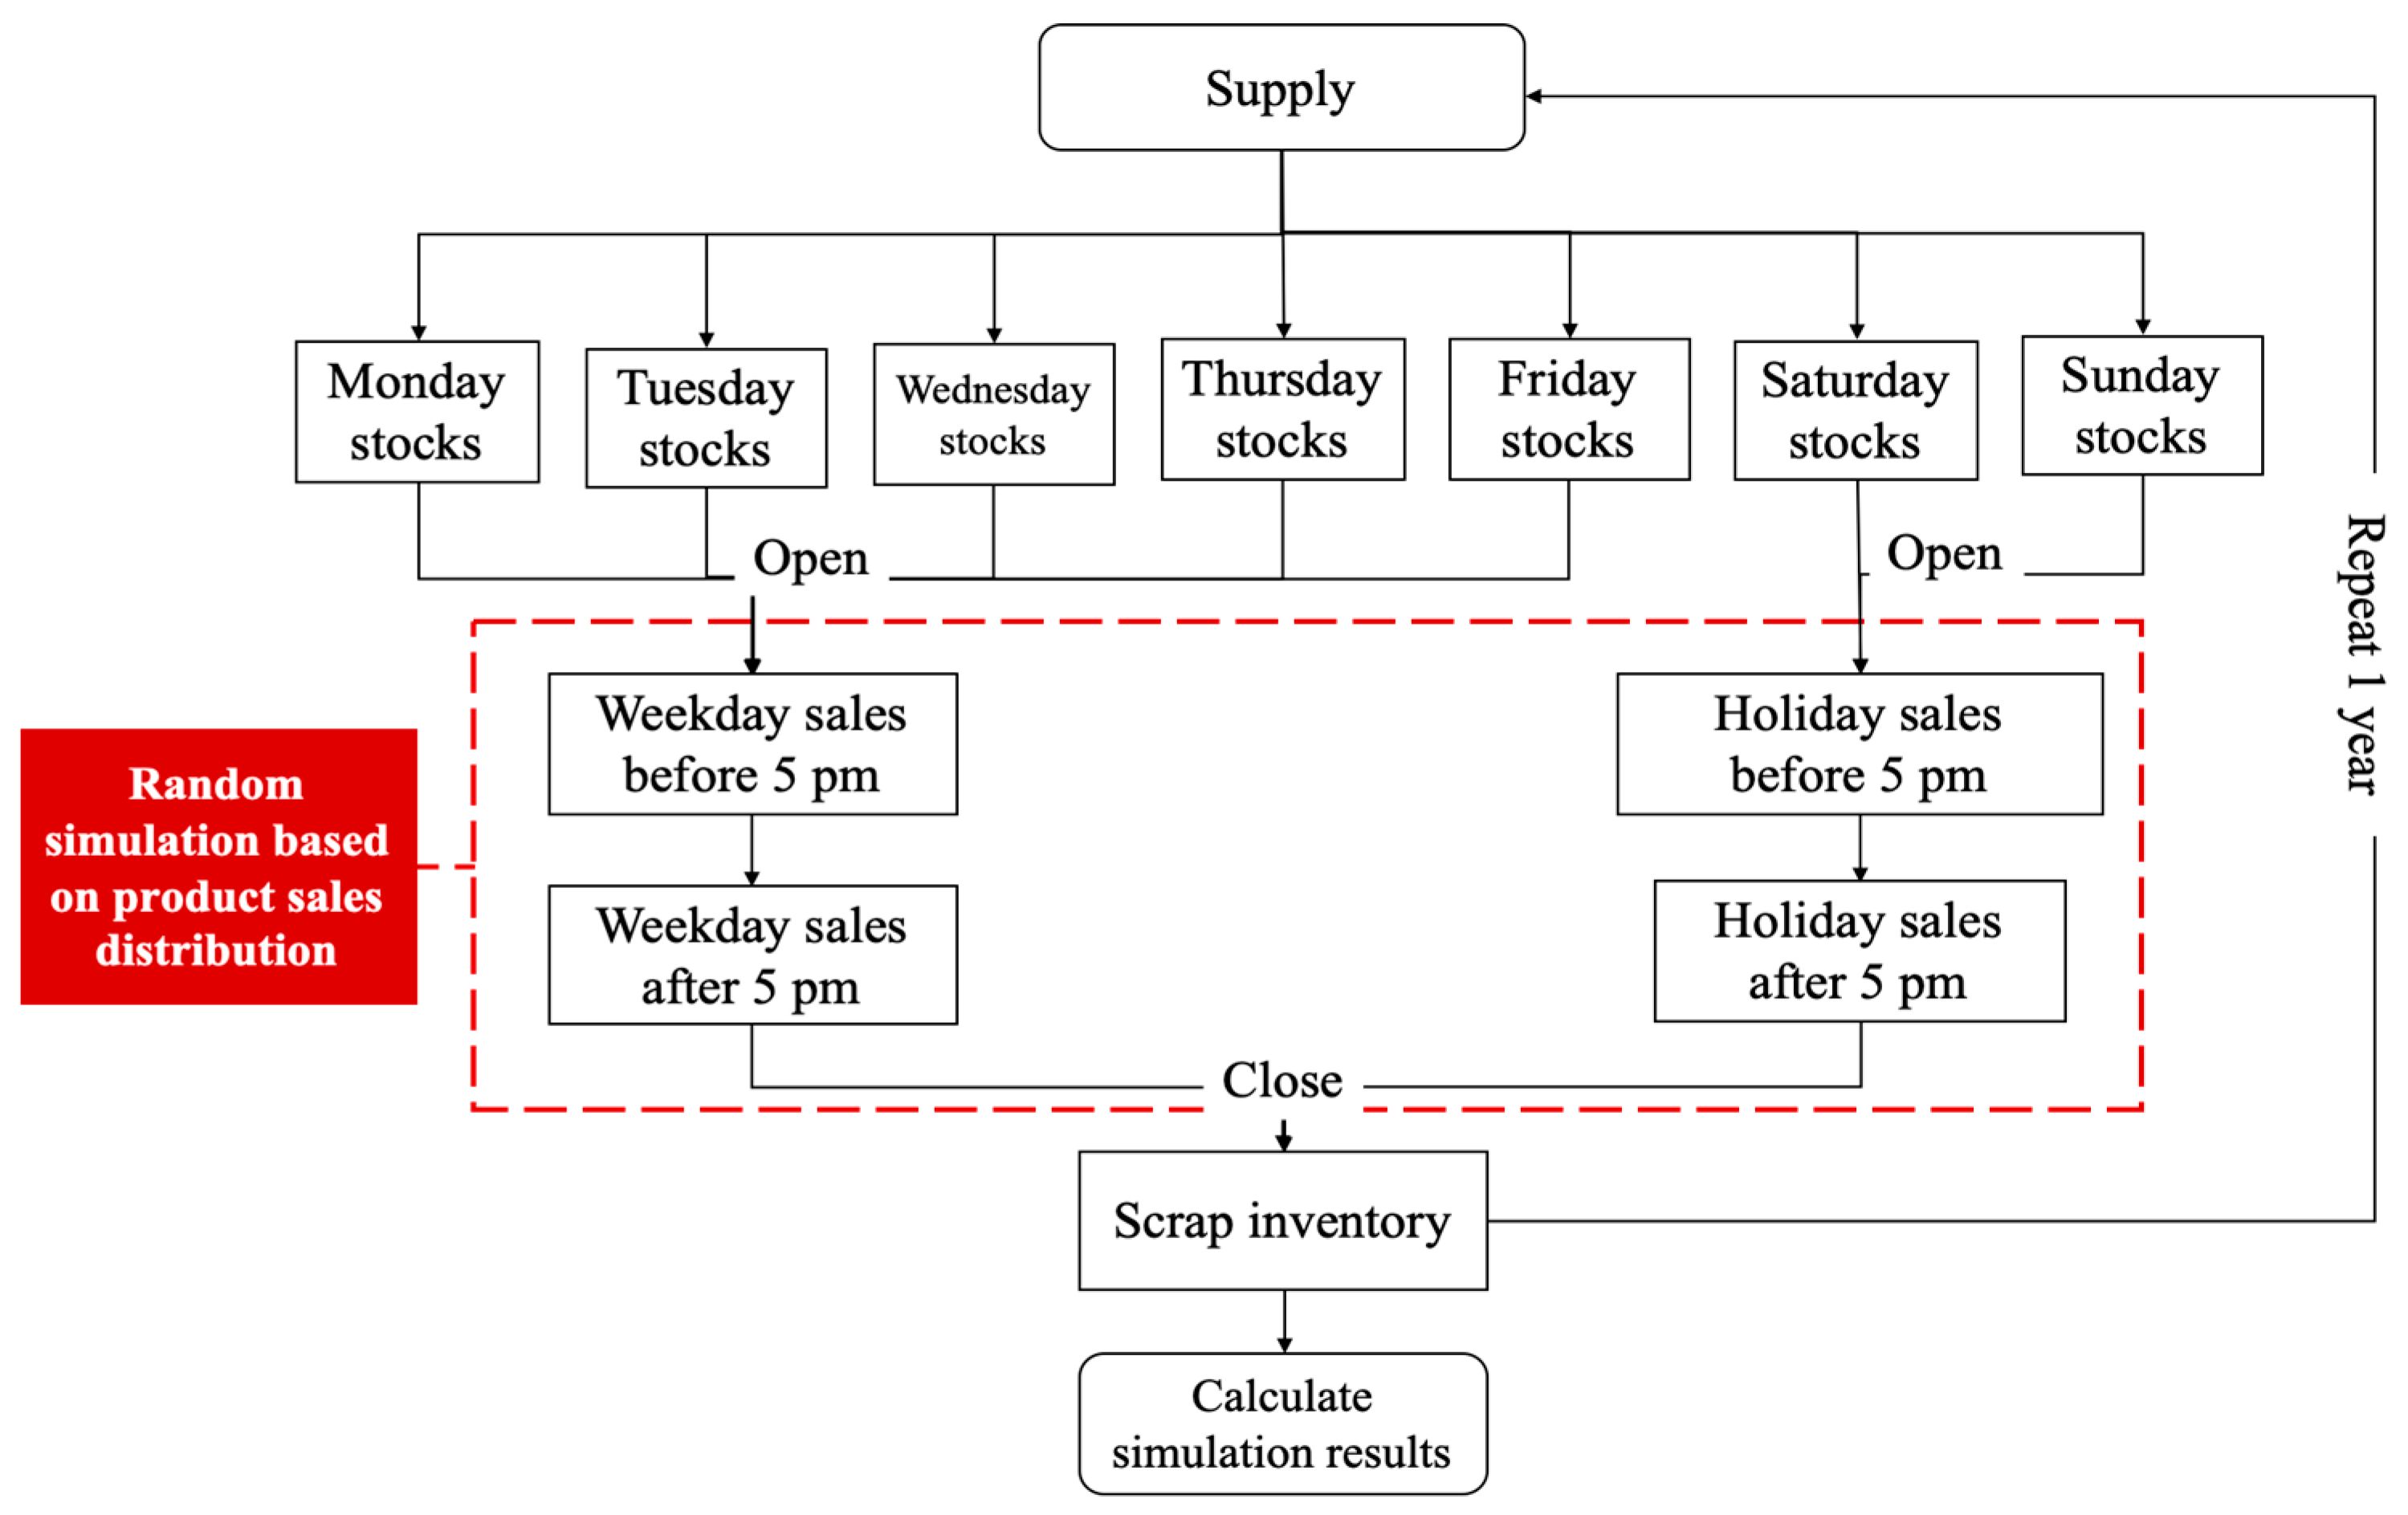
  • FRD model: Discounts on commodities are used continually in the retail industry as a method of promotion. Some CVS will offer discounts at a fixed time before expiration, which can stimulate consumption and reduce scrap (explained further below). The current CVS discount approach of 70% after 5 p.m. was used for the simulation analysis.
    Q 2 = j = 1 m i = 1 n ( O n j S O n j S L n j R n j )
    P 2 = j = 1 m i = 1 n [ ( S O n j ) × ( A P n j A C n j ) + ( S O n j ) × ( 0.7 × A P n j A C n j ) C P n j × Q 2 ]
  • DPD model: The FRD model (described above) discounts commodities at regular times, which may reduce scrap but also reduce profit. For example, headquarters may stipulate that a discount promotion will commence from 5 p.m. If sales typically peak at a particular store after 5 p.m., profits would be lost. In contrast, the DPD model dynamically adjusts the range of promotion discounts depending on the store’s inventories, aspiring to simultaneously reduce scrap and increase revenue.
    Q 3 = j = 1 m i = 1 n ( O n j ( S O n j + S R n j + S Y n j + S G n j + R n j )
    P 3 = j = 1 m i = 1 n [ ( S O n j ) × ( A P n j A C n j ) + ( S R n j ) × ( r × A P n j A C n j ) + ( S Y n j ) × ( y × A P n j A C n j ) + ( S G n j ) × ( g × A P n j A C n j ) C P n j × Q 3 ]

3.3.3. The Best Prediction Model

CVS sales data were matched with external data, such as climate and business cycle and order quantities predicted by means of machine learning, a method used for prediction in many fields in recent years. For example, Tsoumakas [37] used machine learning methods to predict food sales. ARIMA (IBM SPSS version 18.0) was used. Support vector machine (SVM), random forest (RF), neural network-RBF (NN-RBF), and five prediction algorithms of neural network-MLP (NN-MLP) were employed to predict the quantities of eleven items among the four categories of fresh food commodities in residential, cultural, and educational CVS in Table 3. The eleven items included two items of salad, three items of lunch, two items of sushi hand rolls, and four items of rice balls. A total of 110 predictions (2 different stores × 5 prediction models × 11 items) were made. The mean absolute error (MAE) was used to determine the prediction results. All the prediction results are summarized. Of the algorithms, SVM performed the best and was thus adopted for further work.

3.3.4. Evaluation Method and Effectiveness Review

FlexSim software was used to simulate and analyze the sales of fresh food products in stores for a period of one year. SES, FRD, and DPD models were compared. Effectiveness was evaluated according to “total scrap quantity” and “total profit” during the simulation period. Appendix A, Appendix B and Appendix C Figure A1, Figure A2 and Figure A3 contain details of the FlexSim models of the three simulation plans.

4. Evaluation of Implementation Plan for Digital Transformation

To enable the plan evaluation to best reflect the simulation results of each situation, the following restrictions were imposed on the simulation:
  • Goods are only supplied once a day;
  • The validity period of the goods is 24 h;
  • Simulation in hours;
  • Commodity defects are ignored;
  • Human factors of shop assistants and customers are not considered.

4.1. Simulation Analysis Environment for SES Model

For many years, the SES model has been the default decision-making mode of CVS. The store operator is responsible for predicting and ordering fresh food commodities, and expired commodities are discarded after the due date. As the sales volume of CVS on weekdays and holidays differed markedly, sales volumes on weekdays and holidays were simulated for one year and the results combined to yield a result more congruent with reality. Figure 2 shows the simulation flowchart of the SES model.

4.2. Simulation Analysis Environment for FRD Model

The condition of the FRD model is to carry out promotion at a fixed time every day. CVS will promote products set to expire at 5 p.m. every day at a 70% discount. There was no promotion before 5 p.m. on any day. Promotions are made on weekdays and holidays for a one-year simulation. The simulation process is illustrated in Figure 3.

4.3. Simulation Analysis Environment for DPD Model

The situation conditions of the DPD model are those of dynamic promotion decision-making. Daily sales volume and inventory counts were carried out at 5 p.m. When the sales volume is less than 50% of the ordered quantity, the promotion signal displays a “red light”, indicating a high unsaleable risk (scrap), and a promotion ensues at a discount of 30%. When the sales volume is between 50% and 80% of the ordered quantity, the promotion signal displays a “yellow light”, indicating a mild unsaleable risk, and a promotion ensues at a discount of 20%. When the sales volume is more than 80% of the ordered volume and the promotion signal displays a “green light”, sales will continue at the original price. The simulation is divided into weekdays and holidays for a period of one year. The simulation process is illustrated in Figure 4.

4.4. Discussion

Simulation results display the scrap quantity (Pcs/year) and profit (USD/year) for one year of data (see Table 4). The results are discussed below.
As noted above, SVM was used as the sales prediction algorithm. The SES, FRD, and DPD models were used for a one-year simulation. The annual total amounts of fresh food products scrapped were 15,782.79 for the SES model, 15,151.15 for the FRD model, and 13,749.55 for the DPD model. In comparison to the SES model, FRD and DPD reduced scrap by 4% and 12.88%, respectively. Profits were 17,556.72, 17,361.98, and 20,266.21. In comparison to the SES model, FRD reduced profit by 1.11%, while DPD increased profit by 15.43%. Although the FRD model successfully reduced scrap, alternative data revealed that some commodities typically reach their sales peak after 5 p.m., so promotions during that time may decrease profits while having no impact on increasing sales. In contrast, the DPD model significantly improved both the scrap quantity and profit.
SVM was used as the sales prediction algorithm. The SES, FRD, and DPD models were used for a one-year simulation. The annual total amount of fresh food products scrapped was 2985.13 for the SES model, 2912.70 for the FRD model, and 2663.28 for the DPD model. In comparison to the SES model, FRD and DPD reduced scrap by 2.43% and 10.78%, respectively. Profits were 7481.93, 7331.89, and 8052.54, respectively. Compared to the SES model, FRD increased profit by 1.28%, and DPD increased profit by 7.63%. In summary, both the FRD and DPD models reduced scrap and increased profits. Given that the turnover of cultural and educational stores is not as high as that of residential stores, the DPD model will have a better chance of increasing profits for stores in the latter category.
The DPD model reduced scrap and increased profits to a greater extent than both the SES and FRD models in both types of stores. Scrap reduction in residential stores is greater than in cultural and educational stores (−12.88% is better than −10.78%), and the profit increase is higher as well (15.43% is better than 7.63%). Although this study conducted a simulation analysis in two stores only, the results increase confidence in the DPD model for implementation in the retail industry. Digital transformation cannot be achieved overnight. Using the decision-making framework for digital transformation in the retail industry established in this study, business problems can be identified, a number of feasible solutions can be quickly verified, and the risks encountered in the transformation process may be minimized.

5. Conclusions

This study utilized real-world POS data and the decision-making framework for digital transformation in the retail industry to verify three different promotion plans for fresh food products using the FlexSim model: the SES, FRD, and DPD models. This study summarized the prevailing circumstances pertaining to digital transformation in the retail industry and proposed feasible methods for its widespread application. Digital transformation of the retail industry begins with the core value of an enterprise and focuses on consumers. Utilizing emerging technologies, consumer experiences are enhanced and business models are adjusted to strengthen competitiveness, while science and technology are simultaneously applied in the form of big data analysis to understand and respond to consumer needs. The application of emerging technologies and the collection, analysis, and utilization of large amounts of data are key factors in the continuous digital transformation of the retail industry. This study established an appropriate decision-making framework for digital transformation in the retail industry based on existing research and cases. The decision framework for digital transformation in the retail industry was based on the information value chain process.
Fresh food products were taken as the research subject to verify the feasibility of the three plans and the benefits of digital transformation in the retail industry. The simulation used real-world sales data of fresh food products from two CVS in Taiwan, one residential store and one cultural and educational store, measuring the performance of promotion plans according to two indicators: scrap quantity and profit. The SES model was used as the default model. Accordingly, the profit was unchanged, and the amount of scrap was the largest. The FRD model, which gives a fixed discount at a fixed time, reduces scrap but also reduces profit. The DPD model, which dynamically provides discounts of different degrees according to the real-time inventory of goods, maximizes benefits both in terms of scrap and profits. In terms of residential stores, the DPD model reduced scrap by 12.88% and increased profit by 15.43% compared to the SES model. In terms of cultural and educational stores, the DPD model reduced scrap by 10.78% and increased profit by 7.63% over the SES model. Given that Taiwan currently has about 10,000 convenience stores, the implementation of the DPD model has the potential to bring hundreds of millions of yuan as income to operators.
In light of the results, the following suggestions for further research are made: (1) Consider additional promotion methods for a variety of periods. Sales peaks occur at different times for different stores and for individual commodities across the day and seasons. For example, sales of rice balls peaked in the morning, while sales of lunch balls peaked at noon or evening. This study was limited in that it simulated only commodities according to the category at one point in time. Future studies should investigate the most profitable promotion plans and periods for individual products. (2) Further differentiation of promotion plans according to store type: There are ten types of CVS. Further research might apply analysis to all ten and identify the most appropriate plan for each.

Author Contributions

Conceptualization, T.-Y.O. and W.-L.T.; Data curation, G.-Y.L.; Methodology, G.-Y.L. and C.-Y.L.; Project administration, T.-Y.O. and W.-L.T.; Validation, C.-Y.L.; Writing—original draft, T.-Y.O. and W.-L.T.; Writing—review and editing, T.-Y.O. and W.-L.T. All authors have read and agreed to the published version of the manuscript.

Funding

This research received no external funding.

Institutional Review Board Statement

Not applicable.

Informed Consent Statement

Not applicable.

Data Availability Statement

Not applicable.

Acknowledgments

We would like to thank the editor and three anonymous reviewers for their useful feedback.

Conflicts of Interest

The authors have no competing interest to declare.

Appendix A. SES Model

This is the Plan 1 simulation model (Figure A1). Plan 1 is without promotion conditions and simulates 1 year of fresh food sales in store A and store B. Source 2 is a fresh food supplier for a convenience store. Queues 1 to 7 are the stocks of the day from Monday to Sunday. Processor 1 is the weekday sales condition and Processor 2 is the holiday sales condition. Because there is a big difference between the weekday and holiday sales in store A and B, we will simulate them separately. Queue 8 represents the products that have been sold.
The simulation process is that Source 2 provides products when the store is open, and then the products are stored in Queues 1 to 7. Processor 1 and Processor 2 simulate sales conditions. Then, the products that have been sold will be in Queue 8. After the simulation, staying in Queue 1 to Queue 7 indicates that the products will be scrapped, while staying in Queue 8 indicates that the products have been sold out.
Figure A1. The Simulation of Shelf-Life Expired Scrap Model (SES Model).
Sustainability 13 10687 g0a1

Appendix B. FRD Model

This is the Plan 2 simulation model (Figure A2). Plan 2 is promotion at the same time, which assumes the store will provide a 30% discount for fresh food at 5 p.m. every day, and simulates store A and store B for 1 year. Source 2 is a fresh food supplier for a convenience store. Queues 1 to 7 are the stocks of the day from Monday to Sunday. Processor 1 and Processor 3 are used to simulate sales before 5 p.m. on weekdays and holidays. Processor 2 and Processor 4 are used to simulate sales after 5 p.m. on weekdays and holidays. Because there is a big difference between the weekday and holiday sales in store A and B, we will simulate them separately. Queue 8 represents the products that have been sold.
The simulation process is that Source 2 provides products when the store opens, and then the products are stored in Queues 1 to 7. Starting product sales simulation: before 5 p.m., it is simulated without promotion. After 5 p.m., the simulation offers a 30% discount. Then, the products that have been sold will be in Queue 8. After the simulation, staying in Queue 1 to Queue 7 indicates that the products will be scrapped, while staying in Queue 8 indicates that the products have been sold out.
Figure A2. The Simulation of Fixed Remaining Duration Model (FRD Model).
Sustainability 13 10687 g0a2

Appendix C. DPD Model

This is the Plan 3 simulation model (Figure A3). Plan 3 is dynamic promotion decision conditions, which assumes the store offers dynamic discounting based on the sales volume of the day, and simulates store A and store B for 1 year. Source 2 is a fresh food supplier for a convenience store. Queues 1 to 7 are the stocks of the day from Monday to Sunday. Processor 1 to Processor 7 simulate sales before 5 p.m. on weekdays and holidays. Queue 8 to Queue 14 are the products that have been sold before 5 p.m. Processor 8 to Processor 10 simulate weekday and holiday sales after 5 p.m. based on the sales volume of the day at 5 p.m. Queue 15 is the products that have been sold.
The simulation process is that Source 2 provides products when the store opens, and then the products are stored in Queues 1 to 7. Starting product sales simulation: before 5 p.m., it is simulated without promotion. After 5 p.m., different promotions will be made according to the sales volume of the day. If the sales volume is less than or equal to 50% of the order quantity, it is a red light sales situation, and the store will provide a 30% discount. If the sales volume is greater than 50% of the order volume and less than 80%, it is a yellow light sales situation, and the store will provide a 15% discount. If the sales volume is greater than 80% of the order quantity, it is a green light sales situation, and the store will not provide a discount. Then, the products that have been sold will be in Queue 15. After the simulation, staying in Queue 1 to Queue 7 indicates that the products will be scrapped, while staying in Queue 15 indicates that the products have been sold out.
Figure A3. The Simulation of Dynamic Promotion Decision Model (DPD Model).
Sustainability 13 10687 g0a3

References

  1. IDC. Worldwide Spending on Digital Transformation Will Be Nearly $2 Trillion in 2022 as Organizations Commit to DX, According to a New IDC Spending Guide. Available online: https://www.idc.com/getdoc.jsp?containerId=prUS44440318 (accessed on 3 March 2021).
  2. Castagna, F.; Centobelli, P.; Cerchione, R.; Esposito, E.; Oropallo, E.; Passaro, R. Customer knowledge management in SMEs facing digital transformation. Sustainability 2020, 12, 3899. [Google Scholar] [CrossRef]
  3. Von Leipzig, T.; Gamp, M.; Manz, D.; Schöttle, K.; Ohlhausen, P.; Oosthuizen, G.; Palm, D.; Von Leipzig, K. Initialising customer-orientated digital transformation in enterprises. Procedia Manuf. 2017, 8, 517–524. [Google Scholar] [CrossRef]
  4. Santana, S.; Thomas, M.; Morwitz, V.G. The Role of Numbers in the Customer Journey. J. Retail. 2020, 96, 138–154. [Google Scholar] [CrossRef]
  5. Chanias, S.; Myers, M.D.; Hess, T. Digital transformation strategy making in pre-digital organizations: The case of a financial services provider. J. Strateg. Inf. Syst. 2019, 28, 17–33. [Google Scholar] [CrossRef]
  6. Goerzig, D.; Bauernhansl, T. Enterprise architectures for the digital transformation in small and medium-sized enterprises. Procedia CIRP 2018, 67, 540–545. [Google Scholar] [CrossRef]
  7. Filotto, U.; Caratelli, M.; Fornezza, F. Shaping the digital transformation of the retail banking industry. Empirical evidence from Italy. Eur. Manag. J. 2020, 39, 366–375. [Google Scholar] [CrossRef]
  8. Correani, A.; De Massis, A.; Frattini, F.; Petruzzelli, A.M.; Natalicchio, A. Implementing a digital strategy: Learning from the experience of three digital transformation projects. Calif. Manag. Rev. 2020, 62, 37–56. [Google Scholar] [CrossRef]
  9. Gustavsson, J.; Cederberg, C.; Sonesson, U.; Van Otterdijk, R.; Meybeck, A. Global Food Losses and Food Waste: Extent, Causes and Prevention; FAO: Rome, Italy, 2011. [Google Scholar]
  10. Gracia, A.; Gómez, M.I. Food sustainability and waste reduction in Spain: Consumer preferences for local, suboptimal, and/or unwashed fresh food products. Sustainability 2020, 12, 4148. [Google Scholar] [CrossRef]
  11. Soma, T.; Li, B.; Maclaren, V. Food waste reduction: A test of three consumer awareness interventions. Sustainability 2020, 12, 907. [Google Scholar] [CrossRef] [Green Version]
  12. Westerman, G.; Calméjane, C.; Bonnet, D.; Ferraris, P.; McAfee, A. Digital Transformation: A roadmap for billion-dollar organizations. MIT Cent. Digit. Bus. Capgemini Consult. 2011, 1, 1–68. [Google Scholar]
  13. Guinan, P.J.; Parise, S.; Langowitz, N. Creating an innovative digital project team: Levers to enable digital transformation. Bus. Horiz. 2019, 62, 717–727. [Google Scholar] [CrossRef]
  14. Susarla, A.; Oh, J.H.; Tan, Y. Social networks and the diffusion of user-generated content: Evidence from YouTube. Inf. Syst. Res. 2013, 23, 23–41. [Google Scholar] [CrossRef]
  15. Matt, C.; Hess, T.; Benlian, A. Digital transformation strategies. Bus. Inf. Syst. Eng. 2015, 57, 339–343. [Google Scholar] [CrossRef]
  16. Nandico, O.F. A Framework to Support Digital Transformation. Emerg. Trends Evol. Serv.-Oriented Enterp. Archit. 2016, 37, 113–138. [Google Scholar]
  17. Sorescu, A.; Frambach, R.T.; Singh, J.; Rangaswamy, A.; Bridges, C. Innovations in retail business models. J. Retail. 2011, 87, S3–S16. [Google Scholar] [CrossRef]
  18. Herhausen, D.; Binder, J.; Schoegel, M.; Herrmann, A. Integrating bricks with clicks: Retailer-level and channel-level outcomes of online–offline channel integration. J. Retail. 2015, 91, 309–325. [Google Scholar] [CrossRef]
  19. Grewal, D.; Roggeveen, A.L.; Nordfält, J. The future of retailing. J. Retail. 2017, 93, 1–6. [Google Scholar] [CrossRef]
  20. Iansiti, M.; Lakhani, K.R. Digital ubiquity: How connections, sensors, and data are revolutionizing business. Harv. Bus. Rev. 2014, 92, 19. [Google Scholar]
  21. Dhruv, G.; Noble, S.M.; Roggeveen, A.L.; Jens, N. The future of in-store technology. J. Acad. Mark. Sci. 2020, 48, 96–113. [Google Scholar]
  22. Priporas, C.V.; Stylos, N.; Fotiadis, A.K. Generation Z consumers’ expectations of interactions in smart retailing: A future agenda. Comput. Hum. Behav. 2017, 77, 374–381. [Google Scholar] [CrossRef]
  23. Marinova, D.; de Ruyter, K.; Huang, M.H.; Meuter, M.L.; Challagalla, G. Getting smart: Learning from technology-empowered frontline interactions. J. Serv. Res. 2017, 20, 29–42. [Google Scholar] [CrossRef]
  24. Furr, N.; Shipilov, A. Digital doesn’t have to be disruptive: The best results can come from adaptation rather than reinvention. Harv. Bus. Rev. 2019, 97, 94–104. [Google Scholar]
  25. Berman, S.J. Digital transformation: Opportunities to create new business models. Strategy Leadersh. 2012, 40, 16–24. [Google Scholar] [CrossRef]
  26. Bharadwaj, A.; El Sawy, O.A.; Pavlou, P.A.; Venkatraman, N. Digital business strategy: Toward a next generation of insights. MIS Q. 2013, 37, 471–482. [Google Scholar] [CrossRef]
  27. Verhoef, P.C.; Bijmolt, T.H. Marketing perspectives on digital business models: A framework and overview of the special issue. Int. J. Res. Mark. 2019, 36, 341–349. [Google Scholar] [CrossRef]
  28. Chapman, P.; Clinton, J.; Khabaza, T.; Reinartz, T.; Wirth, R. The CRISP-DM process model. CRIP–DM Consort. 1999, 310, 91. [Google Scholar]
  29. Jain, P.; Sharma, P. Behind Every Good Decision: How Anyone Can Use Business Analytics to Turn Data into Profitable Insight; Gildan Media LLC: New York, NY, USA, 2014. [Google Scholar]
  30. Abbasi, A.; Sarker, S.; Chiang, R.H. Big data research in information systems: Toward an inclusive research agenda. J. Assoc. Inf. Syst. 2006, 17, 3. [Google Scholar] [CrossRef] [Green Version]
  31. Drucker, P.F. The Practice of Management; Harper & Row, Publishers, Inc.: New York, NY, USA, 1954. [Google Scholar]
  32. Maciariello, J. Marketing and innovation in the Drucker Management System. J. Acad. Mark. Sci. 2009, 37, 35–43. [Google Scholar] [CrossRef]
  33. Chien, C.F. Decision Analysis and Management: A Unison Framework for Total Decision Quality Enhancement; Yeh-Yeh Book Gallery: Taipei, Taiwan, 2005. [Google Scholar]
  34. Chiheb, F.; Boumahdi, F.; Bouarfa, H. A New Model for Integrating Big Data into Phases of Decision-Making Process. Procedia Comput. Sci. 2019, 151, 636–642. [Google Scholar] [CrossRef]
  35. Ailawadi, K.L.; Beauchamp, J.P.; Donthu, N.; Gauri, D.K.; Shankar, V. Communication and promotion decisions in retailing: A review and directions for future research. J. Retail. 2009, 85, 42–55. [Google Scholar] [CrossRef]
  36. Sharma, R.; Mithas, S.; Kankanhalli, A. Transforming decision-making processes: A research agenda for understanding the impact of business analytics on organisations. Eur. J. Inf. Syst. 2014, 23, 433–441. [Google Scholar] [CrossRef] [Green Version]
  37. Tsoumakas, G. A survey of machine learning techniques for food sales prediction. Artif. Intell. Rev. 2019, 52, 441–447. [Google Scholar] [CrossRef]
Figure 1. Retail Digital Transformation Decision Framework.
Sustainability 13 10687 g001
Figure 2. SES Model Simulation Flow Chart.
Sustainability 13 10687 g002
Figure 3. FRD Model Simulation Flow Chart.
Sustainability 13 10687 g003
Figure 4. DPD Model Simulation Flow Chart.
Sustainability 13 10687 g004
Table 1. FamilyMart’s Introduction and Application of New Technology for Digital Transformation.
Application of TechnologyNew TechnologyDescription
Mobile business APP serviceAI, cloud computing, information security, dataFamilyMart’s digital membership system improves the adhesion of members. The app includes time-saving, money-saving, and trouble-saving features. It facilitates the pre-purchase of goods, coffee sending and giving, combined with FamiPay and other functions.
Time-controlled bar codeDataFamilyMart’s promotional slogan, “Friendly Meal Time”, is based on time-controlled bar codes, extending the use of the “time pricing” system to automatically discount the price of fresh food products seven hours before the expiration date.
Smart EC acceptanceBlockchain, information securitySmart EC acceptance saves time in checking and inspecting goods.
Smart EC acceptance means that the logistics industry affixes RFID tags to goods. After delivery, clerks directly scan the outside to detect that goods and quantities are correct, plus other information.
IoT control systemAI, cloud computing, information security, data, data warehousing and edge computingCombined with the “IoT Management and Control System”, the temperature and energy consumption of each piece of equipment can be checked with a flat panel. If there is a fault, a clerk is notified to report for repair. In the future, the monitoring of equipment will develop into fault predictions or the direct notification of repairers, without manual reference to a clerk.
Face recognition systemInformation security, dataA “face recognition system” is set up at the entrance of the store to help summarize consumer data and better understand the surrounding business cycles and to analyze consumer data in combination with sales information to assist the development of a store.
Suggested ordering systemAI, dataThis system suggests the optimal quantity of commodities for order with reference to historical consumption, inventory, and weather changes, saving time for store managers. The current system covers 80% of commodities, to be extended to 100% in the future.
Table 2. Decision Variable Description.
Variable NameDescription
i Plan variable (i = 1 is SES model; I = 2 is FRD model; I = 3 is DPD model)
j Represents category i fresh food commodities
n Represents the number of simulation days
m Represents the types of fresh food goods
Q i Total scrap quantity for plan i
P i Total profit volume for plan i
O n j Sales volume of fresh food commodities in stores on the same day (sales volume equals order quantity + inventory quantity)
R n j Remaining available sales volume of fresh food commodities in the store on the same day (not exceeding the shelf life)
S O n j Sales volume of the store before 5 p.m.
S L n j Sales volume of the store after 5 p.m.
S R n j Sales volume after implementing promotion when the inventory volume of the store is at red light state after 5 p.m.
S Y n j Sales volume after implementing promotion when the inventory volume of the store is at yellow light state after 5 p.m.
S G n j Sales volume after implementing promotion when the inventory volume of the store is at green light state after 5 p.m.
r Discount rate of store inventory at red light state after 5 p.m.
y Discount rate of store inventory at yellow light state after 5 p.m.
g Discount rate of store inventory at green light state after 5 p.m.
A P n j Selling price of category i fresh food commodities
A C n j Cost of category j fresh food commodities
C P n j Cost of scrap disposal of category j fresh food commodities
Table 3. Calculation Results of MAE of Fresh Food Commodity Sales Forecast Model.
Forecast Model
Forecast
Commodity
ARIMARFSVMNN-RBFNN-MLP
RE *1CE *2RECERECERECERECE
Salad No.10.1060.120 0.116 0.117 0.1050.1060.1620.1640.1700.169
Salad No.20.2010.1580.155 0.142 0.1230.1280.1400.1430.1620.152
Lunch No.10.1570.1630.155 0.161 0.1530.1550.1590.1610.1630.152
Lunch No.20.1480.1570.129 0.137 0.1190.1220.1440.1520.1380.142
Lunch No.30.2230.2430.192 0.186 0.1950.1850.2170.1880.2100.221
Sushi hand roll No.10.1460.1620.153 0.168 0.1450.1470.1720.1690.1490.152
Sushi hand roll No.20.1550.1450.158 0.159 0.1560.1500.1430.1420.1490.154
Rice ball No.10.1750.1760.141 0.142 0.1330.1350.1420.1380.1740.171
Rice ball No.20.1110.1140.097 0.099 0.0960.0970.1030.1090.1130.103
Rice ball No.30.1690.1330.136 0.126 0.1250.1260.1270.1390.1490.141
Rice ball No.40.2010.1760.157 0.161 0.1510.1480.1620.1660.1660.186
MSE (Average)0.16090.14490.13640.15190.1585
*1 RE: Residential stores; *2 CE: Cultural and educational stores.
Table 4. Comparison of Scrap Quantity and Profit of Three Plans in Different Stores.
TypeItemModelSaladLunchSushi Hand RollsRice BallsSumIncrease or DecreaseProportion
RE Scrap quantitySES1507.232455.121799.2110,021.2315,782.79--
FRD1485.552383.451616.959665.2015,151.15−631.64−4.00%
DPD1460.002091.451449.058749.0513,749.55−2033.24−12.88%
ProfitSES3060.741567.442043.2210,885.3217,556.72--
FRD3048.451504.462064.1010,744.9617,361.98−194.74−1.11%
DPD3533.582161.822300.7812,270.0220,266.212709.4915.43%
CE Scrap quantitySES411.52330.24341.151902.222985.13--
FRD401.50328.50328.501854.202912.70−72.43−2.43%
DPD389.33266.45182.501825.002663.28−321.85−10.78%
ProfitSES1446.761466.08525.774043.327481.93--
FRD1395.451476.78546.484158.807577.5095.571.28%
DPD1524.291608.95731.154188.158052.54570.617.63%
Publisher’s Note: MDPI stays neutral with regard to jurisdictional claims in published maps and institutional affiliations.

