
Analyzing the Barriers to Reverse Logistics (RL) Implementation: A Hybrid Model Based on IF-DEMATEL-EDAS


Abstract
:1. Introduction
- What are the key implementation factors that interfere with wider RL adoption among manufacturers in the Nigerian manufacturing sectors?
- Why are there still divergent opinions among manufacturers on the reuse of used materials in the production line even with the heightened level of supply chain disruptions?
- Why are there still a high volume of hazardous wastes, non-biodegradables in landfills, erosion dumpsites in this dispensation of circular designs and global green policy initiatives and promotions?
2. Literature Review
2.1. Literature Review on Reverse Logistics Barriers
2.2. Application of IF-DEMATEL and EDAS
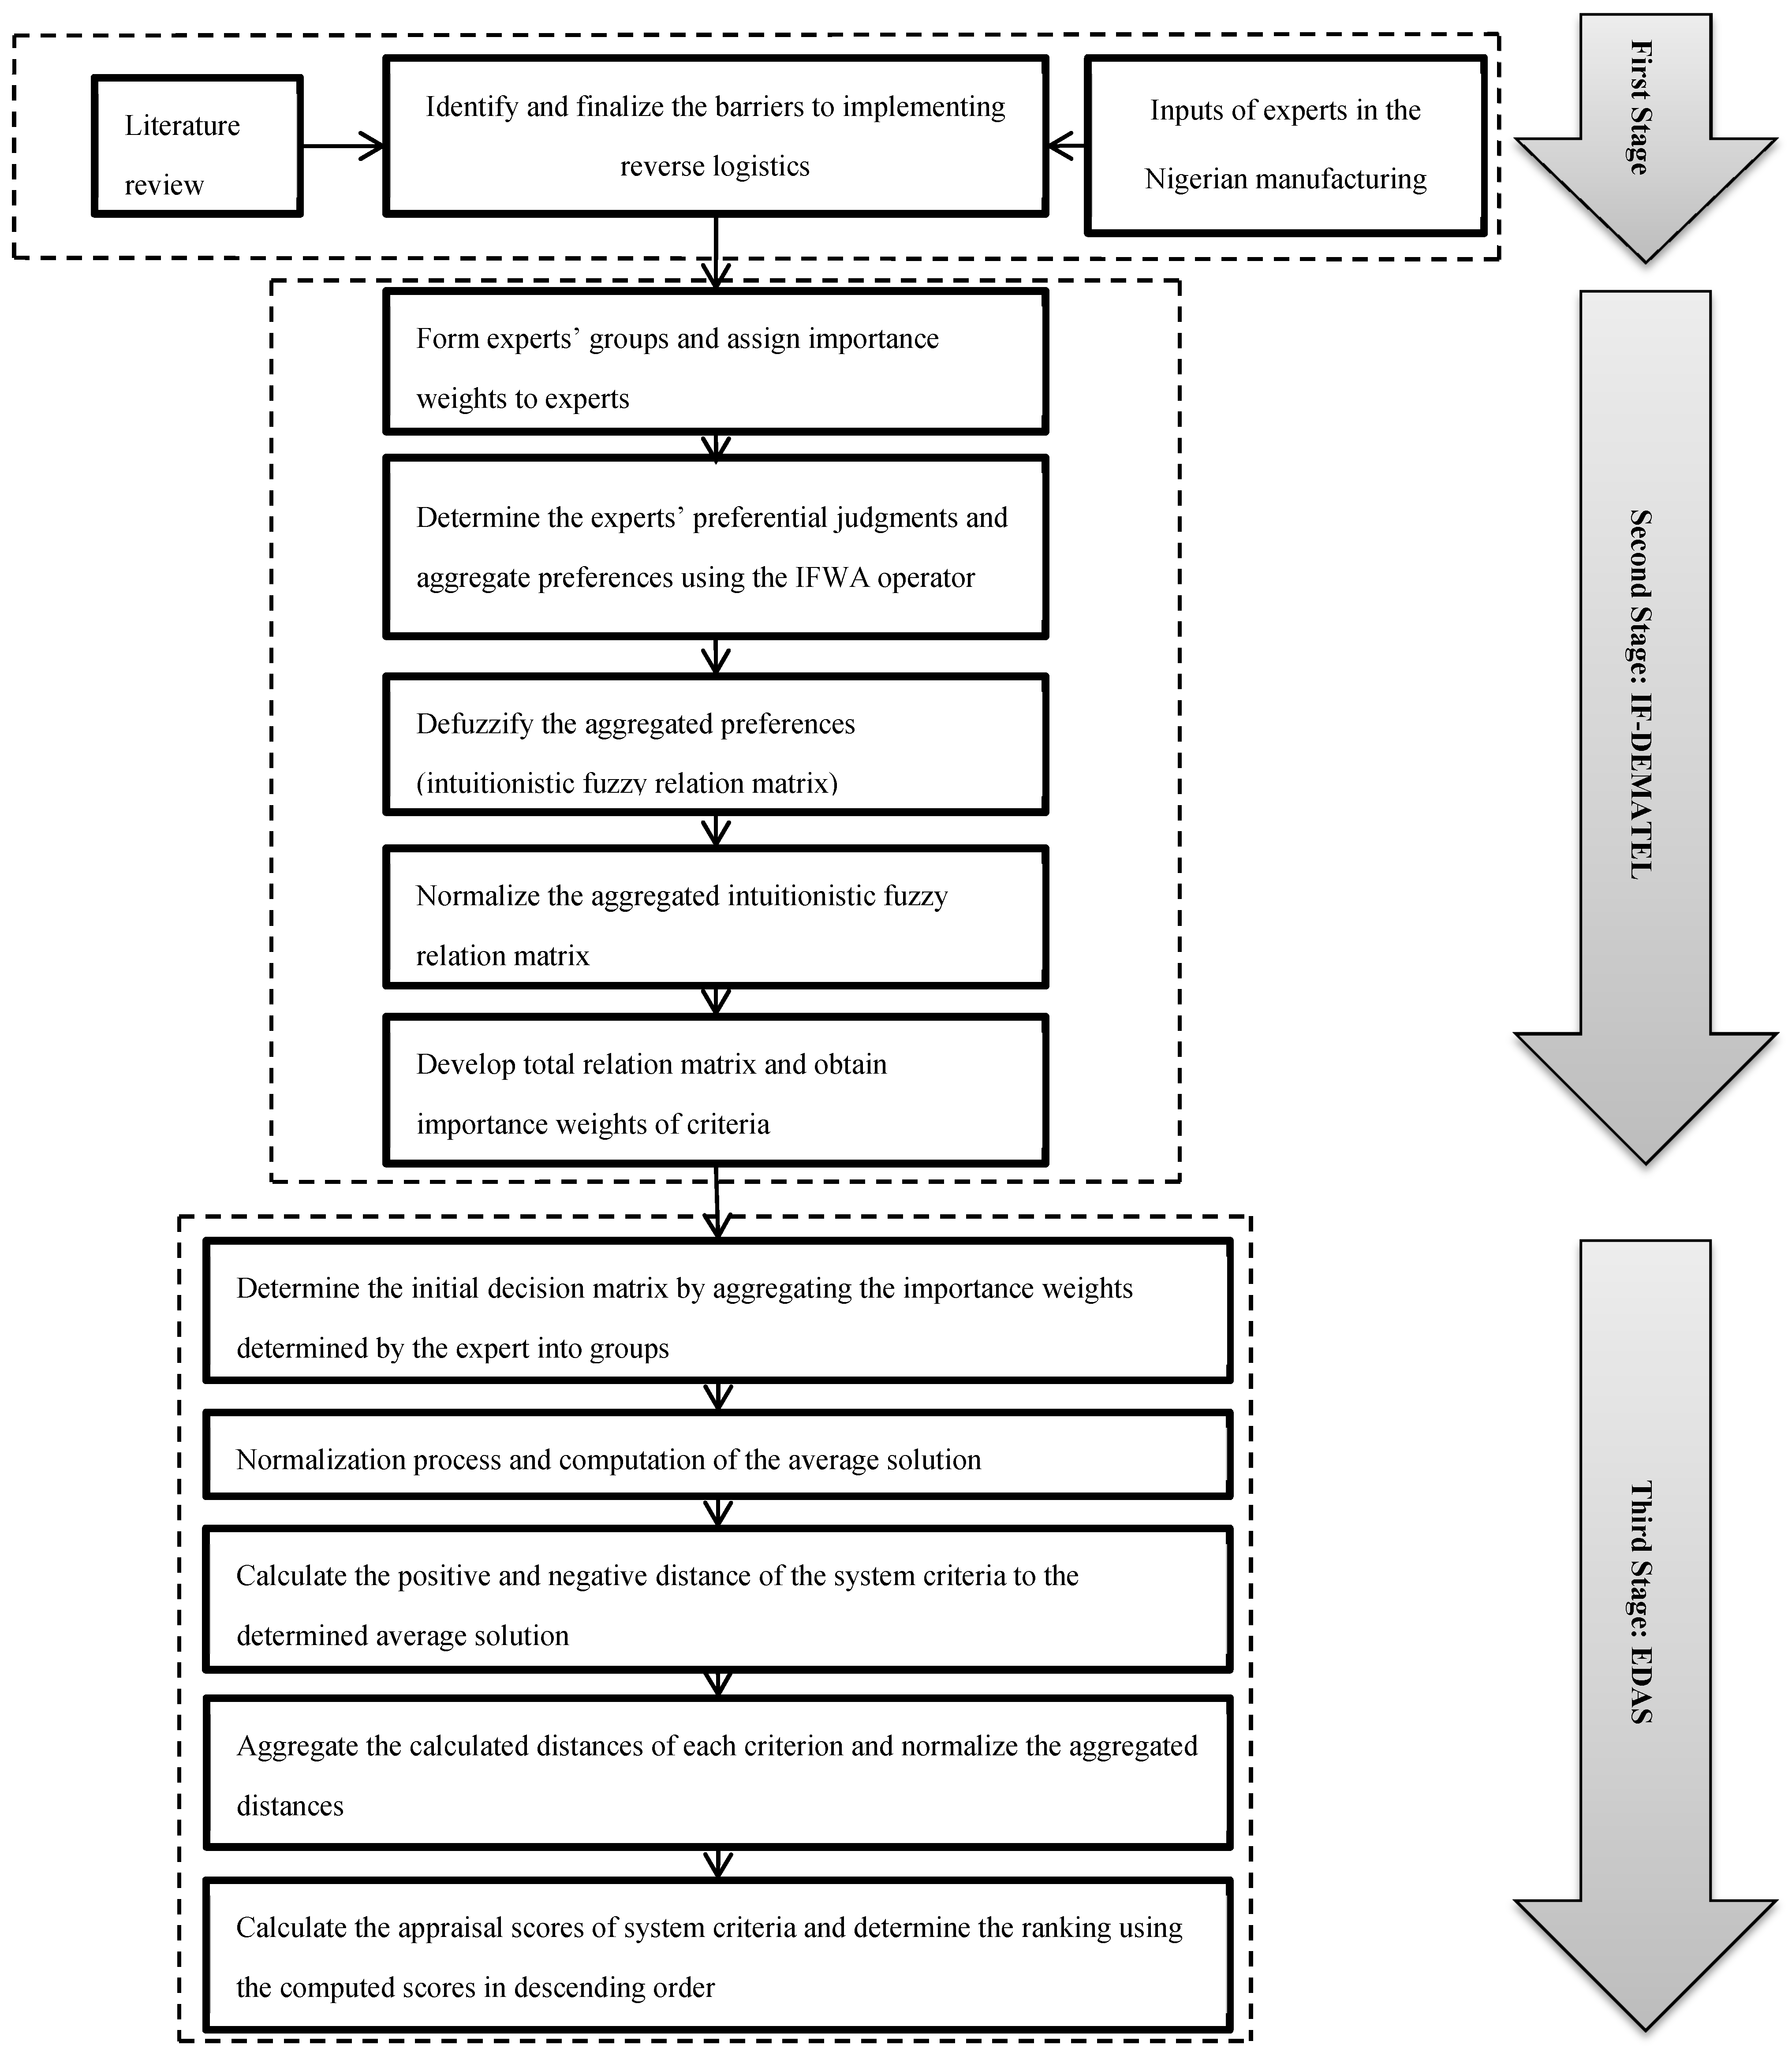
3. Proposed Methodology
3.1. IF-DEMATEL
- Step 1:
- Form expert groups and assign importance weights to experts
- Step 2:
- Determine the experts’ preferential judgments and aggregate preferences using the IFWA operator.
- Step 3:
- Defuzzify the aggregated preferences (intuitionistic fuzzy relation matrix)
- Step 4:
- Normalize the aggregated intuitionistic fuzzy relation matrix
- Step 5:
- Develop total relation matrix and obtain importance weights of criteria
3.2. EDAS
- Step 1:
- Develop initial decision matrix
- Step 2:
- Normalize the decision matrix and computation of the average solution
- Step 3:
- Computation of the positive and negative distance of the system criteria
- Step 4:
- Aggregate and normalize the calculated distances
- Step 5:
- Compute the appraisal scores and subsequent ranking of system criteria
4. An Application Case for the Proposed Methodology in the Nigerian Manufacturing Industry
4.1. Expert Panel Formation Stage
4.2. IF-DEMATEL Stage
- Step 1:
- The experts are organized into groups namely, operations managers, R&D managers, production managers and general managers. Then, the expert groups were prioritized by applying importance weights to Equation (1). Accordingly, the importance weights of the groups are 0.3, 0.26, 0.22 and 0.22 for λ1, λ2, λ3 and λ4 respectively.
- Step 2:
- The experts’ intuitionistic judgments are determined using the IF-DEMATEL evaluation scale (See Table 2) and afterward aggregated using the IFWA. The aggregated intuitionistic preferences on the barrier dimensions/categories and specific reverse logistics, for one of the expert groups, are presented in Table 5 and Table 6 respectively.
- Step 3:
- The aggregated intuitionistic fuzzy relation matrix for the expert groups is then defuzzified using Equation (4).
- Step 4:
- The defuzzified intuitionistic fuzzy relation matrix of the respective barriers for the expert groups is normalized using Equations (5) and (6) as presented in Table 7.
- Step 5:
- The total relation matrix is developed and then the importance weights as determined by the expert groups are computed as shown for one of the expert groups in Table 8.
4.3. EDAS Application Stage
- Step 1:
- Develop initial decision matrix
- Step 2:
- Normalize decision matrix and compute average solution
- Step 3:
- Computation of the positive and negative distances of the reverse logistics barriers to the average solution
- Step 4:
- Aggregate and normalize calculated positive and negative distances of the reverse logistics barriers.
- Step 5:
- Calculate appraisal scores and ranking of the system criteria
5. Discussion
5.1. Discussion on the Ranking of the Reverse Logistics Barriers
5.2. Solving Similar Problem with Existing Model or Findings
5.3. Study Implications
6. Conclusions
Author Contributions
Funding
Institutional Review Board Statement
Informed Consent Statement
Data Availability Statement
Conflicts of Interest
References
- Bernon, M.; Tjahjono, B.; Ripanti, E.F. Aligning retail reverse logistics practice with circular economy values: An exploratory framework. Prod. Plan. Control 2018, 29, 483–497. [Google Scholar] [CrossRef]
- Swanson, D.; Goel, L.; Francisco, K.; Stock, J. An analysis of supply chain management research by topic. Supply Chain Manag. Int. J. 2018, 23, 100–116. [Google Scholar] [CrossRef]
- Sehnem, S.; Vazquez-Brust, D.; Pereira, S.C.F.; Campos, L.M.S. Circular economy: Benefits, impacts and overlapping. Supply Chain Manag. Int. J. 2019, 24, 784–804. [Google Scholar] [CrossRef]
- Cricelli, L.; Greco, M.; Grimaldi, M. An investigation on the effect of inter-organizational collaboration on reverse logistics. Int. J. Prod. Econ. 2021, 240, 108216. [Google Scholar] [CrossRef]
- Santosh Kumar, S. Studies on Some Aspects of Implementation of Reverse Logistics in Indian Context. Ph.D. Thesis, Biju Patnaik Central Library, National Institute of Technology, Odisha, India, 2019. [Google Scholar]
- Job, M.L.; Njihia, M.; Maalu, J.; Iraki, X.N. Reverse Logistics and Competitive Advantage: The Mediating Effect of Operational Performance among Manufacturing Firms in Kenya. Eur. Sci. J. 2020, 16, 217. [Google Scholar] [CrossRef]
- Garrido-Hidalgo, C.; Ramirez, F.J.; Olivares, T.; Roda-Sanchez, L. The adoption of internet of things in a circular supply chain framework for the recovery of WEEE: The case of lithium-ion electric vehicle battery packs. Waste Manag. 2020, 103, 32–44. [Google Scholar] [CrossRef]
- Brandão, R.; Edwards, D.J.; Hosseini, M.R.; Melo, A.C.S.; Macêdo, A.N. Reverse supply chain conceptual model for construction and demolition waste. J. Waste Manag. Res. 2016, 1–15. [Google Scholar]
- Sangwan, K.S. Key activities, decision variables and performance indicators of reverse logistics. Procedia Cirp. 2017, 61, 257–262. [Google Scholar] [CrossRef]
- Orji, I.J. Examining the barriers to organizational change for sustainability and the drivers of sustainable performance in the metal manufacturing industry. Resour. Conserv. Recycl. 2019, 140, 102–114. [Google Scholar] [CrossRef]
- U-Dominic, C.; Orji, I.J.; Okwu, M.O.; Mbachu, V.; Ayomoh, M. The Impact of COVID-19 Pandemic on Sustainable Supplier Selection Process. In Advancing Industrial Engineering through Teaching; University of Ibadan: Ibadan, Nigeria, 2021; pp. 1–28. ISBN 978-078-515-9. [Google Scholar]
- Chinda, T. Examination of Factors Influencing the Successful Implementation of Reverse Logistics in the Construction Industry: Pilot Study. Procedia Eng. 2017, 182, 99–105. [Google Scholar] [CrossRef]
- Bukhari, M.A. Reverse Logistics Network Design in Circular Economy: Promoting Sustainable Collection and Reuse for Post-Consumer Textile and Clothing. Ph.D. Thesis, Universidad Politecnica de Madrid, Madrid, Spain, 2018. [Google Scholar]
- Agrawal, S.; Singh, R.K. Analyzing disposition decisions for sustainable reverse logistics: Triple bottom line approach. Resour. Conserv. Recycl. 2019, 150, 104448. [Google Scholar] [CrossRef]
- Guarnieri, P.; Cerqueira-Streit, J.A.; Batista, L.C. Reverse logistics and the sectoral agreement of packaging industry in Brazil towards a transition to circular economy. Resour. Conserv. Recycl. 2020, 153, 104541. [Google Scholar] [CrossRef]
- Kinobe, J.R.; Gebresenbet, G.; Niwagaba, C.B.; Vinneras, B. Reverse logistics system and recycling potential at a landfill: A case study from Kampala City. Waste Manag. 2015, 42, 82–92. [Google Scholar] [CrossRef]
- Pramono, S.N.W.; Ulkhaq, M.M.; Aulia, Z. Analysing the barriers of reverse logistics implementation: A case study. IOP Conf. Ser. Mater. Sci. Eng. 2021, 1072, 012063. [Google Scholar] [CrossRef]
- Cortés Pellicer, P.; Alarcón Valero, F. Identification of reverse logistics decision types from mathematical models. J. Ind. Eng. Manag. 2018, 11, 239–249. [Google Scholar] [CrossRef]
- Dutta, P.; Talaulikar, S.; Xavier, V.; Kapoor, S. Fostering revers logistics in India by prominent barrier identification and strategy implementation to promote circular economy. J. Clean. Prod. 2021, 294, 126241. [Google Scholar] [CrossRef]
- Prakash, C.; Barua, M.K. Integration of AHP-TOPSIS method for prioritizing the solutions of reverse logistics adoption to overcome its barriers under fuzzy environment. J. Manuf. Syst. 2015, 37, 599–615. [Google Scholar] [CrossRef]
- Sirisawat, P.; Kiatcharoenpol, T. Fuzzy AHP-TOPSIS approaches to prioritizing solutions for revers logistics barriers. Comput. Ind. Eng. 2018, 117, 303–318. [Google Scholar] [CrossRef]
- Waqas, M.; Qianli, D.; Ahmad, N.; Zhu, Y.; Nadeem, M. Modeling Reverse Logistics Barriers in Manufacturing Industry of Pakistan: An ISM and MICMAC Approach. J. Adv. Manuf. Syst. 2020, 19, 309–341. [Google Scholar] [CrossRef]
- Kilic, H.S.; Demirci, A.E.; Delen, D. An integrated decision analysis methodology based on IF-DEMATEL and IF-ELECTRE for personnel selection. Decis. Support Syst. 2020, 137, 113360. [Google Scholar] [CrossRef]
- Buyukozkan, G.; Gocer, F.; Karabulut, Y. A new group decision making approach with IF AHP and IF VIKOR for selecting hazardous waste carriers. Measurement 2019, 134, 66–82. [Google Scholar] [CrossRef]
- Sari, D.P.; Ulkhaq, M.M.; Rinawati, D.I.; Rasyida, D.R. Barriers of Reverse Logistics Implementation: A Case Study in a Car Battery Industry in Indonesia. Int. J. Supply. Chain. Manag. 2018, 7, 53–67. [Google Scholar]
- Badenhorst, A. Management practices to mitigate barriers in reverse logistics. J. Contemp. Manag. 2017, 14, 595–623. [Google Scholar]
- Vieira, B.O.; Guarnieri, P.; Nofal, R.; Nofal, B. Multi-Criteria Methods Applied in the Studies of Barriers Identified in the Implementation of Reverse Logistics of E-Waste: A Research Agenda. Logistics 2020, 4, 11. [Google Scholar] [CrossRef]
- Hsu, C.-W.; Kuo, T.-C.; Chen, S.-H.; Hu, A.H. Using DEMATEL to develop a carbon management model of supplier selection in green supply chain management. J. Clean. Prod. 2013, 56, 164–172. [Google Scholar] [CrossRef]
- Rameezdeen, R.; Chileshe, N.; Hosseini, M.R.; Lehmann, S. A qualitative examination of major barriers in implementation of revers logistics within the South Australian construction sector. Int. J. Constr. Manag. 2016, 3, 1–12. [Google Scholar]
- Moktadir, M.A.; Rahman, T.; Ali, S.M. Examining barriers to reverse logistics practices in the leather footwear industry. Ann. Oper. Res. 2020, 293, 715–746. [Google Scholar] [CrossRef]
- Kiatcharoenpol, T.; Sirisawat, P. A Selection of Barrier Factors Affecting Reverse Logistics Performance of Thai Electronic Industry. Int. J. Intell. Eng. Syst. 2020, 13, 117–126. [Google Scholar] [CrossRef]
- Panjehfouladgaran, H.R. A Risk Management Evaluation Framework for Reverse Logistics Organisations Using Failure Mode and Effect Analysis and Multi-Criteria Decision Making. Ph.D. Thesis, Universiti Putra Malaysia, Selangor, Malaysia, 2016. [Google Scholar]
- Ali, A.H.; Zalavadia, S.; Barakat, M.R.; Eid, A. The Role of Sustainability on Reverse Logistics for Returning and Recycling. Arch. Bus. Res. 2018, 6, 12–33. [Google Scholar]
- Ravi, V.; Shankar, R. An ISM-based approach analyzing interactions among variables of reverse logistics in automobile industries. J. Model. Manag. 2017, 12, 36–52. [Google Scholar] [CrossRef]
- Orji, I.J.; Shaoxuan, L. A dynamic perspective on the key drivers of innovation- led lean approaches to achieve sustainability in manufacturing supply chains. Int. J. Prod. Econ. 2020, 219, 480–496. [Google Scholar] [CrossRef]
- Govindan, K.; Agarwal, V.; Darbari, J.; Jha, P.C. An integrated decision making model for the selection of sustainable forward and reverse logistic providers. Ann. Oper. Res. 2019, 273, 607–650. [Google Scholar] [CrossRef]
- Kusi-Sarpong, S.; Sarkis, J. Sustainable supply chains and emerging economies. Resour. Conserv. Recycl. 2019, 143, 238–243. [Google Scholar] [CrossRef]
- Gupta, H.; Kusi-Sarpong, S.; Rezaei, J. Barriers and overcoming strategies to supply chain sustainability innovation. Resour. Conserv. Recycl. 2020. [Google Scholar] [CrossRef]
- Ayvaz, B.; Gorener, A. Reverse logistics in the Electronics waste industry. In Waste Management: Concepts, Methodologies, Tools, and Applications; IGI Global: Hershey, PA, USA, 2020. [Google Scholar]
- Kazemi, N.; Modak, N.M.; Govindan, K. A review of reverse logistics and closed loop supply chain management studies published in IJPR: A bibliometric and content analysis. Int. J. Prod. Res. 2019, 57, 4937–4960. [Google Scholar] [CrossRef] [Green Version]
- Saeed, A.; Adnan, M. Critical success factors of reverse logistics in construction and pharmaceutical sector. Int. J. Sci. Eng. Res. 2019, 10, 12. [Google Scholar]
- Mwanza, B.G.; Mbohwa, C. Reverse Logistics Barriers: A Case of Plastic Manufacturing Industries in Zambia. In Proceedings of the IEEE International Conference on Industrial Engineering and Engineering Management (IEEM), Macao, China, 15–18 December 2019; pp. 1240–1244. [Google Scholar]
- Meyer, A.; Niemann, W.; Mackenzie, J.; Lombaard, J. Drivers and barriers of reverse logistics practices: A study of large grocery retailers in South Africa. J. Transp. Supply Chain Manag. 2017, 11, a323. [Google Scholar] [CrossRef] [Green Version]
- Makaleng, M.S. Reverse logistics challenges in manufacturing pharmaceutical companies: A study in the City of Tshwane South Africa. In Proceedings of the 12th International Business Conference, Mauritius, 23–26 September 2018; pp. 254–266. [Google Scholar]
- Bor, J. Reverse Logistics and Performance of Food Industries in Kenya. J. Logist. Manag. 2020, 9, 23–30. [Google Scholar]
- Anne, M.; Nicholas, L.; Gicuru, I.; Bula, O. Reverse Logistics Practices and Their Effect on Competitiveness of Food Manufacturing Firms in Kenya. Int. J. Econ. Financ. Manag. Sci. 2015, 3, 678–684. [Google Scholar] [CrossRef] [Green Version]
- Girma. Reverse Logistic Network Design and Analysis for Plastic Bottles—A Case Study in Dire Dawa City. Master’s Thesis, Addis Ababa University, Addis Ababa, Ethiopia, 2018; pp. 1–105. [Google Scholar]
- Gupta, B. Relationship between Reverse Logistics Practices and Organizational Performance. Ph.D. Thesis, Addis Ababa University, Addis Ababa, Ethiopia, 2016. [Google Scholar]
- Wondimu, S. Measuring Performance of Reverse Logistics System in Pet Bottles Recovery in Eabsco. Master’s Thesis, Addis Ababa University, Addis Ababa, Ethiopia, 2016. [Google Scholar]
- Amole, B.B.; Adebiyi, S.; Arogundade, K.K. Reverse Logistics and Management of Waste Products: The Nigerian Manufacturing Firms Experience. Rev. Innov. Compet. 2018, 4, 57–74. [Google Scholar] [CrossRef]
- Mobolaji, D. The Reverse Logistics of Beverage Containers (A Case Study of Lagos, Nigeria). Master’s Thesis, Aalto University, Espoo, Finland, 2017. [Google Scholar]
- Ahaiwe, E.O.; Nwadigoha, E.E. Reverse logistics practices and sales growth of starline nigeria limited, abia state. Niger. J. Manag. Sci. 2021, 22, 1–20. [Google Scholar]
- Amoah, A.; Abubakar, N.; Koomson, E. Investigating into factors accounting for the effective implementation of reverse logistics in Ghana. Int. J. Multidiscip. Develop. 2017, 4, 539–550. [Google Scholar]
- Ebenezer, A.; Zhuo, S. Reverse Logistics and Performance of Bottled and Serchet Water Manufacturing Firms in Ghana: The Intervening Role of Competitive Advantage. IOSR J. Bus. Manag. 2019, 21, 34–39. [Google Scholar]
- Elbaz, J.; Frei, G.; Laguir, I. Reverse supply chain practices in developing countries: The case of Morocco. J. Manuf. Technol. Manag. 2018, 29, 198–216. [Google Scholar] [CrossRef] [Green Version]
- Bouzon, M.; Govindan, K.; Rodriguez, C.M.T. Evaluating barriers for reverse logistics implementation under a multiple stakeholders’ perspective analysis using grey decision making approach. Resour. Conserv. Recycl. 2018, 128, 315–335. [Google Scholar] [CrossRef]
- Bouzon, M.; Govindan, K.; Taboada, C.M.; Campos, L.M.S.S.; Rodriguez, C.M.T.; Campos, L.M.S.S. Identification and analysis of reverse logistics barriers using fuzzy Delphi method and AHP. Resour. Conserv. Recycl. 2016, 108, 182–197. [Google Scholar] [CrossRef]
- Kaviani, M.A.; Tavana, M.; Kumar, A.; Michnik, J.; Niknam, R.; De Campos, E.A.R. An integrated framework for evaluating the barriers to successful implementation of reverse logistics in the automotive industry. J. Clean. Prod. 2020, 27, 122714. [Google Scholar] [CrossRef]
- Orji, I.J.; Kusi-Sarpong, S.; Gupta, H. The critical success factors of using social media for supply chain social sustainability in the freight logistics industry. Int. J. Prod. Res. 2020, 58, 1522–1539. [Google Scholar] [CrossRef]
- Simoes, R.; Carvalho, C.; Felix, R.; Arantes, A. Survey of Reverse Logistics Practices—The Case of Portugal. In Proceedings of the 6th International Conference on Operations Research and Enterprise Systems, Porto, Portugal, 23–25 February 2017; pp. 393–400. [Google Scholar] [CrossRef]
- Kusi-Sarpong, S.; Gupta, H.; Sarkis, J. A supply chain sustainability innovation framework and evaluation methodology. Int. J. Prod. Res. 2019, 57, 1990–2008. [Google Scholar] [CrossRef] [Green Version]
- Mangla, S.K.; Govindan, K.; Luthra, S. Critical success factors for reverse logistics in Indian industries: A structural model. J. Clean. Prod. 2016, 15, 608–621. [Google Scholar] [CrossRef]
- Herbert-Hansen, Z.N.L.; Larsen, S.; Nielsen, A.; Groth, A.; Gregersen, N.G.; Ghosh, A. Combining or Separating Forward and Reverse Logistics. Int. J. Logist. Manag. 2018, 29, 216–236. [Google Scholar] [CrossRef] [Green Version]
- Nakiboglu, G. Determining Reverse Logistics Motivation Factors and Barriers: Multiple Criteria Decision Making Application on Pipe Manufacturing Company. In Eurasian Business Perspectives. Eurasian Studies in Business and Economics; Bilgin, M., Danis, H., Demir, E., Can, U., Eds.; Springer: Cham, Switzerland, 2019; Volume 10. [Google Scholar] [CrossRef]
- Han, W.; Huang, Y.; Hughes, M.; Zhang, M. The trade-off between trust and distrust in supply chain collaboration. Ind. Mark. Manag. 2021, 98, 93–104. [Google Scholar]
- Mahadevan, K. Collaboration in reverse: A conceptual framework for reverse logistics operations. Int. J. Prod. Perform. Manag. 2019, 68, 482–504. [Google Scholar] [CrossRef]
- Paula, I.C.; Campos, E.A.R.; Pagani, R.N.; Guarnieri, P. Are collaboration and trust sources for innovation in the reverse logistics? Insights from a systematic literature review. Supply Chain Manag. Int. J. 2019, 25, 176–222. [Google Scholar] [CrossRef]
- Rehman, S.A.; Zhang, Y.; Khan, S.S. Reverse logistics and challenges: Supply chain management of Automobile Industry. Adv. Appl. Sci. 2017, 2, 80–86. [Google Scholar] [CrossRef] [Green Version]
- Schamne, A.N.; Nagalli, A. Reverse Logistics in the Construction Sector: A Literature Review. Electron. J. Geotech. Eng. 2016, 21, 691–702. [Google Scholar]
- Gardas, B.B.; Raut, R.D.; Narkhede, B. Reducing the exploration and production of oil: Reverse logistics in the automobile service sector. Sustain. Prod. Consum. 2018, 16, 141–153. [Google Scholar] [CrossRef]
- Prakash, C.; Barua, M.K.; Pandya, K.V. Barrier analysis for reverse logistics implementation in Indian electronics industry using fuzzy analytic hierarchy process. Procedia Soc. Behav. Sci. 2015, 189, 91–102. [Google Scholar] [CrossRef] [Green Version]
- Farooque, M.; Jain, V.; Zhang, A.; Li, Z. Fuzzy DEMATEL analysis of barriers to Blockchain-based life cycle assessment in China. Comput. Ind. Eng. 2020, 147, 106684. [Google Scholar] [CrossRef]
- Li, B.; Zhang, Y.; Xu, Z. The medical treatment service matching based on the probabilistic linguistic term sets with unknown attribute weights. Int. J. Fuzzy Syst. 2020, 22, 1487–1505. [Google Scholar] [CrossRef]
- Rajesh, R.; Ravi, V. Modeling enablers of supply chain risk mitigation in electronic supply chains: A Grey-DEMATEL approach. Comput. Ind. Eng. 2015, 87, 126–139. [Google Scholar] [CrossRef]
- Trivedi, A.; Jakhar, S.K.; Sinha, D. Analyzing barriers to inland waterways as a sustainable transportation mode in India: A DEMATEL-ISM based approach. J. Clean. Prod. 2021, 295, 126301. [Google Scholar] [CrossRef]
- Alam, S.T.; Ahmed, S.; Ali, S.M.; Sarker, S.; Kabir, G. Challenges to COVID-19 vaccine supply chain: Implications for sustainable development goals. Int. J. Prod. Econ. 2021, 239, 108193. [Google Scholar] [CrossRef]
- Ocampo, L.; Yamagishi, K. Modeling the lockdown relaxation of the Philippine government in response to the COVID-19 pandemic: An intuitionistic fuzzy DEMATEL analysis. Socio-Econ. Plan. Sci. 2021, 72, 100911. [Google Scholar] [CrossRef]
- Keshavarz Ghorabaee, M.; Zavadskas, E.K.; Olfat, L.; Turskis, Z. Multi-criteria inventory classification using a new method of evaluation based on distance from average solution (EDAS). Informatica 2015, 26, 435–451. [Google Scholar] [CrossRef]
- Abdel-Basset, M.; Gamal, A.; Chakrabortty, R.K.; Ryan, M. Development of a hybrid multi-criteria decision-making approach for sustainability evaluation of bioenergy production technologies: A case study. J. Clean. Prod. 2021, 290, 125805. [Google Scholar] [CrossRef]
- Kahraman, C.; Keshavarz Ghorabee, M.; Zavadskas, E.K.; Cevik Onar, S.; Yazdani, M.; Oztaysi, B. Intuitionistic fuzzy EDAS method: An application to solid waste disposal site selection. J. Environ. Eng. Landsc. Manag. 2017, 25, 1–12. [Google Scholar] [CrossRef]
- Ma, Y.; Zhang, L.; Lv, X.; Cai, Z. An Integrated Strategy for Cost Optimization of Reverse Logistics Network under Uncertain Environment. Int. J. Econ. Financ. Manag. Sci. 2017, 5, 24–33. [Google Scholar] [CrossRef] [Green Version]
- Peng, X.; Dai, J.; Yuan, H. Interval-valued fuzzy soft decision making methods based on MABAC similarity measure and EDAS. Fundam. Inform. 2017, 152, 373–396. [Google Scholar]
- Kundakci, N. An integrated method using MACBETH and EDAS methods for evaluating steam boiler alternative. J. Multi-Criteria Decis. Anal. 2019, 26, 27–34. [Google Scholar] [CrossRef]
- Mishra, A.R.; Mardani, A.; Rani, P.; Zavadskas, E.K. A novel EDAS approach on intuitionistic fuzzy set for assessment of helath-care waste disposal technology using new parametric divergence measures. J. Clean. Prod. 2020, 272, 122807. [Google Scholar] [CrossRef]
- Asante, D.; He, Z.; Adjei, N.O.; Asante, B. Exploring the barriers to renewable energy adoption utilizing MULTIMOORA-EDAS method. Energy Policy 2020, 142, 111479. [Google Scholar] [CrossRef]
- Hou, W.-H.; Wang, X.-K.; Zhang, H.-Y.; Wang, J.-Q.; Li, L. Safety risk assessment of metro construction under epistemic uncertainty: An integrated framework using creedal networks and the EDAS method. Appl. Soft Comput. 2021, 108, 107436. [Google Scholar] [CrossRef]
- Gupta, H.; Barua, M.K. Identifying enablers of technological innovation for Indian MSMEs using best- worst multi- criteria decision making method. Technol. Forecast. Soc. Chang. 2016, 107, 69–79. [Google Scholar] [CrossRef]
- Chan, A.P.; Lam, P.T.; Chan, D.W.; Cheung, E.; Ke, Y. Critical success factors for PPPs in infrastructure developments: Chinese perspective. J. Constr. Eng. Manag. 2010, 136, 484–494. [Google Scholar] [CrossRef]
- Darko, A.; Chan, A.P.C. Strategies to promote green building technologies adoption in developing countries: The case of Ghana. Build. Environ. 2018, 130, 74–84. [Google Scholar] [CrossRef]
- Bagaya, O.; Song, J. Empirical study of factors influencing schedule delays of public construction projects in Burkina Faso. J. Manag. Eng. 2016, 32, 05016014. [Google Scholar] [CrossRef]

| Author(s) | Study Aim | Research Method | Country |
|---|---|---|---|
| [42] | To assess the barriers to reverse logistics in the plastic manufacturing industry | Qualitative | Zambia |
| [43] | To bring to notice the main internal and external drivers and barriers of RL within major South African grocery retailers. | Qualitative study | South Africa |
| [44] | To examine reverse logistics challenges in the manufacturing pharmaceutical companies in South Africa. | Qualitative and quantitative | South Africa |
| [45] | Performance evaluation of reverse logistics adoption in food industries in Kenya. | Descriptive technique, | Kenya |
| [46] | Reverse logistics practices and their effect on competitiveness on food manufacturing, Nairobi, Kenya. | Quantitative | Kenya |
| [47] | To analyze and design an effective reverse logistic system for plastic bottles in Dire Dawa city in Ethiopia. | Qualitative and quantitative. | Ethiopia |
| [48] | Performance evaluation of RL process in a bottling company, Ethiopia | Qualitative | Ethiopia |
| [49] | Measuring the performance of reverse logistics system in pet bottles recovery in Ethiopian city. | qualitative and quantitative | Ethiopia |
| [50] | To explore reverse logistics activities’ impacts on the management of waste products in the Nigerian manufacturing companies. | Qualitative and quantitative. | Nigeria |
| [51] | To examine solid waste management with respect to beverage containers of soft and alcoholic drinks. | Quantitative | Nigeria |
| [52] | Performance evaluation of RL in a cosmetics company in Abia State, Nigeria. | Quantitative | Nigeria |
| [53] | To investigate factors for successful implementation of reverse logistics (RL) in Ghana. | Qualitative and quantitative. | Ghana |
| [54] | Performance evaluation of RL in sachet water bottling company in Ghana. | Qualitative and quantitative. | Ghana |
| [55] | Investigation on Reverse Supply Chain (RSC) practices and their obstacles in Moroccan companies. | Qualitative | Morocco |
| Dimensions | Sub-Criteria/Barriers | References |
|---|---|---|
| Organizational (OG) | Insufficient top management commitment (OG1) | [42,55,56,57,58,59] |
| Financial constraints (OG2) | ||
| Poor strategic planning of reverse logistics policies (OG3) | ||
| Poor organizational culture (OG4) | ||
| Technological (TC) | Inadequate performance measurement system (TC1) | [22,25,41,42,60,61] |
| Lack of proper infrastructure and supporting technologies for reverse logistics practices (TC2) | ||
| Negative past experience with innovative technologies (TC3) | ||
| Low technical expertise/competence of employees (TC4) | ||
| Institutional (IN) | Inadequate government policies and support (IN1) | [12,34,49,55,56] |
| Absence of public awareness on reverse logistics adaptation (IN2) | ||
| Market instability and uncertainty of customers’ behavior (IN3) | ||
| Low competitive pressure (IN4) | ||
| Lack of corporate social responsibility (IN5) | ||
| Product related (PD) | Low product quality (PD1) | [34,55,56,59,62,63] |
| Low traceability of product life cycle (PD2) | ||
| Improper marketing strategies for recovered products (PD3) | ||
| Risk of storing hazardous materials (PD4) | ||
| Insufficient knowledge of the expected values and pricing of returned products (PD5) | ||
| Supply chain related (SC) | Minimal collaboration among supply chain partners (SC1) | [42,49,64,65,66,67,68,69] |
| Geographical location of facilities not close to end-customers (SC2) | ||
| Insufficient trust in third-party logistics (SC3) |
| Linguistic Attributes | Intuitionistic Fuzzy Numbers |
|---|---|
| Very high severity (VH) | [0.90, 0.10, 0.00] |
| High severity (H) | [0.75, 0.20, 0.05] |
| Medium severity (M) | [0.50, 0.45, 0.05] |
| Low severity (L) | [0.35, 0.60, 0.05] |
| No severity (N) | [0.00, 1.00, 0.00] |
| Demographic Attribute | Number of Respondents |
|---|---|
| Age | |
| 30–40 | 3 |
| 41–50 | 4 |
| 51–60 | 1 |
| Gender | |
| Male | 7 |
| Female | 1 |
| Highest educational qualification | |
| Bachelor’s degree | 3 |
| Postgraduate degree | 5 |
| Years of experience | |
| 5–10 | 6 |
| 11–20 | 2 |
| Managerial position | |
| R&D manager | 1 |
| Production manager | 4 |
| General manager | |
| Operation manager | 3 |
| Annual revenue (million naira) | |
| 50–100 | 1 (Firm) |
| 110–200 | |
| 210–1000 | 3 (Firms) |
| Firm size (number of employees) | |
| 30–100 | 1 (Firm) |
| 101–500 | 7 (Firms) |
| Barrier Categories | OG | TC | IN | PC | SC |
|---|---|---|---|---|---|
| Organizational (OG) | (0,1,0) | (0.86,0.13,0.01) | (0.35,0.6,0.05) | (0.75,0.2,0.05) | (0.68,0.29,0.03) |
| Technological (TC) | (0.45,0.5,0.05) | (0,1,0) | (0.9,0.1,0) | (0,1,0) | (0.5,0.45,0.05) |
| Institutional (IN) | (0.5,0.4,0.05) | (0.9,0.1,0) | (0,1,0) | (0.35,0.6,0.05) | (0.9,0.1,0) |
| Product-related (PD) | (0.75,0.2,0.05) | (0.68,0.29,0.03) | (0.86,0.13,0.01) | (0,1,0) | (0.45,0.5,0.05) |
| Supply chain-related (SC) | (0.75,0.2,0.05) | (0.35,0.6,0.05) | (0.86,0.13,0.01) | (0.74,0.2,0.05) | (0,1,0) |
| OG1 | OG2 | OG3 | OG4 | TC1 | TC2 | TC3 | TC4 | IN1 | IN2 | IN3 | IN4 | IN5 | PD1 | PD2 | PD3 | PD4 | PD5 | SC1 | SC2 | SC3 | |
|---|---|---|---|---|---|---|---|---|---|---|---|---|---|---|---|---|---|---|---|---|---|
| OG1 | (0,1,0) | (0.68,0.29,0.03) | (0.35,0.6,0.05) | (0.5,0.45,0.05) | (0.9,0.1,0) | (0.86,0.13,0.01) | (0.45,0.5,0.05) | (0.9,0.1,0) | (0.86,0.13,0.01) | (0.86,0.13,0.01) | (0.35,0.6,0.05) | (0.68,0.29,0.03) | (0.35,0.6,0.05) | (0.35,0.6,0.05) | (0.68,0.29,0.03) | (0,1,0) | (0.35,0.6,0.05) | (0.75,0.2,0.05) | (0.68,0.29,0.03) | (0.75,0.2,0.05) | (0.35,0.6,0.05) |
| OG2 | (0.9,0.1,0) | (0,1,0) | (0.9,0.1,0) | (0.68,0.29,0.03) | (0.9,0.1,0) | (0.5,0.45,0.05) | (0.5,0.45,0.05) | (0.45,0.5,0.05) | (0.35,0.6,0.05) | (0.45,0.5,0.05) | (0.68,0.29,0.03) | (0.9,0.1,0) | (0.86,0.13,0.01) | (0.68,0.29,0.03) | (0.9,0.1,0) | (0.86,0.13,0.01) | (0.9,0.1,0) | (0.68,0.29,0.03) | (0.86,0.13,0.01) | (0.35,0.6,0.05) | (0.75,0.2,0.05) |
| OG3 | (0.74,0.2,0.05) | (0.86,0.13,0.01) | (0,1,0) | (0.9,0.1,0) | (0.68,0.29,0.03) | (0.9,0.1,0) | (0.68,0.29,0.03) | (0.9,0.1,0) | (0.75,0.2,0.05) | (0.45,0.5,0.05) | (0.5,0.45,0.05) | (0.86,0.13,0.01) | (0.35,0.6,0.05) | (0.75,0.2,0.05) | (0.68,0.29,0.03) | (0,1,0) | (0.35,0.6,0.05) | (0.86,0.13,0.01) | (0.5,0.45,0.05) | (0.35,0.6,0.05) | (0.5,0.45,0.05) |
| OG4 | (0.86,0.13,0.01) | (0.9,0.1,0) | (0.35,0.6,0.05) | (0,1,0) | (0.9,0.1,0) | (0.45,0.5,0.05) | (0.68,0.29,0.03) | (0.75,0.2,0.05) | (0.5,0.45,0.05) | (0,1,0) | (0.35,0.6,0.05) | (0.9,0.1,0) | (0.68,0.29,0.03) | (0.9,0.1,0) | (0.35,0.6,0.05) | (0.68,0.29,0.03) | (0.75,0.2,0.05) | (0.9,0.1,0) | (0.75,0.2,0.05) | (0.86,0.13,0.01) | (0.9,0.1,0) |
| TC1 | (0,1,0) | (0,1,0) | (0.35,0.6,0.05) | (0.86,0.13,0.01) | (0,1,0) | (0.35,0.6,0.05) | (0.35,0.6,0.05) | (0.86,0.13,0.01) | (0.9,0.1,0) | (0.9,0.1,0) | (0.68,0.29,0.03) | (0.68,0.29,0.03) | (0.9,0.1,0) | (0.86,0.13,0.01) | (0.5,0.45,0.05) | (0.35,0.6,0.05) | (0.5,0.45,0.05) | (0.68,0.29,0.03) | (0,1,0) | (0.75,0.2,0.05) | (0.68,0.29,0.03) |
| TC2 | (0.5,0.45,0.05) | (0.45,0.5,0.05) | (0.68,0.29,0.03) | (0.45,0.5,0.05) | (0.35,0.6,0.05) | (0,1,0) | (0.86,0.13,0.01) | (0.45,0.5,0.05) | (0.86,0.13,0.01) | (0.75,0.2,0.05) | (0.9,0.1,0) | (0.9,0.1,0) | (0.68,0.29,0.03) | (0.35,0.6,0.05) | (0.35,0.6,0.05) | (0.68,0.29,0.03) | (0.86,0.13,0.01) | (0.86,0.13,0.01) | (0.75,0.2,0.05) | (0.68,0.29,0.03) | (0.9,0.1,0) |
| TC3 | (0.5,0.45,0.05) | (0.9,0.1,0) | (0.45,0.5,0.05) | (0.5,0.45,0.05) | (0,1,0) | (0.86,0.13,0.01) | (0,1,0) | (0.68,0.29,0.03) | (0.86,0.13,0.01) | (0.45,0.5,0.05) | (0.68,0.29,0.03) | (0.5,0.45,0.05) | (0.86,0.13,0.01) | (0.9,0.1,0) | (0.35,0.6,0.05) | (0.86,0.13,0.01) | (0.5,0.45,0.05) | (0.75,0.2,0.05) | (0.5,0.45,0.05) | (0.68,0.29,0.03) | (0,1,0) |
| TC4 | (0.68,0.29,0.03) | (0.86,0.13,0.01) | (0.35,0.6,0.05) | (0.9,0.1,0) | (0.5,0.45,0.05) | (0.35,0.6,0.05) | (0.35,0.6,0.05) | (0,1,0) | (0,1,0) | (0,1,0) | (0.86,0.13,0.01) | (0.68,0.29,0.03) | (0.9,0.1,0) | (0.35,0.6,0.05) | (0.68,0.29,0.03) | (0,1,0) | (0.68,0.29,0.03) | (0.68,0.29,0.03) | (0.86,0.13,0.01) | (0.5,0.45,0.05) | (0.35,0.6,0.05) |
| IN1 | (0.75,0.2,0.05) | (0.45,0.5,0.05) | (0.45,0.5,0.05) | (0.45,0.5,0.05) | (0.35,0.6,0.05) | (0.35,0.6,0.05) | (0.75,0.2,0.05) | (0,1,0) | (0,1,0) | (0.75,0.2,0.05) | (0.9,0.1,0) | (0.86,0.13,0.01) | (0.68,0.29,0.03) | (0.5,0.45,0.05) | (0,1,0) | (0.35,0.6,0.05) | (0.68,0.29,0.03) | (0,1,0) | (0.35,0.6,0.05) | (0.68,0.29,0.03) | (0.35,0.6,0.05) |
| IN2 | (0.35,0.6,0.05) | (0.9,0.1,0) | (0.86,0.13,0.01) | (0.35,0.6,0.05) | (0.9,0.1,0) | (0.45,0.5,0.05) | (0,1,0) | (0.9,0.1,0) | (0.45,0.5,0.05) | (0,1,0) | (0.45,0.5,0.05) | (0.68,0.29,0.03) | (0.68,0.29,0.03) | (0.68,0.29,0.03) | (0.5,0.45,0.05) | (0.75,0.2,0.05) | (0.35,0.6,0.05) | (0.68,0.29,0.03) | (0.35,0.6,0.05) | (0.5,0.45,0.05) | (0.9,0.1,0) |
| IN3 | (0.45,0.5,0.05) | (0.35,0.6,0.05) | (0.9,0.1,0) | (0.5,0.45,0.05) | (0.75,0.2,0.05) | (0.45,0.5,0.05) | (0,1,0) | (0.75,0.2,0.05) | (0.68,0.29,0.03) | (0.68,0.29,0.03) | (0,1,0) | (0.86,0.13,0.01) | (0.35,0.6,0.05) | (0.86,0.13,0.01) | (0.68,0.29,0.03) | (0.86,0.13,0.01) | (0.35,0.6,0.05) | (0.75,0.2,0.05) | (0.68,0.29,0.03) | (0.86,0.13,0.01) | (0.5,0.45,0.05) |
| IN4 | (0,1,0) | (0.68,0.29,0.03) | (0.68,0.29,0.03) | (0.75,0.2,0.05) | (0.9,0.1,0) | (0,1,0) | (0.68,0.29,0.03) | (0.5,0.45,0.05) | (0.75,0.2,0.05) | (0,1,0) | (0.35,0.6,0.05) | (0,1,0) | (0.35,0.6,0.05) | (0.86,0.13,0.01) | (0.5,0.45,0.05) | (0.68,0.29,0.03) | (0.68,0.29,0.03) | (0.35,0.6,0.05) | (0.9,0.1,0) | (0.86,0.13,0.01) | (0.35,0.6,0.05) |
| IN5 | (0.9,0.1,0) | (0.35,0.0,0.05) | (0.86,0.13,0.01) | (0.68,0.29,0.03) | (0.35,0.6,0.05) | (0.5,0.45,0.05) | (0,1,0) | (0.9,0.1,0) | (0,1,0) | (0.68,0.29,0.03) | (0.68,0.29,0.03) | (0.35,0.6,0.05) | (0,1,0) | (0.75,0.2,0.05) | (0.35,0.6,0.05) | (0.5,0.45,0.05) | (0.86,0.13,0.01) | (0.68,0.29,0.03) | (0.35,0.6,0.05) | (0.35,0.6,0.05) | (0.86,0.13,0.01) |
| PD1 | (0.45,0.5,0.05) | (0.5,0.45,0.05) | (0.9,0.1,0) | (0.45,0.5,0.05) | (0.35,0.6,0.05) | (0.75,0.2,0.05) | (0.86,0.13,0.01) | (0.68,0.29,0.03) | (0,1,0) | (0.86,0.13,0.01) | (0.5,0.45,0.05) | (0.68,0.29,0.03) | (0.68,0.29,0.03) | (0,1,0) | (0.9,0.1,0) | (0.86,0.13,0.01) | (0.75,0.2,0.05) | (0.35,0.6,0.05) | (0.9,0.1,0) | (0,1,0) | (0.75,0.2,0.05) |
| PD2 | (0,1,0) | (0.68,0.29,0.03) | (0.86,0.13,0.01) | (0.75,0.2,0.05) | (0.9,0.1,0) | (0.5,0.45,0.05) | (0.86,0.13,0.01) | (0.35,0.6,0.05) | (0.68,0.29,0.03) | (0.86,0.13,0.01) | (0.75,0.2,0.05) | (0.86,0.13,0.01) | (0.86,0.13,0.01) | (0.9,0.1,0) | (0,1,0) | (0.86,0.13,0.01) | (0.68,0.29,0.03) | (0.5,0.45,0.05) | (0.75,0.2,0.05) | (0.5,0.45,0.05) | |
| PD3 | (0.35,0.6,0.05) | (0.35,0.6,0.05) | (0.75,0.2,0.05) | (0.35,0.0,0.05) | (0.35,0.0,0.05) | (0.35,0.6,0.05) | (0.68,0.29,0.03) | (0.9,0.1,0) | (0.45,0.5,0.05) | (0.75,0.2,0.05) | (0.75,0.2,0.05) | (0.5,0.45,0.05) | (0.35,0.6,0.05) | (0.5,0.45,0.05) | (0.5,0.45,0.05) | (0,1,0) | (0.35,0.6,0.05) | (0.75,0.2,0.05) | (0.5,0.45,0.05) | (0.86,0.13,0.01) | (0.75,0.2,0.05) |
| PD4 | (0.5,0.45,0.05) | (0.75,0.2,0.05) | (0.86,0.13,0.01) | (0.75,0.2,0.05) | (0.45,0.5,0.05) | (0.86,0.13,0.01) | (0.68,0.29,0.03) | (0,1,0) | (0,1,0) | (0,1,0) | (0.68,0.29,0.03) | (0.9,0.1,0) | (0.68,0.29,0.03) | (0.68,0.29,0.03) | (0.68,0.29,0.03) | (0.68,0.29,0.03) | (0,1,0) | (0.86,0.13,0.01) | (0.75,0.2,0.05) | (0.35,0.6,0.05) | (0.68,0.29,0.03) |
| PD5 | (0.68,0.29,0.03) | (0.35,0.6,0.05) | (0.75,0.2,0.05) | (0.86,0.13,0.01) | (0.9,0.1,0) | (0.35,0.6,0.05) | (0,1,0) | (0.5,0.45,0.05) | (0.86,0.13,0.01) | (0.68,0.29,0.03) | (0.35,0.6,0.05) | (0.86,0.13,0.01) | (0.35,0.6,0.05) | (0.9,0.1,0) | (0.68,0.29,0.03) | (0,1,0) | (0.75,0.2,0.05) | (0,1,0) | (0,1,0) | (0.75,0.2,0.05) | (0.5,0.45,0.05) |
| SC1 | (0.86,0.13,0.01) | (0.35,0.6,0.05) | (0.9,0.1,0) | (0,1,0) | (0.86,0.13,0.01) | (0.45,0.5,0.05) | (0,1,0) | (0.35,0.6,0.05) | (0.68,0.29,0.03) | (0.75,0.2,0.05) | (0.35,0.6,0.05) | (0.35,0.6,0.05) | (0.68,0.29,0.03) | (0.35,0.6,0.05) | (0,1,0) | (0.35,0.6,0.05) | (0.86,0.13,0.01) | (0.75,0.2,0.05) | (0,1,0) | (0.86,0.13,0.01) | (0.9,0.1,0) |
| SC2 | (0.35,0.6,0.05) | (0.9,0.1,0) | (0.75,0.2,0.05) | (0.5,0.45,0.05) | (0.75,0.2,0.05) | (0.75,0.2,0.05) | (0.68,0.29,0.03) | (0.9,0.1,0) | (0,1,0) | (0.68,0.29,0.03) | (0.68,0.29,0.03) | (0.5,0.45,0.05) | (0.9,0.1,0) | (0.68,0.29,0.03) | (0.5,0.45,0.05) | (0.68,0.29,0.03) | (0.35,0.6,0.05) | (0.5,0.45,0.05) | (0.35,0.6,0.05) | (0,1,0) | (0.75,0.2,0.05) |
| SC3 | (0.68,0.29,0.03) | (0.5,0.45,0.05) | (0.86,0.13,0.01) | (0.35,0.6,0.05) | (0.9,0.1,0) | (0.9,0.1,0) | (0.5,0.45,0.05) | (0.86,0.13,0.01) | (0.75,0.2,0.05) | (0.86,0.13,0.01) | (0.75,0.2,0.05) | (0.5,0.45,0.05) | (0.68,0.29,0.03) | (0.35,0.6,0.05) | (0.68,0.29,0.03) | (0.86,0.13,0.01) | (0.35,0.6,0.05) | (0,1,0) | (0.75,0.2,0.05) | (0.35,0.6,0.05) | (0,1,0) |
| OG1 | OG2 | OG3 | OG4 | TC1 | TC2 | TC3 | TC4 | IN1 | IN2 | IN3 | IN4 | IN5 | PD1 | PD2 | PD3 | PD4 | PD5 | SC1 | SC2 | SC3 | |
|---|---|---|---|---|---|---|---|---|---|---|---|---|---|---|---|---|---|---|---|---|---|
| OG1 | 0.053 | 0.39 | 0.061 | 0.038 | 0.0608 | −0.25 | 0.73 | 0.39 | 0.038 | 0.0418 | −0.25 | 0.061 | 0.0418 | 0.038 | −0.25 | −0.04 | 0.038 | −0.19 | −0.04 | −0.25 | 0.052 |
| OG2 | 0.052 | −0.19 | 0.042 | −0.25 | 0.052 | 0.39 | 0.038 | −0.19 | 0.052 | −0.076 | 0.05 | 0.052 | −0.04 | 0.0418 | −0.19 | −0.19 | 0.052 | 0.052 | 0.0418 | −0.19 | −0.076 |
| OG3 | 0.0608 | 0.39 | 0.052 | 0.39 | 0.038 | 0.042 | −0.25 | −0.04 | −0.25 | 0.73 | −0.19 | 0.038 | −0.19 | −0.04 | −0.04 | 0.061 | 0.052 | −0.04 | −0.04 | 0.042 | −0.04 |
| OG4 | −0.04 | 0.0418 | 0.061 | −0.25 | 0.052 | 0.73 | 0.0418 | −0.25 | 0.038 | 0.0608 | −0.25 | 0.061 | −0.25 | −0.19 | 0.39 | −0.25 | −0.04 | 0.0608 | 0.038 | 0.73 | −0.19 |
| TC1 | 0.0608 | 0.038 | −0.25 | 0.038 | −0.19 | 0.038 | 0.0608 | 0.39 | 0.0608 | 0.39 | 0.04 | −0.25 | 0.0608 | −0.04 | −0.19 | −0.08 | 0.061 | 0.038 | −0.25 | −0.04 | −0.076 |
| TC2 | 0.73 | −0.19 | −0.076 | −0.25 | 0.39 | 0.042 | −0.25 | −0.25 | 0.0608 | 0.052 | −0.08 | −0.19 | −0.25 | 0.0608 | 0.73 | −0.19 | 0.052 | −0.19 | 0.038 | −0.19 | 0.053 |
| TC3 | −0.25 | 0.038 | 0.042 | 0.0608 | −0.19 | −0.25 | 0.0418 | 0.052 | −0.19 | −0.076 | 0.05 | −0.08 | 0.0418 | 0.39 | 0.038 | 0.042 | 0.038 | −0.25 | −0.04 | −0.076 | 0.0418 |
| TC4 | 0.038 | −0.04 | 0.038 | 0.39 | 0.052 | 0.042 | −0.04 | −0.19 | 0.73 | 0.052 | −0.19 | −0.25 | 0.038 | 0.0418 | 0.038 | −0.04 | −0.076 | 0.038 | −0.25 | 0.73 | −0.25 |
| IN1 | −0.19 | 0.038 | −0.076 | 0.052 | 0.0418 | −0.04 | 0.038 | 0.73 | 0.0608 | −0.19 | 0.04 | 0.061 | −0.04 | 0.0608 | 0.042 | 0.061 | −0.19 | 0.0608 | 0.0608 | 0.39 | −0.19 |
| IN2 | −0.25 | 0.0418 | 0.052 | 0.038 | 0.052 | 0.73 | 0.038 | 0.0608 | −0.25 | 0.73 | 0.06 | 0.39 | −0.25 | −0.04 | 0.052 | 0.061 | 0.73 | 0.052 | 0.053 | −0.04 | 0.0608 |
| IN3 | 0.39 | 0.038 | −0.076 | 0.0608 | 0.038 | 0.042 | −0.25 | 0.052 | 0.73 | −0.25 | 0.06 | 0.73 | −0.19 | −0.25 | −0.08 | −0.04 | −0.25 | −0.04 | −0.076 | 0.73 | −0.04 |
| IN4 | 0.038 | 0.0608 | −0.25 | 0.73 | 0.038 | −0.19 | −0.04 | −0.25 | −0.25 | −0.076 | −0.25 | −0.04 | −0.076 | 0.0608 | −0.25 | 0.39 | 0.061 | −0.25 | −0.04 | 0.39 | 0.0418 |
| IN5 | −0.25 | −0.076 | −0.25 | 0.0418 | −0.25 | 0.052 | 0.0608 | 0.73 | −0.19 | 0.052 | −0.08 | 0.39 | −0.25 | −0.076 | 0.061 | −0.08 | −0.25 | 0.0608 | 0.0418 | −0.19 | −0.04 |
| PD1 | −0.19 | 0.038 | 0.39 | 0.052 | −0.19 | 0.042 | −0.04 | −0.25 | −0.076 | 0.052 | 0.04 | −0.08 | 0.0608 | 0.052 | 0.39 | 0.038 | −0.25 | 0.038 | 0.0608 | 0.39 | 0.038 |
| PD2 | 0.038 | −0.25 | 0.042 | −0.25 | 0.038 | 0.73 | −0.19 | 0.052 | 0.39 | 0.73 | 0.04 | −0.25 | 0.0418 | −0.25 | −0.19 | −0.25 | −0.19 | −0.076 | −0.04 | −0.25 | 0.0418 |
| PD3 | −0.19 | 0.052 | −0.25 | 0.038 | −0.19 | −0.25 | 0.038 | −0.25 | −0.19 | 0.0418 | 0.06 | 0.038 | 0.052 | 0.052 | 0.038 | −0.08 | 0.73 | 0.052 | −0.25 | −0.076 | 0.39 |
| PD4 | −0.25 | 0.038 | 0.042 | 0.73 | −0.25 | 0.038 | −0.04 | 0.0608 | 0.052 | −0.19 | −0.08 | −0.04 | 0.0608 | −0.076 | 0.061 | −0.25 | 0.39 | −0.25 | −0.19 | 0.052 | −0.04 |
| PD5 | 0.0418 | −0.19 | 0.061 | 0.0418 | 0.038 | −0.04 | 0.0608 | −0.076 | −0.25 | −0.076 | −0.25 | 0.73 | 0.038 | 0.0608 | 0.73 | −0.08 | 0.038 | 0.39 | −0.076 | 0.042 | 0.053 |
| SC1 | −0.25 | 0.038 | −0.19 | 0.0418 | 0.052 | 0.038 | −0.04 | −0.25 | 0.39 | 0.0608 | −0.19 | −0.25 | 0.73 | −0.076 | 0.038 | 0.061 | 0.052 | 0.038 | −0.19 | 0.39 | 0.038 |
| SC2 | 0.0608 | −0.19 | 0.39 | 0.038 | −0.25 | 0.042 | 0.73 | −0.076 | −0.25 | −0.076 | 0.39 | −0.08 | −0.25 | −0.04 | 0.39 | 0.042 | −0.04 | −0.25 | −0.19 | −0.25 | 0.0418 |
| SC3 | 0.39 | −0.25 | −0.25 | 0.038 | 0.39 | −0.076 | 0.038 | 0.73 | 0.0608 | 0.73 | 0.04 | 0.038 | 0.0608 | −0.25 | −0.04 | 0.061 | 0.052 | 0.0608 | −0.04 | −0.04 | 0.0608 |
| OG1 | OG2 | OG3 | OG4 | TC1 | TC2 | TC3 | TC4 | IN1 | IN2 | IN3 | IN4 | IN5 | PD1 | PD2 | PD3 | PD4 | PD5 | SC1 | SC2 | SC3 | |
|---|---|---|---|---|---|---|---|---|---|---|---|---|---|---|---|---|---|---|---|---|---|
| OG1 | 0.1528 | 0.2059 | 0.0856 | −0.0046 | 0.0935 | 0.0199 | −0.1203 | 0.0311 | −0.0816 | 0.0201 | 0.0097 | 0.0248 | 0.0513 | 0.103 | 0.3533 | 0.0323 | 0.0531 | 0.5333 | 0.511 | 0.0038 | 0.055 |
| OG2 | 0.1021 | 0.0252 | 0.0037 | 0.339 | 0.0826 | −0.0947 | 0.0738 | −0.0709 | 0.0026 | 0.182 | 0.2717 | −0.114 | 0.0563 | −0.1984 | 0.0087 | −0.108 | −0.054 | 0.0087 | 0.1852 | 0.1343 | −0.0579 |
| OG3 | −0.1512 | 0.0571 | 0.0031 | 0.0465 | −0.04 | 0.137 | 0.027 | −0.0056 | −0.005 | −0.0044 | 0.3954 | 0.391 | 0.059 | 0.4417 | 0.1727 | −0.041 | −0.029 | 0.2721 | −0.2144 | 0.0242 | 0.0487 |
| OG4 | 0.137 | 0.198 | −0.0168 | −0.0406 | 0.0414 | 0.1005 | −0.1158 | −0.038 | −0.0841 | −0.0074 | 0.0913 | 0.0726 | −0.118 | 0.1529 | 0.3954 | 0.377 | 0.3321 | 0.3953 | 0.107 | 0.1427 | −0.16 |
| TC1 | −0.0805 | −0.0168 | 0.0531 | 0.0583 | 0.1055 | −0.1445 | −0.0433 | 0.0479 | 0.0884 | 0.0933 | 0.3607 | 0.1572 | 0.1065 | 0.0385 | 0.0813 | 0.3326 | 0.1976 | 0.1747 | 0.2217 | 0.0037 | 0.141 |
| TC2 | 0.0884 | 0.0031 | 0.198 | −0.0928 | 0.0685 | 0.055 | −0.0527 | −0.0884 | −0.0209 | −0.1916 | 0.055 | 0.0703 | 0.0769 | 0.0788 | 0.4607 | 0.0613 | 0.2727 | 0.0571 | 0.2954 | 0.0031 | −0.0097 |
| TC3 | −0.0114 | 0.0037 | 0.2059 | 0.1095 | 0.0775 | 0.0481 | 0.0532 | 0.0526 | 0.0732 | 0.0611 | 0.0595 | −0.0259 | 0.0577 | 0.0502 | 0.066 | 0.1075 | −0.2281 | 0.2605 | 0.6446 | 0.0723 | 0.0265 |
| TC4 | −0.012 | 0.0856 | 0.0023 | 0.0769 | −0.078 | −0.0472 | −0.0417 | 0.0449 | 0.0313 | 0.1427 | −0.0693 | 0.0308 | 0.2951 | 0.0466 | 0.0485 | −0.006 | 0.0341 | −0.0321 | 0.0566 | 0.0531 | 0.0775 |
| IN1 | 0.0038 | 0.0723 | −0.2126 | −0.0523 | −0.018 | −0.1174 | −0.1452 | −0.018 | −0.0711 | 0.0242 | 0.2339 | 0.0298 | −0.029 | 0.3961 | −0.0693 | −0.21 | −0.1651 | −0.1543 | 0.2519 | 0.2212 | −0.0585 |
| IN2 | 0.0301 | 0.182 | −0.0417 | 0.0755 | 0.0058 | −0.0289 | 0.3528 | −0.1925 | −0.0758 | 0.0291 | −0.0552 | 0.0789 | −0.206 | 0.137 | 0.3329 | −0.321 | 0.0333 | 0.091 | 0.4523 | 0.0313 | 0.0401 |
| IN3 | 0.0324 | −0.0074 | −0.088 | 0.1655 | 0.0014 | −0.0289 | −0.1005 | −0.0619 | −0.1408 | 0.0556 | 0.1026 | 0.0131 | 0.0044 | 0.0366 | −0.0552 | 0.4225 | 0.766 | −0.088 | −0.1137 | 0.1626 | −0.12 |
| IN4 | −0.0114 | 0.0611 | 0.1938 | 0.1658 | 0.1007 | −0.0416 | 0.0503 | 0.0336 | 0.0275 | −0.2888 | −0.11 | 0.0734 | 0.0806 | −0.4515 | 0.0813 | −0.034 | 0.391 | 0.5113 | 0.0039 | −0.0732 | −0.14 |
| IN5 | 0.0602 | 0.1427 | 0.0252 | −0.3418 | −0.076 | 0.141 | 0.1149 | −0.0093 | −0.0314 | 0.3986 | 0.2464 | 0.0178 | −0.118 | −0.3022 | 0.0033 | 0.2021 | 0.1807 | 0.0755 | −0.089 | 0.0131 | 0.0365 |
| PD1 | 0.0058 | −0.2888 | 0.2059 | −0.0901 | 0.0247 | −0.15 | 0.0297 | 0.2504 | 0.1002 | 0.0324 | −0.0813 | 0.1418 | 0.0769 | 0.1532 | 0.1765 | 0.0428 | 0.3954 | −0.1814 | 0.0655 | 0.125 | −0.118 |
| PD2 | 0.0657 | 0.3986 | 0.5335 | 0.0686 | 0.1033 | −0.0097 | 0.0627 | 0.0775 | 0.2443 | −0.0657 | −0.0257 | −0.0527 | 0.0563 | 0.4312 | 0.0584 | 0.0676 | 0.0913 | −0.0442 | 0.0812 | −0.0192 | 0.036 |
| PD3 | −0.1789 | 0.0324 | 0.1529 | −0.1183 | −0.089 | 0.0265 | 0.0595 | −0.0218 | 0.0731 | −0.0197 | 0.2508 | 0.008 | −0.023 | 0.5129 | −0.1542 | 0.1324 | 0.1959 | 0.1549 | 0.043 | 0.125 | 0.255 |
| PD4 | −0.2487 | −0.0657 | 0.0304 | 0.0769 | 0.0815 | 0.0342 | −0.0004 | −0.0087 | 0.0383 | 0.0058 | 0.1959 | −0.084 | −0.081 | 0.0901 | −0.1835 | −0.15 | −0.11 | 0.1912 | 0.3618 | 0.1007 | 0.0581 |
| PD5 | −0.1984 | −0.0197 | −0.088 | −0.0458 | −0.031 | −0.1005 | 0.0201 | 0.0206 | 0.2998 | −0.0853 | 0.0484 | 0.0317 | 0.1065 | 0.1982 | 0.1856 | 0.3411 | −0.0553 | 0.0323 | 0.0279 | 0.0703 | −0.215 |
| SC1 | −0.0168 | 0.0058 | 0.1938 | 0.059 | 0.101 | 0.0187 | 0.0354 | −0.0611 | −0.0345 | −0.012 | 0.0444 | 0.0793 | 0.0654 | 0.0481 | 0.148 | 0.1174 | 0.0697 | 0.1033 | −0.0495 | 0.0449 | −0.3022 |
| SC2 | 0.0385 | −0.0853 | 0.0252 | 0.0513 | 0.0647 | 0.0274 | −0.0611 | −0.0443 | −0.0314 | 0.0016 | −0.1127 | −0.2281 | −0.138 | 0.1681 | 0.057 | 0.1347 | 0.462 | −0.006 | −0.0765 | −0.038 | −0.013 |
| SC3 | 0.198 | −0.012 | 0.0385 | 0.1065 | 0.218 | 0.0647 | 0.0206 | 0.2504 | −0.0303 | 0.0301 | 0.0731 | 0.2091 | 0.4996 | 0.2437 | 0.2093 | −0.212 | 0.1621 | 0.1181 | 0.0543 | −0.0433 | −0.1174 |
| Barrier Categories | D | P | D + P | D − P | Importance Weights |
|---|---|---|---|---|---|
| Organizational (OG) | 2.102 | 1.831 | 3.933 | 0.271 | 3.942 |
| Technological (TC) | 0.049 | 1.398 | 1.447 | −1.349 | 1.977 |
| Institutional (IN) | 3.725 | 2.833 | 6.558 | 0.892 | 6.618 |
| Product-related (PD) | 4.676 | 2.097 | 6.773 | 2.579 | 7.247 |
| Supply chain-related (SC) | 0.302 | 0.863 | 1.165 | −0.561 | 1.292 |
| Reverse Logistics Barriers | D | P | D + P | D − P | Importance Weights |
|---|---|---|---|---|---|
| Insufficient top management commitment (OG1) | 2.133 | 0.0055 | 2.1385 | 2.1275 | 3.016 |
| Financial constraints (OG2) | 0.7778 | 0.9778 | 1.7556 | −0.2 | 1.865 |
| Poor strategic planning of reverse logistics policies (OG3) | 1.5848 | 1.5038 | 3.0886 | 0.081 | 3.089 |
| Poor organizational culture (OG4) | 1.9622 | 0.613 | 2.5752 | 1.3492 | 2.907 |
| Inadequate performance measurement system (TC1) | 1.9769 | 0.8384 | 2.8153 | 1.1385 | 3.036 |
| Lack of proper infrastructure and supporting technologies for reverse logistics practices (TC2) | 1.3882 | −0.0904 | 1.2978 | 1.2978 | 1.826 |
| Negative past experience with innovative technologies (TC3) | 1.7642 | 0.219 | 1.9832 | 1.5452 | 2.526 |
| Low technical expertise/competence of employees (TC4) | 0.7402 | 0.1885 | 0.9287 | 0.5517 | 1.079 |
| Inadequate government policies and support (IN1) | −0.087 | 0.3718 | 0.2843 | −0.4593 | 0.5400 |
| Absence of public awareness on reverse logistics adaptation (IN2) | 0.9511 | 0.4017 | 1.3528 | 0.5494 | 1.4600 |
| Market instability and uncertainty of customers’ behavior (IN3) | 0.9583 | 1.9846 | 2.9429 | −1.0263 | 3.116 |
| Low competitive pressure (IN4) | 0.6234 | 0.9249 | 1.5483 | −0.3015 | 1.577 |
| Lack of corporate social responsibility (IN5) | 0.6904 | 0.879 | 1.5694 | −0.1886 | 1.580 |
| Low product quality (PD1) | 0.9166 | 2.3748 | 3.2914 | −1.4582 | 3.599 |
| Low traceability of product life cycle (PD2) | 2.159 | 2.3767 | 4.5357 | −0.2177 | 1.450 |
| Improper marketing strategies for recovered products (PD3) | 1.4169 | 1.2887 | 2.7056 | 0.1282 | 2.708 |
| Risk of storing hazardous materials (PD4) | 0.3333 | 2.9955 | 3.3288 | −2.6622 | 4.262 |
| Insufficient knowledge of the expected values and pricing of returned products (PD5) | 0.5431 | 2.4733 | 3.0164 | −1.9302 | 3.581 |
| Minimal collaboration among supply chain partners (SC1) | 0.6581 | 2.8202 | 3.4783 | −2.1621 | 4.095 |
| Geographical location of facilities not close to end-customers (SC2) | 0.196 | 1.1576 | 1.3536 | −0.9616 | 3.551 |
| Insufficient trust in third party logistics (SC3) | 2.0811 | −0.5373 | 1.5438 | 2.6184 | 2.656 |
| Barrier Categories | Importance Weights by Group 1 | Importance Weights by Group 2 | Importance Weights by Group 3 | Importance Weights by Group 4 |
|---|---|---|---|---|
| Organizational (OG) | 3.942 | 5.453 | 3.124 | 1.676 |
| Technological (TC) | 1.977 | 2.183 | 1.561 | 2.833 |
| Institutional (IN) | 6.618 | 2.007 | 1.796 | 1.392 |
| Product-related (PD) | 7.247 | 1.783 | 1.923 | 1.524 |
| Supply chain-related (SC) | 1.292 | 1.537 | 0.392 | 2.119 |
| Reverse Logistics Barriers | Importance Weights by Group 1 | Importance Weights by Group 2 | Importance Weights by Group 3 | Importance Weights by Group 4 |
|---|---|---|---|---|
| Insufficient top management commitment (OG1) | 3.016 | 1.526 | 1.573 | 2.49 |
| Financial constraints (OG2) | 1.865 | 2.4 | 2.087 | 2.013 |
| Poor strategic planning of reverse logistics policies (OG3) | 3.089 | 1.006 | 2.532 | 3.544 |
| Poor organizational culture (OG4) | 2.907 | 1.820 | 3.231 | 3.243 |
| Inadequate performance measurement system (TC1) | 3.036 | 1.296 | 2.925 | 2.315 |
| Lack of proper infrastructure and supporting technologies for reverse logistics practices (TC2) | 1.826 | 1.684 | 2.673 | 1.368 |
| Negative past experience with innovative technologies (TC3) | 2.526 | 2.387 | 2.933 | 0.380 |
| Low technical expertise/competence of employees (TC4) | 1.079 | 0.304 | 1.853 | 1.166 |
| Inadequate government policies and support (IN1) | 0.540 | 0.210 | 1.081 | 0.391 |
| Absence of public awareness on reverse logistics adaptation (IN2) | 1.460 | 1.301 | 2.842 | 2.193 |
| Market instability and uncertainty of customers’ behavior (IN3) | 3.116 | 1.053 | 3.660 | 1.172 |
| Low competitive pressure (IN4) | 1.577 | 1.090 | 2.397 | 1.849 |
| Lack of corporate social responsibility (IN5) | 1.580 | 1.035 | 2.463 | 2.496 |
| Low product quality (PD1) | 3.599 | 2.125 | 3.445 | 2.862 |
| Low traceability of product life cycle (PD2) | 1.450 | 1.043 | 4.572 | 1.104 |
| Improper marketing strategies for recovered products (PD3) | 2.708 | 1.026 | 1.090 | 1.336 |
| Risk of storing hazardous materials (PD4) | 4.262 | 2.087 | 2.087 | 2.176 |
| Insufficient knowledge of the expected values and pricing of returned products (PD5) | 3.581 | 2.725 | 0.098 | 2.335 |
| Minimal collaboration among supply chain partners (SC1) | 4.095 | 3.647 | 2.193 | 2.382 |
| Geographical location of facilities not close to end-customers (SC2) | 3.551 | 4.725 | 1.832 | 1.772 |
| Insufficient trust in third party logistics (SC3) | 2.656 | 3.674 | 2.383 | 0.614 |
| Barrier Categories | Positive Solution (PDi) | Negative Solution (NDi) | Aggregated Positive Solution (APi) | Aggregated Negative Solution (ANi) | Appraisal Scores (ASi) | Ranking |
|---|---|---|---|---|---|---|
| Organizational | 0.431 | 0.875 | 0.907 | 0.586 | 0.5 | 3 |
| Technological | 0.210 | 0.125 | 0.512 | 0.264 | 0.556 | 2 |
| Institutional | 0.323 | 0.401 | 0.273 | 0.103 | 0.562 | 1 |
| Product-related | 0.155 | 0.433 | 0.612 | 0.511 | 0.4 | 4 |
| Supply chain-related | 0.691 | 0.205 | 0.532 | 0.561 | 0.314 | 5 |
| Reverse Logistics Barriers | Positive Solution (PDi) | Negative Solution (NDi) | Aggregated Positive Solution (APi) | Aggregated Negative Solution (ANi) | Appraisal Scores (ASi) | Ranking |
|---|---|---|---|---|---|---|
| Insufficient top management commitment (OG1) | 0.631 | 0.081 | 0.980 | 0.876 | 0.552 | 6 |
| Financial constraints (OG2) | 0.272 | 0.821 | 0.715 | 0.565 | 0.575 | 4 |
| Poor strategic planning of reverse logistics policies (OG3) | 0.423 | 0.907 | 0.483 | 0.403 | 0.493 | 10 |
| Poor organizational culture (OG4) | 0.203 | 0.646 | 0.364 | 0.000 | 0.54 | 7 |
| Inadequate performance measurement system (TC1) | 0.961 | 0.593 | 0.660 | 0.753 | 0.453 | 12 |
| Lack of proper infrastructure and supporting technologies for reverse logistics practices (TC2) | 0.917 | 0.628 | 0.230 | 0.633 | 0.298 | 19 |
| Negative past experience with innovative technologies (TC3) | 0.318 | 0.818 | 0.383 | 0.713 | 0.335 | 17 |
| Low technical expertise/competence of employees (TC4) | 0.132 | 0.339 | 0.890 | 0.561 | 0.664 | 3 |
| Inadequate government policies and support (IN1) | 0.879 | 0.953 | 0.338 | 0.382 | 0.478 | 11 |
| Absence of public awareness on reverse logistics adaptation (IN2) | 0.985 | 0.735 | 0.008 | 0.527 | 0.240 | 20 |
| Market instability and uncertainty of customers’ behavior (IN3) | 0.593 | 0.634 | 0.836 | 1.000 | 0.418 | 14 |
| Low competitive pressure (IN4) | 0.459 | 0.237 | 0.136 | 0.523 | 0.306 | 18 |
| Lack of corporate social responsibility (IN5) | 0.364 | 0.295 | 0.375 | 0.641 | 0.367 | 16 |
| Low product quality (PD1) | 0.673 | 0.275 | 1.000 | 0.328 | 0.836 | 1 |
| Low traceability of product life cycle (PD2) | 0.236 | 0.146 | 0.647 | 0.768 | 0.439 | 13 |
| Improper marketing strategies for recovered products (PD3) | 0.726 | 0.668 | 0.652 | 0.539 | 0.556 | 5 |
| Risk of storing hazardous materials (PD4) | 0.615 | 0.482 | 0.647 | 0.091 | 0.778 | 2 |
| Insufficient knowledge of the expected values and pricing of returned products (PD5) | 0.781 | 0.121 | 0.463 | 0.432 | 0.515 | 9 |
| Minimal collaboration among supply chain partners (SC1) | 0.126 | 0.208 | 0.328 | 0.593 | 0.203 | 21 |
| Geographical location of facilities not close to end-customers (SC2) | 1.959 | 0.365 | 0.374 | 0.543 | 0.415 | 15 |
| Insufficient trust in third party logistics (SC3) | 0.221 | 0.525 | 0.351 | 0.277 | 0.537 | 8 |
Publisher’s Note: MDPI stays neutral with regard to jurisdictional claims in published maps and institutional affiliations. |
© 2021 by the authors. Licensee MDPI, Basel, Switzerland. This article is an open access article distributed under the terms and conditions of the Creative Commons Attribution (CC BY) license (https://creativecommons.org/licenses/by/4.0/).
Share and Cite
U-Dominic, C.M.; Orji, I.J.; Okwu, M. Analyzing the Barriers to Reverse Logistics (RL) Implementation: A Hybrid Model Based on IF-DEMATEL-EDAS. Sustainability 2021, 13, 10876. https://doi.org/10.3390/su131910876
U-Dominic CM, Orji IJ, Okwu M. Analyzing the Barriers to Reverse Logistics (RL) Implementation: A Hybrid Model Based on IF-DEMATEL-EDAS. Sustainability. 2021; 13(19):10876. https://doi.org/10.3390/su131910876
Chicago/Turabian StyleU-Dominic, Chukwuebuka M., Ifeyinwa Juliet Orji, and Modestus Okwu. 2021. "Analyzing the Barriers to Reverse Logistics (RL) Implementation: A Hybrid Model Based on IF-DEMATEL-EDAS" Sustainability 13, no. 19: 10876. https://doi.org/10.3390/su131910876