Article

Urban Sustainability and Climate Issues: The Effect of Physical Parameters of Streetscape on the Thermal Comfort in Urban Public Spaces; Case Study: Karimkhan-e-Zand Street, Shiraz, Iran

by
Ali Reza Sadeghi
1,* and
Yasaman Bahadori
2
1
Department of Urban Planning & Design, Faculty of Art and Architecture, Shiraz University, Shiraz 7188637911, Iran
2
Department of Political Science, College of Liberal Arts, Auburn University, Auburn, AL 36849, USA
*
Author to whom correspondence should be addressed.
Sustainability 2021, 13(19), 10886; https://doi.org/10.3390/su131910886
Submission received: 16 August 2021 / Revised: 10 September 2021 / Accepted: 17 September 2021 / Published: 30 September 2021
(This article belongs to the Special Issue Sustainability: Urban Technology and the Climate Crisis)

Abstract

:
One of the most important issues in urban studies relating to climate and environmental sustainability is the analysis of the thermal conditions of urban public spaces, especially urban streets, since this issue seems to affect the comfort of citizens using such spaces. Thus, the main aim of the present study is to investigate the effect of streetscape parameters on the thermal comfort of citizens using urban streets in a hot summer and in a hot semi-arid climate. For this purpose, Karimkhan-e-Zand Street in Shiraz, Iran, was selected as the case study. The selected street is a historical and popular public space of Shiraz. In the present study, using physical and micro-climatic data analyzed in ENVI-met v4 software, the thermal comfort conditions of Karimkhan-e-Zand in Shiraz on 10 July were simulated during the hottest day of the year. Furthermore, the relationships between physical street parameters and micro-climatic parameters and their effects on the thermal comfort index (PMV) were investigated through running a set of regressions in STATA 14 and analysis of ENVI-met v4 output maps. The results of the present study show that the thermal comfort of the citizens, which is determined by the PMV index values, is in very poor condition in almost all the studied hours, and the air temperature has the greatest effect compared to other micro-climatic parameters on the PMV index. The results of present study also show a significant relationship between the sky view factor and mean radiant temperature, as well as between the surface albedo and relative humidity. Furthermore, the type of vegetation and the aspect ratio of the street affect the level of increase in thermal comfort on the street.

1. Introduction

In recent decades, the principles of urban sustainability have guided development in urban areas and metropolises to achieve socially, economically, and environmentally sustainable standards. The goals are mainly focused on reducing greenhouse gas emissions [1]. Increased greenhouse gas emissions are causing climate change, and this change in climate affects the urban microclimate [2]. Meanwhile, the urban microclimate is one of the most important factors in the presence of people in urban spaces and also the quality of outdoor spaces, and it is highly probable that urban areas will experience a sharp rise in global temperature in future decades, because of the presence of more than half of the world’s population in cities and the consequences of global climate change [3], which are considered a threat to human health, well-being, and thermal comfort [4]. Therefore, research on the improvement of urban microclimate and, consequently, creating the thermal comfort of people in urban spaces in order to reduce climate change in cities is one of the most important and interesting topics in the study of climate change. Studies on thermal comfort in the outdoors have shown that the thermal environment in these spaces is not only influenced by microclimatic parameters, such as solar radiation, air temperature, humidity, wind, and rainfall [1,2], but it is also considerably affected by the built environment design factors [3]. Human beings can modify the physically controllable factors of the built environment through proper design and planning, and consequently, improve uncontrollable microclimatic factors [4]. Among outdoor urban spaces, streets occupy the most space [5]. About 30–35 percent of street space is allocated to private spaces and 50 percent is allocated to open spaces, which influence the thermal comfort of pedestrians and urban energy consumption [6].
In general, the improvement of thermal comfort in outdoor spaces is affected by various physical factors of the street environment, as well as microclimatic factors. Therefore, the purpose of this study is to investigate the effect of streetscape parameters on outdoor thermal comfort in urban spaces, and Karimkhan-e-Zand Street in Shiraz in the hot semi-arid climate of Shiraz has been selected to investigate this issue.

1.1. Outdoor Thermal Comfort

Thermal comfort focuses on several disciplines, including physics (especially heat transfer and meteorology) and physiology. However, most importantly, it falls within the scope of psychology to the extent that it is defined as “condition of mind that expresses satisfaction with the thermal environment” [7]. Thermal comfort also has been described by Hansen [8] as “a state in which there are no driving impulses to modify the environment with the behavior.”
In open space, thermal comfort is defined as “lack of any discomfort and dissatisfaction or when the individuals feel neither cold nor hot” [9,10]. The six parameters that are included in the comfort equation contain four microclimatic parameters, namely air temperature (ta), mean radiant temperature (tr), relative humidity (rh), and wind speed (V), which influence heat transfer to or from the body. Two other parameters include the metabolic rate and clothing insulation. These parameters are combined in a balanced thermal index of thermal comfort and represent the thermal comfort experienced by a normal person in the open space as a metric measure. One of the most practical indexes of thermal comfort is the predicted mean vote (PMV) that predicts the average thermal sensation of individuals obtained from six comfort parameters and presents the result based on a 7-point spectral scale ranging from −3 (very cold) to +3 (very hot). In the ASHRAE standard [11] (The American Society of Heating, Refrigerating and Air-Conditioning Engineers (ASHRAE), founded in 1894, is a global society advancing human well-being through sustainable technology for the built environment), acceptable thermal conditions, known as the comfort zone, include PMV values between +0.5 and −0.5 [12]. However, it is expected that environmental conditions in outdoor spaces include a wider range than indoor spaces because indoor spaces, unlike outdoor spaces, are usually controlled and adjusted by architectural or mechanical systems. Accordingly, the outdoor comfort zone can be outside the PMV range between +0.5 to −0.5. According to the studies on thermal comfort in open and semi-open spaces in Sydney [13] and in Tokyo [14], there is a difference of 4 or 5 degrees Celsius between the optimal indoor and outdoor comfort conditions.

1.2. Physical Parameters of Streetscape Affecting Thermal Comfort

Sky view factor (SVF) is one of the indexes of urban canyon (street canyons are referred to a U-shaped space between the adjoining building structures) geometry that influences surface energy balance, local air circulation, and outdoor thermal comfort [3]. SVF actually represents the extent to which a specific location is in the view of the sky and the amount of shading of adjacent elements from zero to one, where a zero score denotes no sky view and the score 1 denotes full sky view [15]. Many studies have shown that with decreasing SVF levels, air temperature also decreases during the day [16]. The aspect ratio (H/W) of an urban canyon is also an important geometric variable that indicates the density of an urban fabric. When the urban fabric is dense, buildings cast shadows on the surrounding spaces and cause a reduction in the heat generated by solar radiation [17]. The other physical parameter of the streetscape that can greatly improve the thermal comfort of pedestrians in urban canyons is vegetation. There are many studies indicating the capability of green infrastructure in effective reduction of city heat and improvement of thermal comfort [18,19,20,21]. In particular, the impact of the trees’ shade decreases the mean radiant temperature (MRT) in the street, which is one of the most important determinants of thermal sensation [22]. However, the reduction level of solar radiation and MRT varies in different tree types and structural features, such as leaf density, tree height, canopy diameter, coverage ratio, and proximity to each other (single or cluster) [23]. Land cover also plays an important role in modifying extreme temperatures in streets. In fact, the closer we get to the ground surface, the more severe the environmental conditions, because solar radiation increases the ground temperature during the day, and the temperature on the ground surface reduces at night due to evaporation and output radiation. Artificial urban surfaces and areas tend to increase temperature and reduce humidity. Such surfaces reflect the heat to their surrounding air layers. On the other hand, natural land cover, e.g., grass, helps balance extreme temperatures [24]. The materials used in streets are the other parameter affecting thermal comfort. Materials are thermally defined by albedos. The albedo of any object is strongly related to the color of the material. Rough and dark-colored surfaces tend to absorb more solar radiation than smooth, light-colored and flat surfaces. Therefore, dark-colored surfaces are warmer than light-colored surfaces. However, a simulated study in Los Angeles found that brightly colored sidewalks increased the reflection of sunlight from the ground to pedestrians and ultimately intensified the mean radiant temperature [25].
Extensive thermal comfort research has been performed on a number of parameters. Abreu-Harbich et al. [26] in a 2015 study evaluated the impact of different tree species by designing different plantings, both individually and in clusters, on the thermal comfort of individuals in the tropics. In a 2017 study, Morakinyo et al. [27] examined urban greenery (leaf area index, tree canopy width, tree height, and trunk height), the aspect ratio, and the interaction between two types of shade (trees and buildings). In another study in 2018, Morakinyo et al. [28] examined the impact of species and tree placement on thermal comfort in Hong Kong. Zhang et al. [29] also evaluated street orientation, aspect ratio, surface albedo, and vegetation in the hot and humid area of China in 2017. Zhao et al. [30] investigated the effect of tree density, tree location, and arrangement (dense, equal, or scattered distances) on the thermal comfort of people in residential environments in 2018. Farhadi et al. [31] studied the role of greenery (at street and roof level of buildings), material reflectance (at sidewalk and roof level of buildings), and the orientation of buildings in reducing urban heat islands in a residential area in Tehran. In another study conducted by Ahmadi Venhari et al. [32] in 2019, the indicators of street greenery and their arrangement, aspect ratio, and SVF sky visibility factor in desert climate were examined. In a study by Nasrollahi et al. in 2021, the role of urban geometry and urban shading in improving the thermal comfort of pedestrians in the hot climate of Ahvaz, Iran was investigated.
However, less research has been conducted on hot semi-arid climates to examine outdoor thermal comfort. In a study by Kumar and Sharma in 2021 [33], three thermal comfort indices, WBGT, PET, and UTCI, were used to assess monthly outdoor heat stress from 2010 to 2019 in the Sonepat municipality, which has a hot semi-arid climate. They concluded that extreme heat stress was discovered in the pre-monsoon hot weather season and summer monsoon season. Another study conducted by Othman and Alshboul in 2020 [34] examined the effect of urban shape on urban microclimate and how it affects outdoor thermal comfort in public spaces in the Jordanian city of Al-Sharq, with hot semi-warm climates. They found that the urban form had a significant effect on thermal comfort. Another study by Roshan et al. [35] in 2020 evaluated the effect of potential wind cooling on the outdoor thermal condition of individuals in four different climatic types of Iran. One of these climates is Shiraz with a hot and semi-arid climate. They predicted that the comfort cooling potential of wind in 2040 would increase by an average of 1.6 °C compared to the 2000s in Shiraz, which could reduce the effects of the urban heat island. None of these studies have investigated the effect of physical parameters of the streetscape on microclimatic indicators. In the present study, the city of Shiraz in Iran, with a hot semi-arid climate, is considered to investigate the impact of physical parameters of streetscape including vegetation, surface albedo, sky view factor, and aspect ratio on microclimatic parameters such as air temperature, relative humidity, wind speed, and mean radiant temperature and also on PMV thermal comfort index (Figure 1). The assumed relationship in this study between microclimatic parameters and PMV index with streetscape parameters is shown in Figure 2.

1.3. Research Questions

In this research, the following questions will be answered on Karimkhan-e-Zand Street of Shiraz as an urban street in a hot semi-arid climate:
  • Which microclimatic parameter has the greatest impact on the thermal comfort of users?
  • Does the sky view factor influence the thermal comfort of individuals?
  • What is the impact of surface albedo of materials on microclimatic parameters?
  • What kind of vegetation can be more effective in the thermal comfort of users?
  • How is the importance of aspect ratio in relation to thermal comfort improvement?

2. Materials and Methods

This research investigates the impact of microclimatic parameters including air temperature, relative humidity, mean radiant temperature, wind speed, and physical parameters of streetscape, i.e., surface albedo, vegetation, sky view factor, and aspect ratio on the thermal comfort of users of Karimkhan-e-Zand Street using ENVI-met v4 software. In order to study thermal comfort at different points of the street, the PMV index in ENVI-met v4 software was used. Moreover, STATA 14 software was used for evaluating correlations among components. To investigate the impact of surface albedo, ground temperature, and sky view factor on air temperature, mean radiant temperature, relative humidity, wind speed, and predicted mean vote (PMV), several univariate linear regressions were used in STATA 14 software. Then, in order to evaluate the significance of the coefficients obtained from the regressions, student’s t-test was used (Figure 3).

2.1. The Study Area

The historical city of Shiraz as the capital city of Fars province is located in an almost rectangular plain at 29 degrees and 37 min north latitude and 52 degrees and 32 min east longitude with a height of 1540 m above sea level. The average annual temperature is 17.3 °C, the maximum temperature rises to 43.2 °C in warm seasons, and the minimum temperature drops to −14 °C in cold seasons. In July, the temperature is above 35 °C for more than 20 days. In Shiraz, during the entire year, the rain falls for 46.6 days and collects up to 305.6 mm of precipitation (Figure 4). Additionally, the average precipitation in July in the years 2001 to 2018 was 0.73 mm, and according to the data in Table 1 [36], the amount of precipitation in 2018 followed the normal climate pattern in July. In general, according to the Fars Management and Planning Organization [37], the city of Shiraz has a hot semi-arid climate.
To select the street for this study, a surface temperature map was prepared by ArcGIS 10.8 based on the Landsat 8 data (Figure 5). According to this map, the surface temperature in all the streets of Shiraz is relatively equal and accordingly, one of the streets that is of special importance for pedestrians was selected. Karimkhan-e-Zand Street is located in the central part of Shiraz and is one of the oldest and busiest streets in the city (Figure 6). This street is of special importance for pedestrians due to various types of use, such as commercial, hospital, office, university, and religious. However, because of the congestion of motor traffic, high population density, wide sidewalks with low vegetation, and direct sunlight, the thermal comfort of users has been disrupted. Figure 7 shows the physical information of the street. As shown in this figure, Karimkhan-e-Zand Street is one of the arterial routes of Shiraz, to which several distributor roads are connected. The length of the studied part of Karimkhan-e-Zand Street is 1.4 km, the widths of the sidewalks are 8 and 9 m, and the width of the middle part of the street is 2 m. Additionally, the width of the vehicle part on both sides is 15 m. There are also 4 bus stations and two metro stations along Karimkhan-e-Zand Street.

2.2. Field Study

Since ENVI-met software deals with the simulation of a specific day, simulations were performed on the 10th of July, as the hottest day and month of the year in recent years, according to the meteorological data of Shiraz from the Statistical Center of Iran [39], and in one of the hottest hours of the day, 2 o’clock in the afternoon, which allows the measurement of comfort conditions under the worst possible circumstances. Simulations were performed at the height of 1.5 m above the ground as the average human height. In the present work, Karimkhan-e-Zand Street was divided into 4 sections based on the change in the street’s aspect ratio, the presence of full and empty spaces (i.e., green spaces or barren lands and constructed buildings), and vegetation density (Figure 8). Each zone was on a scale of 150 m by 150 m and each part was separately entered into ENVI-met v4 software. Each station was considered on the x and y axis as 3 m and 1 m on the z axis. Additionally, for comparing the SVF parameters and the aspect ratio for the fourth section of the street, which has a lower vegetation density and more empty spaces than the other sections, an alternative was considered and simulated with higher vegetation density and with added mass to the space. In order to simulate microclimatic conditions on Karimkhan-e-Zand Street, input data, including climatic and physical data, are needed. Environmental data, such as type and amount of vegetation, materials of building facade and the surface of the street, height of buildings, and street aspect ratio, were collected by field measurements on Karimkhan-e-Zand Street (Table 1).

2.3. Simulation

As mentioned in a previous section, for simulation, in addition to street physical data, climatic data, such as air temperature, wind speed, wind direction, and relative humidity, are also needed as input data (Table 2). For accurate evaluation of the thermal comfort of the street, climatic data collected over several years were used, and manual measurement of microclimatic parameters, which would limit the study to few points and days, was avoided. For this purpose, relative humidity and air temperature data were prepared based on three-hour measured data of the Meteorological Organization from the Energyplus Website from 1991 to 2018 (except for 1999, 2000, and 2006, which had incomplete data). The monitoring station for this climatic data is located at 52.4 degrees longitude, 29.3 degrees latitude, and 1481 m above sea level. Wind speed data from 1990 to 2018 were collected from the comprehensive website of Iran Weather and Climatology. The monitoring station for wind speed data is located at 52.58 longitude, 29.53 latitude and 1486 m above sea level. Other data needed for the analysis of thermal comfort in ENVI-met v4 software include data about age, gender, clothing insulation, and activity rate. Since these parameters were not controllable in the design, they were considered fixed according to ISO 7730 standard (Table 3). The climatic data used in this study were consecutive Iran Typical Meteorological Year (ITMY) data used in energy simulation studies. Additionally, data related to the types and amount of vegetation, materials of the building facades and surface of the street, the height of buildings, and street aspect ratio were collected in 2018. All these data were given as initial input data to ENVI-met software, and the software simulated the street microclimate conditions on 10 July 2018, according to these data. Considering the input data, ENVI-met v4 also simulates the mean radiant temperature, PMV index, ground surface temperature, surface albedo, and sky view factor.

2.4. Validation of ENVI-Met Results

ENVI-met, created by Bruse and Fleer [40], is an advanced 3D simulation software that can reproduce the physical and microclimatic behavior of outdoor urban and rural spaces according to climatic parameters, vegetation, surface, soil, and built environment. Through this software, it is possible to determine the values of air temperature, mean radiant temperature, relative humidity, and global radiation and predict thermal comfort through thermal comfort indicators such as PMV, PET, and UTCI [41]. ENVI-met accuracy has been investigated in many studies through comparisons between simulated data and field measurement data [41,42,43,44,45,46]. In this study, to check the accuracy of ENVI-met, the air temperature was measured by the standard ST-174B meteorological measuring device for four consecutive days from 7 July to 10 July. The device was installed at a height of 1.4 m in certain places on KarimKhan-e-Zand Street. The comparison of the mean simulated air temperature and the mean measured air temperature showed a difference of 1.451 °C, which is negligible.

3. Results and Discussion

3.1. The Effect of Microclimate Parameters on Thermal Comfort

For accurate investigation of the effect of microclimatic parameters on thermal comfort in four sections of street, each section was simulated by ENVI-met v4 software (Figure 9). The simulation in these four sections was carried out at 2 o’clock on 10 July 2018. According to Figure 6, the amount of PMV in Section 4 is more than other sections, due to less vegetation cover than other sections and also less building density in this section. Additionally, Section 3 has the lowest amount of PMV and its thermal comfort condition is more acceptable than other sections. After simulating different sections in ENVI-met, simulated data including mean radiant temperature, air temperature, wind speed, relative humidity, and PMV index were collected in all cells of each section. Then, linear regressions were used for evaluations. Considering the results of correlation among all microclimatic parameters, changes in air temperature had the greatest impact on the changes in PMV index (adjusted   R 2 = 0.57 ) , so that with increasing air temperature by one unit, the PMV index increased by 0.13 units. Moreover, the largest coefficient of determination was found between mean radiant temperature and PMV index (adjusted   R 2 = 0.83 ). In addition, wind speed had the lowest impact on PMV index (adjusted   R 2 = 0.003 ) and thus, on thermal comfort on Karimkhan-e-Zand Street (Table 4 and Table 5 and Figure 10).

3.2. The Effect of Street Physical Parameters on Thermal Comfort

3.2.1. The Effect of Aspect Ratio on Thermal Comfort

On Karimkhane-e-Zand Street, due to its great width, the enclosure is low for most of the street. In order to understand the impact of aspect ratio on microclimatic parameters and the predicted mean vote (PMV) index, the situation in the fourth section was compared with the scenario situation in the same section. In the scenario of the fourth part, to the unoccupied areas, a building mass of 15 m was added and the height of the existing buildings increased by two floors. In addition, in this scenario, vegetation with higher density and a larger amount was added. According to the obtained data, with increasing the height of the buildings and the aspect ratio, the parameters of air temperature, wind speed, relative humidity, and especially the mean radiant temperature were in a more favorable condition. In addition, the PMV index in the scenario situation is much more appropriate than the current situation, so that the average of this parameter in the scenario situation decreased by 9 °C. In other words, according to Figure 5, it was found that in the scenario situation, when the height of buildings is higher, the average of the PMV index decreases from 4.24 to 3.5 (Figure 11). Table 6 compares the values of microclimatic parameters and PMV index in two sections, Section 4 and the Section 4 scenario, at the selected points on the maps in Figure 8. In general, in parts of Karimkhan-e-Zand Street where the building density is low and the ratio of height to width is very low, thermal comfort conditions are problematic. Numerous studies have shown the effect of increasing or decreasing the aspect ratio on streets in improving thermal comfort [29,46,47]. A study by Perini and Magliocco [47] in Milan, Genoa, and Rome also showed that the height of buildings plays an important role in determining the potential temperature at 1.6 m above the ground, i.e., with taller buildings, the temperature, due to their shadow effect, is lower. Additionally, in the case of the PMV index, with taller buildings, the thermal comfort conditions improve. However, in this study, unlike the current study, higher density led to higher potential temperatures. Research conducted by Zhang et al. [29] in the hot-humid area of China, as in the present study in a hot semi-arid climate, showed that street canyons with higher aspect ratios provide better thermal comfort for pedestrians during a summer day.

3.2.2. The Effect of Sky View Factor on Thermal Comfort

In order to evaluate sky view factor, the data of four sections were studied. Data analysis indicated that sky view factor had the greatest impact on mean radiant temperature and PMV index (adjusted   R 2 are 0.29 and 0.31, respectively) among microclimatic parameters, so that by increasing SVF by one unit, mean radiant temperature increased by 28.18 °C and PMV index increased by 1.3 units (Figure 12 and Table 7). In addition, the regression results between SVF and surface temperature show a significant effect of SVF on surface temperature, so that increasing one unit in SVF increases surface temperature by 17 °C (Figure 13 and Table 7). The simulation results also show that SVF has the lowest impact on wind speed and air temperature. By increasing SVF by 0.1, air temperature increases by only 1.7 °C, and wind speed increases by only 0.19 m s . In a study conducted by Ahmadi Venhari et al. [32] in 2019, in Isfahan with a desert climate, they reported similar results regarding the sky view factor. They concluded that the effect of SVF on air temperature was not significant, but its effect on thermal comfort with PET index, mean radiant temperature, and surface temperature was significant. Isfahan is located in the center of Iran and its climate is very similar to Shiraz, despite its desert climate. However, it can be concluded that the effect of SVF on thermal comfort in desert and hot semi-arid climates is very similar. Additionally, another study, conducted by Nasrollahi et al. [46] in Ahvaz with a hot climate, has similar results to the current research in hot semi-arid climates. In this study, there was no correlation between SVF and relative humidity at any point, but the mean radiant temperature and PET (thermal comfort index) were correlated with SVF at all points.
Comparison of SVF values in the fourth section of Karimkhan-e-Zand Street and the fourth section scenario showed that increasing height, mass, and denser vegetation influenced the reduction in SVF in the fourth section scenario, and the mean SVF of 0.65 in the fourth section dropped to 0.49 in the fourth section scenario. This reduction in SVF values improved mean radiant temperature in the fourth section scenario by 10 °C, and surface temperature reduced to 5 °C (Table 8). Additionally, with an increase of 0.1 in SVF in the fourth section alternative, air temperature increased by 0.53 °C, while with a 0.1 increase in SVF in the current status of the fourth section, air temperature increased by 1.46 °C, and these results indicate an insignificant impact of SVF on air temperature. Ali-Toudert and Mayer [48] also showed in a 2007 study that the larger the openness to the sky of the canyon (SVF), the higher the heat stress.

3.2.3. The Effect of Surface Temperature and Surface Albedo on Thermal Comfort

Examining the results related to surface temperature showed that surface temperature had a significant effect on increasing air temperature, relative humidity, and PMV, so that their adjusted R2 equaled 0.68, 0.56, and 0.64, respectively. It means that 68% of the changes in air temperature, 64% of the changes in the PMV, and 56% of the changes in the relative humidity result from changes in surface temperature (Table 9). The change in the surface albedo is also the most influential physical parameter in the relative humidity changes compared to other physical parameters of the street (adjusted R2 = 0.128) (Figure 14). In addition, the simulation results show that changes in surface albedo coefficient had an insignificant effect on changes in PMV index (1.8%) (Table 10). A similar study by Zhang et al. [29] in 2017 also showed that surface albedo plays a small role in improving thermal comfort. Zhang et al., in the hot-humid area of China [29], found that the contribution of surface albedo on thermal comfort (SET index) is very small, which agrees with the present study. Additionally, a study by Zhao and Liu in China [49] showed that an increase in surface albedo had only slight effects on summer thermal comfort in the street canyons. This indicates that the surface albedo in hot semi-arid climates such as hot-humid climates does not have a significant effect on improving thermal comfort.
Finally, the regression results between each of the microclimatic parameters with the surface temperature, surface albedo, and sky view factor, and the effectiveness of each of them can be seen in Table 11.

3.2.4. The Effect of Vegetation on Thermal Comfort

In order to investigate the impact of vegetation on thermal comfort, the impact of three dominant types of tree on Karimkhan-e-Zand Street, namely, pine, orange, and Fraxinus, was studied. For this purpose, in the second part of the street, where all three types of pine, orange, and Fraxinus trees were present, three stations, A, B, and C, were selected (Figure 15). Station A was next to the Fraxinus tree, station B was next to the pine tree, and station C was next to the orange tree. Considering Table 4, it was found that with increasing height and crown width of the tree, mean radiant temperature and air temperature were significantly reduced. For example, the orange tree with a height of 4 m and a crown width of 3 m, compared to the Fraxinus tree with a height of about 20 m and a crown width of 11 m, did not have a significant effect on reducing the surrounding temperature. According to this conclusion, PMV index has more favorable conditions around pine and Fraxinus trees. In addition, considering the results in Table 12, trees do not have a significant effect on wind speed and relative humidity in their surrounding environment. Other similar studies have found similar results on the effect of vegetation and tree species on thermal comfort [26,27,29,47,49]. As shown in the present study, trees that have larger crown width produce more shade and improve thermal comfort in hot, semi-arid climates. Ahmadi Venhari et al. [32], in a study of desert climate in Isfahan, also showed that shading trees play an important role in improving thermal comfort compared to non-shading vegetation. However, a study by Morakinyo et al. [28] in Hong Kong’s subtropical climate concluded that denser foliage trees could potentially improve thermal comfort by up to two thermal classes. However, in the present study, the orange tree, despite its high density, did not have much of an effect on improving the thermal comfort around it. This suggests that there are other factors besides tree density, such as tree height, that affect thermal comfort in hot, semi-arid climates.

4. Conclusions

In the present study, the role of the physical parameters of a streetscape was evaluated, in order to develop strategies for improving the thermal comfort of users of Karimkhan-e-Zand Street, located in a hot semi-arid climate. A simulation of the microclimatic conditions of the street in ENVI-met software was used for determining the influence of these parameters on the street microclimate, and the 10th of July 2018 was used for simulation. The role of four physical parameters of the streetscape affecting the microclimate, namely, sky view factor, surface albedo, vegetation, and aspect ratio, were investigated. The main findings of the research are as follows:
  • Investigation of our regression results showed that the main microclimatic parameter affecting PMV index as a measure of thermal comfort assessment is air temperature, and finding some strategies for reducing air temperature in a hot semi-arid climate can significantly improve PMV index and, ultimately, the thermal comfort of the street users. Moreover, 83 percent of changes in PMV index on Karimkhan-e-Zand Street are due to changes in the mean radiant temperature parameter (Table 4 and Table 5 and Figure 10).
  • Data analysis showed that the sky view factor has the greatest effect on the mean radiant temperature (Figure 9) and PMV index among microclimatic parameters, so that with an increase of one unit in SVF, the mean radiant temperature increases by 28.18 °C and the PMV index increases by 1.3 units (Figure 12 and Table 7). Additionally, the results of the regression between SVF and surface temperature show a significant relationship between these two parameters (Figure 13 and Table 7). The simulation results also show that SVF has the smallest effect on air temperature. The comparison of SVF values in the fourth section of Karimkhan-e-Zand Street and the fourth section scenario showed that increasing height and mass and denser vegetation influenced the reduction in SVF in the fourth section scenario, and the mean SVF of 0.65 in the fourth section drops to 0.49 in the fourth section scenario. This reduction in SVF values improved the mean radiant temperature in the fourth section scenario by 10 °C, and surface temperature reduced to 5 °C (Table 8).
  • Investigation of regressions showed that surface temperature has a significant effect on increasing air temperature, relative humidity, and PMV and the decreasing thermal comfort of the street, and the surface albedo has the greatest contribution to changes in relative humidity compared to other physical parameters of the street (Figure 14).
  • The results of the simulation in ENVI-met indicate that type of trees is a very important parameter in improving the street microclimate, especially in the improvement of mean radiant temperature and air temperature, and the length of the tree and the crown width are directly related to the improvement of thermal comfort. Among the three dominant trees on Karimkhan-e-Zand Street, the Fraxinus tree, with a higher length and crown width compared to the orange and pine trees, created better comfort conditions around it (Table 12).
  • Regarding the aspect ratio parameter, by comparing the results obtained from microclimatic conditions in both existing and scenario conditions, it is concluded that by increasing the height of buildings and adding building mass in unoccupied areas, the parameters of mean radiant temperature, air temperature, surface temperature, sky view factor, and PMV index improved significantly and the improvement of thermal comfort conditions on the street was strongly dependent on this parameter (Figure 11 and Table 6).
According to the obtained results, proposed solutions to improve thermal comfort in streets with hot and semi-arid climates are given in this research. All of these strategies are to reduce the sky view factor, air temperature, mean radiant temperature, and surface temperature and finally reduce the PMV index and improve thermal comfort. The most effective factors in the mentioned cases are: increasing the density of vegetation, using canopies along the street, using white and light materials on the street, using trees with high trunk height and wide canopy around and in the middle of the street such as Fraxinus trees, increasing the aspect ratio in the street, using more grass on the street level, building mass or parks on unused land, and using water bodies.

Further Research

The results of this study can help urban designers and planners, especially in hot semi-arid climates, to design and optimize outdoor spaces, especially street spaces, to improve the thermal comfort of pedestrians in these spaces (Figure 16).
For future studies, the ASHRAE standard also proposes the adaptive approach, which is based on psychological dimensions for thermal comfort, which is essentially complementary to the approach used in this study, in which other factors such as culture, thermal history, context, and thermal expectations affect the results of thermal comfort. In order to consider the adaptive approach, a questionnaire and analysis of the results obtained from these questionnaires should also be used in the study of thermal comfort.
Another suggestion is to use PET and UTCI thermal comfort indices, which provide more accurate results in outdoor spaces than the PMV thermal comfort index, which, because of the limitations of the student version of ENVI-met, was not possible to use in this study.

Author Contributions

Conceptualization, A.R.S. and Y.B.; methodology, A.R.S.; software, Y.B.; validation, A.R.S. and Y.B.; formal analysis, Y.B.; investigation, Y.B.; resources, A.R.S. and Y.B.; data curation, Y.B.; writing—original draft preparation, Y.B.; writing—review and editing, A.R.S. and Y.B.; visualization, Y.B.; supervision, A.R.S.; project administration, A.R.S.; funding acquisition, A.R.S. All authors have read and agreed to the published version of the manuscript.
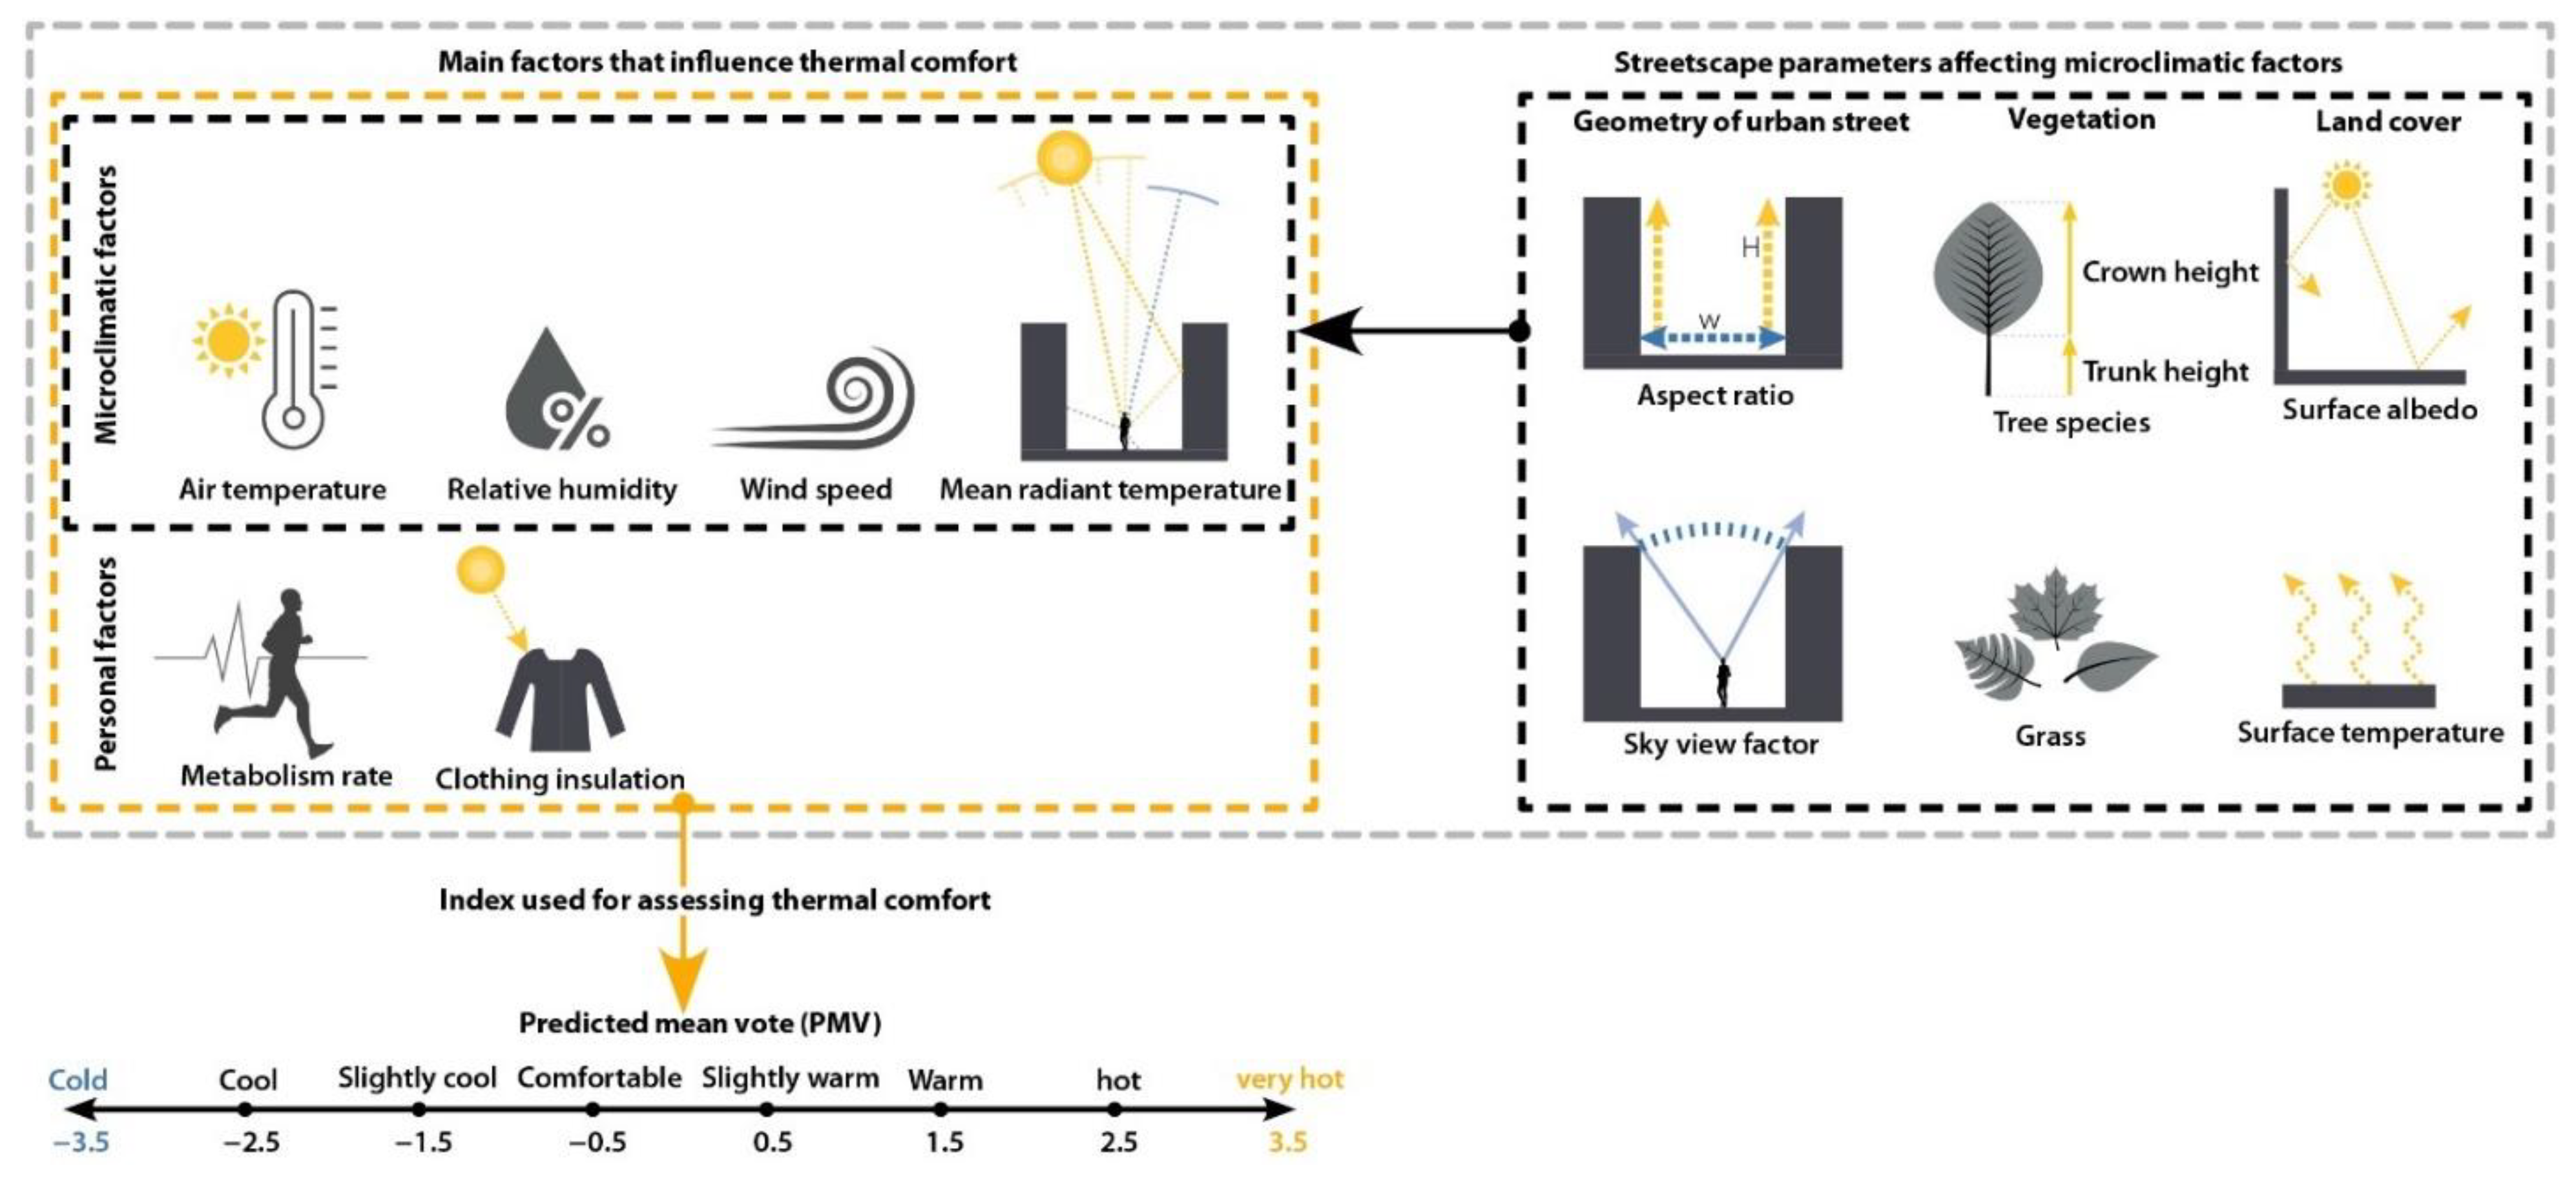
Funding

This research received no external funding.

Institutional Review Board Statement

Not applicable.

Informed Consent Statement

Not applicable.

Conflicts of Interest

The authors declare no conflict of interest.

References

  1. Thorsson, S.; Lindqvist, M.; Lindqvist, S. Thermal bioclimatic conditions and patterns of behaviour in an urban park in Göteborg, Sweden. Int. J. Biometeorol. 2004, 48, 149–156. [Google Scholar] [CrossRef] [PubMed]
  2. Eliasson, I.; Knez, I.; Westerberg, U.; Thorsson, S.; Lindberg, F. Climate and behaviour in a Nordic city. Landsc. Urban Plan. 2007, 82, 72–84. [Google Scholar] [CrossRef]
  3. Ratti, C.; Richens, P. Raster Analysis of Urban Form. Environ. Plan. B Plan. Des. 2004, 31, 297–309. [Google Scholar] [CrossRef]
  4. Parsaee, M.; Joybari, M.M.; Mirzaei, P.A.; Haghighat, F. Urban heat island, urban climate maps and urban development policies and action plans. Environ. Technol. Innov. 2019, 14, 100341. [Google Scholar] [CrossRef]
  5. Jacobs, J. The Death and Life of Great American Cities; Vintage Books: New York, NY, USA, 1961. [Google Scholar]
  6. Shashua-Bar, L.; Tsiros, I.X.; Hoffman, M. Passive cooling design options to ameliorate thermal comfort in urban streets of a Mediterranean climate (Athens) under hot summer conditions. Build. Environ. 2012, 57, 110–119. [Google Scholar] [CrossRef]
  7. Tamura, Y.; Yoshie, R. Advanced environmental wind engineering. In Advanced Environmental Wind Engineering; Springer: Tokyo, Japan, 2016; pp. 1–196. [Google Scholar] [CrossRef]
  8. Elle, M.; Dammann, S.; Lentsch, J.; Hansen, K. Learning from the social construction of environmental indicators: From the retrospective to the pro-active use of SCOT in technology development. Build. Environ. 2010, 45, 135–142. [Google Scholar] [CrossRef]
  9. Givoni, B.; Noguchi, M.; Saaroni, H.; Pochter, O.; Yaacov, Y.; Feller, N.; Becker, S. Outdoor comfort research issues. Energy Build. 2003, 35, 77–86. [Google Scholar] [CrossRef]
  10. Nikolopoulou, M.; Steemers, K. Thermal comfort and psychological adaptation as a guide for designing urban spaces. Energy Build. 2003, 35, 95–101. [Google Scholar] [CrossRef]
  11. ASHRAE ANSI/ASHRAE. Standard 55-2013: Thermal Environmental Conditions for Human Occupancy; Ashare: Peachtree Corners, GA, USA, 2013. [Google Scholar]
  12. Ansi/Ashrae. ANSI/ASHRAE 55:2004 Thermal Environmental Conditions for Human Occupancy. Ashrae 2004, 2004, 30. [Google Scholar]
  13. Spagnolo, J.; de Dear, R. A field study of thermal comfort in outdoor and semi-outdoor environments in subtropical Sydney Australia. Build. Environ. 2003, 38, 721–738. [Google Scholar] [CrossRef] [Green Version]
  14. Nakano, J.; Tanabe, S. Thermal Comfort and Adaptation in Semi-Outdoor Environments. In Proceedings of the ASHRAE Transactions, Nashville, TA, USA, 2 January 2004; Volume 110, pp. 543–553. [Google Scholar]
  15. Oke, T.R. Canyon geometry and the urban heat island. J. Climatol. 1981, 1, 237–254. [Google Scholar] [CrossRef]
  16. Svensson, M.K. Sky view factor analysis—Implications for urban air temperature differences. Meteorol. Appl. 2004, 11, 201–211. [Google Scholar] [CrossRef]
  17. Vardoulakis, S.; Fisher, B.E.A.; Pericleous, K.; Gonzalez-Flesca, N. Modelling air quality in street canyons: A review. Atmos. Environ. 2003, 37, 155–182. [Google Scholar] [CrossRef] [Green Version]
  18. Bowler, D.E.; Buyung-Ali, L.; Knight, T.M.; Pullin, A.S. Urban greening to cool towns and cities: A systematic review of the empirical evidence. Landsc. Urban Plan. 2010, 97, 147–155. [Google Scholar] [CrossRef]
  19. Dimoudi, A.; Nikolopoulou, M. Vegetation in the Urban Environment. Energy Build. 2003, 35, 69–76. [Google Scholar] [CrossRef] [Green Version]
  20. Huang, L.; Li, J.; Zhao, D.; Zhu, J. A fieldwork study on the diurnal changes of urban microclimate in four types of ground cover and urban heat island of Nanjing, China. Build. Environ. 2008, 43, 7–17. [Google Scholar] [CrossRef]
  21. Ng, E.; Chen, L.; Wang, Y.; Yuan, C. A study on the cooling effects of greening in a high-density city: An experience from Hong Kong. Build. Environ. 2012, 47, 256–271. [Google Scholar] [CrossRef]
  22. Tan, C.L.; Wong, N.H.; Jusuf, S.K. Outdoor mean radiant temperature estimation in the tropical urban environment. Build. Environ. 2013, 64, 118–129. [Google Scholar] [CrossRef]
  23. Berry, R.; Livesley, S.J.; Aye, L. Tree canopy shade impacts on solar irradiance received by building walls and their surface temperature. Build. Environ. 2013, 69, 91–100. [Google Scholar] [CrossRef]
  24. Konya, A. Design Primer for Hot Climates; Elsevier: Amsterdam, The Netherlands, 1980; ISBN 9780851391410. [Google Scholar]
  25. Taleghani, M.; Sailor, D.; Ban-Weiss, G.A. Micrometeorological simulations to predict the impacts of heat mitigation strategies on pedestrian thermal comfort in a Los Angeles neighborhood. Environ. Res. Lett. 2016, 11, 024003. [Google Scholar] [CrossRef]
  26. de Abreu-Harbich, L.V.; Labaki, L.C.; Matzarakis, A. Effect of tree planting design and tree species on human thermal comfort in the tropics. Landsc. Urban Plan. 2015, 138, 99–109. [Google Scholar] [CrossRef]
  27. Morakinyo, T.E.; Kong, L.; Lau, K.K.-L.; Yuan, C.; Ng, E. A study on the impact of shadow-cast and tree species on in-canyon and neighborhood’s thermal comfort. Build. Environ. 2017, 115, 1–17. [Google Scholar] [CrossRef]
  28. Morakinyo, T.E.; Lau, K.K.-L.; Ren, C.; Ng, E. Performance of Hong Kong’s common trees species for outdoor temperature regulation, thermal comfort and energy saving. Build. Environ. 2018, 137, 157–170. [Google Scholar] [CrossRef]
  29. Zhang, Y.; Du, X.; Shi, Y. Effects of street canyon design on pedestrian thermal comfort in the hot-humid area of China. Int. J. Biometeorol. 2017, 61, 1421–1432. [Google Scholar] [CrossRef]
  30. Zhao, Q.; Sailor, D.J.; Wentz, E.A. Impact of tree locations and arrangements on outdoor microclimates and human thermal comfort in an urban residential environment. Urban For. Urban Green. 2018, 32, 81–91. [Google Scholar] [CrossRef] [Green Version]
  31. Farhadi, H.; Faizi, M.; Sanaieian, H. Mitigating the urban heat island in a residential area in Tehran: Investigating the role of vegetation, materials, and orientation of buildings. Sustain. Cities Soc. 2019, 46, 101448. [Google Scholar] [CrossRef]
  32. Ahmadi Venhari, A.; Tenpierik, M.; Taleghani, M. The role of sky view factor and urban street greenery in human thermal comfort and heat stress in a desert climate. J. Arid Environ. 2019, 166, 68–76. [Google Scholar] [CrossRef]
  33. Kumar, P.; Sharma, A. Assessing the monthly heat stress risk to society using thermal comfort indices in the hot semi-arid climate of India. Mater. Today Proc. 2021. [Google Scholar] [CrossRef]
  34. Othman, H.A.S.; Alshboul, A.A. The role of urban morphology on outdoor thermal comfort: The case of Al-Sharq City—Az Zarqa. Urban Clim. 2020, 34, 100706. [Google Scholar] [CrossRef]
  35. Roshan, G.; Moghbel, M.; Attia, S. Evaluating the wind cooling potential on outdoor thermal comfort in selected Iranian climate types. J. Therm. Biol. 2020, 92, 102660. [Google Scholar] [CrossRef] [PubMed]
  36. Weather Online. Available online: https://www.weatheronline.co.uk/weather/maps/city?WMO=40848&FMM=7&LMM=12&FYY=1999&LYY=2018&LANG=en&R=0&LEVEL=162&MOD=MOA&ART=PRE&OFFSET=08&NOREGION=0 (accessed on 11 September 2020).
  37. Fars Management and Planning Organization. Available online: http://www.mpo-fr.ir/ (accessed on 12 May 2018).
  38. Meteoblue Weather, Climate Shiraz. Available online: https://www.meteoblue.com/en/weather/historyclimate/climatemodelled/shiraz_iran_115019 (accessed on 16 September 2020).
  39. Statistical Center of Iran, Statistical Yearbook. Available online: https://www.amar.org.ir/english/Iran-Statistical-Yearbook/Statistical-Yearbook-2016-2017 (accessed on 15 July 2018).
  40. Bruse, M.; Fleer, H. Simulating surface–plant–air interactions inside urban environments with a three dimensional numerical model. Environ. Model. Softw. 1998, 13, 373–384. [Google Scholar] [CrossRef]
  41. Salata, F.; Golasi, I.; de Lieto Vollaro, R.; de Lieto Vollaro, A. Urban microclimate and outdoor thermal comfort. A proper procedure to fit ENVI-met simulation outputs to experimental data. Sustain. Cities Soc. 2016, 26, 318–343. [Google Scholar] [CrossRef]
  42. Acero, J.A.; Herranz-Pascual, K. A comparison of thermal comfort conditions in four urban spaces by means of measurements and modelling techniques. Build. Environ. 2015, 93, 245–257. [Google Scholar] [CrossRef]
  43. Ren, Z.; Wang, X.; Chen, D.; Wang, C.; Thatcher, M. Constructing weather data for building simulation considering urban heat island. Build. Serv. Eng. Res. Technol. 2014, 35, 69–82. [Google Scholar] [CrossRef]
  44. Park, S.; Tuller, S.E. Advanced view factor analysis method for radiation exchange. Int. J. Biometeorol. 2014, 58, 161–178. [Google Scholar] [CrossRef] [PubMed]
  45. Park, S.; Tuller, S.E.; Jo, M. Application of Universal Thermal Climate Index (UTCI) for microclimatic analysis in urban thermal environments. Landsc. Urban Plan. 2014, 125, 146–155. [Google Scholar] [CrossRef]
  46. Nasrollahi, N.; Namazi, Y.; Taleghani, M. The effect of urban shading and canyon geometry on outdoor thermal comfort in hot climates: A case study of Ahvaz, Iran. Sustain. Cities Soc. 2021, 65, 102638. [Google Scholar] [CrossRef]
  47. Perini, K.; Magliocco, A. Effects of vegetation, urban density, building height, and atmospheric conditions on local temperatures and thermal comfort. Urban For. Urban Green. 2014, 13, 495–506. [Google Scholar] [CrossRef]
  48. Ali-Toudert, F.; Mayer, H. Effects of asymmetry, galleries, overhanging façades and vegetation on thermal comfort in urban street canyons. Sol. Energy 2007, 81, 742–754. [Google Scholar] [CrossRef]
  49. Zhao, J.; Liu, J. Numerical simulation and designs of thermal environments of urban street canyons. Archit. J. 2007, 3, 37–39. [Google Scholar] [CrossRef]
Figure 1. Considering the effect of physical parameters of streetscape on microclimatic parameters in a hot semi-arid climate.
Sustainability 13 10886 g001
Figure 2. Assumed relationship between studied variables.
Sustainability 13 10886 g002
Figure 3. Research methodology of the field study.
Sustainability 13 10886 g003
Figure 4. Mean and maximum temperature and mean precipitation of Shiraz [38].
Sustainability 13 10886 g004
Figure 5. Thermal surface simulation of Shiraz.
Sustainability 13 10886 g005
Figure 6. The location of Karimkhan-e-zand Street of Shiraz.
Sustainability 13 10886 g006
Figure 7. Physical information of Karimkhan-e-Zand street.
Sustainability 13 10886 g007
Figure 8. The 4 selected sections in Karimkhan-e-Zand Street for simulation.
Sustainability 13 10886 g008
Figure 9. An example of PMV simulations by ENVI-met at 14:00 (figures are generated by Leonardo, a component of ENVI-met).
Sustainability 13 10886 g009
Figure 10. The linear regression model for the relationship between microclimatic parameters, physical parameters of the streetscape, and PMV.
Sustainability 13 10886 g010
Figure 11. A comparison between PMV values in the current and scenario situations.
Sustainability 13 10886 g011
Figure 12. The linear regression model for the relationship between SVF and microclimatic parameters.
Sustainability 13 10886 g012
Figure 13. The linear regression model for the relationship between SVF and surface temperature.
Sustainability 13 10886 g013
Figure 14. The linear regression model for the relationship between surface albedo and microclimatic parameters.
Sustainability 13 10886 g014
Figure 15. Location of stations A, B, and C and thermal comfort conditions around three types of tree in the second part of the street.
Sustainability 13 10886 g015
Figure 16. The most effective physical and microclimatic parameters on thermal comfort in hot semi-arid climates.
Sustainability 13 10886 g016
Table 1. The precipitation from July 2001 to 2018.
YearAverage Precipitation (mm)
July 20180
July 20170
July 20160
July 20151.1
July 20142
July 20130
July 20125
July 20110
July 20100
July 20090
July 20080
July 20070
July 20060
July 20054
July 20041.1
July 20030
July 20020
July 20010
Average0.733333333
Variance2.22
Standard Deviation1.489966443
Table 2. Input data for parametric evaluation.
Model Zone
Model dimensionx axis station50
y axis station50
z axis station40
Station dimensions (m)DX dimensions of x axis station3 m
DY: dimensions of y axis station3 m
DZ dimensions of z axis station1 m
SituationLongitude52.53
latitude21.69
Building materials
Building materialsWallsBrick, cement, stone, glass
RoofMaterials with appropriate insulation
Floor materialSoil, asphalt, mosaic
Vegetation
TreePineHeight (in meters)15 m
Crown width (in meters)7 m
OrangeHeight (in meters)4 m
Crown width (in meters)3 m
FraxinusHeight (in meters)20 m
Crown width (in meters)11 m
GrassGrassHeight (in meters)0.6 m
Initiation and duration of modeling
Simulation date10 July
Initiation time7 am
Total simulation time14 h
Initial meteorological conditions
Wind   speed   at   a   height   of   10   m   ( m s ) 2.32   m s
Wind direction (degree)280
Roughness length along the respective zone0.01
Maximum and minimum temperature (°C)Maximum temperature (°C)37.00 (°C)
Minimum temperature (°C)20.30 (°C)
Maximum and minimum relative humidity (%)Maximum relative humidity (%)38%
Minimum relative humidity (%)12%
Table 3. The methods of data collection.
ParameterData Under StudyData Collection Method
Microclimatic factorsAir temperature and relative humidityData collected from Energy Plus website based on three-hour measured data of Meteorological Organization for the period 1991 to 2018
Wind speedData collected from the Comprehensive Weather and Climatology website from 1990 to 2018
Personal factorsClothing insulation and metabolic rateData were obtained based on the ISO7730 standard, and considered fixed
Physical parameters of streetscapeAspect ratio (height/ratio) and tree speciesBased on field measurements from 2018 in the study area
Tree height, trunk height, tree canopy width, sky view, material albedo, and ground surface temperatureUsing ENVI-met 3D simulation software on 10 July 2018
Table 4. Detail of the linear regression between PMV index and microclimatic parameters and physical parameters of streetscape, PMV and MRT, and PMV and air temperature (standard errors in parentheses *** p < 0.01, ** p < 0.05, * p < 0.1).
-(1)
VARIABLESPMV
Relative humidity0.00903 ***
-(0.000411)
Wind speed−0.0645 ***
-(0.000533)
Sky view factor0.0117 ***
(0.00189)
Surface albedo0.0632 ***
-(0.00752)
Air temperature0.128 ***
-(0.000549)
Mean radiant temperature0.0383 ***
-(3.38 × 10⁻⁵)
Surface temperature0.00214 ***
-(9.04 × 10⁻⁵)
Constant−3.441 ***
(0.0242)
Observations22,936
R-squared0.996
Table 5. Detail of the linear regression between PMV and MRT, and PMV and air temperature (standard errors in parentheses *** p < 0.01, ** p < 0.05, * p < 0.1).
-(1)-(1)
VARIABLESPMVVARIABLESPMV
Air temperature 0.207 ***Mean radiant temperature0.0491 ***
-(0.00118) (0.000142)
Constant−4.021 ***Constant0.598 ***
-(0.0416) (0.00785)
Observations23,040Observations23,028
R-squared0.570R-squared0.839
Table 6. Comparison of values of microclimatic parameters and PMV index in two sections, Section 4 and the Section 4 scenario.
StationSituationPMVAir Temperature (C)MRT(C) Wind   Speed   ( m s ) Relative Humidity (%)
A Section 4 4.3937.6675.221.2312.73
Section 4 scenario3.0736.1647.881.9714.02
B Section 4 3.5338.2254.222.1911.97
Section 4 scenario3.0236.0547.332.2713.96
C Section 4 4.6239.3375.261.6610.96
Section 4 scenario3.0936.3647.661.7113.23
D Section 4 4.5939.0675.151.6811.71
Section 4 scenario3.8536.7971.193.5413.17
E Section 4 4.5538.7975.171.5311.83
Section 4 scenario3.8636.7971.023.3713.07
F Section 4 3.5939.8175.202.0810.74
Section 4 scenario3.9837.4570.732.8912.27
G Section 4 5.5538.9475.051.7211.11
Section 4 scenario4.1237.8570.672.2311.79
H Section 4 4.2738.4573.922.6011.45
Section 4 scenario3.9637.4870.502.9912.11
I Section 4 4.438.5372.441.6611.58
Section 4 scenario3.9537.6169.853.0812.16
Table 7. Detail of the linear regression between SVF and PMV, and SVF and each of microclimatic parameters (standard errors in parentheses *** p < 0.01, ** p < 0.05, * p < 0.1).
VARIABLESAir TemperatureVARIABLESMean Radiant Temperature
Sky view factor1.726 ***Sky view factor28.18 ***
(0.0720) (0.717)
Constant37.14 ***Constant50.86 ***
(0.0412) (0.410)
Observations3654Observations3653
R-squared0.136R-squared0.297
VARIABLESPMVVARIABLESRelative Humidity
Sky view factor1.332 ***Sky view factor−1.775 ***
(0.0321) (0.0626)
Constant3.357 ***Constant13.11 ***
(0.0184) (0.0358)
Observations3654Observations3649
R-squared0.320R-squared0.180
VARIABLESSurface temperatureVARIABLESWind Speed
Sky view factor17.10 ***Sky view factor0.193 ***
(0.372)Constant(0.0560)
Constant36.28 *** 1.420 ***
Observations3653Observations3651
R-squared0.366R-squared0.003
Table 8. Comparison of average values of parameters in the current and scenario situations.
Average ParametersFourth SectionFourth Section Scenario
Air temperature (°C)38.5237
Relative humidity (%)11.6812.7
Wind speed (m/s)1.61.2
Surface temperature (°C)47.2342
Surface albedo0.230.23
Sky view factor0.650.45
Mean radiant temperature (°C)69.0869.01
PMV4.243.5
Table 9. Detail of the linear regression between surface temperature and PMV, and surface temperature and each of microclimatic parameters (standard errors in parentheses *** p < 0.01, ** p < 0.05, * p < 0.1).
VARIABLESAir TemperatureVARIABLESMean Radiant Temperature
Surface temperature0.310 ***Surface temperature1.165 ***
(0.00140) (0.0101)
Constant23.24 ***Constant9.129 ***
(0.0542) (0.390)
Observations23,016Observations23,004
R-squared0.680R-squared0.368
VARIABLESPMVVARIABLESRelative Humidity
Surface temperature0.0828 ***Surface temperature−0.335 ***
(0.000402) (0.00195)
Constant0.0746 ***Constant28.41 ***
(0.0156) (0.0757)
Observations23,016Observations22,972
R-squared0.648R-squared0.561
VARIABLESWind Speed
Surface temperature0.00740 ***
(0.000541)
Constant1.156 ***
(0.0210)
Observations22,980
R-squared0.008
Table 10. Detail of the linear regression between surface albedo and PMV, and surface albedo and each of microclimatic parameters (standard errors in parentheses *** p < 0.01, ** p < 0.05, * p < 0.1).
VARIABLESAir TemperatureVARIABLESMean Radiant Temperature
Surface albedo17.53 ***Surface albedo3.058
(0.367) (1.968)
Constant30.50 ***Constant52.53 ***
(0.0960) (0.514)
Observations23,028Observations23,016
R-squared0.090R-squared0.000
VARIABLESPMVVARIABLESRelative Humidity
Surface albedo2.202 ***Surface albedo−24.89 ***
(0.104) (0.428)
Constant2.652 ***Constant22.10 ***
(0.0273) (0.112)
Observations23,028Observations22,984
R-squared0.019R-squared0.128
VARIABLESWind Speed
Surface albedo0.622 ***
(0.0843)
Constant1.278 ***
(0.0220)
Observations22,992
R-squared0.002
Table 11. Detail of the linear regression between microclimatic parameters and the surface temperature, surface albedo, and sky view factor (standard errors in parentheses *** p < 0.01, ** p < 0.05, * p < 0.1).
VARIABLESAir TemperatureVARIABLESMean Radiant Temperature
Surface temperature0.310 ***Surface temperature1.102 ***
(0.00132) (0.0100)
Sky view factor−1.810 ***Sky view factor14.73 ***
(0.0507) (0.385)
Surface albedo12.26 ***Surface albedo−28.50 ***
(0.203) (1.537)
Constant21.05 ***Constant11.03 ***
(0.0678) (0.514)
Observations23,016Observations23,004
R-squared0.732R-squared0.411
VARIABLESRelative HumidityVARIABLESWind speed
Surface temperature−0.327 ***Surface temperature0.00581 ***
(0.00184) (0.000556)
Sky view factor1.488 ***Sky view factor0.216 ***
(0.0704) (0.0213)
Surface albedo−19.06 ***Surface albedo0.375 ***
(0.281) (0.0853)
Constant32.23 ***Constant1.006 ***
(0.0941) (0.0285)
Observations22,972Observations22,980
R-squared0.636R-squared0.014
Table 12. Comparison of impact of different tree types on microclimatic factors and thermal comfort.
StationABC
Hour14:00:0114:00:0114:00:01
Tree typeFraxinusPineOrange
Height (m)20154
Crown width (m)1173
Relative humidity (%)13.0512.3511.22
Wind speed (m⁄s)2.422.311.40
Air temperature (°C)36.9637.4339.40
Mean radiant temperature52.1756.1772.55
Predicted mean vote (PMV)3.293.524.56
Publisher’s Note: MDPI stays neutral with regard to jurisdictional claims in published maps and institutional affiliations.

