1. Introduction
The limited supply of fossil fuels, the detrimental effect of such resources on the environment, and the growing demand for energy have led to a significant breakthrough in the searching process for other clean and renewable energy resources such as ocean energy [
1]. The share of these resources has increased in recent decades, which indicates the gradual and growing acceptance of these energy sources from the industry [
2]. Concerning the increasing focus on harnessing renewable energy—especially with wave converters—both in the scientific and commercial fields, however, the world faces different challenges in this regard.
Wave energy converters can be placed into various categories based on their construction site [
3,
4], energy extraction system [
5,
6], the way they are positioned against waves [
7,
8], and their type of system motion [
9,
10]. In addition, many studies have been performed using optimization algorithms to find a suitable layout or optimum distance between converters [
11,
12,
13]. Since the beginning of the 21st century, most studies have been focused on wave energy converters, especially point absorbers [
14,
15,
16]. Moreover, some research projects have studied oscillating surge wave energy converters (OSWECs), such as [
17,
18,
19,
20,
21]. As one of the most impactful experimental studies on oscillating surge wave energy converters, Henry et al. [
7] evaluated the effects of the different parameters affecting oscillating surge wave energy converter (OSWEC) performance through a laboratory study method. In their two models, they assessed how seven parameters stimulated the absorbing energy system’s input power [
22,
23]. These parameters were the wave period and the wave power, the flap’s relative density, the water depth, the free-board of the flap, the gap between the tubes, the gap underneath the flap, and the flap width. The latter parameter was one of the most critical parameters affecting the device’s performance, indicating an optimal limit for increasing the device’s efficiency by increasing the flap width [
24]. Afterwards, an innovative study [
25] introduced WEC-Sim as an open source module for modeling wave energy converters (WECs) under different wave conditions. WEC-Sim was applied to various platforms by validation and accurate evaluation through numerical modeling, laboratory studies, and the boundary elements method for open source hydrodynamic modeling [
26]. In this study, multiple parts and tools of this module were used—details of which can be found in [
25]. Subsequently, another study investigated and developed the fundamental mathematical and hydrodynamic equations to describe the base-fixed rotary oscillator’s movements. They also discussed the previous theorems’ insufficiencies because the equations developed earlier were only used to describe the wave energy converters’ movement of the point absorber type. It was also shown that the mathematical governing equations related to Oyster differed from the governing equations of other terminator converters [
27]. To improve their energy absorption performance, further research [
28] changed the geometry of OSWECs’ cross-sectional shape, which was named a rotary oscillator converter with controlled geometry. Although this research was performed by considering linear waves, the capture factor was improved. In addition to the design loads, the hydrodynamic loads were also reduced in this model.
While the use of renewable energy in Iran is still much lower than that of fossil fuels, access to the sea in northern and southern Iran has made it one of the most promising countries in the region in terms of using marine or ocean wave energy. To date, various studies have been conducted on the feasibility, design, and evaluation of the construction of wave energy converter sites in Iran. In support of this point, wind data from 1986 to 1995 for 14 sites located in northern and southern Iran were collected to predict the wave characteristics. According to their studies, the Chabahar site had the highest wave energy potential. This site is located on the shores of the Oman Sea, which is connected to the Indian Ocean, where the average wave energy is between 10 and 15 kW per meter. In addition, the Persian Gulf islands are known to have very high wave energy potential [
29]. Kamranzad et al. [
30,
31] surveyed 18 different sites to determine the energy distribution of waves as well as their average and maximum annual power. In the Persian Gulf and the Caspian Sea, the Lavan Island and Nowshahr stations had the highest average power [
32].
One of the main decisions for exploiting energy from waves is that of selecting a highly efficient converter that is suitable for and adaptable to the chosen location. In 2010, Falcão [
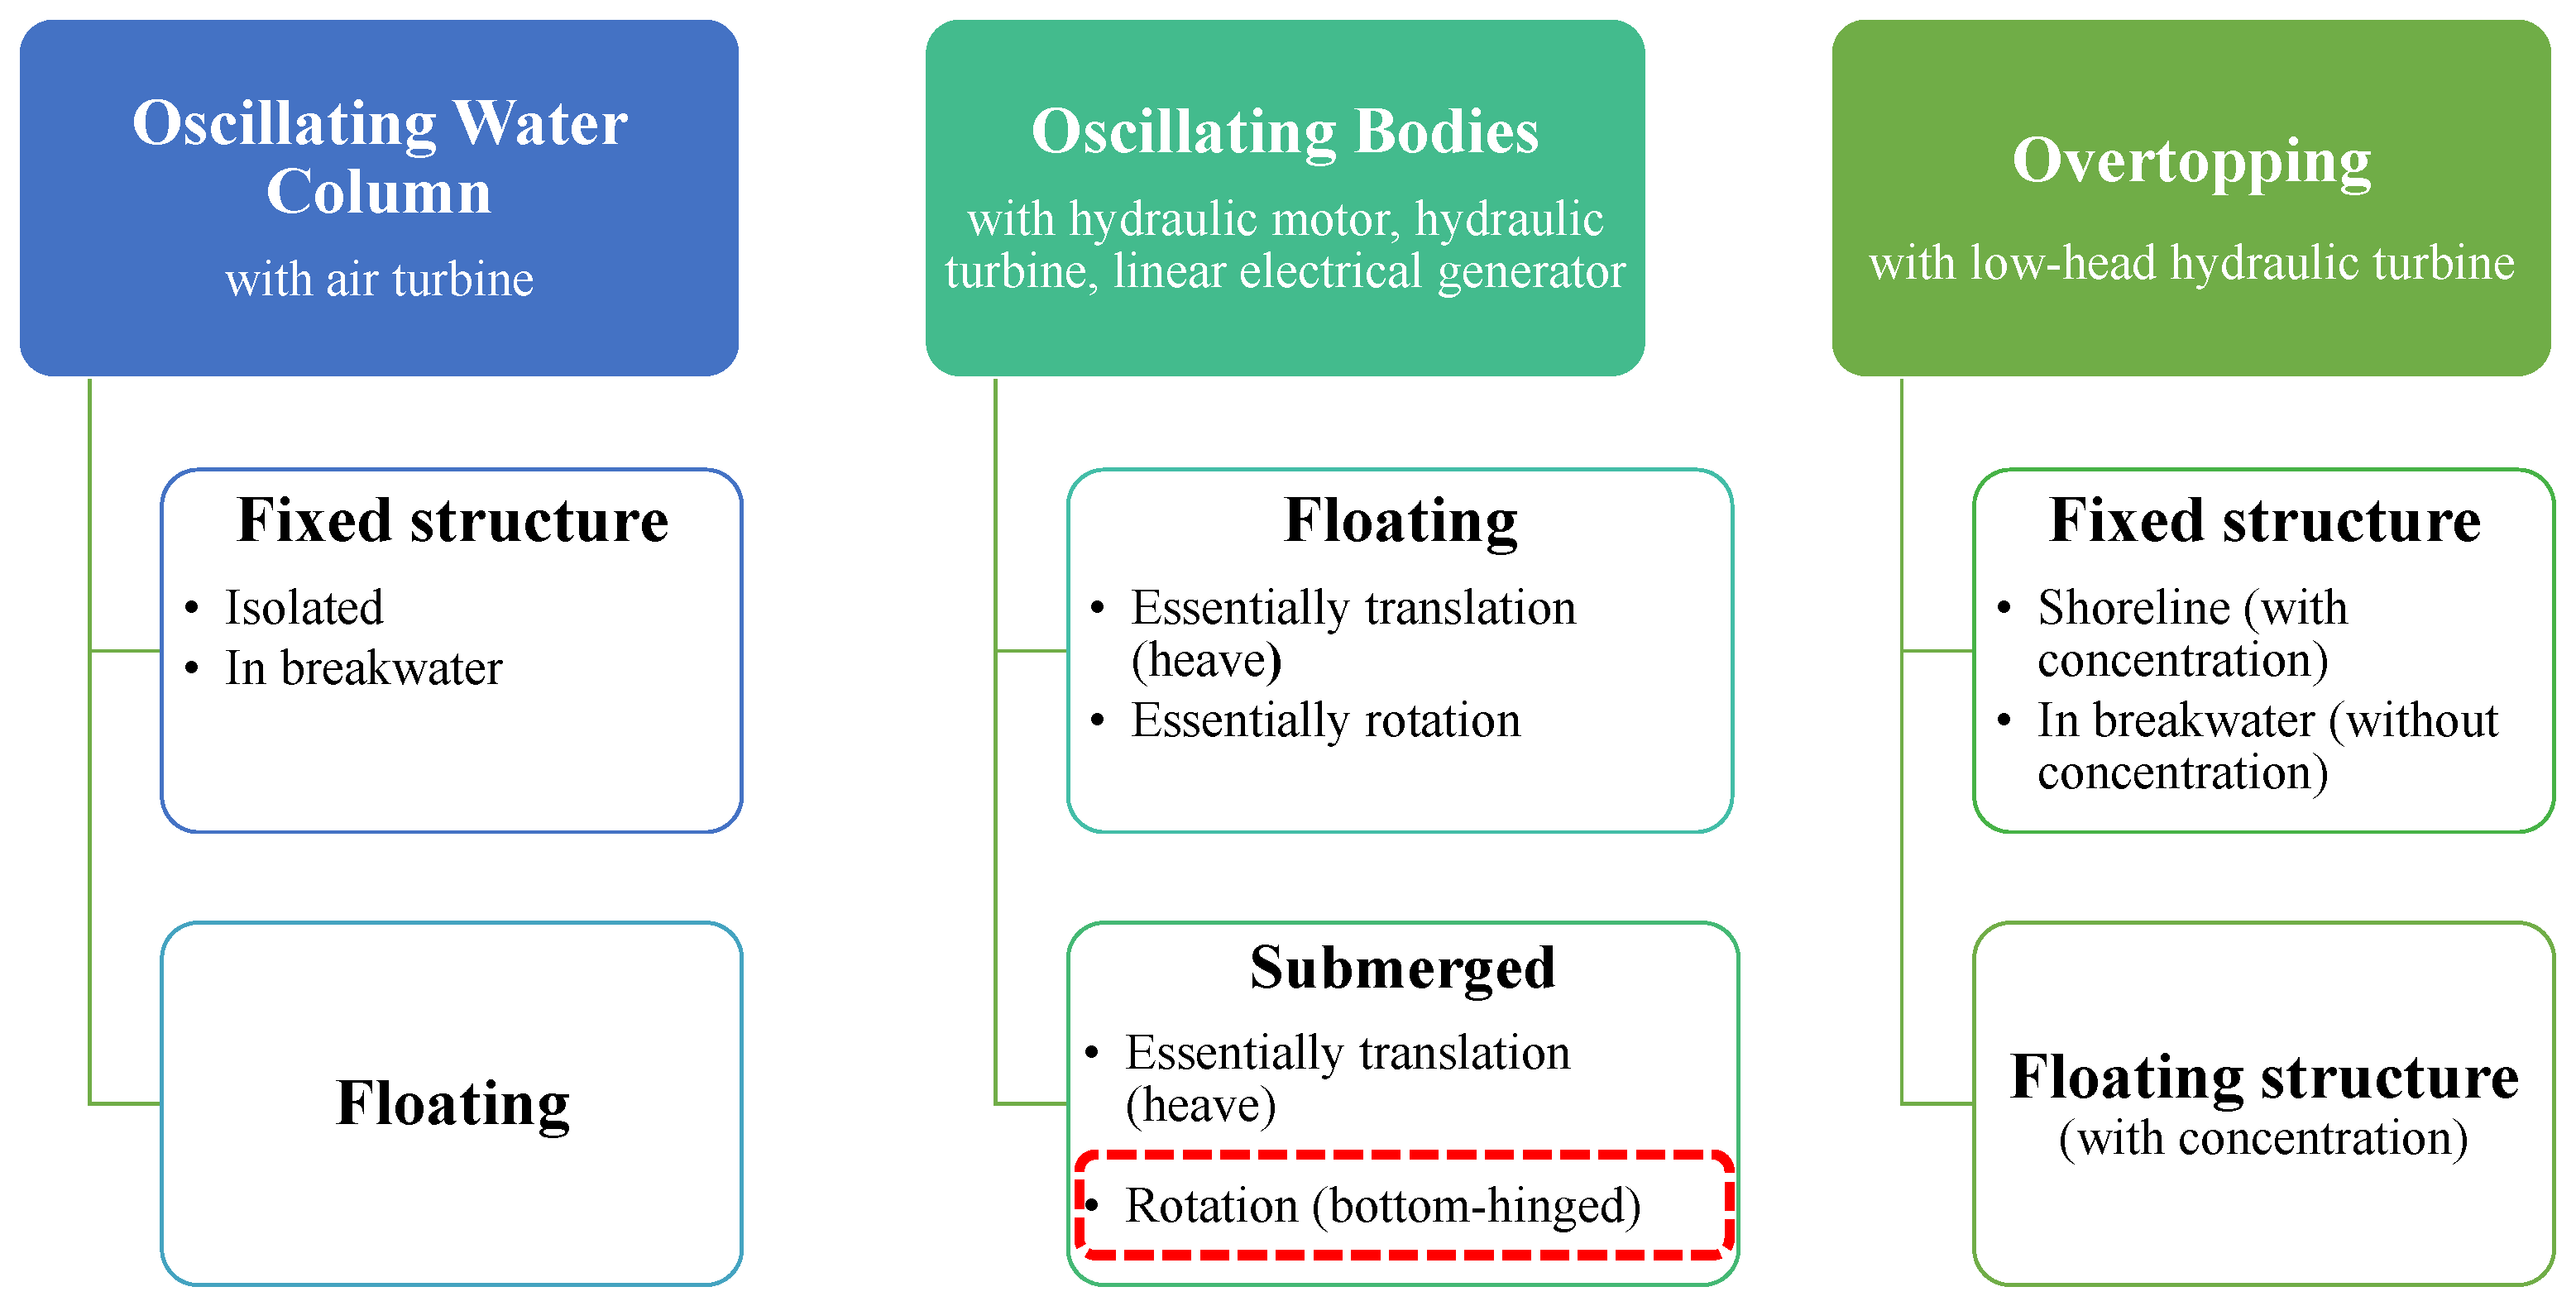
33] presented a classification of wave energy converters, based upon how they worked, which was divided into three categories: oscillating water columns; oscillating body systems; and over-topping converters. It can be said that the general technology of these developed converters, while either floating or fixed, can be sorted into one of these given categories.A classification with regard to new technologies is presented in
Figure 1. The given figure reveals three types of wave energy converter (each has two subsets), including over-topping [
34,
35,
36]; oscillating bodies [
37,
38,
39]; and oscillating water columns [
40,
41,
42]. Each of these was divided into two subsets, which could be either fixed structure, floating structure, or submerged. This figure shows the different categories of marine wave converters, and the studied converter in this project is indicated by the red dashed line.
The various types of oscillating surge wave energy converters developed recently are illustrated in
Figure 2.
Based on the recent studies on WEC selection for the Caspian Sea [
21], an effort is made to model a bottom-hinged Oscillating Surge Wave Energy Converter (OSWEC) in this study. The primary contribution of this work is to investigate the southern Caspian Sea coasts to extract wave energy and to propose a PTO damping coefficient for the converter for each wave scenario. In this study, we used the WEC-Sim modeling module in this project, along with various MATLAB toolboxes such as Simulink, and a solver for multi-body dynamics called SimMechanics [
46]. By analyzing the hydrodynamic properties of the waves at each site, the feasibility of installing an energy converter system in Iran’s three northern ports is determined, and a suitable converter design is presented. Finally, the output power performance implied forces, and moments have been examined using a comparative study. By creating a geometric model of the energy converter for each of the three areas, this paper attempts to design the energy converter’s geometric parameters according to the environmental parameters obtained for three ports (Nowshahr, Amirabad, and Anzali) on the Caspian Sea’s south-central, southwest, and southeast coasts.
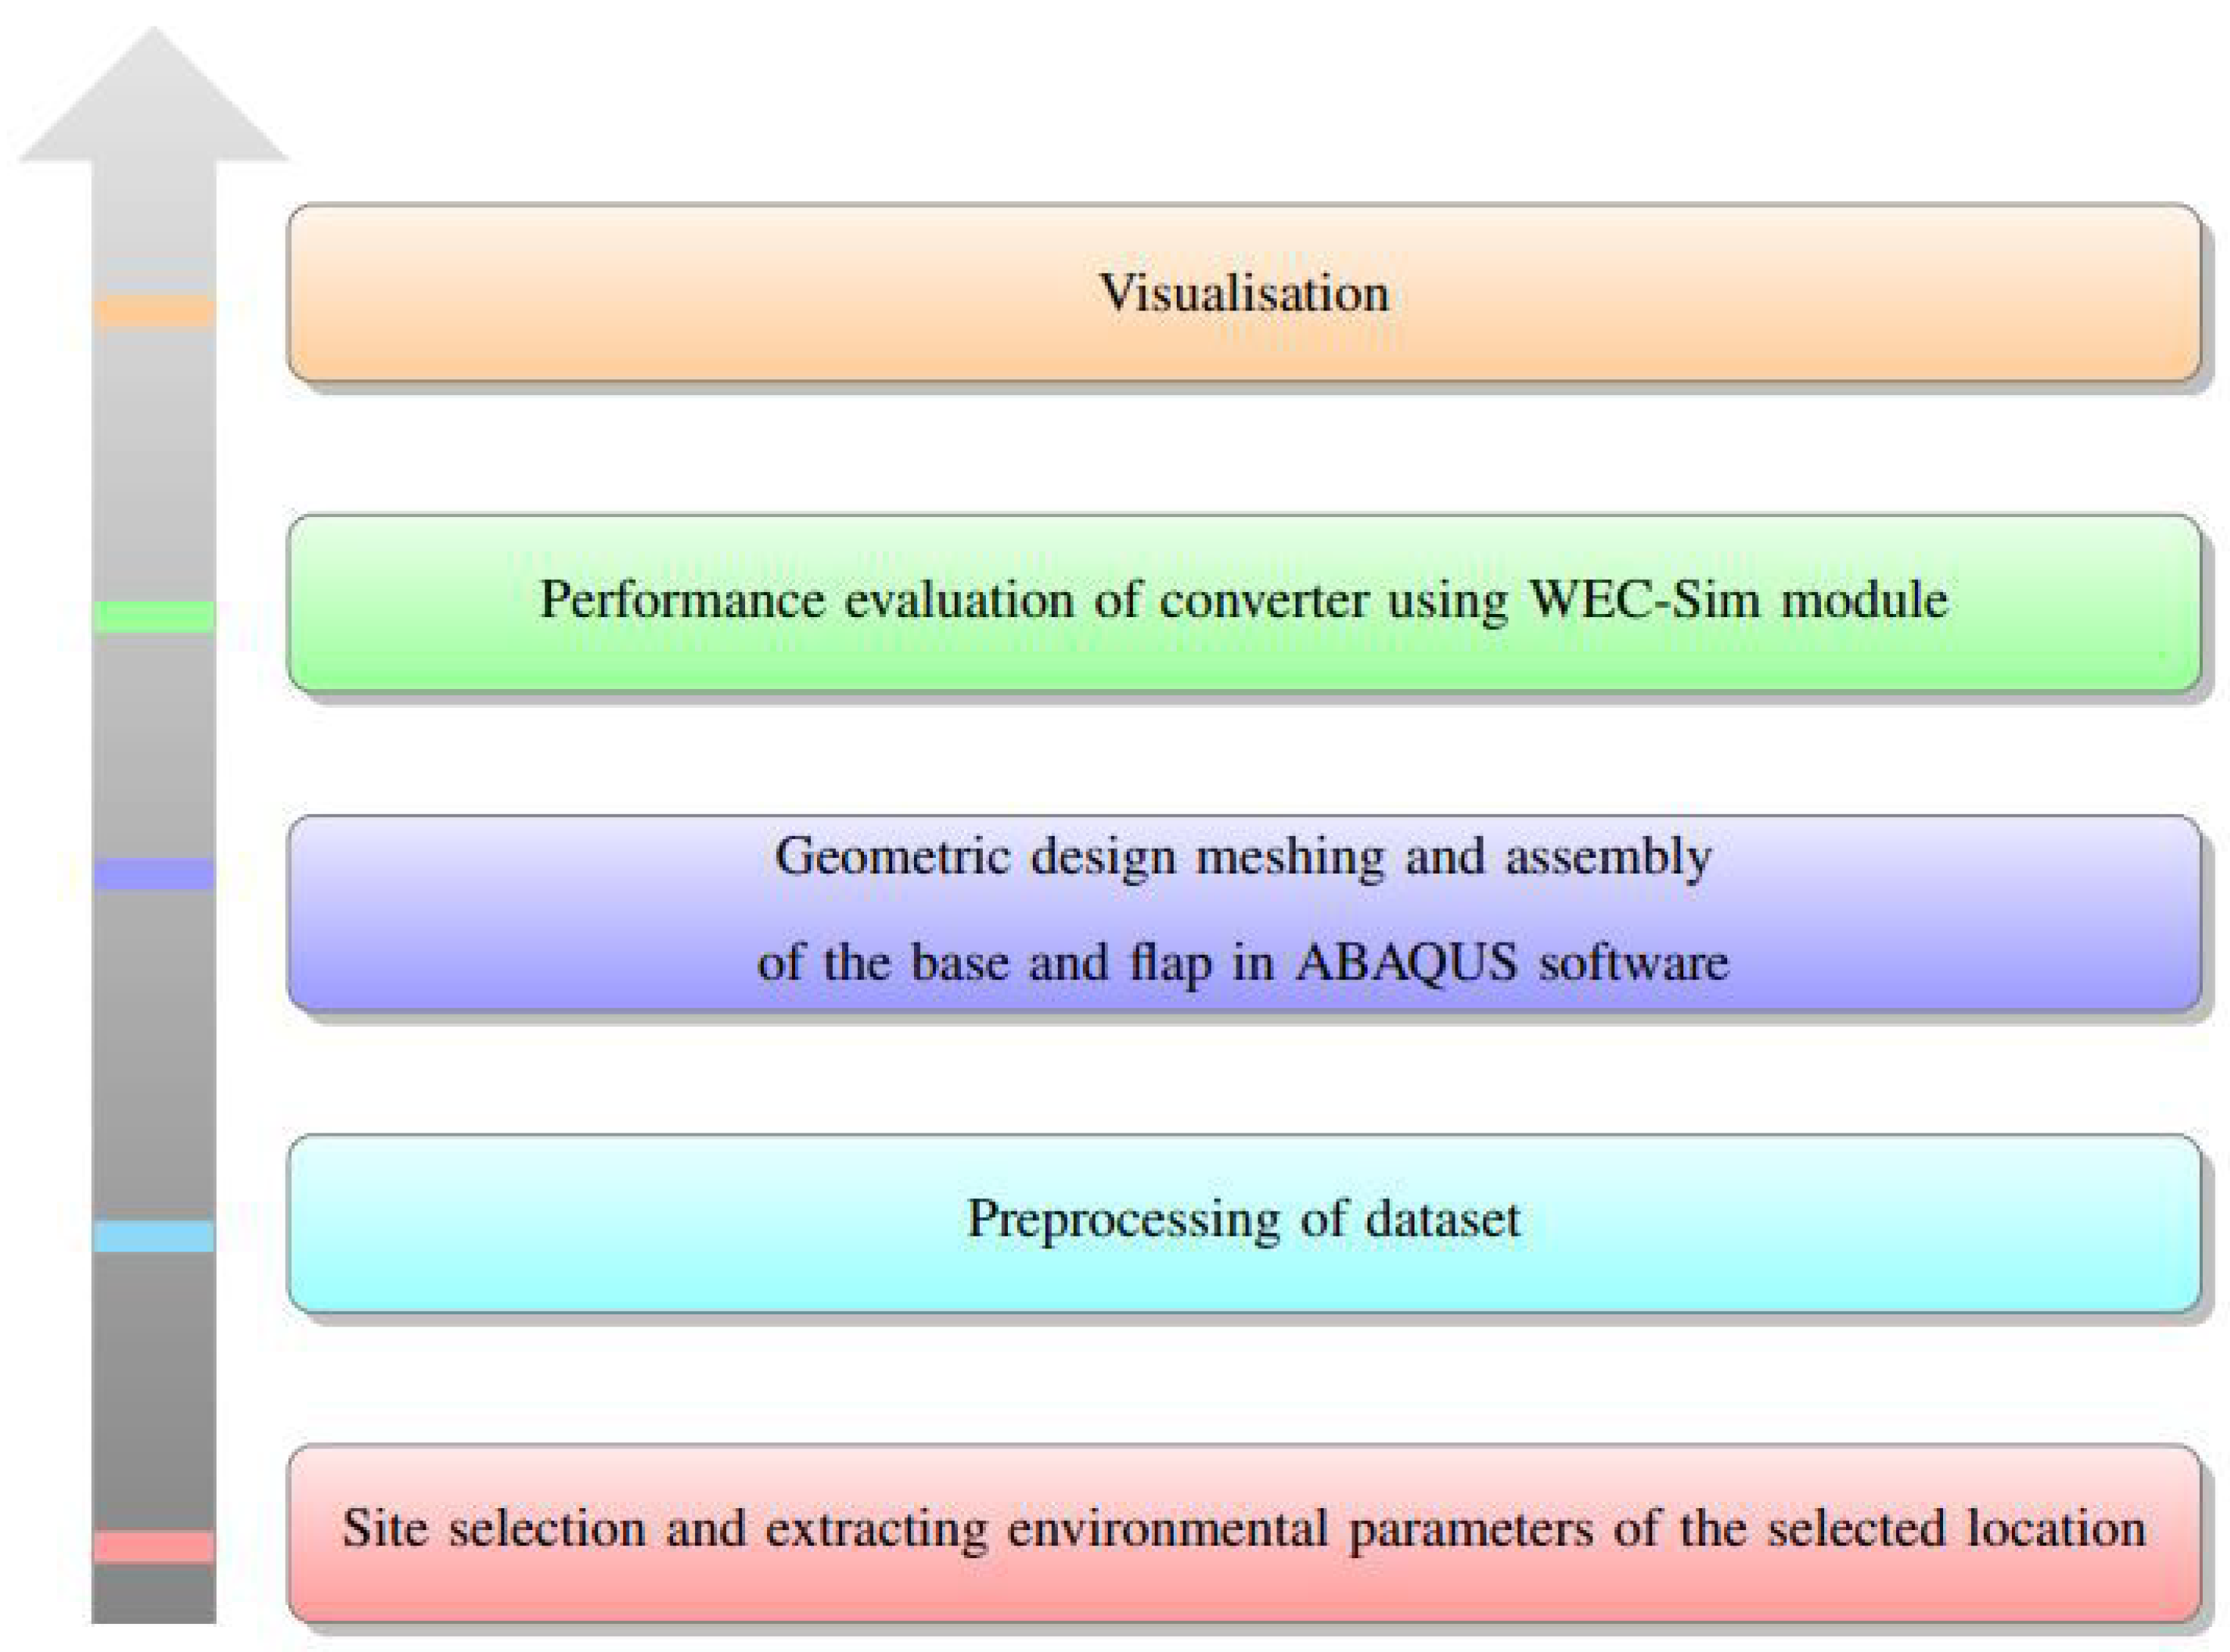
Figure 3 depicts the process of our study.
This paper is structured as follows.
Section 2 contains information about the research methodology, which is divided into six subsections. As mentioned previously, this paper is focused on identifying a suitable location for installing WECs in northern Iran; consequently, the study area is discussed in
Section 2.1.
Section 2.2 introduces all of the details regarding the wave converter used in this model, including the governing equations, followed by a description of the Boundary Element Method (BEM) in the subsection. The simulation for this research is set up in the same way as the converter’s details, and optimal dimensions are described in
Section 2.3.
Section 3 presents the study’s output for all three sites. Finally, in the final section,
Section 4, concluding remarks are drawn.
2. Research Method
Data collection and the performance of the model’s initial requirement are discussed in this section. Additionally, when data are processed, governing equations are implicit as part of the numerical modeling process. Furthermore, the boundary element method satisfies the WEC-Sim module’s initial requirements. Finally, a brief description of the geometric design is provided as follows.
The converter should be designed and implemented following the type of shore, the hydrodynamic properties of the waves, and the operating limitations of the energy converter [
47]. Wave energy converters are classified into three types in this regard: attenuators, point absorbers, and terminators. More precisely, this is based on their dimensions (in comparison to the collision wavelength), as well as their type and location (relative to the direction of wave propagation) [
8]. Attenuators are converters that are long and parallel to the direction of wave propagation. Converters that are perpendicular to wave propagation and have dimensions equal to or greater than the wavelength are classified as terminators. Moreover, adsorbents with dimensions less than one wavelength are referred to as point absorbers [
33].
Several factors influencing the type of wave energy converter are examined. Prior research has established that a terminator type of converter called OSWEC is more advantageous in certain respects than other types of converters, including the possibility of research [
48], maintenance and installation cost [
49,
50], seasonal functionality [
51], and the optimal degree of freedom [
52]. Our final decision is based on such parameters in the contemporary literature. Due to a lack of sufficient information in specific locations, the importance of these factors is assumed to be equal.
2.1. Data Collection and Wave Scenario
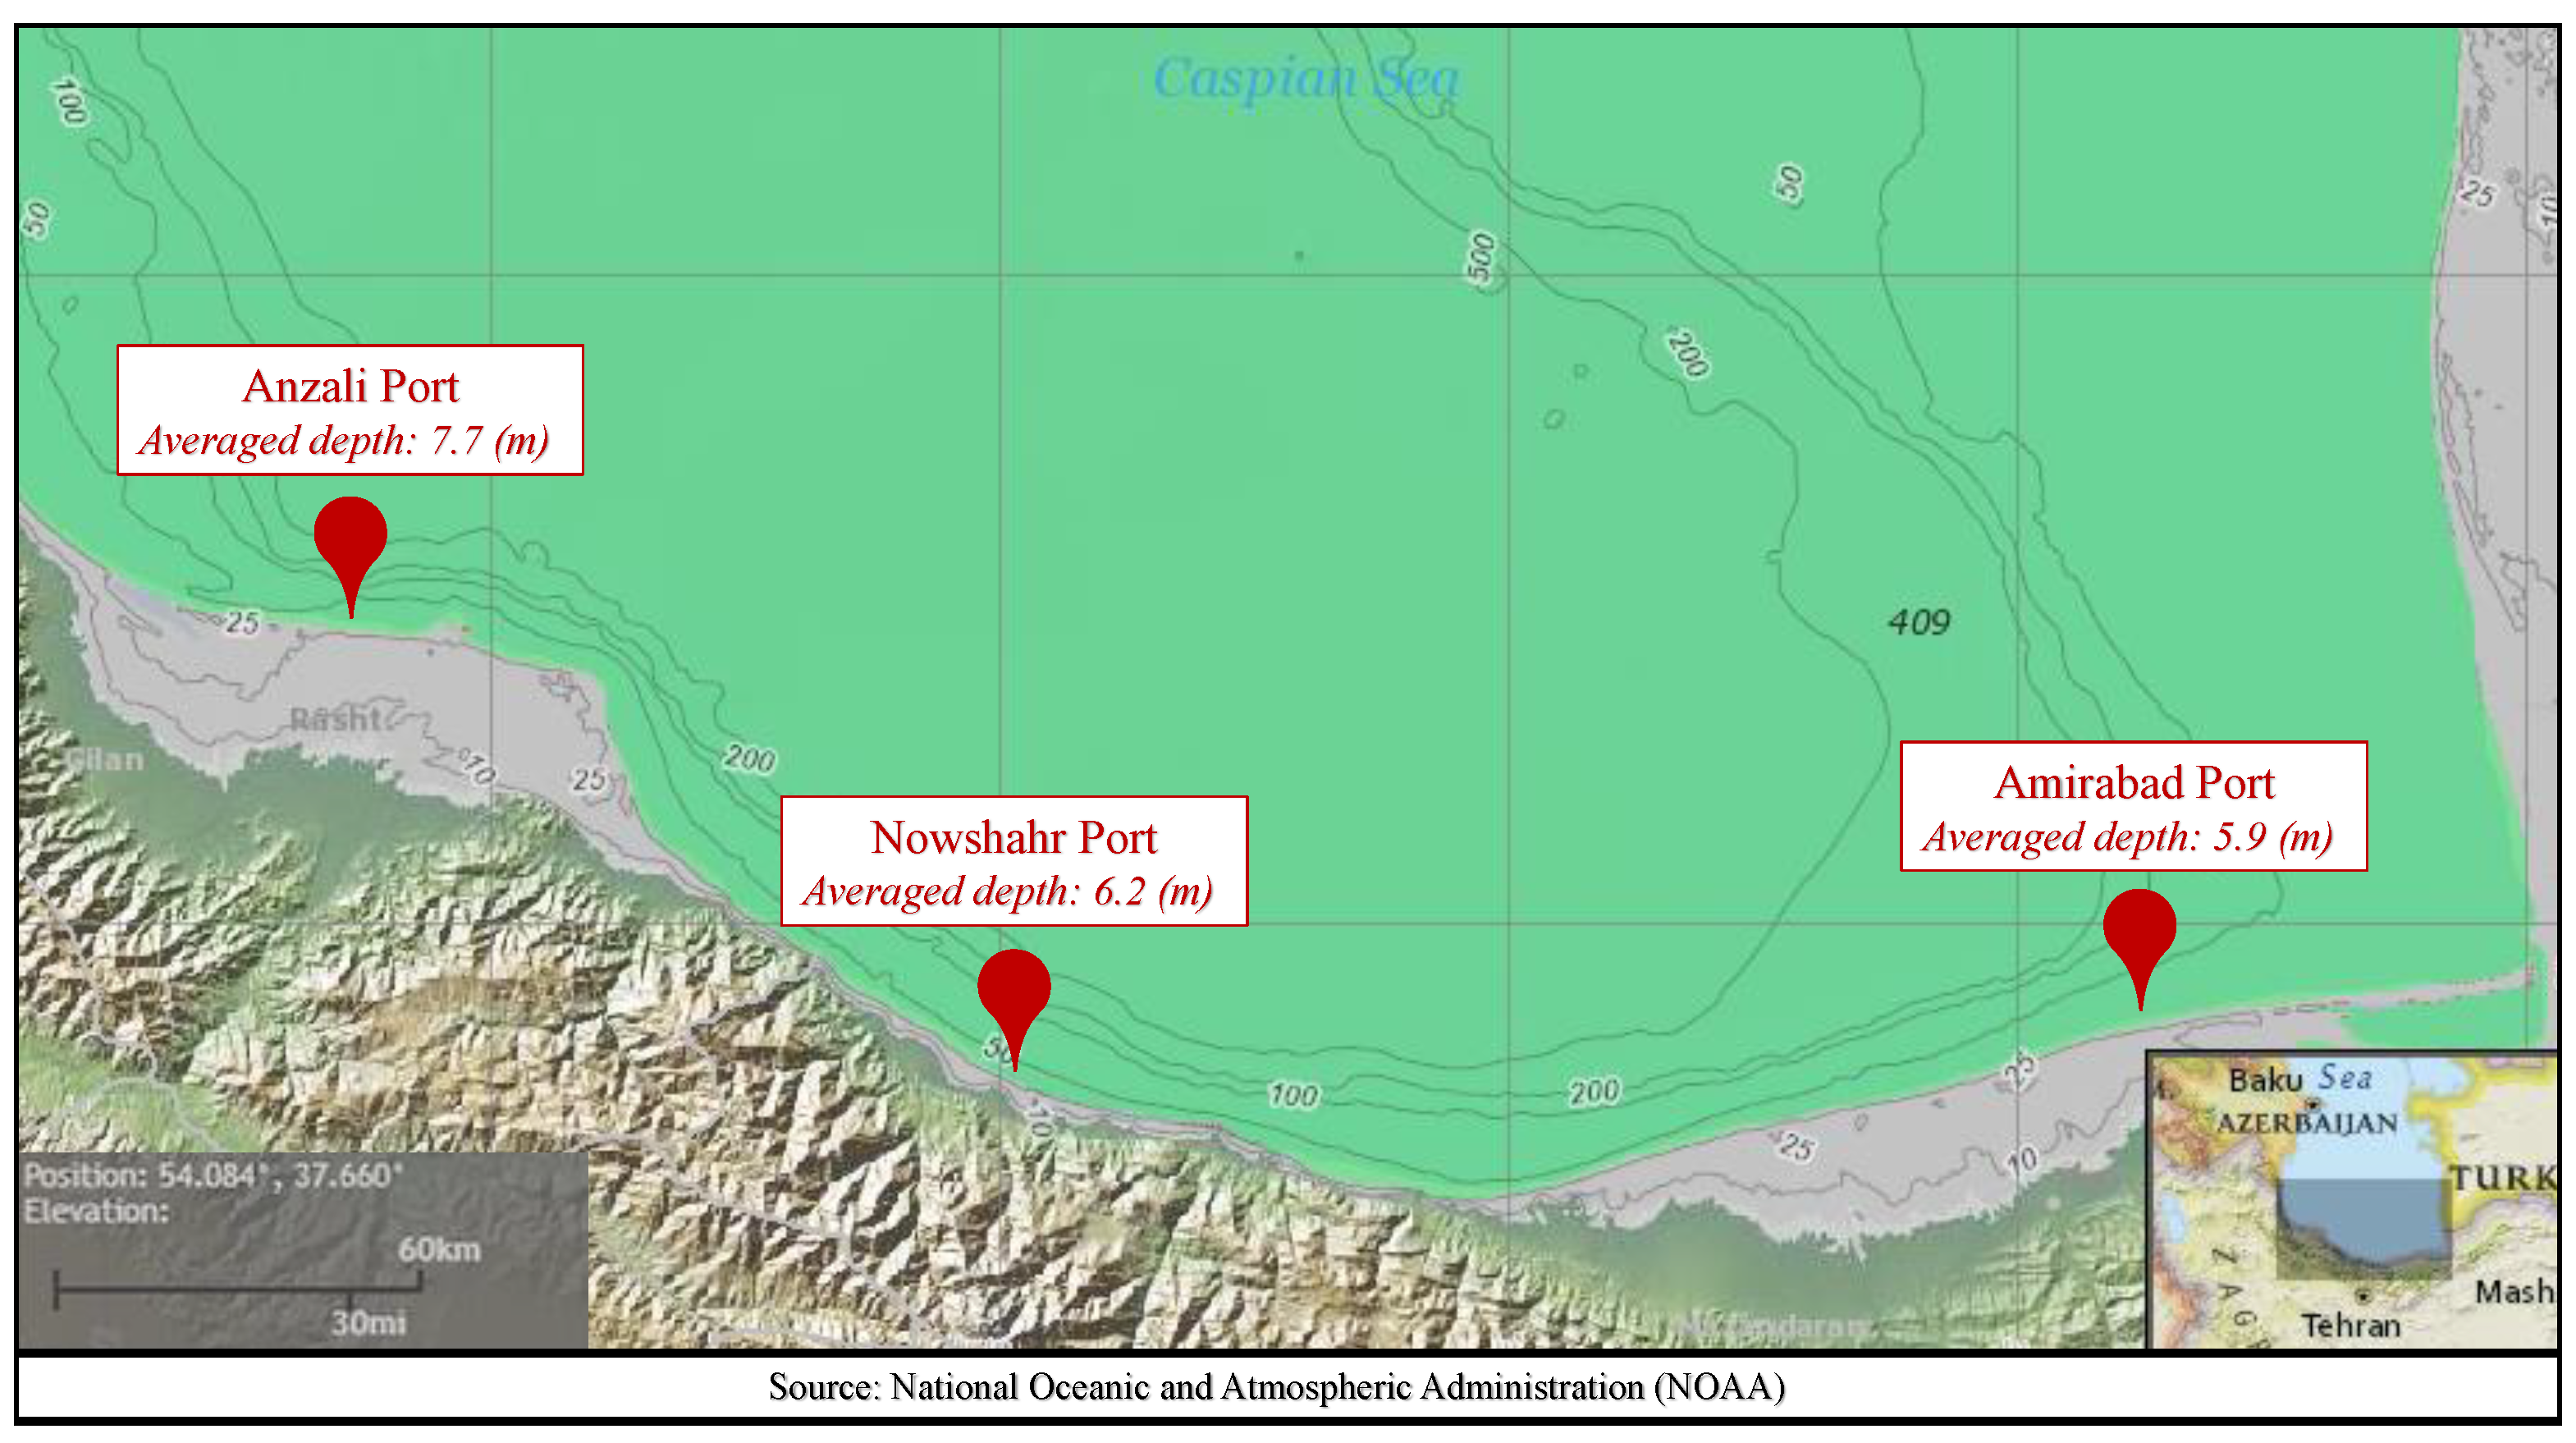
According to Kamranzad et al. [
30], Nowshahr port (in the southern part of the Caspian sea) has the potential to install wave energy converters [
31,
32]. As a result, Nowshahr port was chosen as the case study for this study. Additionally, Anzali port, located southwest of the Caspian Sea, and Amirabad port located southeast of the Caspian Sea, were chosen for their higher wave heights, allowing for the comparison of results based on their wave energy capacity. The location of the three ports is shown in
Figure 4.
An extensive set of wave data is needed to evaluate wave and bathymetric parameters in the research sites. Therefore, the Iranian National Institute of Oceanography and Atmospheric Science has provided unprocessed metadata from SWAN modeling in the Caspian Sea under the auspices of the Atlas project of Iranian waves. This dataset contained bathymetric data for the site (
h), wave period (
), wave height (
), and wave direction (
) in time series spanning seven years from 2000 to 2007 [
54]. The time series data for points in the entire sea were provided on an hourly basis.
Table 1 summarizes the statistical distribution of the data collected.
A MATLAB script is written to preprocess the data in preparation for analyzing and processing this dataset. Two steps comprise this preprocessing stage: data cleaning and data integration. Initially, we eliminate infeasible data generated as a result of data collection errors and fill the empty data with arbitrary values within the bounds of the nearby data. Then, in continuous time steps, we integrate the repeated and duplicate data. Then, it returns an appropriate dataset for the three selected ports. Next, data are classified according to their geographical location. it is saved in a separate file to be subjected to the prepossessing statistical method to remove unreliable data. Moreover, the annual average of the dataset is calculated for aggregating time series [
21]; the wave rise of the three ports is then plotted in
Figure 5.
Our study is multi-directional, which means that for each of the three directions with most traveling waves, separate spectrums per direction are used, converting them to a multi-directional spectrum using Wave Analysis for Fatigue and Oceanography (WAFO) module, and entering them into the WEC-Sim simulation module for further steps.
2.2. Hydrodynamics, and Performance Assessment Criterion
The WEC-Sim software calculates the oscillator’s motion response function using Cummins’ equations during the modeling process. Cummins published equations in 1962 for the motion response of floats and ships to waves with six degrees of freedom [
55]. Cummins’ primary equation is as follows:
where
X denotes either the device’s displacement or rotation;
M denotes the floating body’s inertia matrix;
represents the wave excitation force vector;
represents the wave radiation force vector;
denotes the power take-off force vector;
denotes the viscous damping force vector;
represents hydrostatic force;
denotes the buoyancy restoring force vector; and
represents the resulting force vector from the mooring system.
and
are calculated in the frequency domain using the hydrodynamic coefficients provided by the boundary element method (BEM) solver [
56]; details are provided in the following section.
The effect of fluid time history on the system is included using the convolution integral calculation based on Cummins’ equation. Therefore, the following equation can be used to calculate the radiation force [
46]:
where the radiation impulse response function is:
where
denotes the mass-added matrix with an infinite frequency, and
denotes the wave frequency.
The free surface height of irregular waves are composed of several standard wave components. Linear superposition, frequently determined through the use of a wave spectrum. This spectrum illustrates the wave energy distribution over a wide range of wave frequencies, characterized by wave height
and peak period
. The following equation can be used to calculate the irregular excitation force [
57]:
and excitation force impulse response function is:
where
ℜ denotes the real part of the equation,
is the ramp function,
represents the excitation vector consists of the amplitude and phase of the wave,
S denotes the wave spectrum,
is the stochastic phase angle,
represents water elevation and
is the element of the force vector. A ramp function
is required to avoid initial transient oscillations and to calculate the wave’s excitation force during the brief initial simulation time. If
t is the simulation time and
is the initial oscillation adjustment time, it is preferable to set the value of
equal to
to obtain a more stable numerical solution. According to the
values at the various ports studied (approximately 4 s), the amount of ramp time in this study is assumed to be 100 seconds [
25].
The absorbed energy in the power take-off system is represented by the following mass damping system [
55]:
where the power take-off force is:
where
is the PTO stiffness,
is the PTO damping,
and
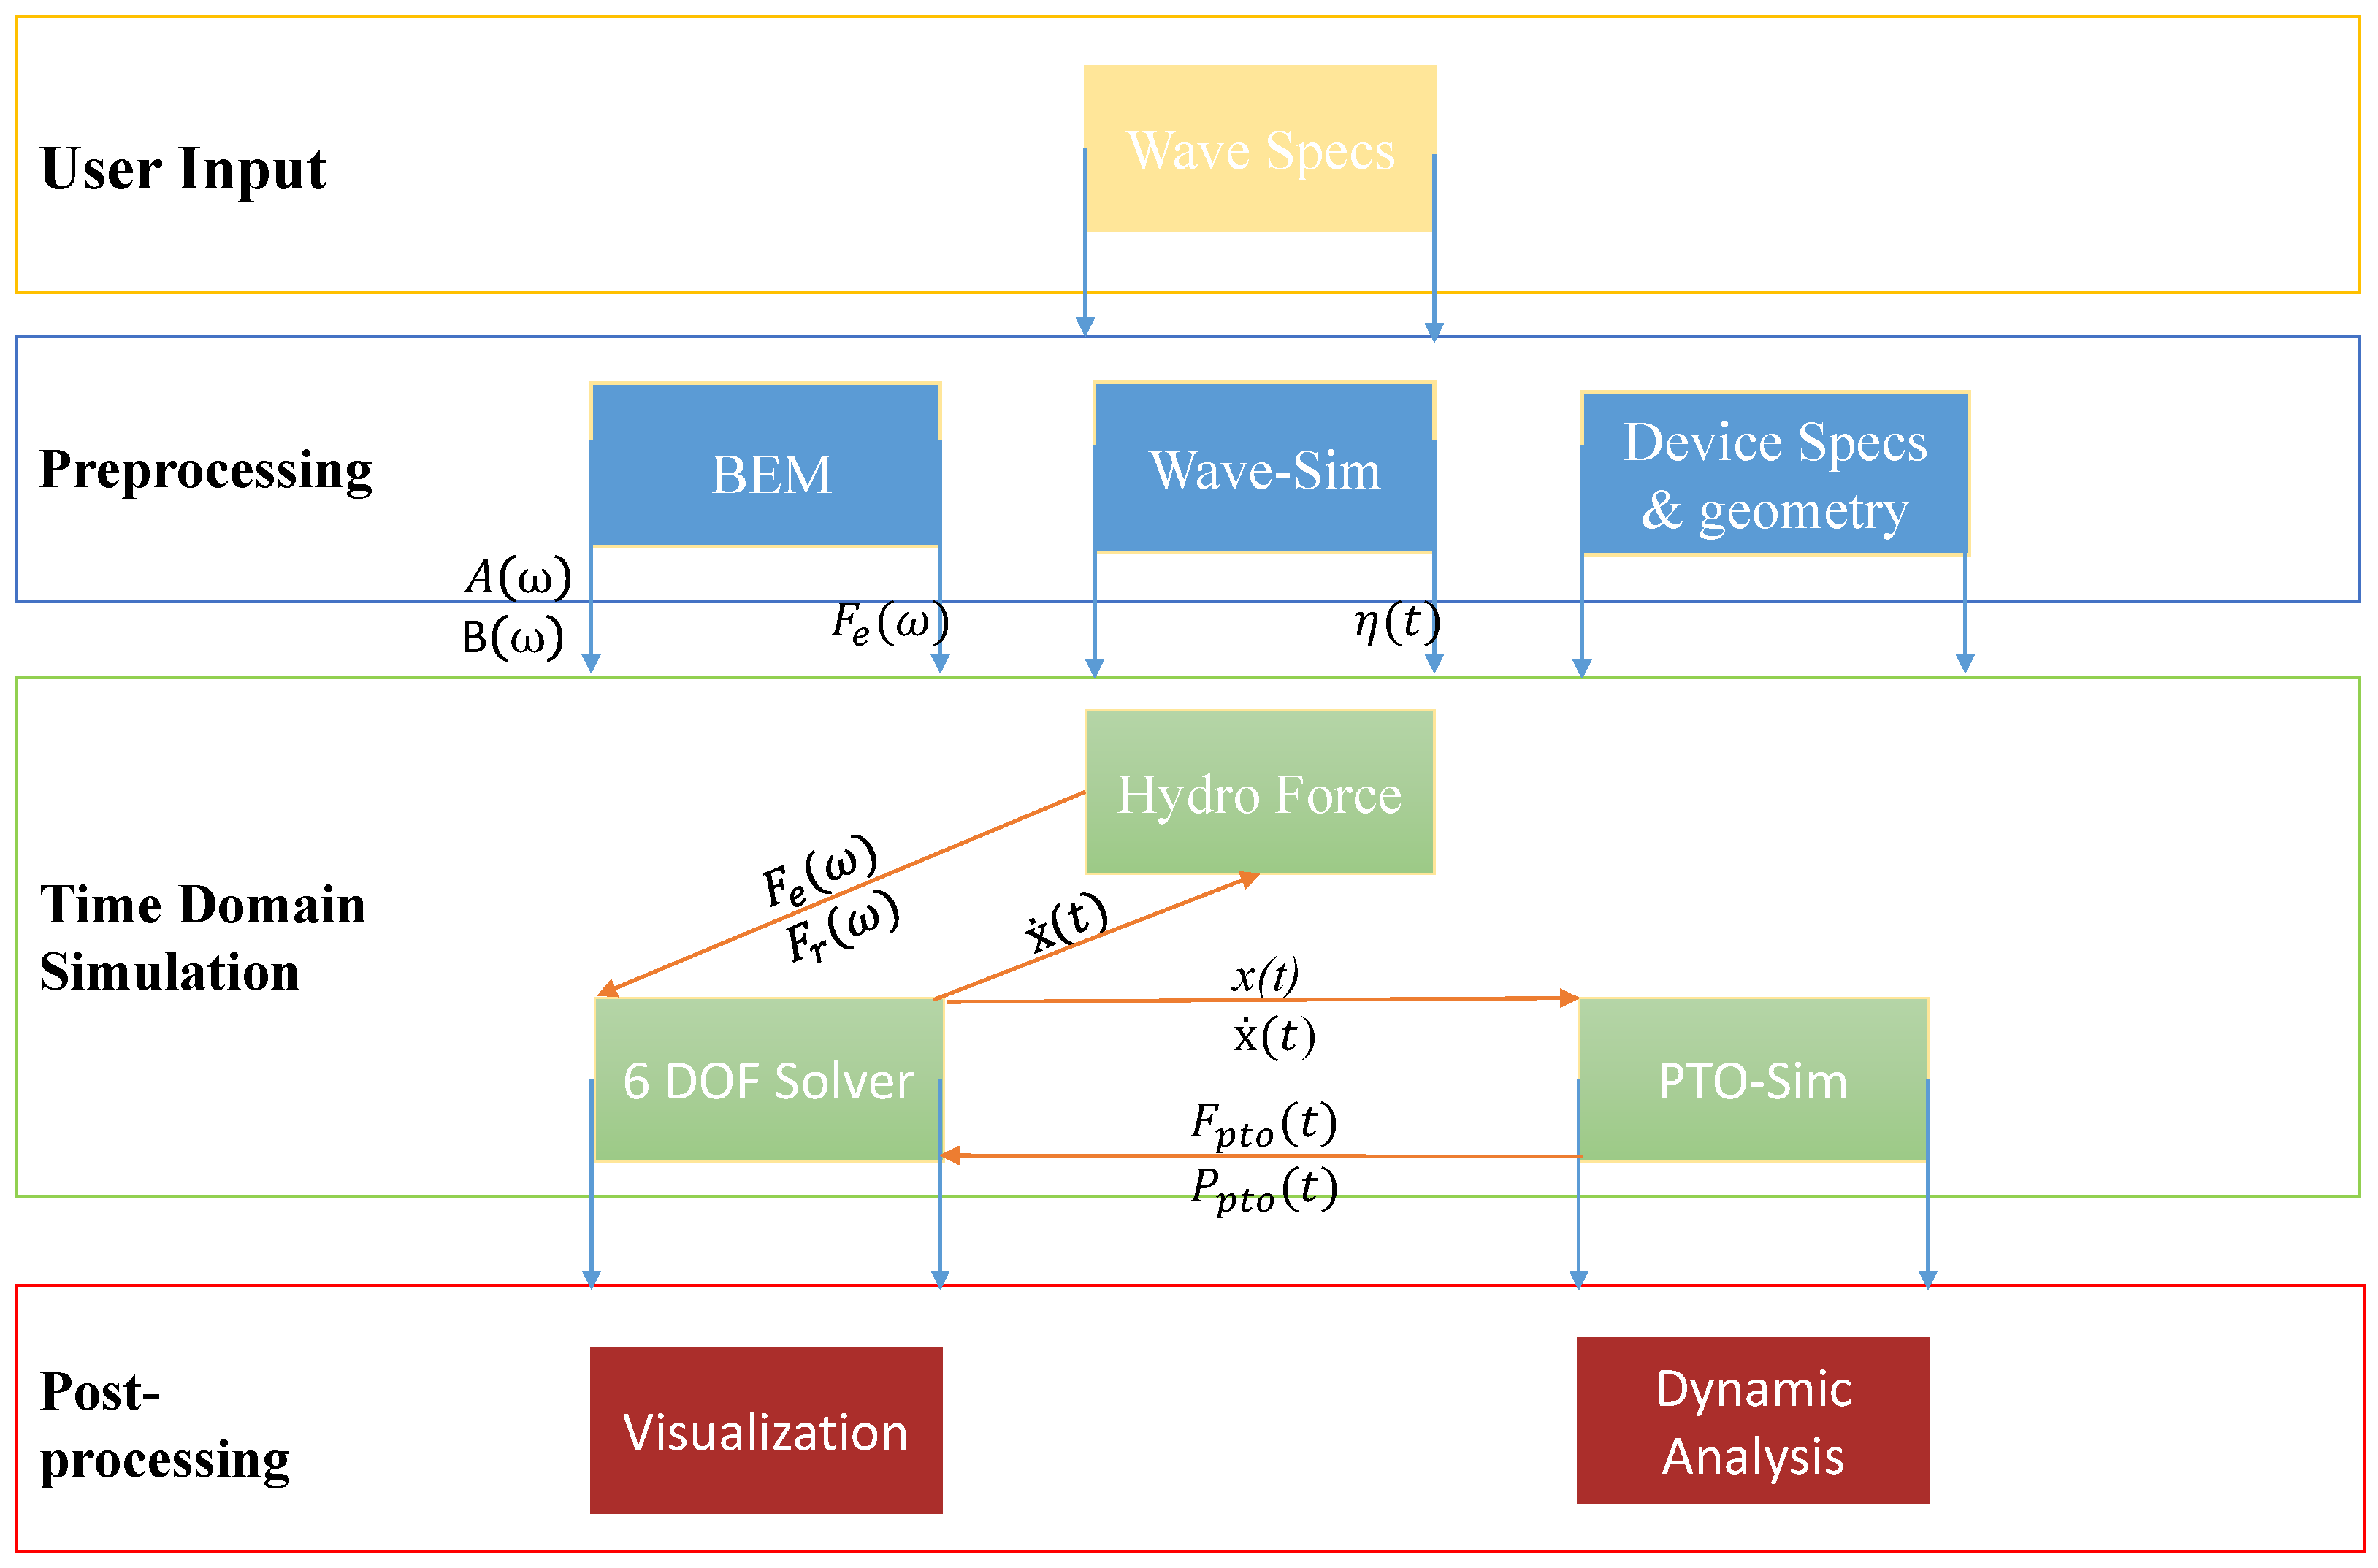
are the relative displacements and velocities, respectively. According to the explanations provided, the overall modeling process used in this study is depicted in
Figure 6.
As illustrated in
Figure 6, the software is provided with the specifications and geometry of the converter, as well as environmental conditions (in the form of a wave spectrum). In the preprocessing section, the software calculates the structure’s hydrodynamic parameters and models the waves based on the input parameters. The main processing section calculates the structure’s response characteristics to the incident time-domain waves. Finally, during the post-processing stage, the required diagrams and analyses are extracted. Additionally, the following equations are used to determine the efficiency of converters [
24,
58,
59]:
where
F represents the complex wave force,
I represents the OSWEC inertia,
denotes the added inertia,
B denotes the hydrodynamic damping coefficient, and
represents natural frequency. Afterward, the converter’s capture factor can be determined by [
60]:
where
is the incident wave’s dimensional amplitude,
w is the flap’s width, and
is the incident wave’s group velocity, as below:
where
denotes the wavenumber,
h denotes water depth, and
H is the height of incident waves.
In Equation (
9),
denotes the capture factor, which represents the device’s total efficiency per unit length of the wave crest at each time step, all of which is extracted by the device [
24].
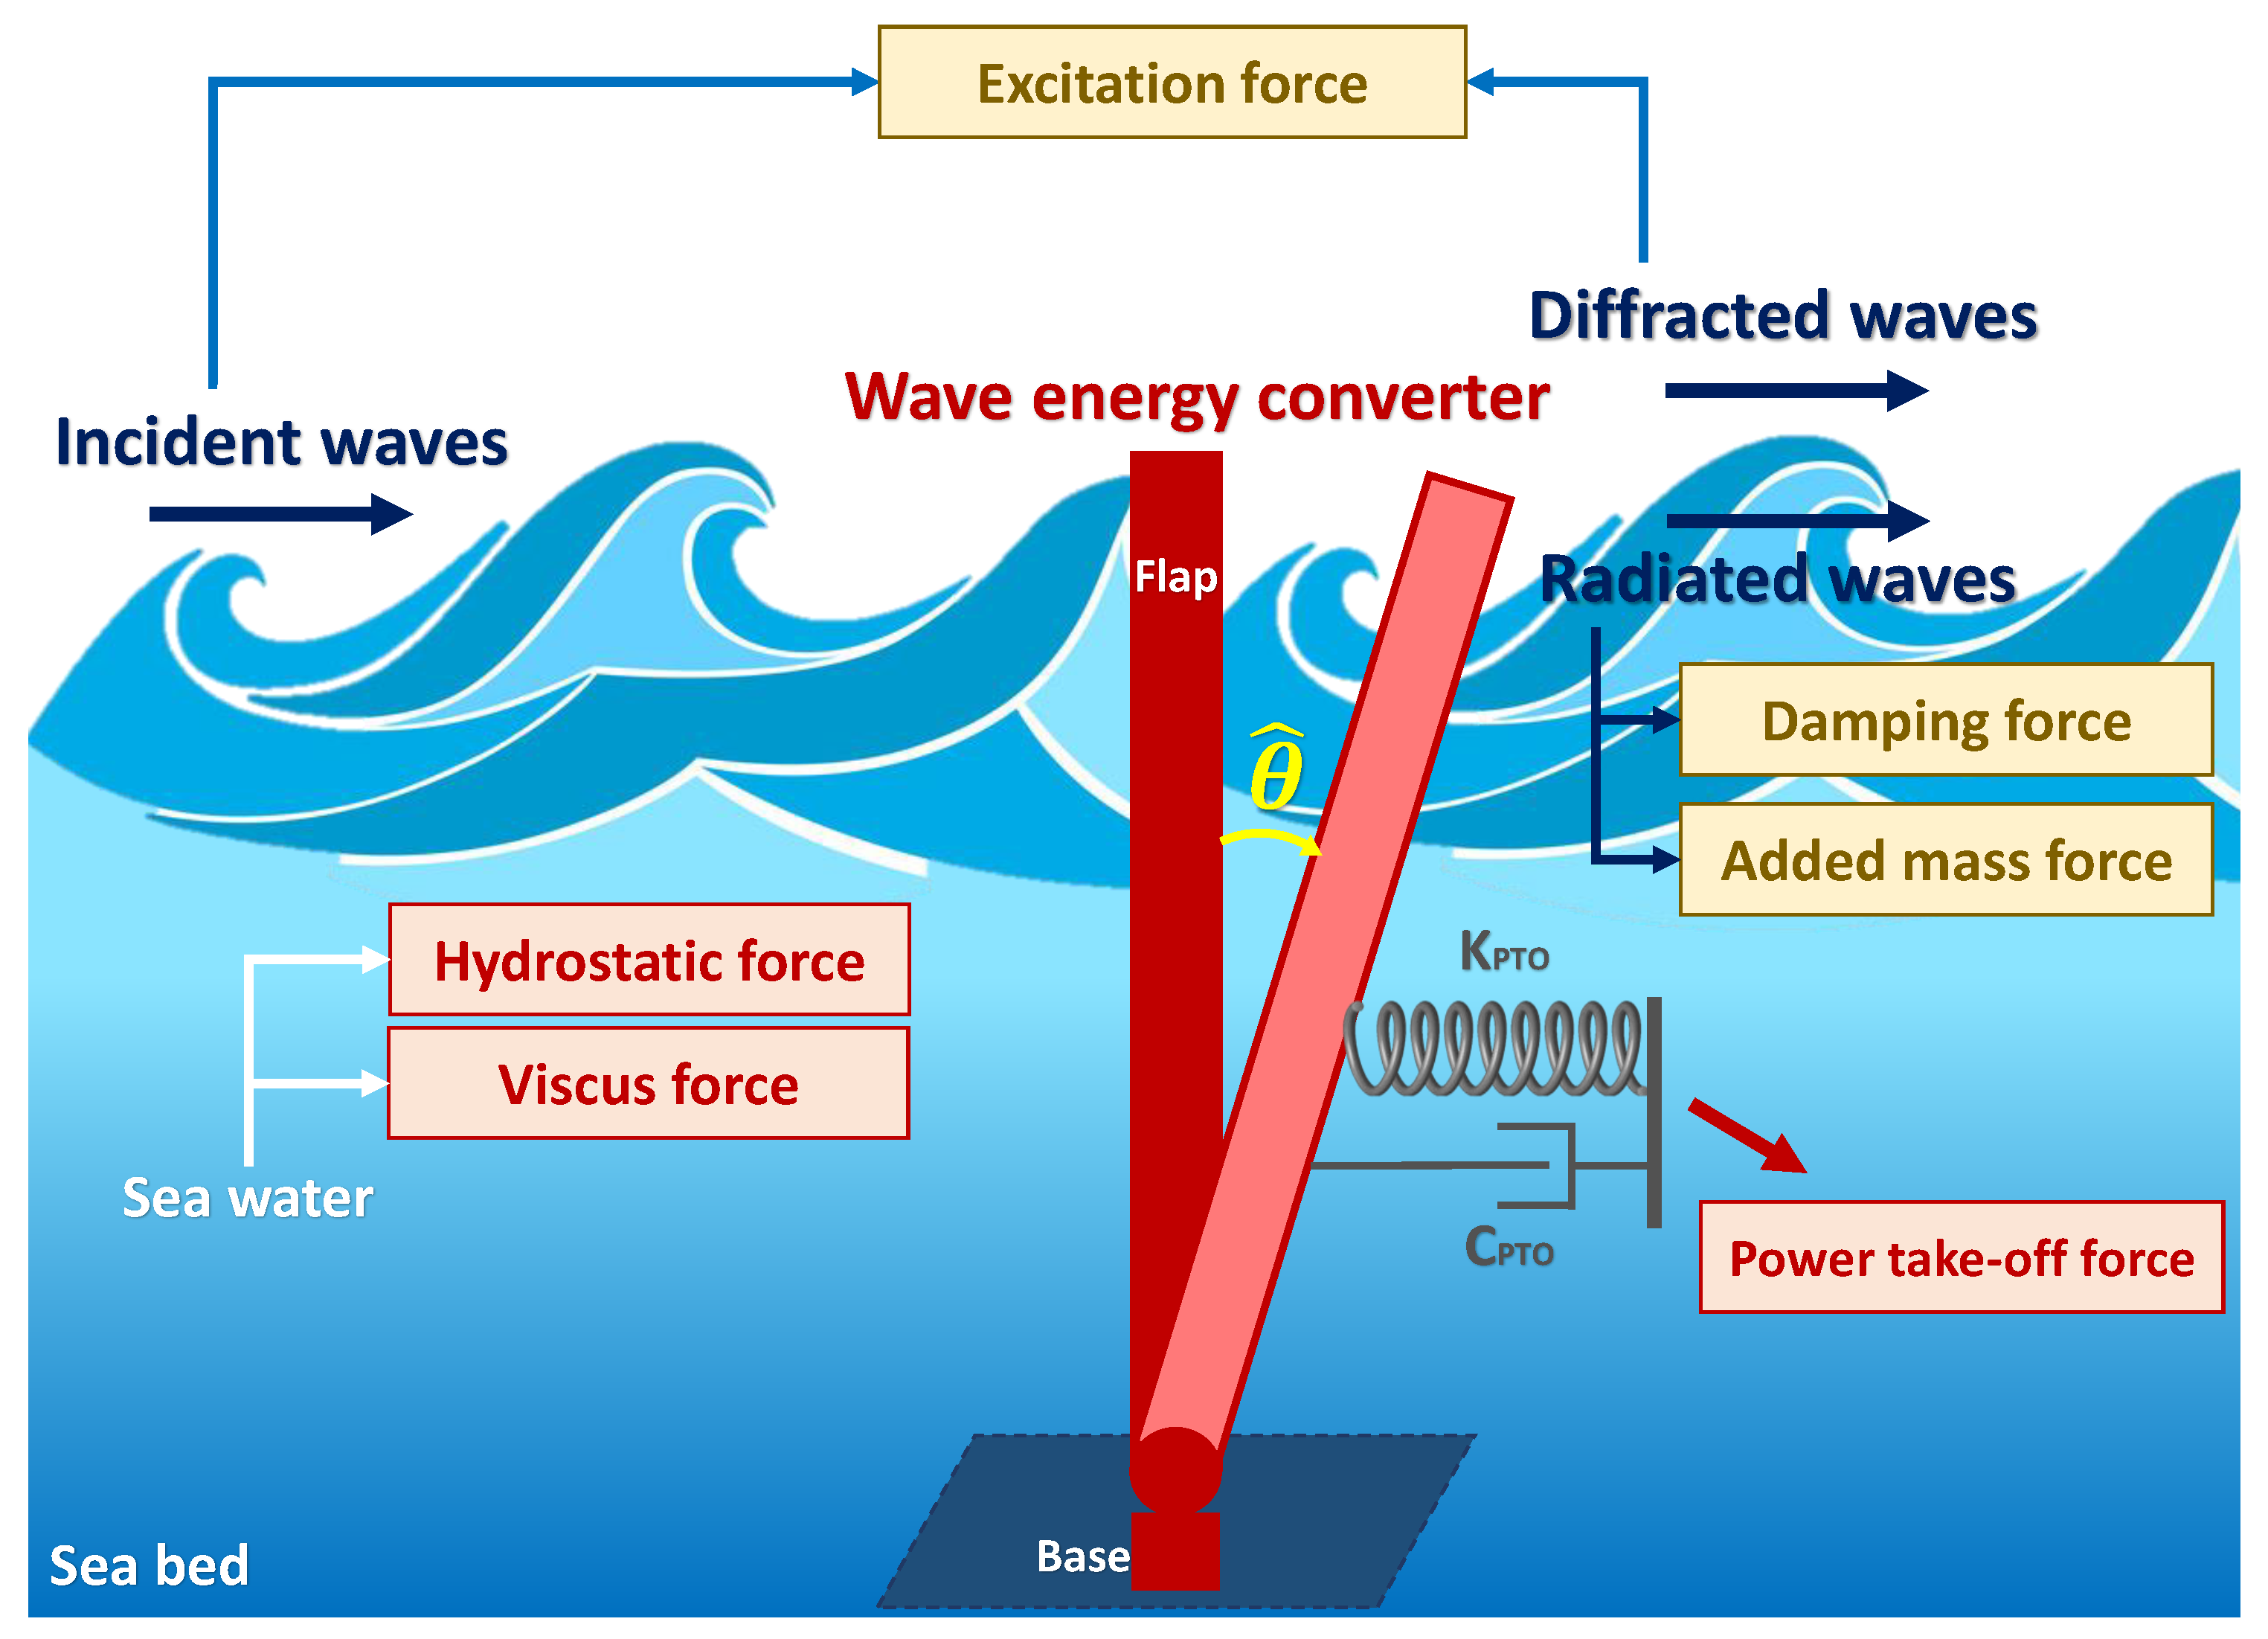
Figure 7 illustrates this interaction for the purpose of better understanding hydrodynamic forces and WEC oscillations.
2.3. Model Setup
The US Department of Energy funded the WEC-Sim, an open-source wave energy converter simulation tool developed by NREL (National Renewable Energy Laboratory) and SNL (Sandia National Laboratories). SimMechanics is used to implement this code in MATLAB and Simulink. SimMechanics is a solver for multi-body dynamic problems [
46]. WEC-Sim is capable of simulating rigid bodies, power take-off (PTO), and mooring systems. The diffraction and radiation methods are used to model hydrodynamic forces. Simultaneously, the dynamical behavior of a time-dependent system is investigated by solving motion governing equations in each of the six degrees of freedom on WEC.
Due to the complex interaction between the WEC’s flap and the incident waves, the flap’s geometric specification is critical for achieving maximum power output [
61]. These specifications include, but are not limited to, flap width, height and thickness. By considering the recommendations of recent studies, after determining the installation depth of the optimal points, the flap height will equal the installation depth plus a half to one and a half meters freeboard [
24,
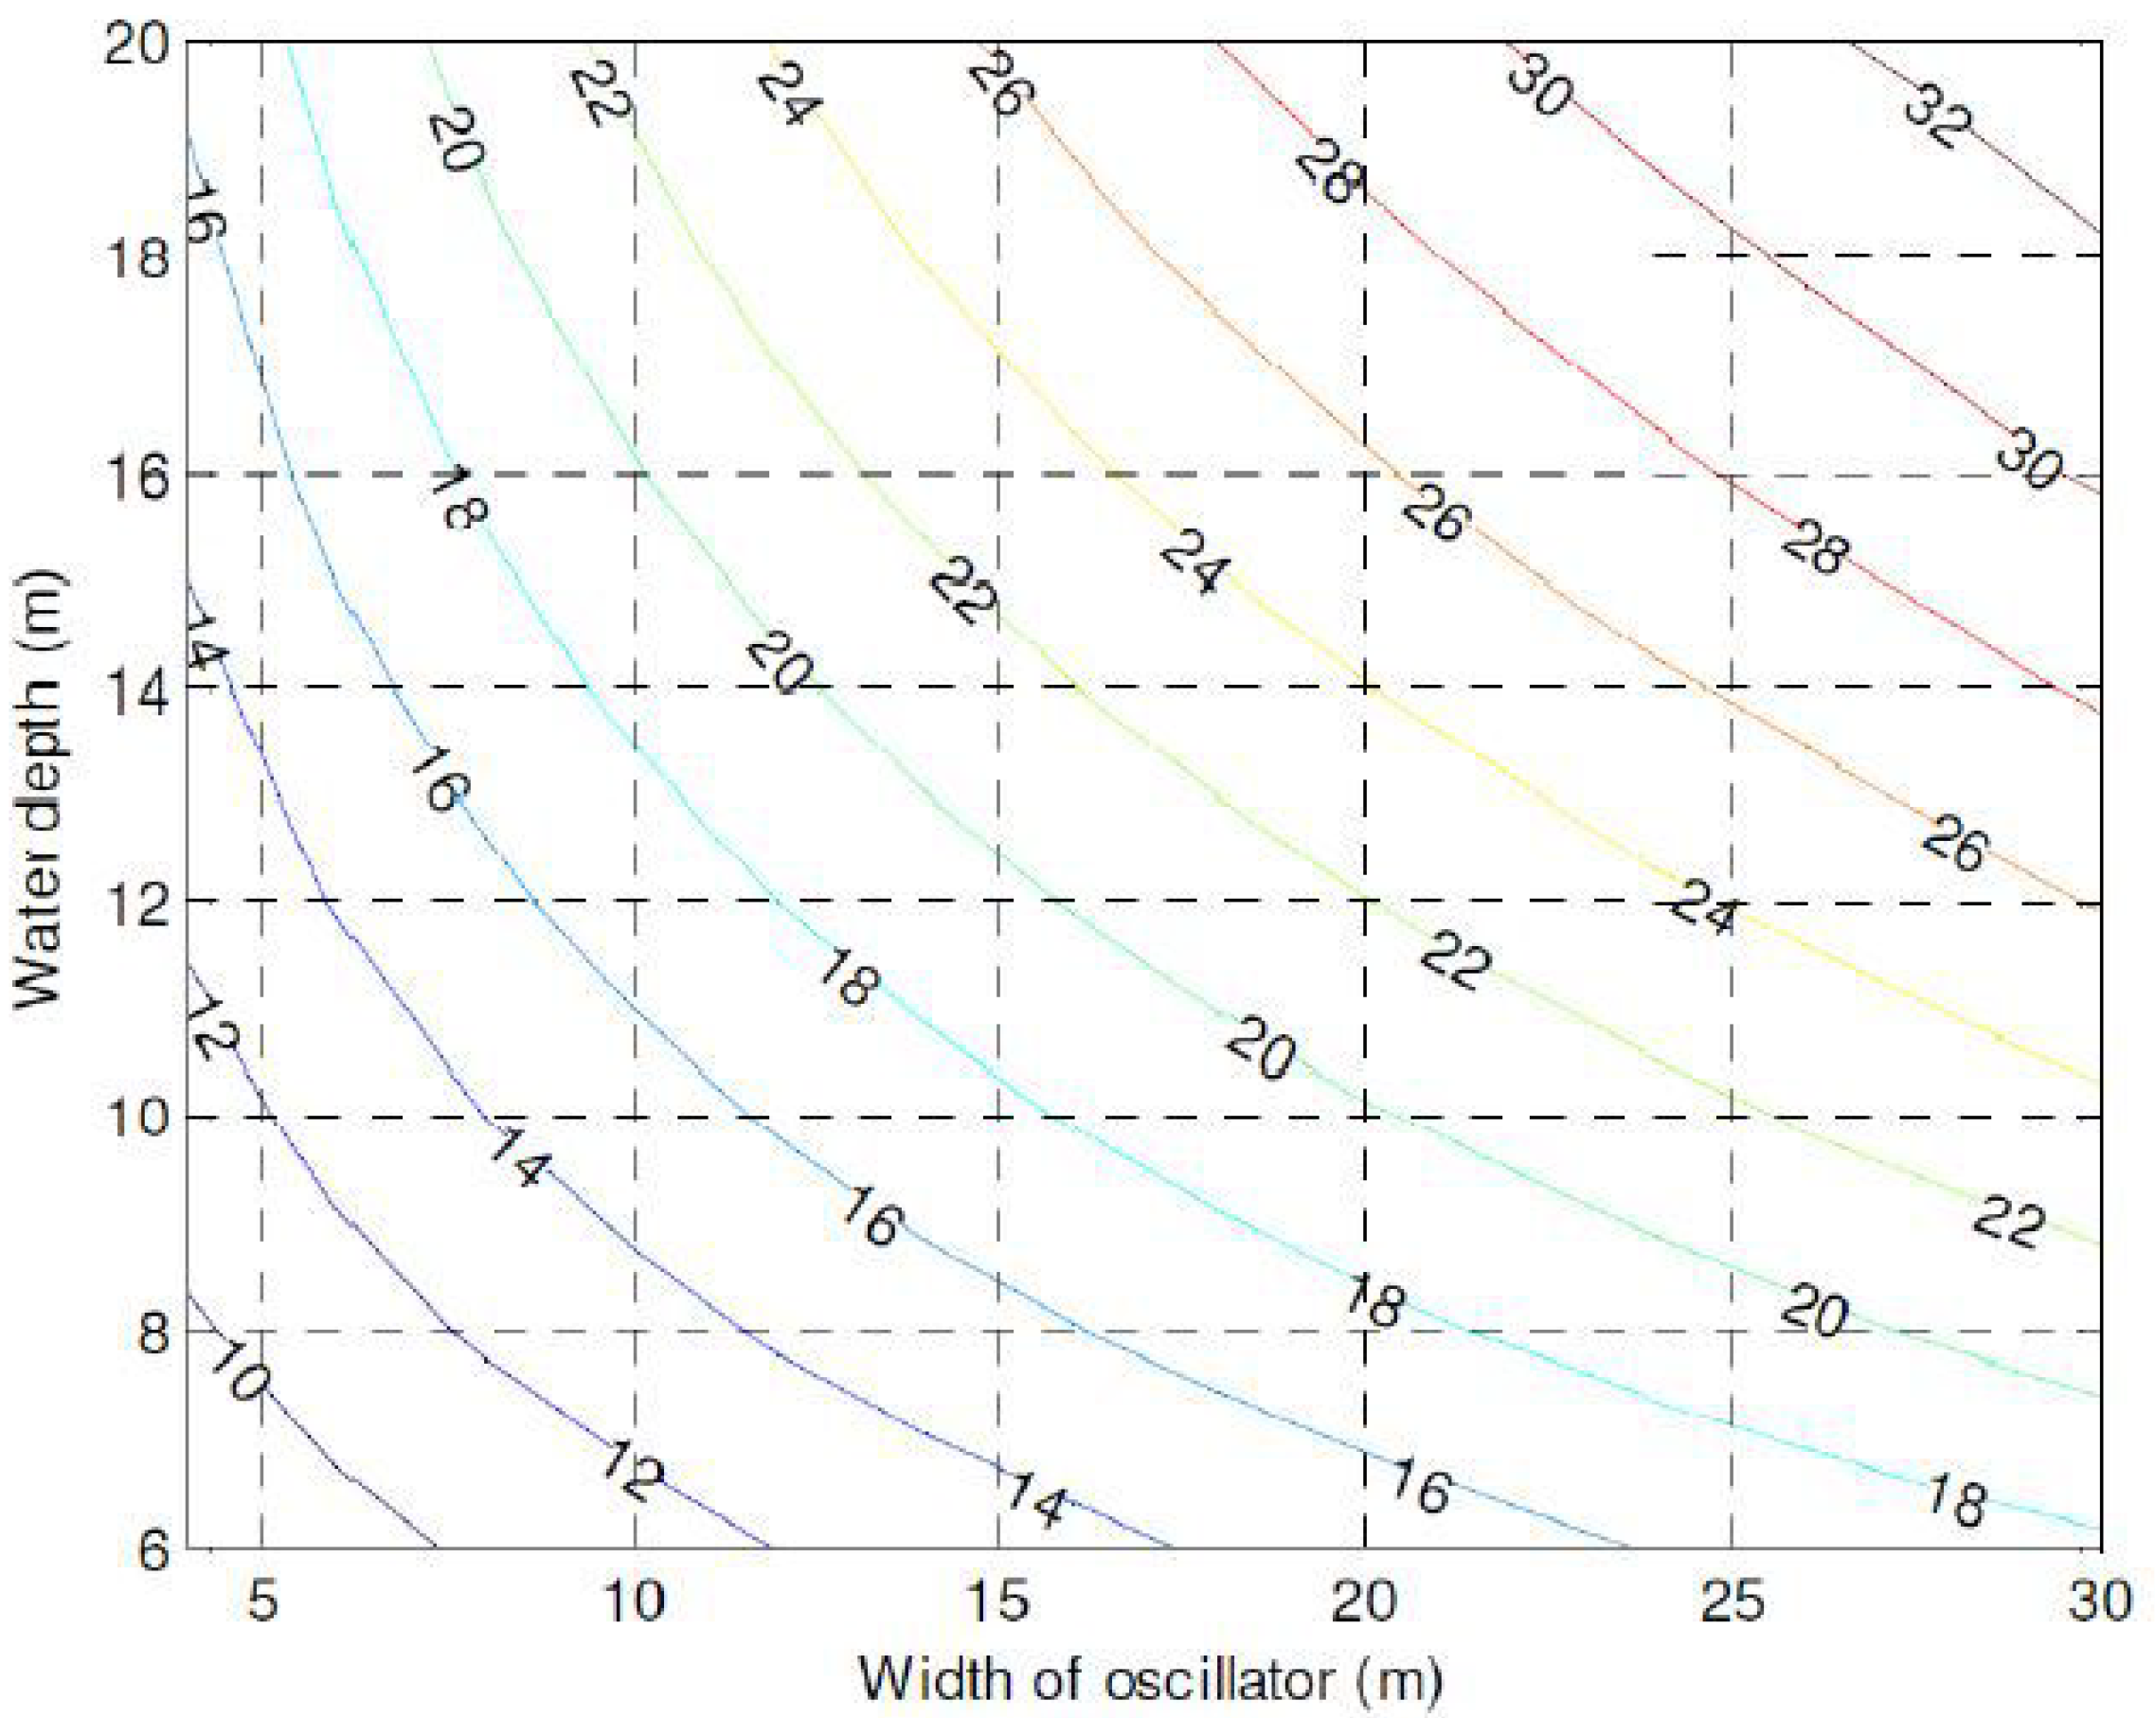
46]. Thus, based on the average depth at each site, the flap height in Nowshahr, Anzali, and Amirabad will be 6.8–7.8, 8.2–9.2, and 6–8 m, respectively, although the precise amount is determined in the following section of the paper through a sensitivity analysis. Moreover, the thickness is assumed to be 1.8 m during the design process, and the oscillator’s width is determined based on previous research conducted by Folley et al. [
62] regarding the flaps’ height.
Figure 8 illustrates the correlation between water depth and oscillator width. Furthermore, the flap’s moment of inertia will be specified using the geometric variables at each site. Finally, while the damping coefficient should be optimized in each sea state, the WEC-Sim developers recommend using a constant value for wave scenarios that are close to the benchmark model [
63].
Table 2 describes the parameters mentioned.
In general, the diffraction and radiation method computes hydrodynamic forces in the frequency domain using a boundary element method (BEM) solver [
64]. In the Boundary Element Method, the governing differential equations are converted into integral unions applied to the surface or boundary. These integrals are numerically integrated on the boundary. In this method, the boundary is divided into smaller segments (boundary elements).
This method was used to calculate the necessary hydrodynamic data before initiating the WEC-Sim operation. The software begins by solving the boundary element method through using open-source code software, NEMOH. By receiving the converter geometry file, this code applies fluid environmental conditions and meshes the converter flap and base. Then, it calculates the hydrodynamic coefficients in the frequency domain (designated
and
), which include the velocity potential and the pressure field, using the boundary integral equation method (also termed the panel method). Next, the values of the added mass matrix
, the impact response function
, and the wave excitation vector
are determined [
57].
Our research’s boundary element method codes perform the following functions: first, they receive NEMOH outputs; second, they calculate impulse response functions (IRFs) for wave radiation and excitation; and finally, they calculate state-space realization coefficients (calibration) for wave radiation response functions. Finally, data are stored in the hierarchical data format (HDF5) for use in subsequent steps [
57].
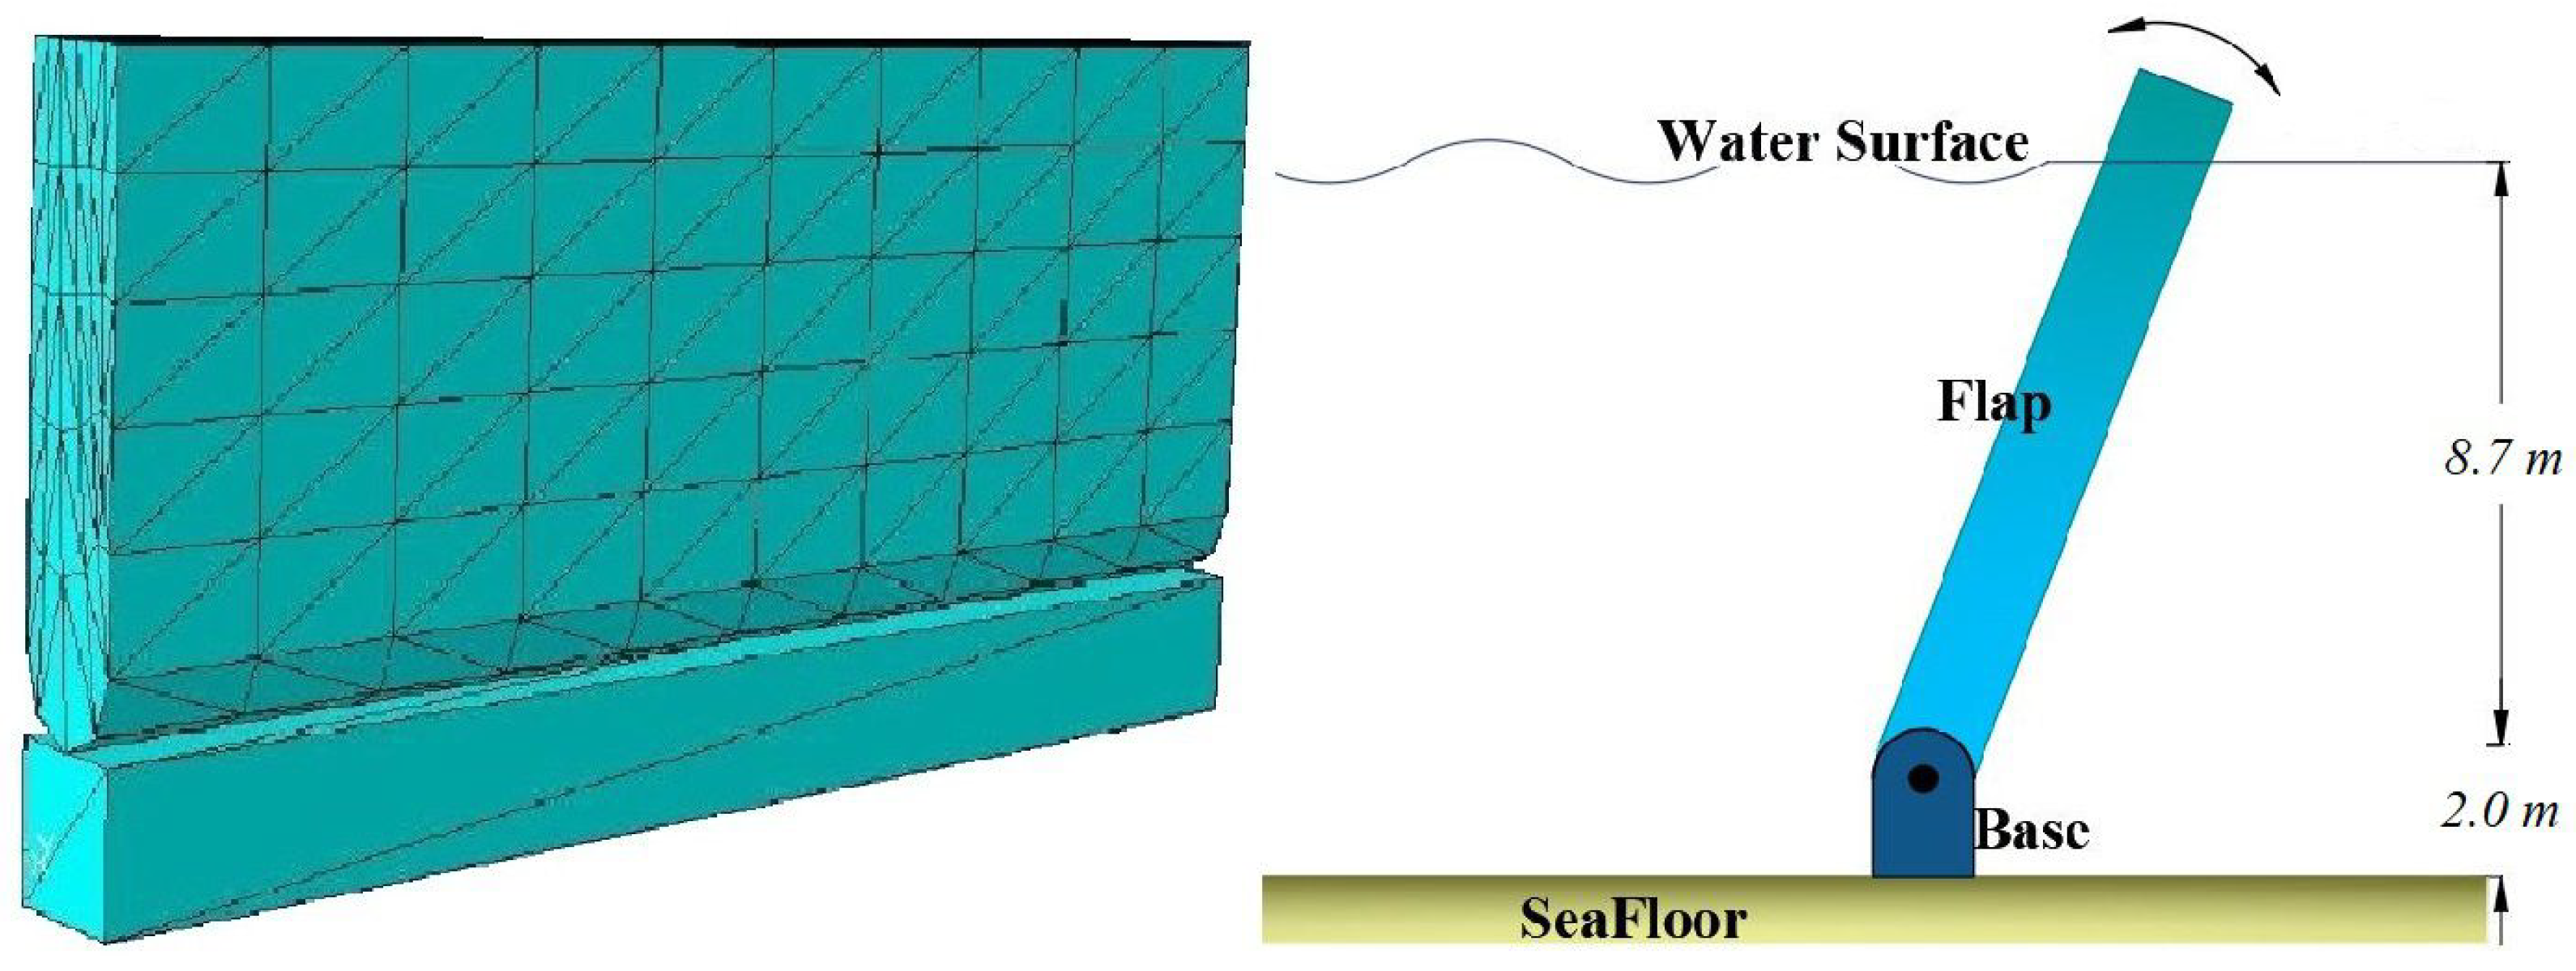
The flap and base of the oscillator must be designed in CAD programs, first to simulate an OSWEC in WEC-Sim. The model’s designed dimensions in ABAQUS are depicted in
Figure 9.
When the described procedure is completed, the flap’s width and height are determined in each of the three research locations.
Next, the WEC’s base and flap were designed using DS SIMULIA’s ABAQUS CAE 2019 software. Once the flap and base designs have been completed in CATPart format, these two models are assembled, and the flap surface has been mesh with triangular elements. According to the specification provided by the developers of WEC-Sim, the flap is made of aluminum with a density of 2700 kg per cubic meter and a uniform mass distribution. Elastic modulus and Poisson’s ratio are also 69 GPa and 0.33 GPa, respectively [
65]. The pertinent findings are revealed in
Section 3.
3. Result and Discussion
The following section contains the results of the current simulation. Initially, the forces of water-structure interaction are investigated. The flaps’ responses and power outputs are then accurately depicted.
3.1. Wave-Converter Interaction
This section obtains all implied forces and moments from the WEC-Sim module. Based on Equation (
1), the considered forces are excitation force, radiation resistance (or wave damping), restoring moment, and added mass force. Notably, mooring forces are not modeled because of their negligible effect on the converter’s displacement. Furthermore, when it comes to viscous drag force, a body with a sizeable apparent cross-section can drag more than one with a smaller cross-section, resulting in increased viscous drag. As modeling the effects of viscous drag forces requires more sophisticated calculation, we will incorporate it into our future research.
Due to incident and diffracted waves, excitation force has been considered significant on the converter’s flap.
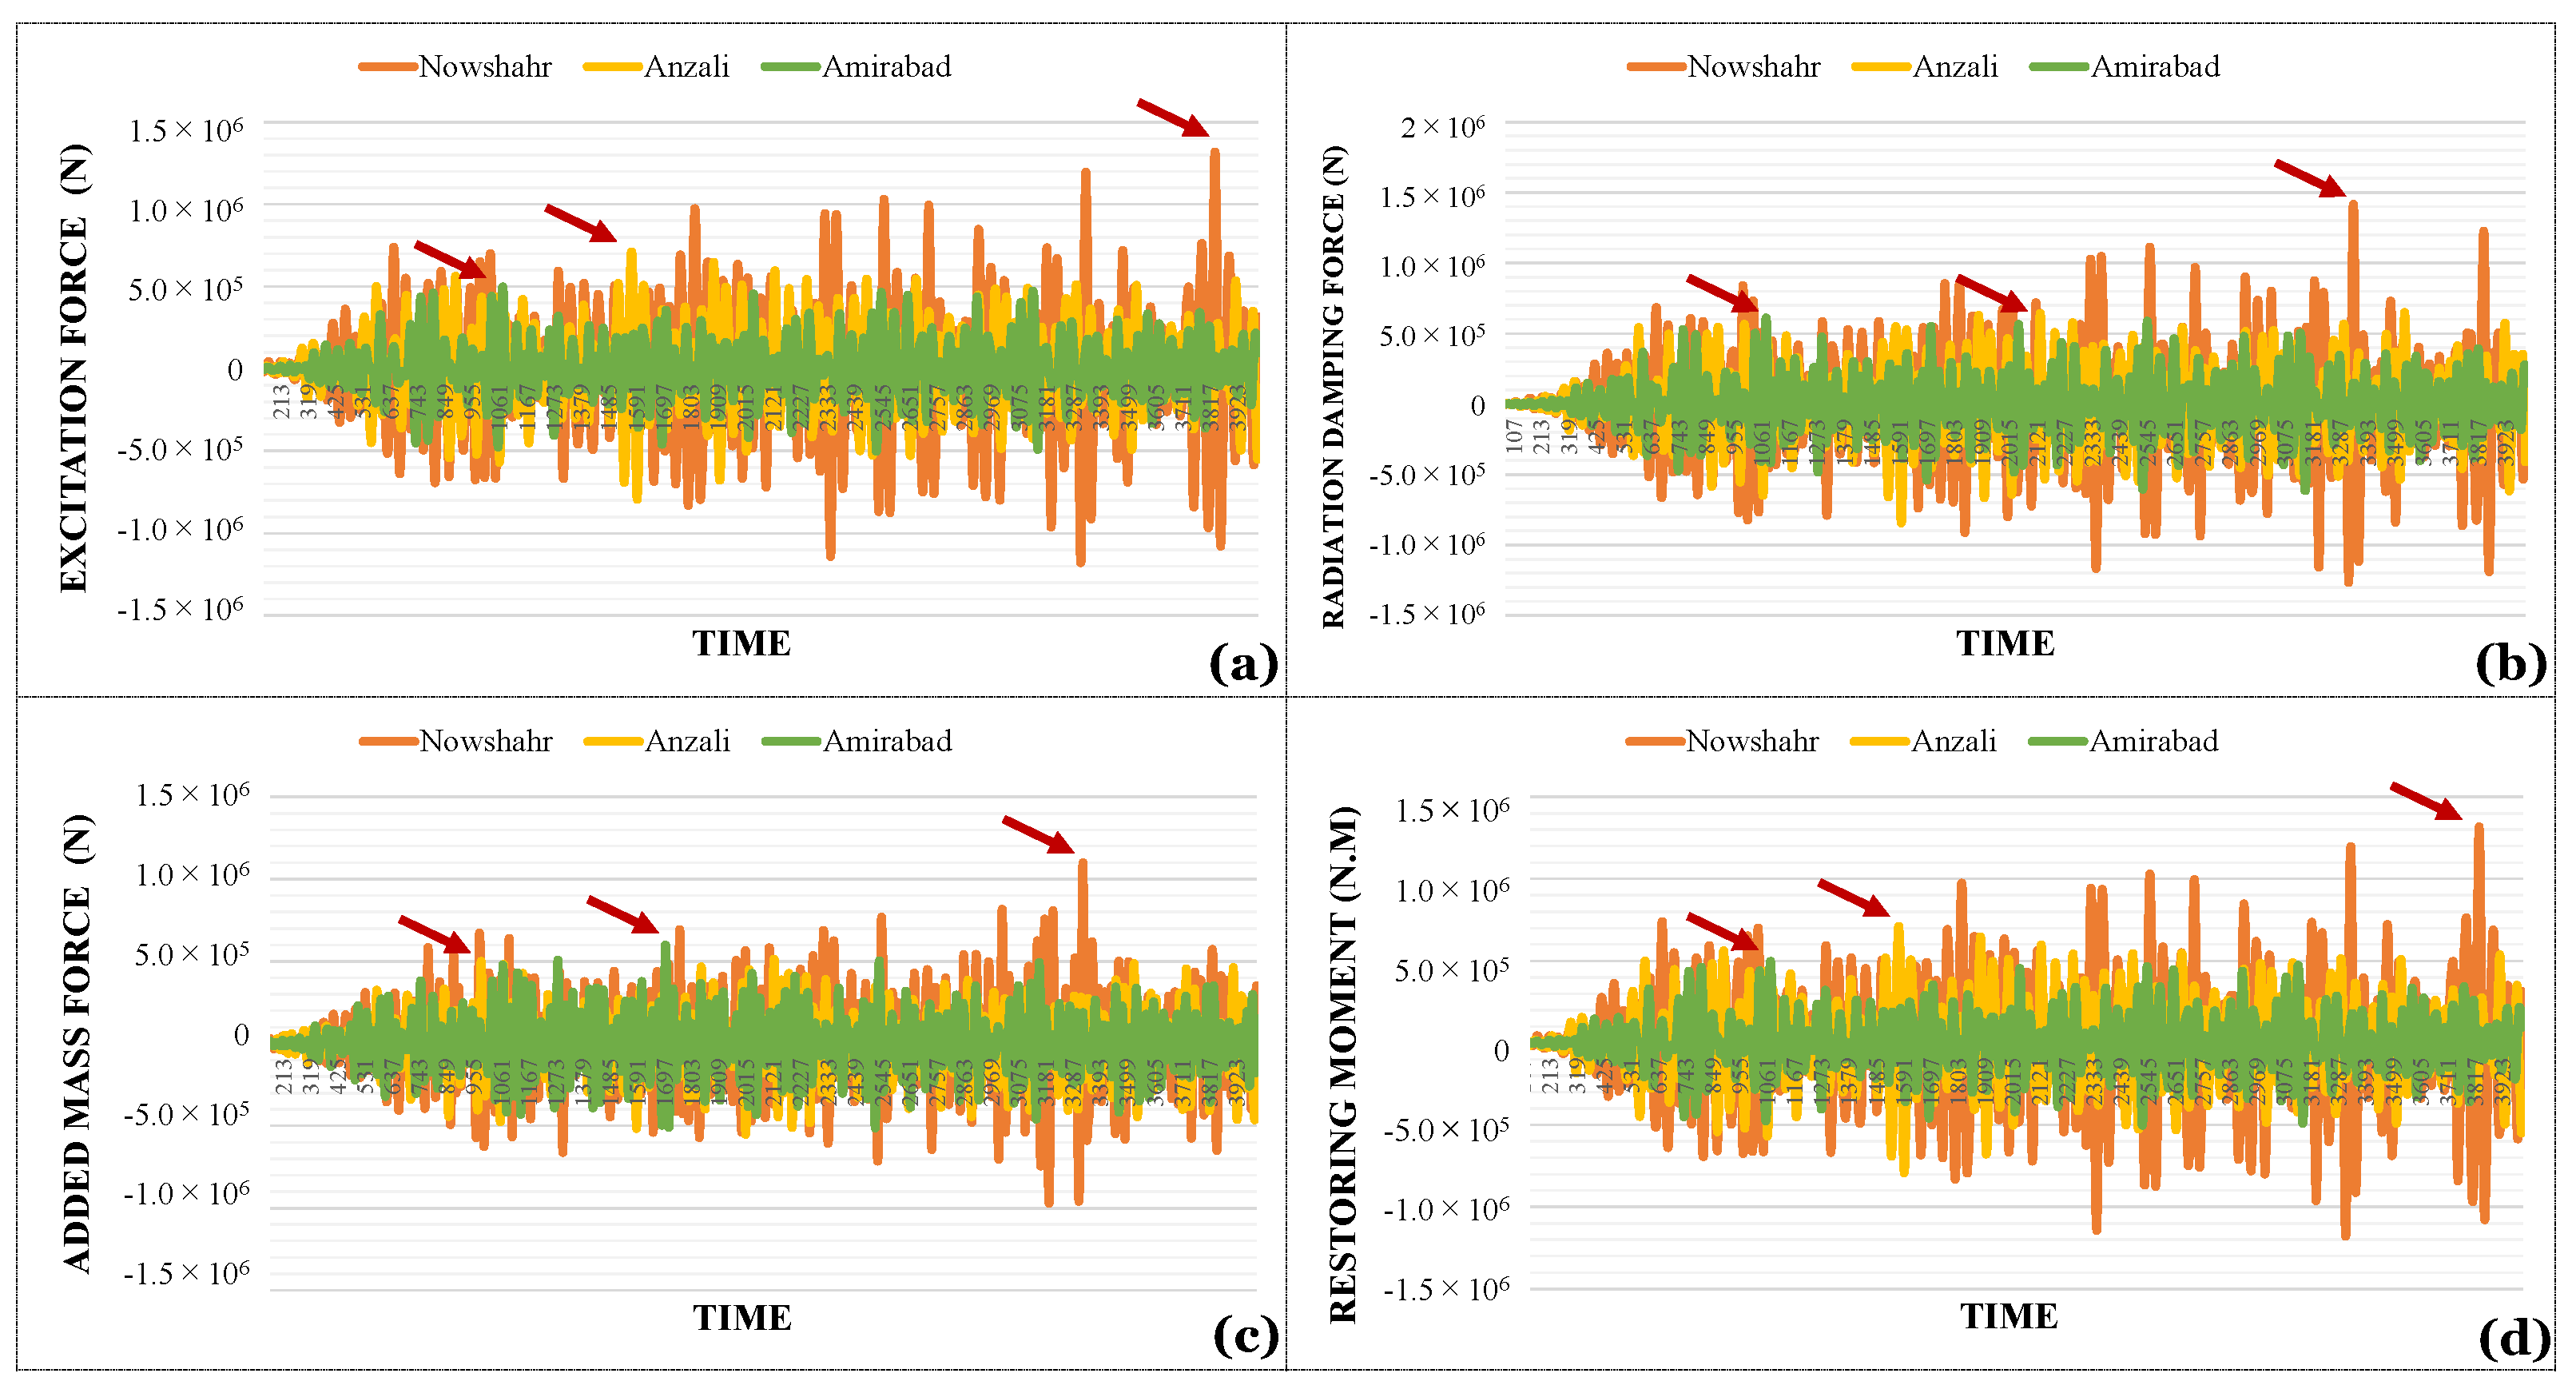
Figure 10 depicts the amounts of implied excitation force (or moment) on the flap at each time step. It is worth mentioning that the model has clocked 400 s of running time. For data recording purposes, each second is divided into ten time steps, resulting in 4000 time steps. Due to the irregular wave model used in this study, the recorded forces and moments are inconstant and oscillate between their maximum and minimum values. In
Figure 10, the recorded data demonstrate the magnitude of encountered wave excitation forces in Nowshahr port in comparison to two other ports on the Caspian Sea’s southwest and southeast coasts.
The most significant zone implied excitation force on the WEC’s flap varies between +1.3 MN and −1.1 MN in surge degrees of freedom. In Anzali port, the forces range between −0.79 and +0.71 MN. These values are approximately −0.5 and +0.5 MN in Amirabad port. It is worth noting that the positive axis at each port is determined by the direction of the local dominant wave. Calculating the implied excitation moment could be beneficial when determining the rotation of the converter around its joint axis.
This restriction applies to the Nowshahr port and is limited to −1.02 to +0.9 MN·m. In Anzali and Amirabad ports, the maximum and minimum implied moments are approximately −0.54 to +0.5, and −0.57 to +5.7 MN·m, respectively. Comparing these figures reveals a significant amount of exploitable wave energy in Nowshahr port, which represents the Caspian Sea’s central coastal zone. Concerning the wave heights in this area, a reasonable explanation would be in order. The majority of the waves with the greatest heights travel in the dominant wave direction. In contrast, in the other ports studied, the highest waves are distributed in all directions. In summary, the directional characteristics of the Nowshahr’s high height waves cause the converter to absorb more power in this case.
With regards to the study of radiation damping force, software outputs are obtained for each port in two degrees of freedom, and the values are presented in
Figure 10b.
With the radiation damping equation in mind, it is also clear that the radiation force of the Nowshahr port converter is significantly greater than that of the other two ports, indicating a logical trend in the outputs due to the Nowshahr port’s more significant oscillations and faster oscillation speed. It should be noted that the maximum wave power of the radiation damping force is approximately 1.42 MN and 1.29 MN·m in the surge and pitch degrees of freedom, respectively. As a result, the radiation force generated by the converter’s movement due to the collision of waves has a relatively direct relationship with the converter’s performance.
The added mass force and buoyancy restoring moment are studied by recording and plotting software outputs at each time step in
Figure 10c,d. As can be seen from the outputs of WEC-Sim, the amount of added mass force and restoring moment on the converter’s flab in the Nowshahr port has a more significant effect than those in the other two ports. The maximum added mass force and its consequent moment in Nowshahr are in the range of −0.9 MN and 1.1 MN. This parameter in Anzali and Amirabad are between −0.55 MN to +0.51 MN and −0.51 MN to +0.59 MN, respectively. Additionally, the Amirabad port’s added mass force is greater than that of the Anzali port due to the larger area of the converter flap in this port. More precisely, the proposed optimal design for the Anzali port is 18 m by 8.7 m, while the Amirabad port is 23 m by 7 m, as a result, the Amirabad port achieves a greater force and moment of added mass (in a resistant form) than the Anzali port does. Additionally, the presence of a greater added mass force or moment on the converter’s flap cannot be interpreted as a sign of decreased performance [
17].
3.2. Sensitivity Analysis
The recent advances in the geometric optimization of wave energy converters and other related research areas prove the effects of these studies on the power output enhancement of such systems [
66,
67]. Because OSWEC design optimization is beyond the scope of this paper, we conduct a comparative sensitivity analysis to determine the effect of flap height changes on power output during the peak period. This analysis is conducted based on the depth of water at the installation site. According to the literature review, the total height of the flap could be achieved by adding a freeboard length (part of the flap height above the water surface) to the distance between the mean water level and base of the converter [
13,
15,
17,
21], as shown in
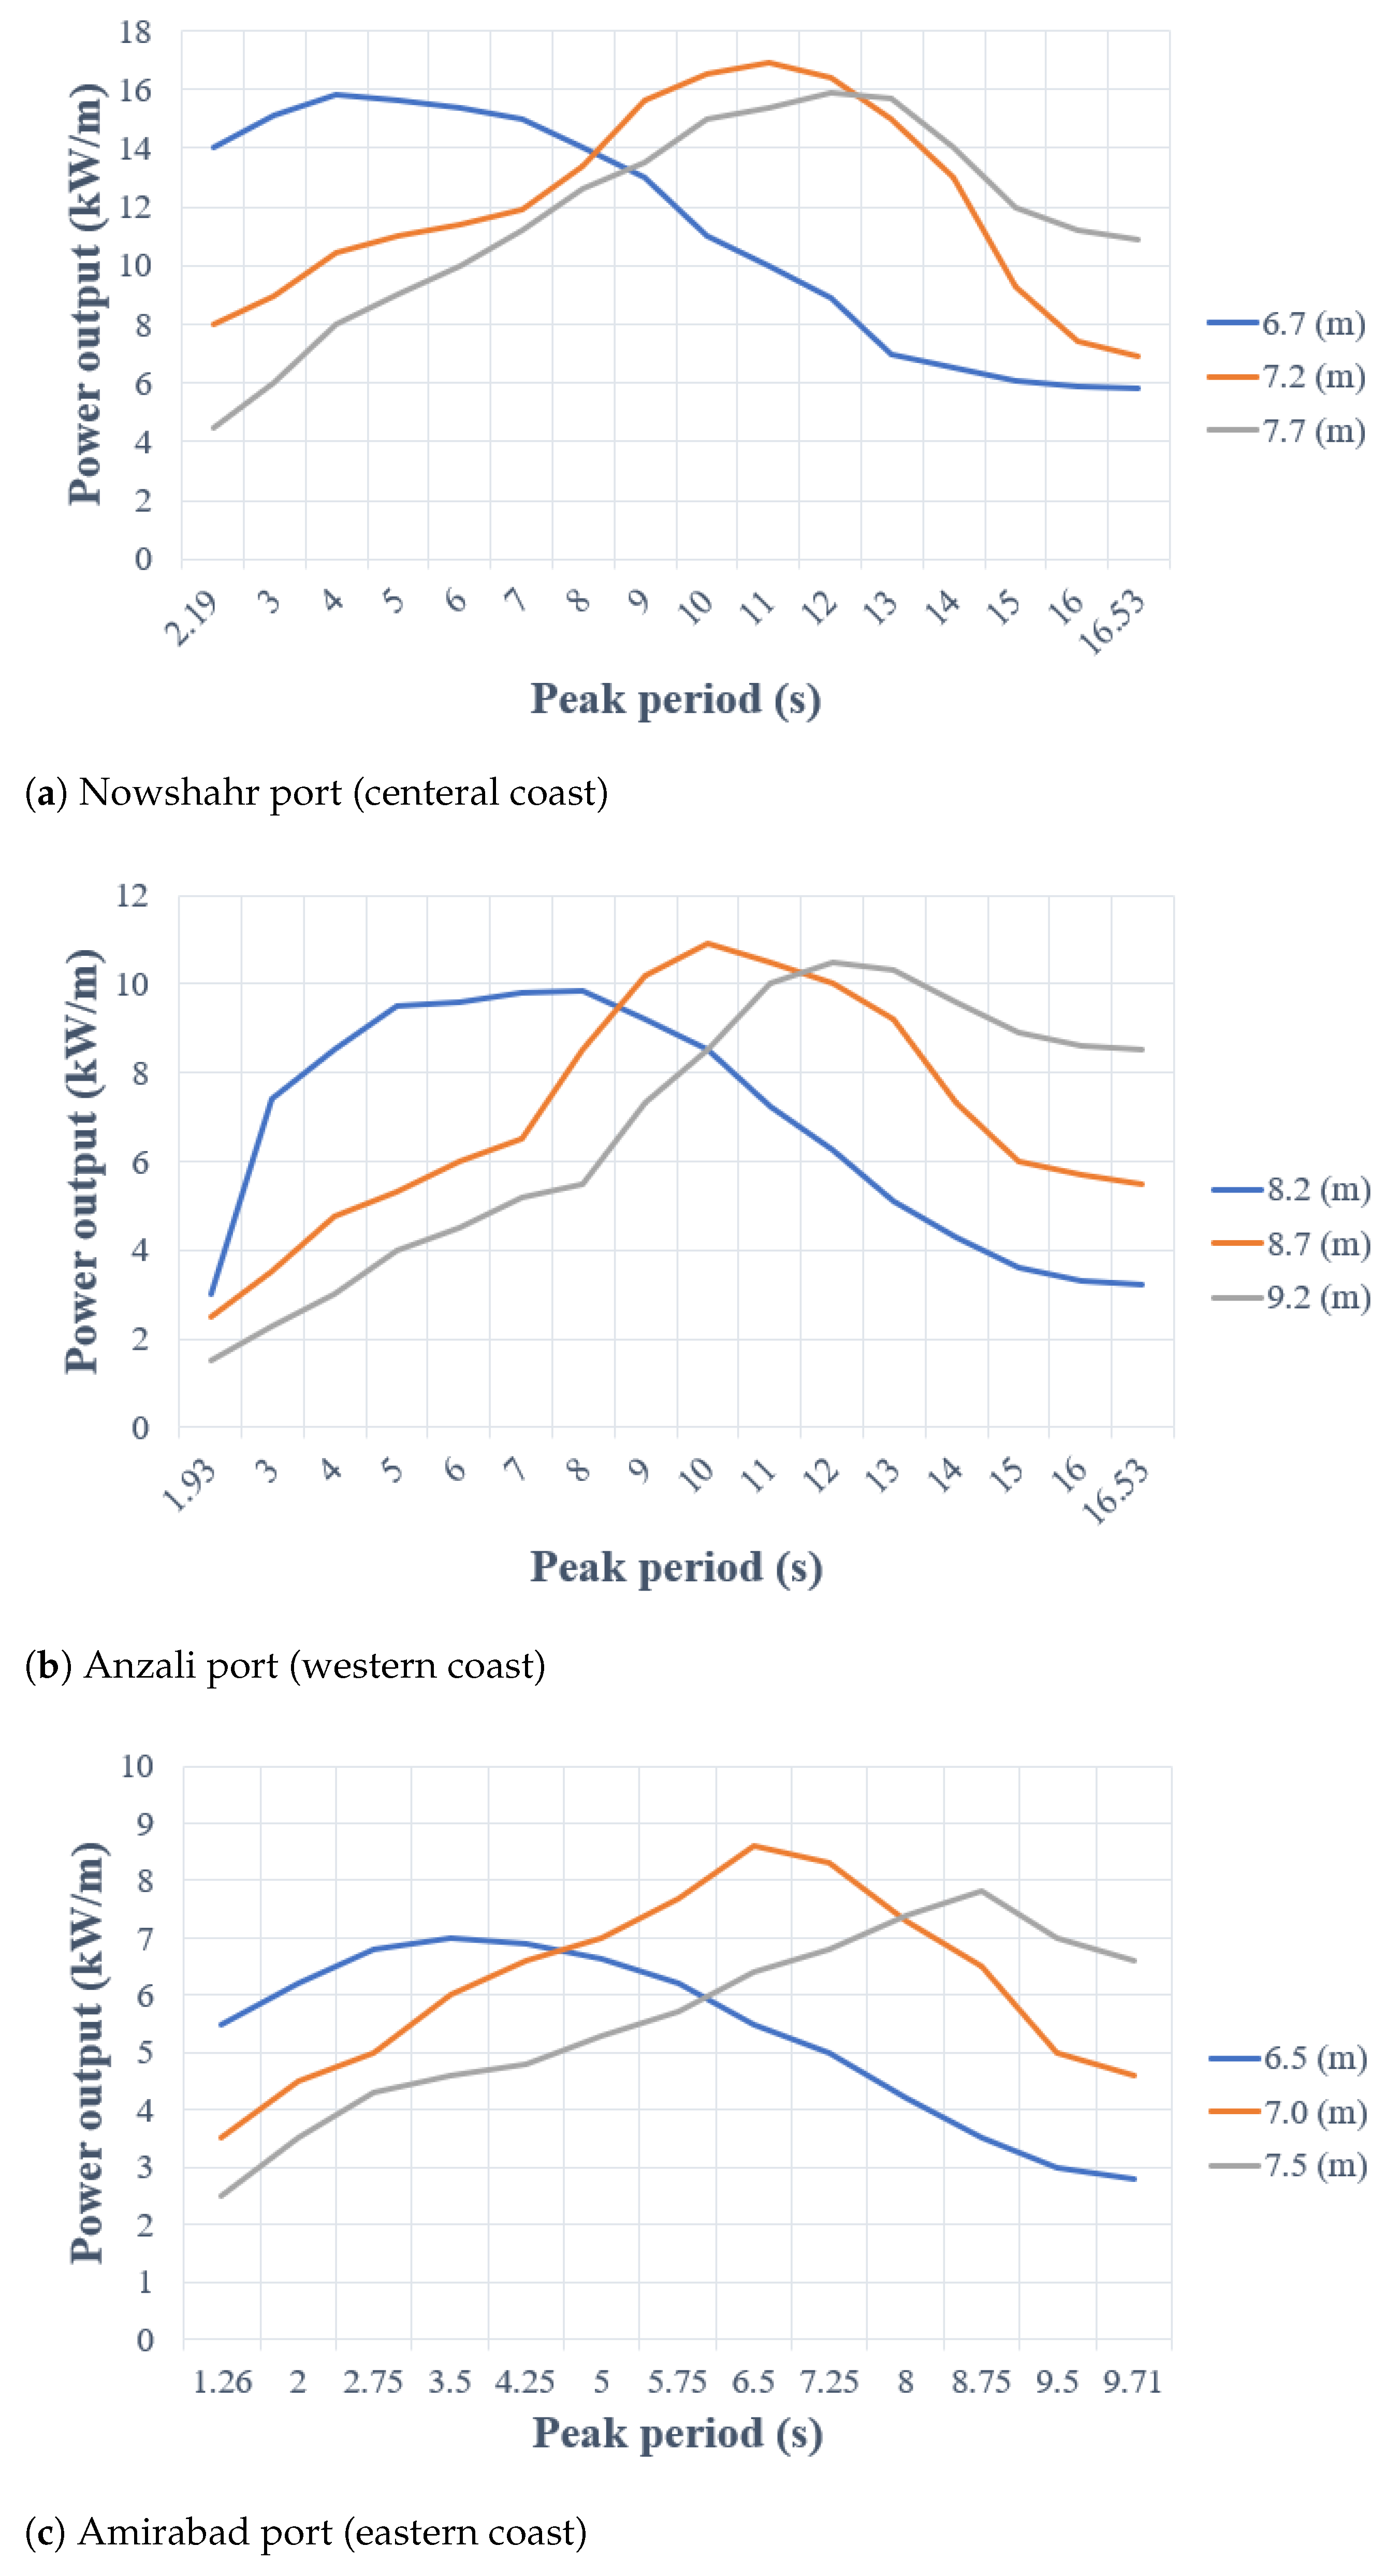
Figure 9. As a result, models are simulated at each site with three different heights, and the results are presented in
Figure 11. While the flap height rises, the rotational inertia rises by a power of three, whereas the restoring buoyancy rises by a power of two, increasing the system’s natural periods. Nonetheless, regardless of the flap height, the maximum power output is essentially the same [
68]. The results show that the heights of 7.2 (m), 8.7 (m), and 7.0 (m) in Nowshahr, Anzali, and Amirabad ports lead to the highest power outputs of the converter, and can be considered for further analysis during the next step.
3.3. Power Take-Off System
To add the converter’s power take-off system to the WEC-Sim software, the converter’s specifications, connector types, motion restriction, degrees of freedom, and PTO system should be provided to Simulink’s software module. There are four steps, as recommended by the software’s manual [
69], and the rotational oscillator’s motion is specified in the Simulink module for a linear spring-damper system: (i) Two rigid body blocks for identifying the flap and base of the oscillator; (ii) A global reference block; (iii) A fixed constrained block in every six degrees of freedom for the oscillator’s base; (iv) A rotational PTO block for the converter’s flap. Finally, after supplying the blocks’ connection and implying its interior details, the final Simulink model for oscillating surge WEC is completed.
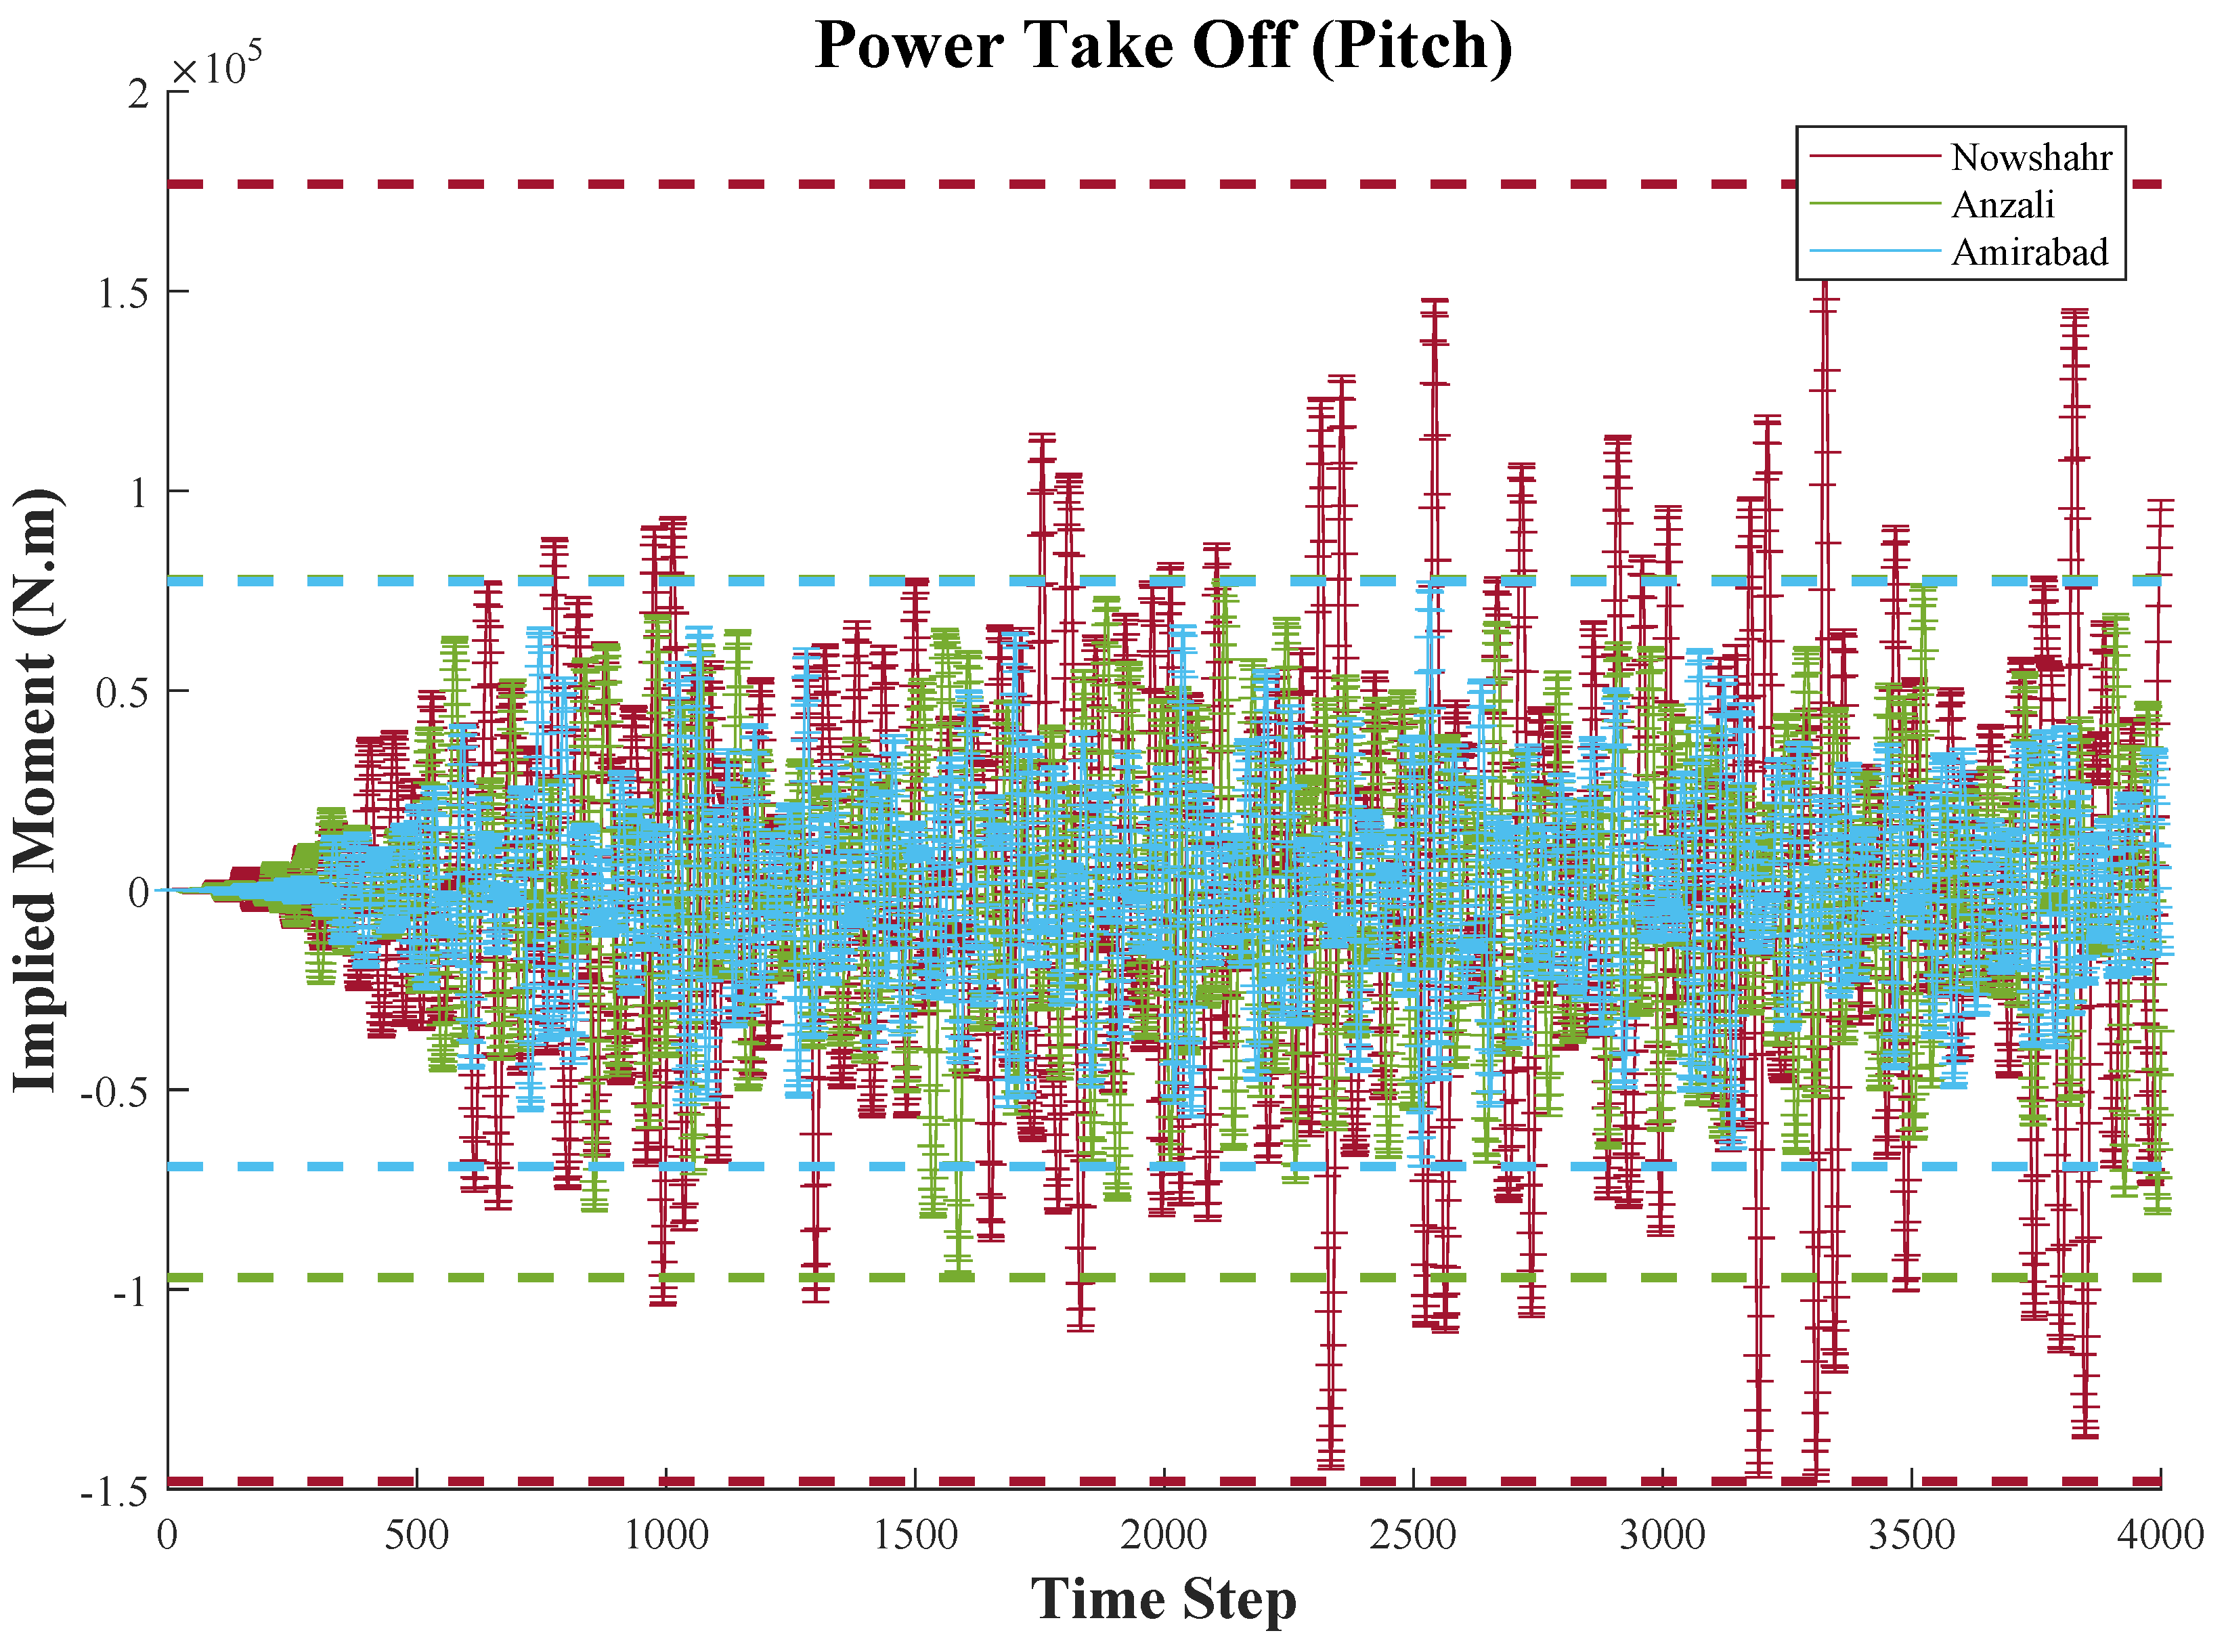
Initially, we assume the damping coefficient of the converter to be 12,000 [
53] in order to trace the implied PTO moment on the converter’s flap at each time step. Since the power take-off system is practically activated in an oscillating motion for each port, the software outputs are obtained, and the values are shown in
Figure 12.
As indicated by the software outputs, the moment applied to the energy converter in Nowshahr is greater than Anzali, and Anzali is greater than in Amirabad. As a result, based on the relationships described in the preceding chapter, it is reasonable to assume that this parameter directly affects the converter’s efficiency. Furthermore, according to the capture factor outputs in
Section 3.4, it can be expected that more power has been extracted from the Nowshahr port energy converter than the other two ports. The absorbed moment from the PTO system fluctuates between its minimum and maximum values in each zone, which for Nowshahr, Anzali, and Amirabad ports are 1.7 MN·m, 0.77 MN·m, and 0.78 MN·m, respectively.
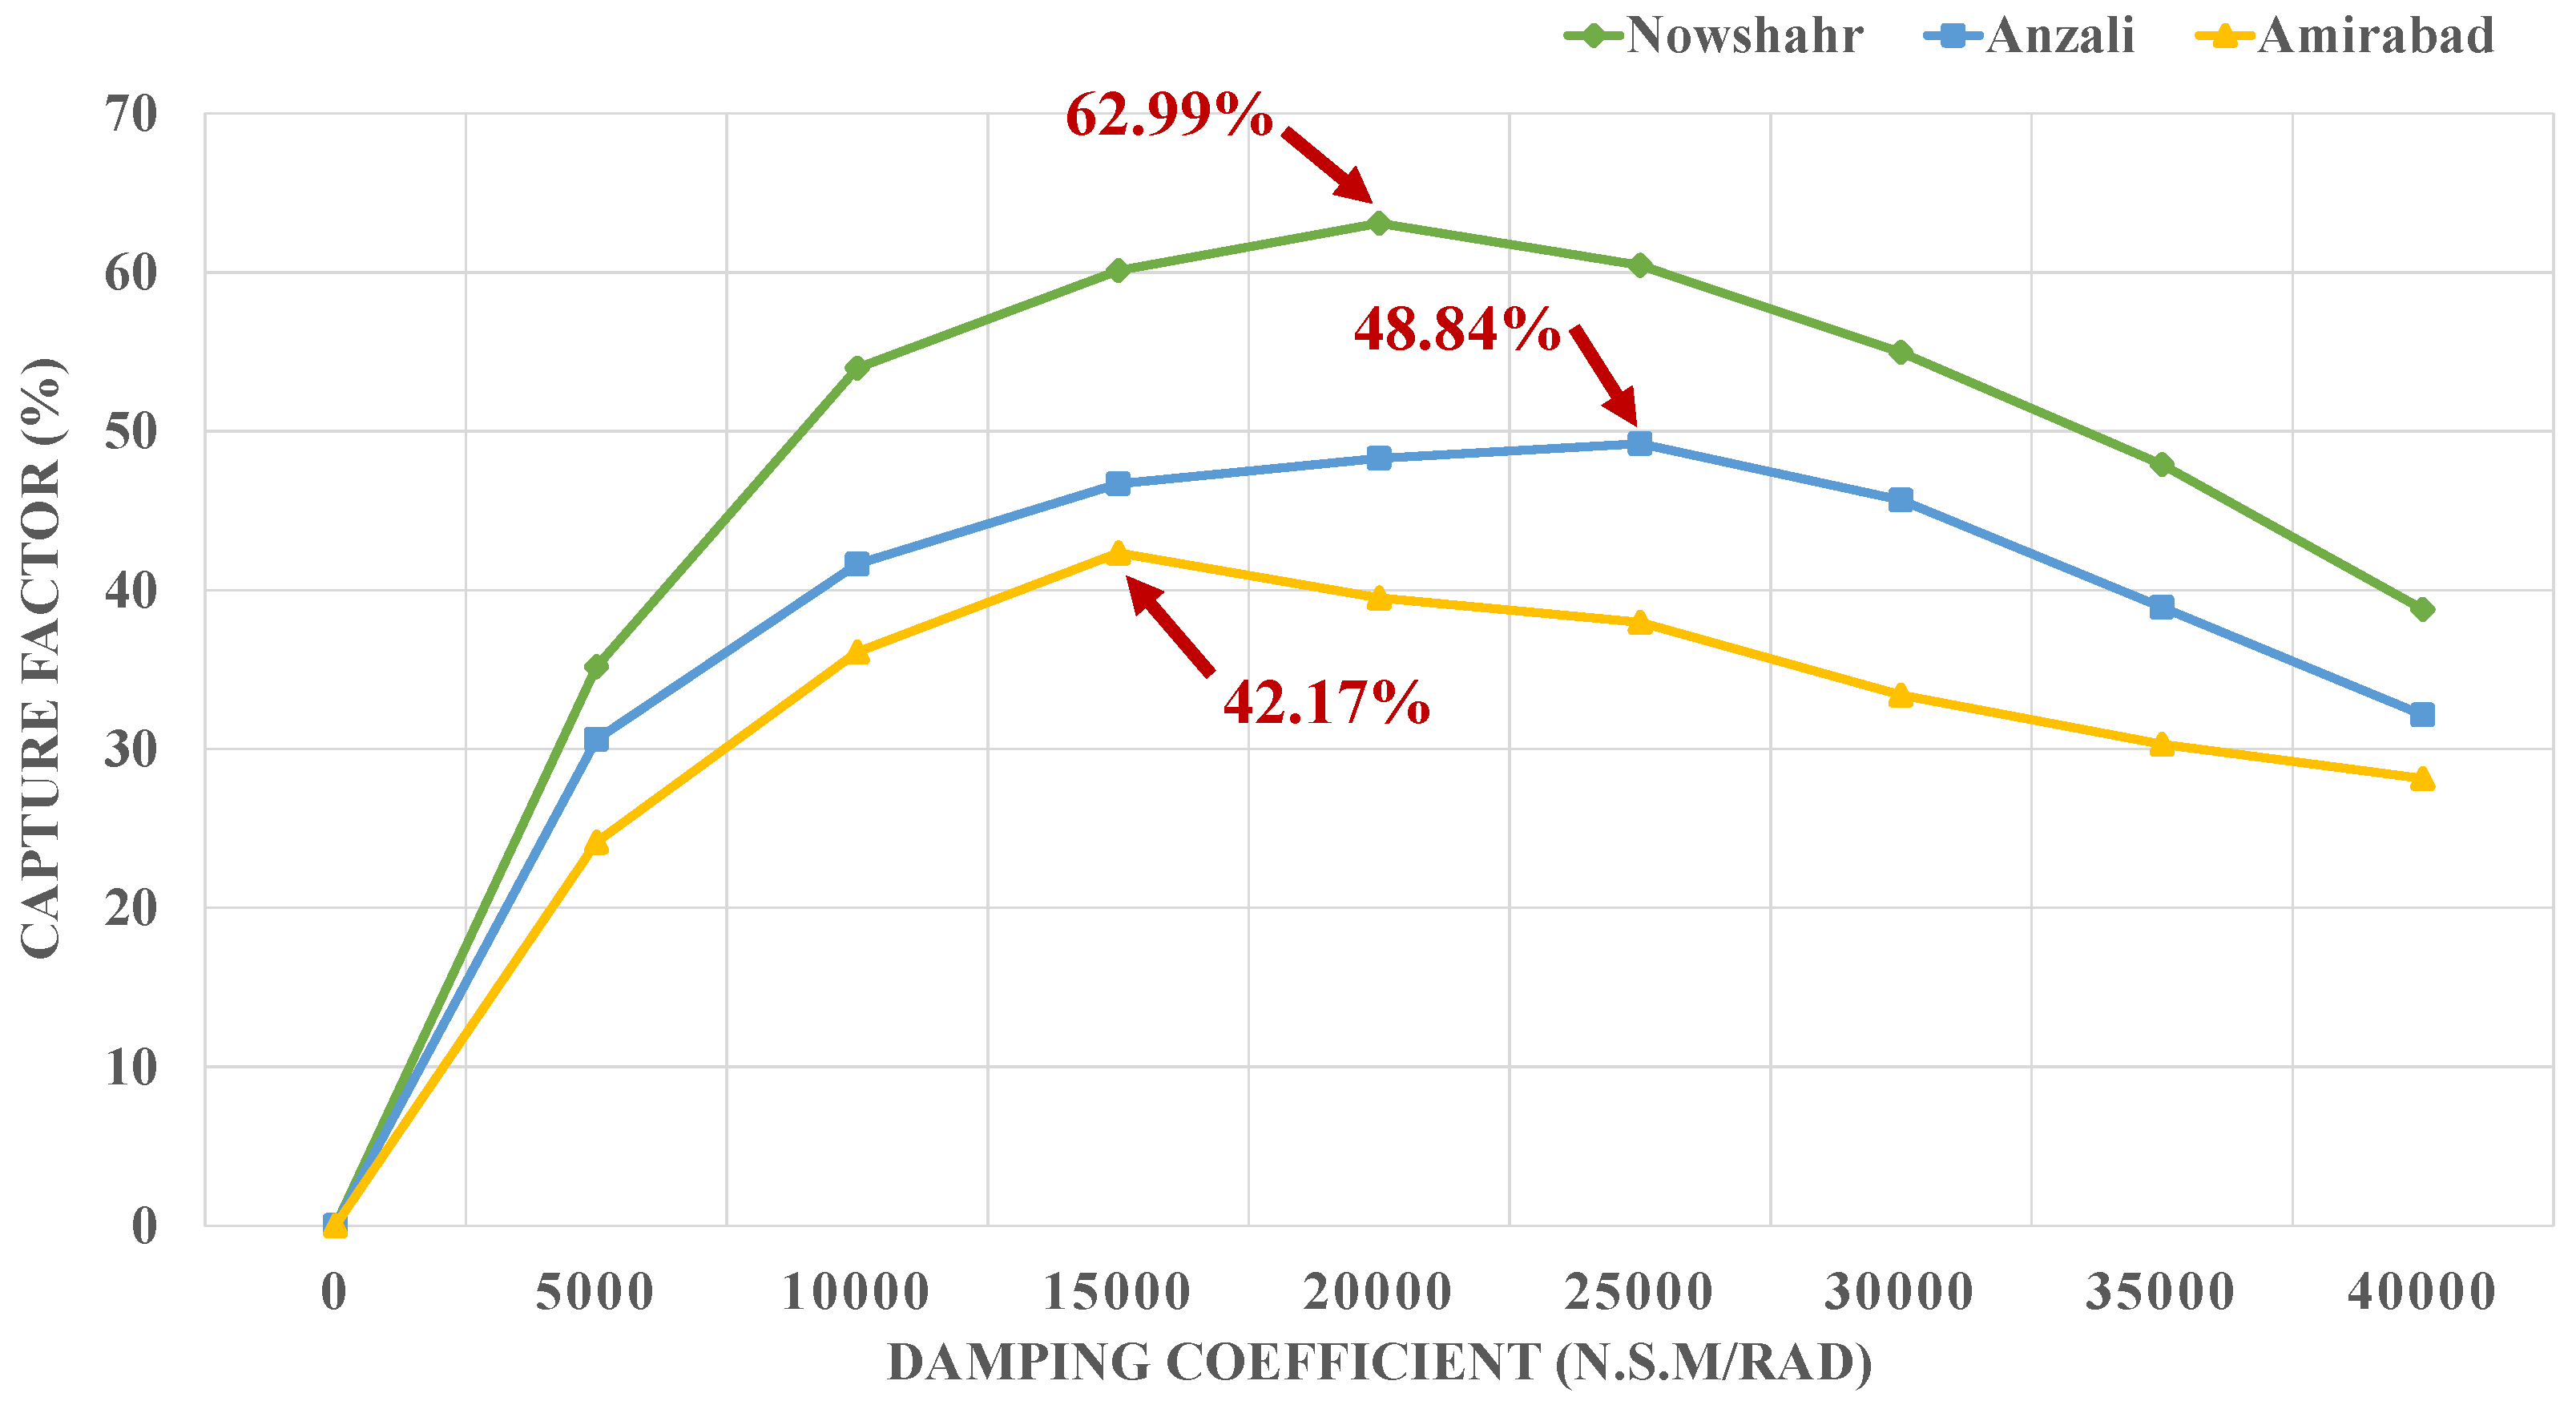
Secondly, the PTO damping coefficient is a crucial factor and be optimized in each sea state. Thus, at each location, we ran the models with eight different PTO damping coefficients and plotted the results in
Figure 13.
The figure depicts a quadratic relationship between the damping coefficient and the non-dimensional capture factor at each selected site. The highest capture factor accrues at = 20,000 at Nowshahr port, and = 25,000 and = 15,000 for Anzali and Amirabad ports, respectively. This result establishes the optimal damping coefficient value for each port based on the wave climate.
3.4. Flap Response
The total moment acting on the converter’s flap, which is equal to the sum of all the moments acting on the converter, is evaluated and compared in the converters designed for the three ports.
Figure 14 illustrates the total applied torque values of the converters.
As illustrated in
Figure 14, the moment applied to the converter plate in Anzali and Amirabad ports is more significant at some points than in the Nowshahr port. However, in a broader context, it is worth noting that simply increasing the moment applied to the converter’s flap does not increase energy extracted, and that higher wave implied moments have a greater effect on the WEC total output. The rotation of the converter flap must be considered in conjunction with other environmental conditions. The maximum values of the actuator moment affect the converter flap’s pressure center (when moving under pressure due to the impact of the wave crest) in Nowshahr, Anzali, and Amirabad ports will be 832 kN·m, 630 kN·m, and 621 kN·m, respectively, in each time step. Furthermore, the maximum values of the return moment affect the transducer plate’s pressure center (during the return movement under reduced pressure caused by the wave through impact) in Nowshahr, Anzali, and Amirabad ports, respectively, at 881 kN·m, 598 kN·m, and 588 kN·m, in each time step.
In order to investigate the flap displacement or rotation responses to implied forces in the Pitch and Surge degrees of freedom, it is necessary to keep in mind that the total run-time is 400 s and the ramp time is 100 s, and the time step is set to 0.1. The magnitude of the fluctuation is shown in
Figure 15, where displacement and rotation are expressed in meters and degrees, respectively.
Evidently, the oscillation is significantly greater in Nowshahr than at the other sites, as evidenced by the flap displacement and rotation angle. The maximum force of the flap in the Nowshahr port (during the collision of wave crest) is 5.24 m with a 31-degree maximum rotation. The measures for Anzali and Amirabad ports are 3.56, 3.28 m, and 19.48, 18.33 degrees, respectively. Furthermore, when the flap is retracted due to the wave trough, the maximum amount of the flap’s displacement is 5.92, 4.24, and 4.08 m. The maximum angle of rotation is 35.5, 24.06, and 22.9 degrees in Nowshahr, Anzali, and Amirabad, respectively. Finally, the flap’s rotational velocity is 0.025, 0.02, and 0.021 radiant per second in Nowshahr, Anzali, and Amirabad, respectively.
Finally, The exact values of the averaged capture factor in all three ports, the total waves’ power, and the converters’ power output in each of the ports are examined in
Table 3.
Comparing the capture factor values in the table reveals that the Nowshahr port has a higher value than the other two ports. As a result of comparing capture factor values and exploited power in the studied ports, it can be concluded that the Nowshahr port has the highest priority for installing a wave energy converter system. The feasibility of Anzali and Amirabad on the southern coasts of the Caspian Sea can then be ranked second and third behind the Nowshahr port on the central coasts.
In summary, the results above indicate that the Caspian Sea’s central-coastal zone has a greater amount of exploitable energy absorbed by the OSWEC geometry. Simultaneous investigation of converter design and hydrodynamic parameters, including environmental and geometrical parameters, can aid in achieving maximum system power output, which may result in significant progress in the future use of this type of energy in Iran’s marine industry.
4. Conclusions
In this study, the oscillator surge converter was chosen due to its ability to expand the development horizon, low installation and maintenance costs, converter mobility, and the converter industry’s popularity. Thus, the research locations on the Caspian Sea’s central, western, and southern coasts were carefully selected. Afterwards, their parameters were evaluated to implement the model to extract the maximum amount of potential energy. Following the literature review, Nowshahr, Anzali, and Amirabad were selected as locations for installing an oscillating surge wave energy converter (OSWEC). Next, the geometric design parameters of the converter were studied, and the converter’s flap length was determined to be between 18 and 23 m to extract the maximum energy from the incident waves. Furthermore, the designed converter’s flap height was determined to be between 7 and 8.7 m, based on algorithms from similar previous studies.
To reach a conclusion that considered all implied forces and moments, the wave excitation force, radiation damping force, added mass force, and power take-off force were studied. In terms of excitation force, the recorded data demonstrated the magnitude of encountered wave excitation forces in Nowshahr port compared to two other ports on the Caspian Sea’s southwest and southeast coasts. The most significant zone for the implied excitation force on the WEC’s flap varied between approximately +1.3 MN and −1.1 MN in surge degree of freedom. Regarding the radiation damping force, it can be asserted that the radiation force generated by the wave impact has a relatively direct effect on the converter’s performance. In terms of added mass force, its value was greater in Amirabad port than in Anzali port. This achievement demonstrates that the presence of added mass force (or its associated moment) on the converter’s flap is not proportional to the converter’s capture factor. Therefore, this parameter and other geometric parameters should be considered when evaluating the converter’s performance. Finally, the results indicate that the moment applied to the energy converter power take-off in Nowshahr is more significant than that in Anzali and that the moment applied to the energy converter power take-off in Anzali is greater than that in Amirabad. As a result of the preceding governing equations, it is reasonable to assume that this parameter directly affects the converter’s efficiency.
During the final step, a comparison of the capture factors of converters indicated a high potential for exploitable wave energy in the Nowshahr port. This wave energy can be converted at a rate of approximately , while the efficiencies of other converters in the Anzali and Amirabad ports were nearly and , respectively. In light of the wave rise associated with the significant wave height in this area, a reasonable justification can be made. The majority of waves with the most significant heights in this port traveled in the dominant wave direction. However, in the other ports studied, waves of significant height were distributed in all directions. In summary, we can conclude that the directional characteristics of the significant wave height values on the Nowshahr caused the converter to absorb more power in aggregate. Furthermore, the sensitivity analysis of the effect of flap heights on total power output identifies the optimal value for this variable by testing it during the peak period of waves at the installation site. Additionally, we ran the models with eight different PTO damping coefficients over the capture factor for each site. The results indicate the optimal damping coefficient value for each port based on the wave climate. For future work based on the Caspian Sea wave scenario, an additional analysis of the correlation between PTO coefficient (preferably hydraulic PTO system) and power output is required. Moreover, viscous drag forces will be considered to achieve a more accurate dynamic response of the WEC.


 ,
, 


