1. Introduction
The activities of the energy sector, its impact on climate change, as well as its concern for energy security, are the main challenges facing the energy industry. The Polish energy sector is currently at breaking point. We are already witnessing numerous changes taking place in the Polish and global energy sector, which is increasingly sensitive to climate change, for example [
1,
2]. The need to reduce the environmental impact of traditional fossil fuels, as well as the depletion of these resources and the sharp rise in fossil fuel prices, is the reason for the growing use of renewable energy sources, including biomass [
3]. This fact is also the reason why people are looking for ways to invest in the energy sector. At the same time, the total world energy consumption has maintained a longstanding growing trend with constant adjustments to the energy structure [
4]. To meet both social and European Union (EU) expectations, the energy sector in Poland requires a lot of investment. Around the world, energy has an environmental impact, and it is, therefore, necessary to modernize it consistently and to exchange knowledge at the same time to raise awareness of the use of human-friendly and environmentally friendly solutions [
5]. The development of EU-funded renewable energy sources for the period 2014–2020 will be based on the indication of priority sources of energy generation, determined by territorial and climatic conditions, economic demand, social needs, the preservation of energy security, economic benefits and the possibility of joining national energy networks [
6]. In this context, the issue of an effective energy management strategy, which aims, inter alia, at increasing energy efficiency, is also important [
7].
Over the last few years, the Polish power industry has experienced ground-breaking changes in terms of regulation, structure, organization and ownership issues. These changes were driving the need to bring national regulations into line with European Union rules and to create entities strong enough to finance their own investment needs [
8,
9,
10]. The current, more consolidated structure of the electro-energy sector significantly facilitates the acquisition of financing and access to the capital market for the largest energy companies [
11]. Nevertheless, the scale of this funding remains a major challenge. Moreover, the impact of business savings on economic growth is the starting point for analysing long-term changes in production levels [
12,
13]. Based on the function of production, it can be concluded that the increase in production may result either from the accumulation of factors of production or from an improvement in their productivity resulting from technical progress. Growth theories explain what factors determine, often at the same time, the increase in the resources of factors of production, especially physical and human capital, and the creation and adaptation of new technologies. In this context, business savings should be one of the sources of financing for investments in in-kind capital. Bearing in mind that domestic investments are financed both by national savings of the private and public sectors and by savings coming from abroad, attention should be paid to the crucial importance of business savings in the Polish economy [
14].
Harnessing the potential of industrial companies to improve energy efficiency also means faster development of innovative technological solutions and, on an economic scale, boosting economic growth [
15,
16]. Improving energy efficiency in the context of generating savings in energy companies is also important [
17]. Support for energy efficiency in Poland is provided primarily by the National Fund for Environmental Protection and Water Management, which supports investment projects. They aim to improve energy efficiency. They usually include energy audits, implementation of energy management systems, rationalization of electricity and gas consumption, modernization of industrial processes [
18]. Such actions can certainly be a positive factor in generating additional gross savings.
In this context, we are taking up the issue of business savings and investments in the Polish energy sector. The main research problem is the impact of gross savings of changes in the level of gross investment in this sector. In our research, we use the theory of the economic dynamism of M. Kalecki. According to it, private investments are determined by the change in net investment and the change in profit in the previous period. To achieve our goal, we transformed the original equation. This allowed us to interpret changes in gross investment over a given period as a function of gross savings and changes in profits in the corporate sector in earlier periods. In our research, we also wondered whether this formula sufficiently strongly adapts to the reality of the Polish energy sector. To this end, we have made detailed calculations of linear regression and correlation coefficients. We used available Statistics Poland data for calculations. As time barriers, we have set ourselves a period from 1Q 2005 to 2Q 2020. Our research has allowed us to justify the hypothesis that gross investment in the Polish energy sector is determined by the level of gross savings of companies.
2. Materials and Methods
Research of factors determining investments in the Polish energy sector is carried out based on economic dynamics theory. In this context, it must be said that new investment decisions are taken when, within a given period, there is such a change in the economic situation that makes them reasonable. The starting point of the method we have adopted in these studies is an Equation (1). It determines the level of net investment. According to K. Łaski, that equation makes it possible to interpret changes in net investment over a given period as a function of profit and profit changes in the earlier period [
19]. It is the result of M. Kalecki’s original analyses and considerations presented in the “Theory of Economic Dynamism” [
20].
The values and determine the net investment level over time and respectively. The symbol means a delay close to 1. In empirical studies, this delay means the time between making an investment decision and the start of this investment . This issue will be discussed further below. Also, the value represents the change in investment over time to the investment price index.
This equation makes a certain assumption. It consists in the fact that in the stationary state the gross investments are equal to the depreciation values
. The depreciation value is determined by the equation
. However, the authors in their research depart from these assumptions. This makes Equation (1) take the following form:
Thus, we get an equation that determines the gross investment value over time
. This equation, too, is marked by certain methodological assumptions. The original considerations assume that gross investments are equal to gross savings
. This assumes that the economy is a closed economy without state participation. Also, it was assumed that the change in gross savings is equal to the change in profits in the corporate sector
. This assumption is due to the omission of household savings, which are completely consumed. These assumptions are also rejected by the authors in their research. Therefore, Equation (2) takes the following form:
This form of equation determines the gross investment over the period . The Equation (3) quoted above paraphrased K. Łaski’s statement can be described as follows. Formula (3) allows the interpretation of gross investment changes over a given period as a function of gross savings and changes in profits in the corporate sector. Thus, Equation (3) becomes the basis for research conducted by authors within the Polish energy sector.
The above equation reveals the most important factors of gross investment in the period
according to the Model M. Kalecki. Here they will be briefly discussed. However, we will discuss the issue of time delay earlier. We have written earlier that in empirical studies, a delay means the time between making an investment decision
and starting this investment
. This assertion clearly emphasizes the importance of time as one of the determining factors for economic dynamism. It mainly concerns the delay in the implementation of investments in the decision-making process [
21,
22]. For these considerations, it is important to distinguish between investment decisions and investments themselves. Thus, private investments over time
are carried out as a result of investment decisions at the time of
.
. Also, investment decisions, as a result of the Equation (3), are made based on gross savings obtained during this time
as well as changes in profits at the same time
. It follows that future gross private investment depends on previous decisions. These, in turn, depend on the undertaking at the time of
, which depends on even earlier actions during the
.
However, let us go back to discussing the main factors of gross investment at time
. First, let us look at the value of
. This expression contains two-component values. The numerator shows the change in gross profit for the period
. It is treated as one of the determinants of investment decisions [
23,
24]. In a situation of an increase in the level of gross profits per unit of time, the analysed future investments may prove attractive. This fact may lead to the expansion of investment plans in a given enterprise. Profitability is one of the most important elements of investment for entrepreneurs in making investment decisions [
25,
26]. Therefore, the expected returns on investment are compared with the value of new physical capital. In this context, M. Kalecki considers the change in gross profit to the price index of investment goods
. This makes future investment decisions an increasing function of the value
.
In this context, it is worth mentioning one more factor that determines investments. In the classical approach to the theory of economic dynamics, the capital change factor
appears. It is originally defined as the net change in capital endowment per unit of time. Its influence on decisions is interpreted as follows. An increase in fixed capital with constant profits means a decrease in the rate of profit [
27]. Moreover, an increase in the accumulation of production capacities (e.g., production equipment) limits the investment decisions of entrepreneurs. After M. Kalecki, it should be said that the value of the production equipment resource, to the appropriate
price index, weakens the tendency of entrepreneurs to make decisions about starting new investments. Thus, investment decisions are a decreasing function of
. It is not difficult to notice that in formula (3) there is no value discussed here. We assume here that the change in fixed capital relative to the corresponding price index is equal to the difference between gross investment and depreciation
. This can be written in the equation
. Thanks to this assumption, according to the reasoning of K. Łaski, we obtain the formula (3) presented above. In this context, we can say that the change in gross profit and the change in the stock of fixed capital together determine the change in the rate of profit. It is defined here as the ratio of gross profit to fixed capital [
19].
The second factor determining decisions on future investments is gross savings of enterprises . They are directly related to internal capital accumulation. Thus, these savings are the sum of the amortization and undistributed profits of entrepreneurs. In this way, the authors calculated the value of gross savings based on the available data from the energy sector in Poland. Moreover, we assume that the increase in the level of savings prompts entrepreneurs to accumulate them in investments. It is also worth noting that the increase in gross savings increases the possibility of obtaining external funds that can be used to finance future investments of enterprises. This means the increase in the level of gross savings expands the boundaries of entrepreneurs’ investment plans. Therefore, it can be said that investment decisions and future investments themselves are a growing function of the gross savings level .
Formula (3) also includes the coefficients , and . In our research, we assume that their values are given, and we do not analyse them in our research. Nevertheless, it is worth discussing them briefly. First, let us look at the term . It stands by the symbol of gross savings in time . The coefficient defines the propensity of entrepreneurs to accumulate gross savings in future private investments. Gross savings earmarked for investments are generally lower than their total value. This fact causes the value to be lower than 1. The increase in the value of this coefficient shows how much investments will increase due to the increase in gross savings. On the other hand, the denominator value shows the negative impact of the increase in fixed capital resources on investment decisions. It is related to the process of reinvestment in fixed capital. Thus, the coefficient reflects the negative impact of the growing stock of fixed capital on investment decisions. On this basis, it is assumed that the entire term determines how much private investment will increase as a result of gross savings growth in the enterprise.
The second factor that can be found on the right side of Equation (3) is . It is determined by the equation . The notation in the denominator should be interpreted the same as in the previous term of the equation. However, the coefficient appears in the numerator. It indicates the effect of the rate of change in earnings on your investment decisions. Thus, it is the ratio of entrepreneurs’ propensity to accumulate gross profits in future investments.
The last factor on the right side of Equation (3) is . It is determined by the equation . In the theory of economic dynamics, the coefficient is a constant value in the short term. In the long term, it is subject to changes due to technological progress. Thus, in the long term, the value of this ratio makes entrepreneurs more inclined to make investment decisions. In the short term, is assumed. Investment decisions determined by the d coefficient are additionally conditioned by the level of depreciation and the situation of fixed capital resources.
In light of the method presented here, which is based mainly on the theory of economic dynamics, we adopt the following mechanism of shaping the gross investment value in the energy sector in Poland. Gross investment at time is a positive function of gross savings and changes in gross profits to the price index . Since investments in the Polish energy sector are mainly carried out by contractors from the construction and engineering industries, in our research we adopted the price index for construction and assembly production. Moreover, we adopted the following variables for the calculations. These are gross investment outlays and gross profit. We calculated the remaining values according to the adopted method. All changes in the analysed values were calculated as relative changes to the corresponding quarter of the previous year (QoQ_PY). In our research, we adopted the time perspective from 2005 to 2020. Due to the availability of data during the study, the last period analysed is the 2nd quarter of 2020. We have adopted a long time perspective. This is since we wanted to verify the validity of the base formula (formula 3) during several business cycles.
3. Results
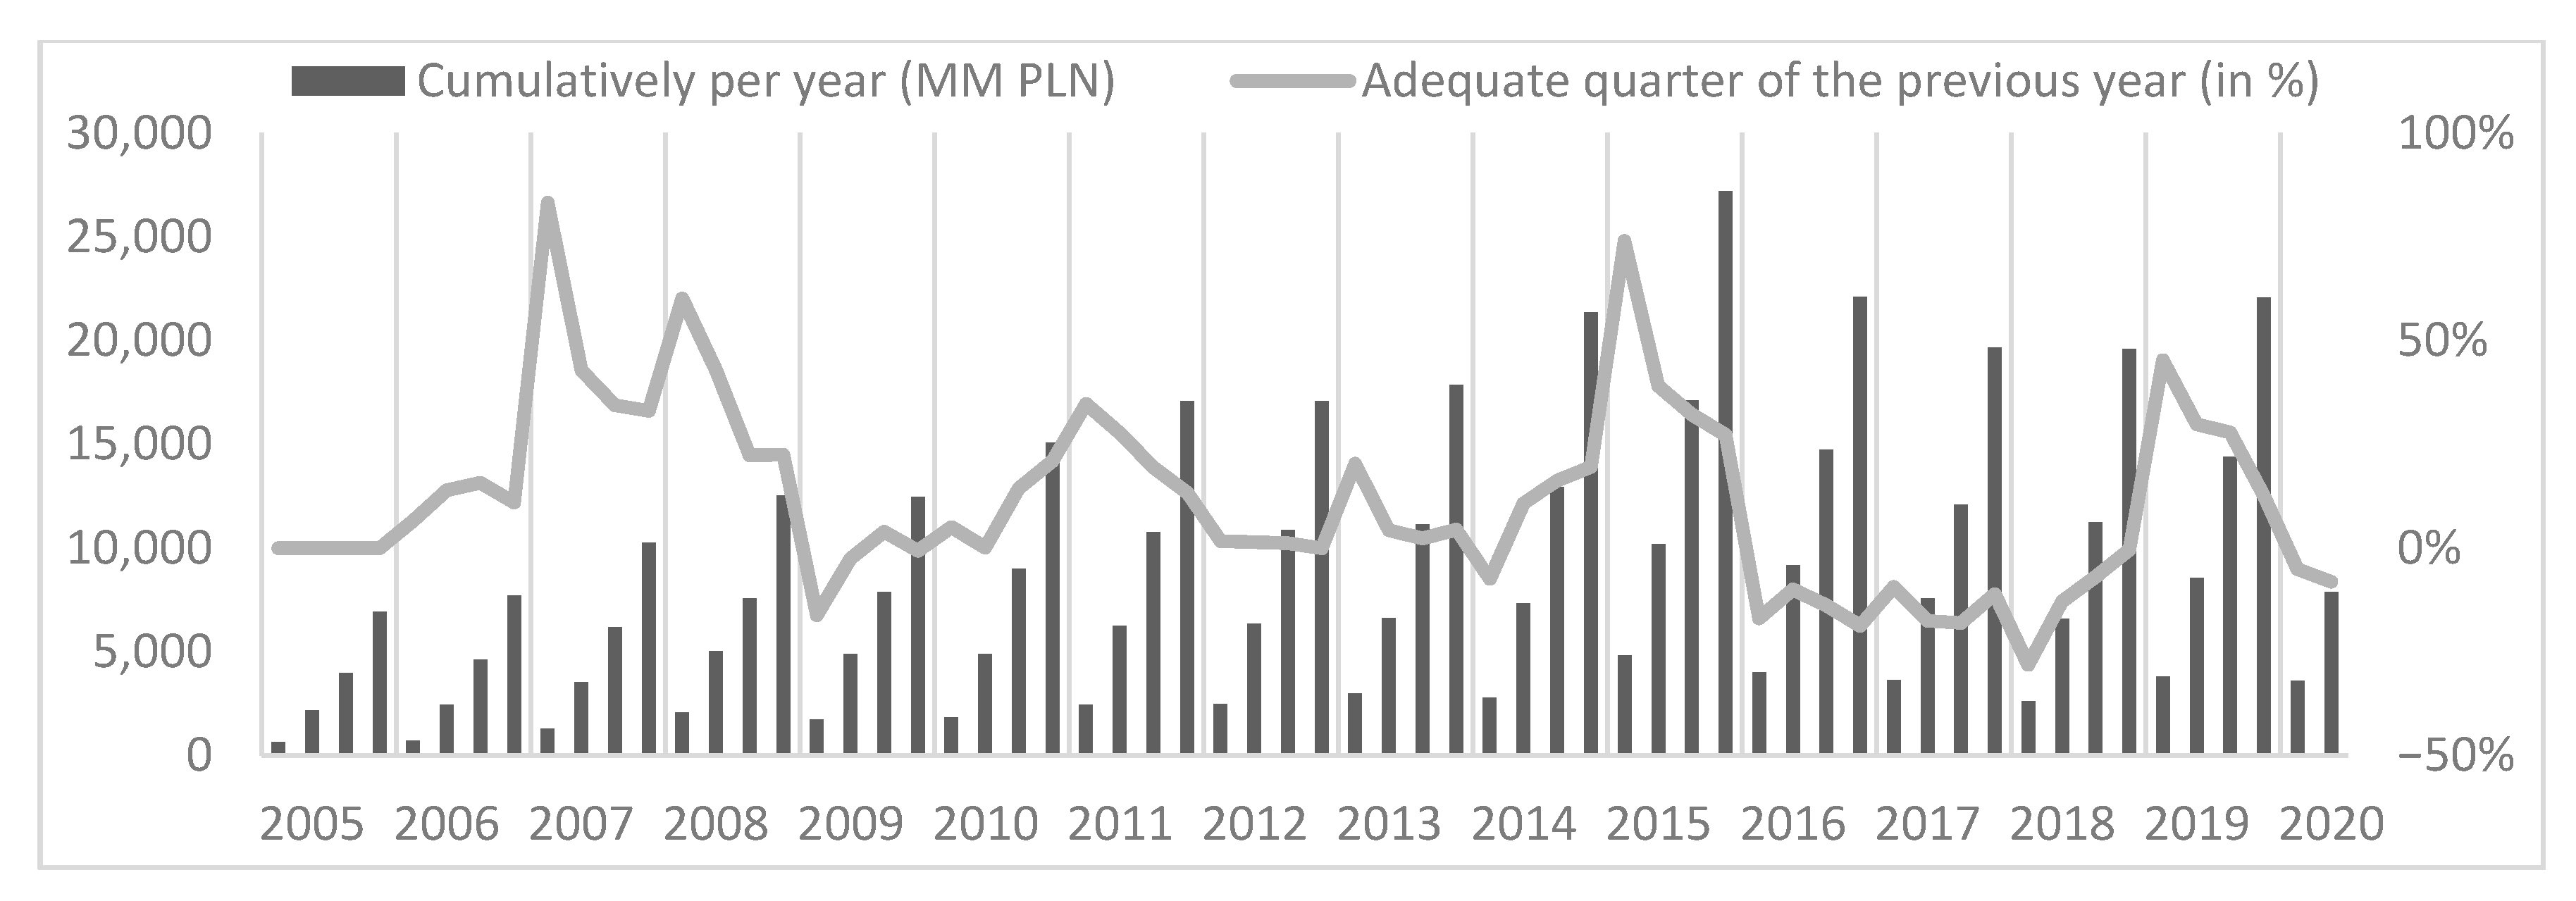
In this part of the paper, we present the results of our research. The analysed data come from Statistics Poland and are presented quarterly. First, we present data that reveal the level of investment outlays in the Polish energy sector (in PLN million) and their relative change as compared to the corresponding quarter of the previous year (in%) (see
Figure 1). For a better overview of the gross investment situation in the Polish energy sector, we also present the dynamics of their changes. Here, we present the data for section D against the background of the entire Polish economy. The quarterly dynamics of changes in investment outlays presented in
Figure 2 was calculated as a relative change to the corresponding quarter of the previous year.
On the next chart, we present the main factors of gross investment in enterprises. (see
Figure 3) According to the method described above, these are gross profit, gross savings of enterprises and the price index of construction and assembly production in Poland. Data for the last factor are available from the 1st quarter of 2006. Also, in this case, it is worth presenting the dynamics of changes in these data (see
Figure 4). Concerning gross profit and gross savings of enterprises, we used the relative change in quarterly values compared to the corresponding quarter of the previous year. We present the price index here as primary values.
At this point, we come to an attempt to answer the main research question. Is the level of investment in the Polish energy sector a growing function of gross savings? Thus, we wonder whether formula (3), which is derived from the theory of economic dynamics, will be positively verified in the Polish energy sector. For this purpose, we use correlation analysis and regression analysis. However, it remains to consider the issue of delay . Earlier we wrote that the investment value at time depends on the occurrence of appropriate factors at time . The time t is earlier than the time . The difference between them is the delay which results from the investment decision process. As investments in the energy sector are generally complex investments, we adopted two lagging limits in our research. Therefore, we introduce the delay and . In the regression analyses performed, we assumed that the dependent variable is the value of gross private investment/capital expenditure. The independent variables are savings of enterprises and the ratio of changes in gross profits to the price index . In this way, we analyse two variants of linear regression, which is to justify the hypothesis.
The first variant assumes a delay in the implementation of the investment
. For the analysis, we have adopted data covering the period for the dependent variable Q1 2007–2Q 2020 and the independent variable Q1 2006–2Q 2019, respectively. In the analysed period, the regression statistics are as follows. The Multiple R Correlation Factor is 0.9265, the R-Square Factor is 0.8584 and the Adjusted R-Square is 0.8528. These results were calculated for 54 observations (quarters) and the standard error was 2438.6531. On this basis, it can be said that the model obtained is characterized by a very good fit. We also performed detailed calculations of linear regression and residual terms.
Table 1 presents the detailed characteristics of the linear regression for variant 1.
Based on the calculations, we also determined the fit level and residual terms for two independent variables. We presented it graphically. The results for the first independent variable are presented in
Figure 5. On this basis, it can be said that the adjustment of the level of gross investment to corporate savings is very strong. At the same time, we can say that the level of investment is very much dependent on the level of gross savings. We also remember that we are analysing this relationship here with the 4Q lag. This is also confirmed by the analysis of the correlation between these values (see
Figure 6). We can see the R-Square index is 0.8062 and the Pearson index is 0.9249. We also analysed in detail the impact of the ratio of change in gross profit to the price index of construction and assembly production. It is the second independent variable that determines the gross investment value. Also, in this case, we are assuming the delay
. Based on the available ones, we have determined the residual plot and line fit plot (see
Figure 7). The situation here is different than for the first independent variable. The analysis of the presented charts allows us to conclude that the rate of change in gross profit to the price index is not adjusted to our model. Thus, its impact on the level of gross investment in the Polish energy sector is relatively small. This is confirmed by the analysis of the correlation of these variables. (see
Figure 8) In this case, the R-Square ratio is 0.0071 and the Pearson correlation coefficient is −0.0845.
Based on the calculations, we have determined the linear regression equation for the delay
. Based on Equation (3) it takes the form:
The calculation results presented above, especially those in
Figure 5, allow us to state that this linear regression model has a very strong fit with reality. It turned out that gross private investment (the dependent variable) is very strongly determined by the value of gross savings. The
coefficient is lower than 1, which confirmed the assumptions of the theory of economic dynamics. Moreover, this ratio tells us how much the level of gross investment will change in the situation of changes in the value of the gross savings of enterprises. Considering that this coefficient for a capitalist economy should be between 0 and 1, we see a strong positive correlation here again.
We also calculated the linear regression and the correlation coefficients for variant 2. In this case, we assumed the delay
. This means that for the dependent variable we assumed the period 1Q 2008–2Q 2020 and for the independent variables 1Q 2006–2Q 2018. It turned out that the results for this delay are very consistent with the results of variant 1. The regression statistics for variant 2 looks as follows. The Multiple R correlation coefficients is 0.9019, the R-Square coefficient is 0.8134 and the Adjusted R-Square is 0.8055. Here, the results were calculated for 50 observations (quarters). Standard error reached 2831.1329. Detailed data of linear regression calculations are presented in
Table 2.
The linear regression characteristics for variant 2 also suggest that this model has a very strong fit with reality. Nevertheless, this match is slightly smaller than in the previous variant.
Based on these calculations, we have also derived the linear regression equation. It took the form of:
Also, in this case, the coefficient
is smaller than 1. It is also slightly smaller than the value from variant 1. Below we present only the model fit charts for individual independent variables. (see
Figure 9) These results also confirm a very strong convergence with the results for option 1. Still, the gross investment of enterprises is very strongly dependent on the level of gross savings. The second independent variable is again characterized by a very weak influence on the dependent variable. The justification for these results can also be found in the analysis of the correlation between gross investments with a delay of
with each of the independent variables. These results are presented in Chart 10 with each of the independent variables. These results are presented in
Figure 10. Again, we can see the already known relationship. The dependence of the level of gross investment on gross savings of enterprises can be described by the R-Square coefficient of 0.8062 and the Pearson correlation coefficient of 0.8979. In turn, the correlation between gross investment and the ratio of changes in gross profits to the price index is characterized by an R-Square factor of 0.0146 and a Pearson’s of 0.0786. There is a slight difference between the corresponding results for variant 1. Comparing the calculations for two variants, one conclusion can be drawn. The model fit for gross investments in the Polish energy sector is stronger assuming a delay of
. However, this fact does not depreciate the delay
. Calculations for each variant confirmed the theoretical assumptions of the model, which is based mainly on the theory of economic dynamics by M. Kalecki.
4. Discussion
The research problem we set ourselves in this research is the impact of gross savings on changes in the level of gross investments in the Polish energy sector. The research method adopted meant that we had to prove that the model of the economic dynamic’s theory fit into the Polish economic reality. It turned out that the M. Kalecki equation defining the level of gross private investment in a specific period was confirmed in the analysed sector. This fact made it possible to analyse the influence of independent variables on the gross investment value. These variables are the level of gross savings and the ratio of change in gross profit to the price index. In our research, we decided to analyse two variants. We distinguished them according to the delay time between the investment decision and the investment itself. In this context, we assumed a delay of 4 and 8 quarters.
Calculations on the available statistical data allowed us to determine the strength of the impact of individual independent variables on the level of gross investment in the energy sector in Poland. It turned out that the developed linear regression model very strongly reflects the reality of this sector regardless of the analysed variant. Although the variant with a delay of 4 quarters turned out to be slightly more suited. Thus, we could conclude that the calculated estimated gross investment values are consistent with those we obtained from the statistical data of Statistics Poland. However, much more important findings are based on a detailed analysis of calculated linear regression. We analysed two independent variables separately. It turned out that the rate of change in gross profit practically does not correlate with changes in gross investment in the energy sector in Poland. We obtained such results for each of the analysed variants. We obtained completely different results for the second independent variable. It turned out that the level of gross savings strongly determines the value of the gross investment in this sector. This situation is repeated in each of the variants. Confirmation of this fact can be found both in the linear function itself and in the correlation analysis. It can be said that these dependencies should become the main determinants of managerial decisions in this sector. Therefore, these observations become the authors’ main contribution to further research work on investment mechanisms in the energy sector. It has been proven that it is not profits, but investments that drive private investment, which ultimately leads to the dynamic development of the sector and the entire economy.
The research results obtained have some limitations. We assumed a priori that the coefficients at the independent variables and the intercept are data quantities. This assumption results from the main goal of our research. This issue is addressed in the methods and materials section. However, it does not change the fact that the goal of our research has been achieved. Thus, it can be said that the hypothesis was confirmed. Therefore, we can say that gross investments in the Polish energy sector are very strongly determined by the level of gross savings of enterprises.
In the results of our research, you can find issues that can be discussed. One of them can be presented as a question. Why are gross savings more important to investment decisions than changes in the profit rate in the Polish energy sector? The idea naturally arises to verify these results in other sectors of the economy or in the energy sector of other countries. It seems, however, that the reasons for such results should be found in the very construction of the rate of change in the gross profit rate per unit time. It is in some way dependent on the one hand, on the change in gross profit, on the other hand it is influenced by changes in the stock of fixed capital. The second value, however, is directly related to the amortization of fixed capital. According to the theory of economic dynamics, the increase in the value of capital endowment negatively affects investment decisions. At the same time, an increase in this capital may increase the value of depreciation. After all, it is defined as a decrease in the initial value of fixed assets. This, in turn, causes the level of savings, which is primarily determined by the gross profit value, to be increased by the depreciation value. We believe that the following conclusion can be drawn here, which we submit for discussion. There is no doubt that an increase in capital equipment per unit of time delays the entrepreneur’s investment decisions. We assume that in an economy, the total demand for certain goods is not fully satisfied by the current level of supply. The aforementioned entrepreneur exercises the right to depreciation of a given fixed asset. As a result, its gross savings level (for the sake of simplicity, we assume a constant level of gross profit) increases by the amount of depreciation. Thus, future investments may become more attractive to him. Due to this mechanism, it is the gross savings and not the gross profit rate that determines investment decisions in the Polish energy sector.
The second issue we wish to discuss concerns the coefficient
. In our research, we ignored its impact on investment decisions in the energy sector in Poland. We wrote in the article that this coefficient depends on technological progress in the long term. In the short term, it takes a constant value. However, the method of its interpretation is crucial. The increase in this coefficient due to the emergence of new technologies contributes to increasing the investment per unit of time above the level that would exist in the situation
. According to the theory of economic dynamics, innovation is defined as the gradual adaptation of production equipment to the current state of technology. Innovations understood in this way are treated as an integral part of ‘ordinary’ private investments. Thus, technological progress is another development factor that enables sustaining long-term economic growth. Referring this issue to the energy sector, it is impossible not to mention the contemporary technological changes or factors related to the broadly understood ecology. Of course, we do not want to go into these issues from the technological side. However, they have a significant impact on investment decisions in this sector. New technologies in the energy sector are essential for the quality and efficiency of electricity production, with economic, social and environmental benefits [
28,
29,
30,
31]. This situation affects almost all economies in the world. In this context, we consider it justified that the method of researching investment decisions presented by us should be discussed in the context of technological changes in the energy sector in Poland, but not only.
Our research results also suggest other possible areas for future research. They relate to the factors that we have overlooked to decide about investments in the energy sector in Poland. These are the coefficients , and . While these are not the most important determinants of the level of gross investment, they nevertheless have a specific significance for their ultimate value in the real capitalist economy. The first factor tells us how much the gross investment will change due to changes in gross savings. The second, on the other hand, shows the response of gross investment to changes in the gross profit rate and price indices. The third factor is also an interesting research area in the context of the challenges faced by the energy sector in Poland and around the world. It is about technological progress. After all, this coefficient is interpreted in the context of technological progress in the long term. Therefore, another research question can be asked. How do technological changes change the level of gross investment in the energy sector in Poland?
Finally, summing up our research on the Polish energy sector, the following conclusion can be made. Changes in gross investment in a given period can be interpreted as a function of gross savings and changes in profits in the corporate sector in earlier periods. Such a conclusion from our research may be the basis for the development of e.g., recommendations for the energy sector in Poland in the field of strategic management. Of course, this issue is very broad, so this statement should only be treated as a suggestion for further research and analysis also in this context.


