Article

Assessing the Environmental Impact and Cost of the Tourism-Induced CO2, NOx, SOx Emission in China

1
College of Tourism, Huaqiao University, Quanzhou 362021, China
2
Institute or Straits Tourism Research, Huaqiao University, Quanzhou 362021, China
*
Author to whom correspondence should be addressed.
Sustainability 2021, 13(2), 604; https://doi.org/10.3390/su13020604
Submission received: 17 December 2020 / Revised: 5 January 2021 / Accepted: 7 January 2021 / Published: 10 January 2021

Abstract

:
Tourism, as one economic activity, results in a full range of environmental impacts globally as well as in China. However, the evaluation of environmental impacts is insufficient because of the strong correlation effect between tourism and other industries. This study attempted to assess the environmental impact and cost of the tourism-induced pollutant emissions (in a broad sense) at the national scale through constructing the environmental-economic input-output model. Our results suggested that the China’s total emission of CO2, NOx, SOx related to tourism industry increased from 42 × 106 t, 162 kt, 345 kt in 1995 to 157 × 106 t, 527 kt, 854 kt in 2009. The indirect CO2, NOx, and SOx emissions of tourism and related industries were nearly 6.8–11 times of their direct emission in travel agency. Most of these indirect emissions (73% of CO2 in 2009, 54% of NOx in 1995, 62% of SOx in 2009) are derived from the energy plants and industrial sectors. The sustainable tourism should largely depend on the realization of sustainable mobility and transportation, through the low-emission behavior and energy-saving technology. The emission reduction cost of tourism industry in China was 30,170 and 172,812 million CNY in 1995 and 2009, accounting for nearly 14% of the total tourism revenue.

1. Introduction

The tourism industry has become one of the largest industries worldwide. In 2019, the combined contribution of tourism to global gross domestic product (GDP) was 10.4%, while employees working in the field accounted for 10% of the global workforce according to the estimation of the World Travel and Tourism Council (WTTC) [1]. The frequent tourism activities and the rapid development of tourism industry brought diverse and serious environmental problems. Tourism has begun to be acknowledged as a significant contributor to the increase in environmental externalities in recent decades: 24% of protected objects were damaged, 12% of tourism resources began to degenerate, 13% of water resources were polluted, and 40% of garbage was hazardous in the natural reserve areas in developed countries [2]. Gössling and Petters pioneered the assessment of tourism’s total global resource use, including 16700PJ of fossil fuel consumption, associated 1.12 Gt of CO2 emissions, 138 km3 of fresh water, 62,000 km2 of land, and 39.4 Mt of food use in 2010 [3]. More and more studies have confirmed the strong correlation between tourism indicators and climate change and environmental pollution. For example, the energy consumption and CO2 emissions related to tourism were calculated to account for 3.2% and 5.3% of global amounts, respectively [4]. Then, the tourism-induced CO2 emissions were reported to be 4.4~5.0% [5,6]. Buckley concluded that tourism was “not close” to achieve sustainability [7]. According to the recent assessment, the carbon footprint of global tourism, including aviation emissions, ground transportation emissions, hotel catering emissions, may account for about 8% of all carbon emissions, two times more than previously estimated; the carbon footprint of tourism in the United States, China, and Germany is the largest [8]. Additionally, some unidirectional short-run causalities existed running from energy consumption to other analyzed variables and bidirectional long-run causalities existed between CO2 emissions and GDP, CO2 emissions and tourism, and GDP and tourism [9]. From another perspective, the sustainability ability related to environment, climate have always been important issues in tourism systems and destination attractiveness. In Asia, the tourism industry is facing all-time big challenges with respect to the reduction in investment, less resources, and minor attention given by the government agencies because of climate change and air pollution [10]. Beijing smog, one of the factors influencing inbound tourism in China, is listed as a global travel warning by wiki travel [11]. More recently, the sustainable development ability, or tourism facilities with sustainable characteristics have been proved to be the main factors that can influence the choice of tourist journey at the time of COVID-19 pandemic [12,13]. The acknowledgement and assessment of environmental impacts of tourism will lead to a sustainable tourism and development.
It is generally known that the tourism industry is not a traditional sector in the System of National Accounts and has a strong correlation with other industries, resulting in the large multiplier effects to the tourism-related industries. The popularity of tourism activities creates increasing demand for goods and services at various functions such as transportation, catering, and accommodation. For example, a comprehensive analysis of the energy needed to maintain the tourism system has to include food and beverages, infrastructure construction and maintenance, and retail and services, based on a life cycle perspective accounting for the energy embodied in the goods and services consumed in tourism [14]. Becken and Patterson suggested two approaches to account for CO2 emissions from tourism: a bottom-up analysis and a top-down analysis [15]. The bottom-up method measures the detailed energy end-uses and carbon emissions of tourists. For example, Jones used an extended tourism environmental satellite accounting to explore how tourism can realize low carbon emission [16]. Kuo and Chen used life cycle assessment (LCA) to explore the environmental impacts of island tourism and then assessed the environmental loads per tourist per trip [17]. The top-down method uses the environmental accounting analysis to measure the impact of tourism on ecological benefits and carbon charges. Owing to the specific characteristics of the tourism industry, the scholars reviewed and discussed the application and methodological issues of the input-output analysis (IOA) to measure the economic effects of tourism [18,19]. The input-output methodology was further used to measure the contribution of tourism to economic output, labor income, and employment; then extended to energy use and environmental emissions. Although the aforementioned methodologies endeavored to show the environmental impacts of tourism from one or several aspects, the existing literatures generally focused on the link between economic growth or outputs of tourism, energy, and carbon emissions [20,21,22,23,24]. Few studies paid attention to the link between tourism and other environmental indicators such as NOx [17]. Additionally, the boundary and composition of the tourism industry was relatively vague and ambiguous in previous studies. It is meaningful to fill the gaps in our knowledge about the responsible and diversiform environmental loads caused by tourism industry. Hence, we attempt to define the complete tourism industry (and the corresponding tourism consumption) and use the concept of total emission and total emission intensity to reveal the tourism-induced environmental impacts (including the CO2, NOx, SOx). Tourism, as an economic activity, can be investigated by applying economic approaches to enhance environmental management. The assessment of environmental cost based on the environmental impact is the fusion point of economics and environmental sciences. Owing to the particularity of the tourism industry, its environmental cost has rarely been discussed in the existing literature. Huang studied the sustainable development of tourism based on the environmental cost [25]. He regarded the externalities as essential attributes of tourism from the perspective of economics, and put forward that the endogenous tourism environmental cost was the key to solve the problem [26]. Liu defined the value of natural resources through the monetization method, then estimated each component of the tourism environmental cost [27]. Compared with the emission permit system of industrial pollution discharge, there has not been a corresponding trading market and market price for pollutant emissions for other industries. Hence, the environmental costs are hard to estimate. In this sense, it is interesting to analyze the net economic benefits after considering the environmental costs of tourism. The measurement of environmental cost includes both single and composite models [28]. The shadow price model is a single model to calculate the transaction price of resources and environment products, and is one of the most important pieces of information in environmental decision-making. From an economic perspective, the shadow price can be considered synonymous with the Marginal abatement cost within the engineering approach, which is incurred when reducing one unit of pollutant emission. The shadow price considers the overall cost factors including the social and external cost that a producer should bear [29]. The technical efficiency and shadow price of different pollutants for different industrial plants have been discussed, for example, CO2 in thermal power sector [30], and in iron and steel industry [31], CO2, SO2, and NOx in coal power industry [32,33], SO2 in electric utilities [34]. We apply the shadow price of the tourism-related industry to reveal the cost incurred when reducing pollutant emission from the whole life cycle. It is helpful to scientifically evaluate the tourism contribution and provide decision-making reference for the government’s pollution-reduction policies.
According to the above statement, the goal of this study is to (i) examine the economic and environmental input-output relationship between tourism and the related sectors, (ii) quantify the direct and total emissions of pollutants (i.e., CO2, NOx, and SOx) induced by the tourism industry, and (iii) reveal the environmental cost of the tourism industry’s pollutants and its proportion in total revenue from the whole life cycle perspective.

2. Materials and Methods

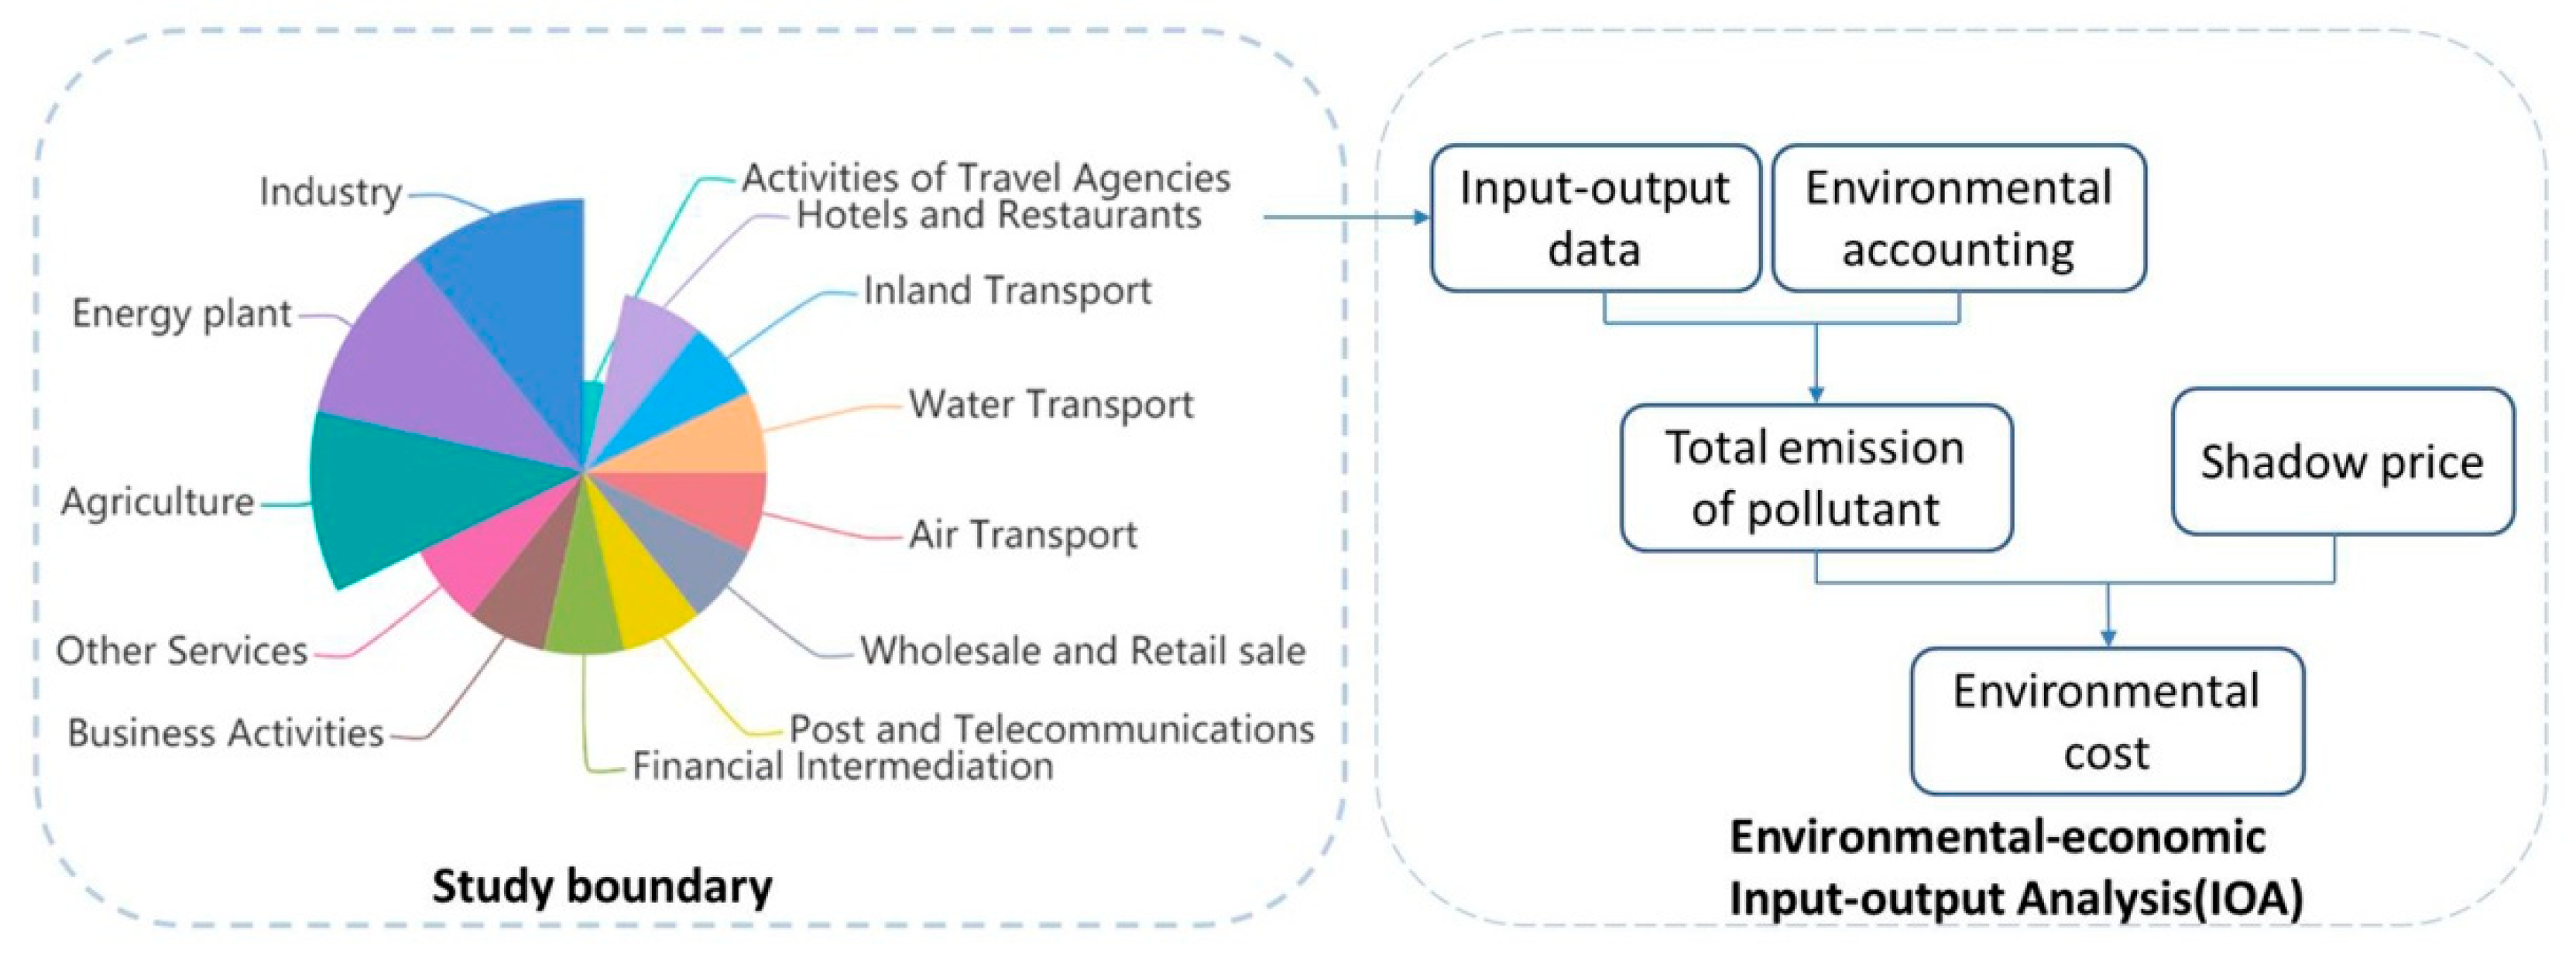
2.1. Study Framework and Boundary Definition

The tourism industry in this study refers to the tourism in a broad sense, including the narrow definition “travel agency” and the related sectors, e.g., travel, accommodation, catering, sightseeing, shopping, and entertainment, etc. To reveal the real environmental impact and cost resulting from the input-output relationship between the tourism industry and the related industries, the framework of this study is as follows (Figure 1). (i) A “complete” tourism industry is defined based on the economic relationship in the input-output model; (ii) the “total” emissions of pollutants from the tourism industry can be calculated using the environmental economic input-output model; (iii) the environmental cost that the tourism industry should bear can be examined through the shadow price of the tourism-related industry.

2.2. Environmental-Economic Input-Output Model

The input-output analysis (IOA) is a mathematical model that studies the input-output relationship between the sectors of an economic system. The method was first put forward by Leontief in 1936, and then became the mature economic analysis tool at present [35,36]. The economic input-output life cycle assessment (EIO-LCA) combined the input-output analysis (IOA) and the life cycle assessment, and was widely used to study the mutual relationship between economy and environmental impact [37,38]. In the 1950s, the western countries compiled the Input-output Table, while the first National Input-output Table of China was finished in 1987. After that, the extended and basic tables have been compiled every three and five years, respectively.
In order to assess the environmental impact and cost of tourism industry, we attempted to construct a model by combining the economic and environmental accounts. The detailed calculation processes are as Figure 2; while the detailed dataset can be found in Supplement S1.
Step i. We obtained the 35-sector National Input-output Table of China for the year of 1995–2009 from the World Input-output Table (WIOD) Database [39]. The 35 economic sectors (i.e., c1–c35) are classified according to the International Standard Industrial Classification revision 3 (ISIC Rev. 3). We further divided the 35 sectors into two groups: the tourism industry and the tourism-related industry as Table 1. According to “Statistical Classification of National Tourism and Related Industries (2018)” issued by National Bureau of Statistics of China, the tourism industry in this study includes the Wholesale and Retail Trade, Hotels and Restaurants, Inland Transport, Water Transport, Air Transport, Activities of Travel Agencies, Post and Telecommunications, Financial Intermediation, Business Activities and Other Services. Hence, the finally Input-output Table was compiled into 13 sectors as Table 1.
Step ii. Based on the environmental accounting in the World Input-output Table (WIOD) database, we collected the direct emission data of the air pollutants (i.e., CO2, NOx, SOx) by sector. We divided the direct emission of each sector by the total economic output from the Input-output Table to create a direct emission intensity vector (D) of CO2, NOx, SOx.
Step iii. Using 13-sector Input-output Table of China, the Leontief inverse matrix B = ( I A ) 1 was obtained to represent the total (direct and indirect) economic inputs (investments) from all sectors when a sector produces a unit of output. Afterwards, we calculated the total emission intensity vector (T) by multiplying the diagonal matrix of the direct intensity matrix (D) by the Leontief inverse matrix (B) (i.e., T =   D ^   × ( I A ) 1 ) to represent the total upstream and downstream pollutant emissions induced by the relative sectors to produce per-unit output of a specific sector. More specifically, the total emission of one sector refers to “from the perspective of demand, for per-unit output of this sector, other sectors need to input all material and middle products that generate the direct and indirect pollutant emission.” In this respect, this sector should be responsible for the externalities of environmental emission and cost.
Step iv. The total emission induced by tourism industry should be calculated by multiplying the total emission intensity vector (T) and the corresponding tourism expenditure vector. The tourism expenditure and consumption occurred in each link of tourism activity, then constituted the added value and output of various economic sectors. We multiplied the stripping coefficient of tourism consumption (as Table 1) by the final use from the 13-sector Input-output Table to estimate the tourism expenditure vector, i.e., “how many percentage of final use/consumption of sectors was contributed by tourism.”
Step v. Shadow price of tourism-related industry. The shadow price of the tourism industry can be considered as the cost incurred when reducing one unit of pollutant emission from the whole life-cycle of a tourism activity or enterprise. However, the total emissions of the tourism industry are mostly from the upstream and downstream industries, but not the industry itself; therefore, it is hard to estimate the shadow price of tourism industry from the perspective of either engineering or economy. In this study, we applied the shadow price of the tourism-related industry instead of the environmental cost of the industry itself as the following steps. We defined the strongest related sectors to the CO2, NOx, and SOx emissions of the tourism industry through the input-output relationship. The studies of CO2, NOx, and SOx were mostly about the industrial and energy sectors, which showed their strong relationship with tourism. We obtained the shadow prices of the related industries through the meta-analysis, which have given detailed empirical results. The shadow price in each province was estimated at 226–1550 CNY/t with the median value 800 CNY/t in 2005, and 300–2040 CNY/t with the median value 1000 CNY/t in 2009 [41]. The empirical results found that the shadow price of CO2 has positive correlation with the CO2 emission efficiency, and has negative correlation with the carbon emission scale; meanwhile, it has been relatively stable with the growth trend being not obvious [42]. The mean abatement cost for NOx and SOx emissions in China were estimated at 22 CNY/kg and 4.8 CNY/kg [43]. We took the median value of 600–1000 CNY/t, 22 CNY/kg, and 4.8 CNY/kg to represent the shadow price of the CO2, NOx, and SOx during 1995–2009, respectively.

2.3. Scenario Analysis of Emission Abatement Potential

Based on the possible or expected changes of main driving forcers (i.e., the total emission, the total emission intensity, the tourism consumption) in the IOA, we set up a new set of three scenarios to depict the future trend of pollutant emissions and environmental costs (Table 2). The value of shadow price is assumed to be constant with the growth trend being not obvious. The situation in 2009 is used as the reference and those in 2020 and 2030 as the target years. The tourism consumption is estimated through price index to eliminate price impact. (i) Scenario I–Business as Usual (BAU) scenario is based on the assumption that total emission intensity (T) of pollutant will maintain the same as 2009 with no change; while the tourism consumption/expenditure vector will maintain the annual increase rate (12%) of 1995–2009. (ii) Scenario II–Low emission scenario (LE), is designed to cut 40% and 60% of CO2 total emission intensity in accordance with the reduction target of the low carbon scenario of “Energy Production and Consumption Revolution strategy (2016–2030)” issued by the National Development and Reform Commission and the National Energy Administration in 2020 and 2030, respectively. The NOx and SOx total emissions in 2020 are predicted to reduce 23% and 25%, respectively, according to the “12th Five Year Plan” and the “13th Five Year Plan” of China’s national economy. (iii) Scenario III-Enhanced low emission scenario (ELE), is designed to cut 45% and 65% of CO2 total emission intensity in accordance with the reduction target of the enhanced low carbon scenario of “Energy Production and Consumption Revolution Strategy (2016–2030)” in 2020 and 2030, respectively. In addition, in order to control the development scale of tourism industry under the ELE scenario, the annual increase rate of the tourism consumption is designed to cut 50% (i.e., 6%) of the rate of BAU.

3. Results

3.1. Direct Emission and Direct Emission Intensity

For the tourism industry in China, the direct emission amount of CO2 showed an obvious increasing trend for the period 1995–2009, whereas the direct emission intensity showed a decreasing trend. The CO2 emission increased from 24 × 106 t in 1995 to 105 × 106 t in 2009 with the annual increase rate being 10.3%, the emission intensity decreased from 1524 g/dollar in 1995 to 827 g/dollar in 2009, with the annual increase rate being −4.0% (Figure 3a). During the same period, the direct emission amounts of NOx and SOx showed an increasing tendency initially and a descending tendency in different stages, while the emission intensities of NOx and SOx showed a clear decreasing trend. The NOx direct emission increased from 224 kt in 1995 to 558 kt in 2009 with an annual increase rate of 6.3%, whereas the emission intensity decreased from 14.1 g/dollar in 1995 to 4.4 g/dollar in 2009 with an annual increase rate of −7.5% (Figure 3b). The SOx emission increased from 90 kt in 1995 to 127 kt in 2009 with an annual increase rate of 2.3%, whereas the emission intensity decreased from 5.7 g/dollar in 1995 to 1.0 g/dollar in 2009 with an annual increase rate of −10.9% (Figure 3c).
Overall, the increase rate of CO2 emission (10.3%) was larger than those of NOx and SOx (6.3% and 2.3%); conversely, the decrease rates of NOx and SOx emission intensity (7.5% and 10.9%) were larger than that of CO2 (4.0%). The results show the environmental impact of CO2 is more obvious and harder to abate in comparison with other pollutants. In fact, it is very possible to realize the net decrease of NOx and SOx emission amount according to the government’s emission target and the control technology. Hence, achieving sustainable tourism by mitigating the impacts of CO2 is still a serious problem in China. Additionally, the largest contributed sector of CO2, NOx, SOx direct emission was Travel Agencies (Air Transport), Inland Transport and Travel Agencies, respectively.

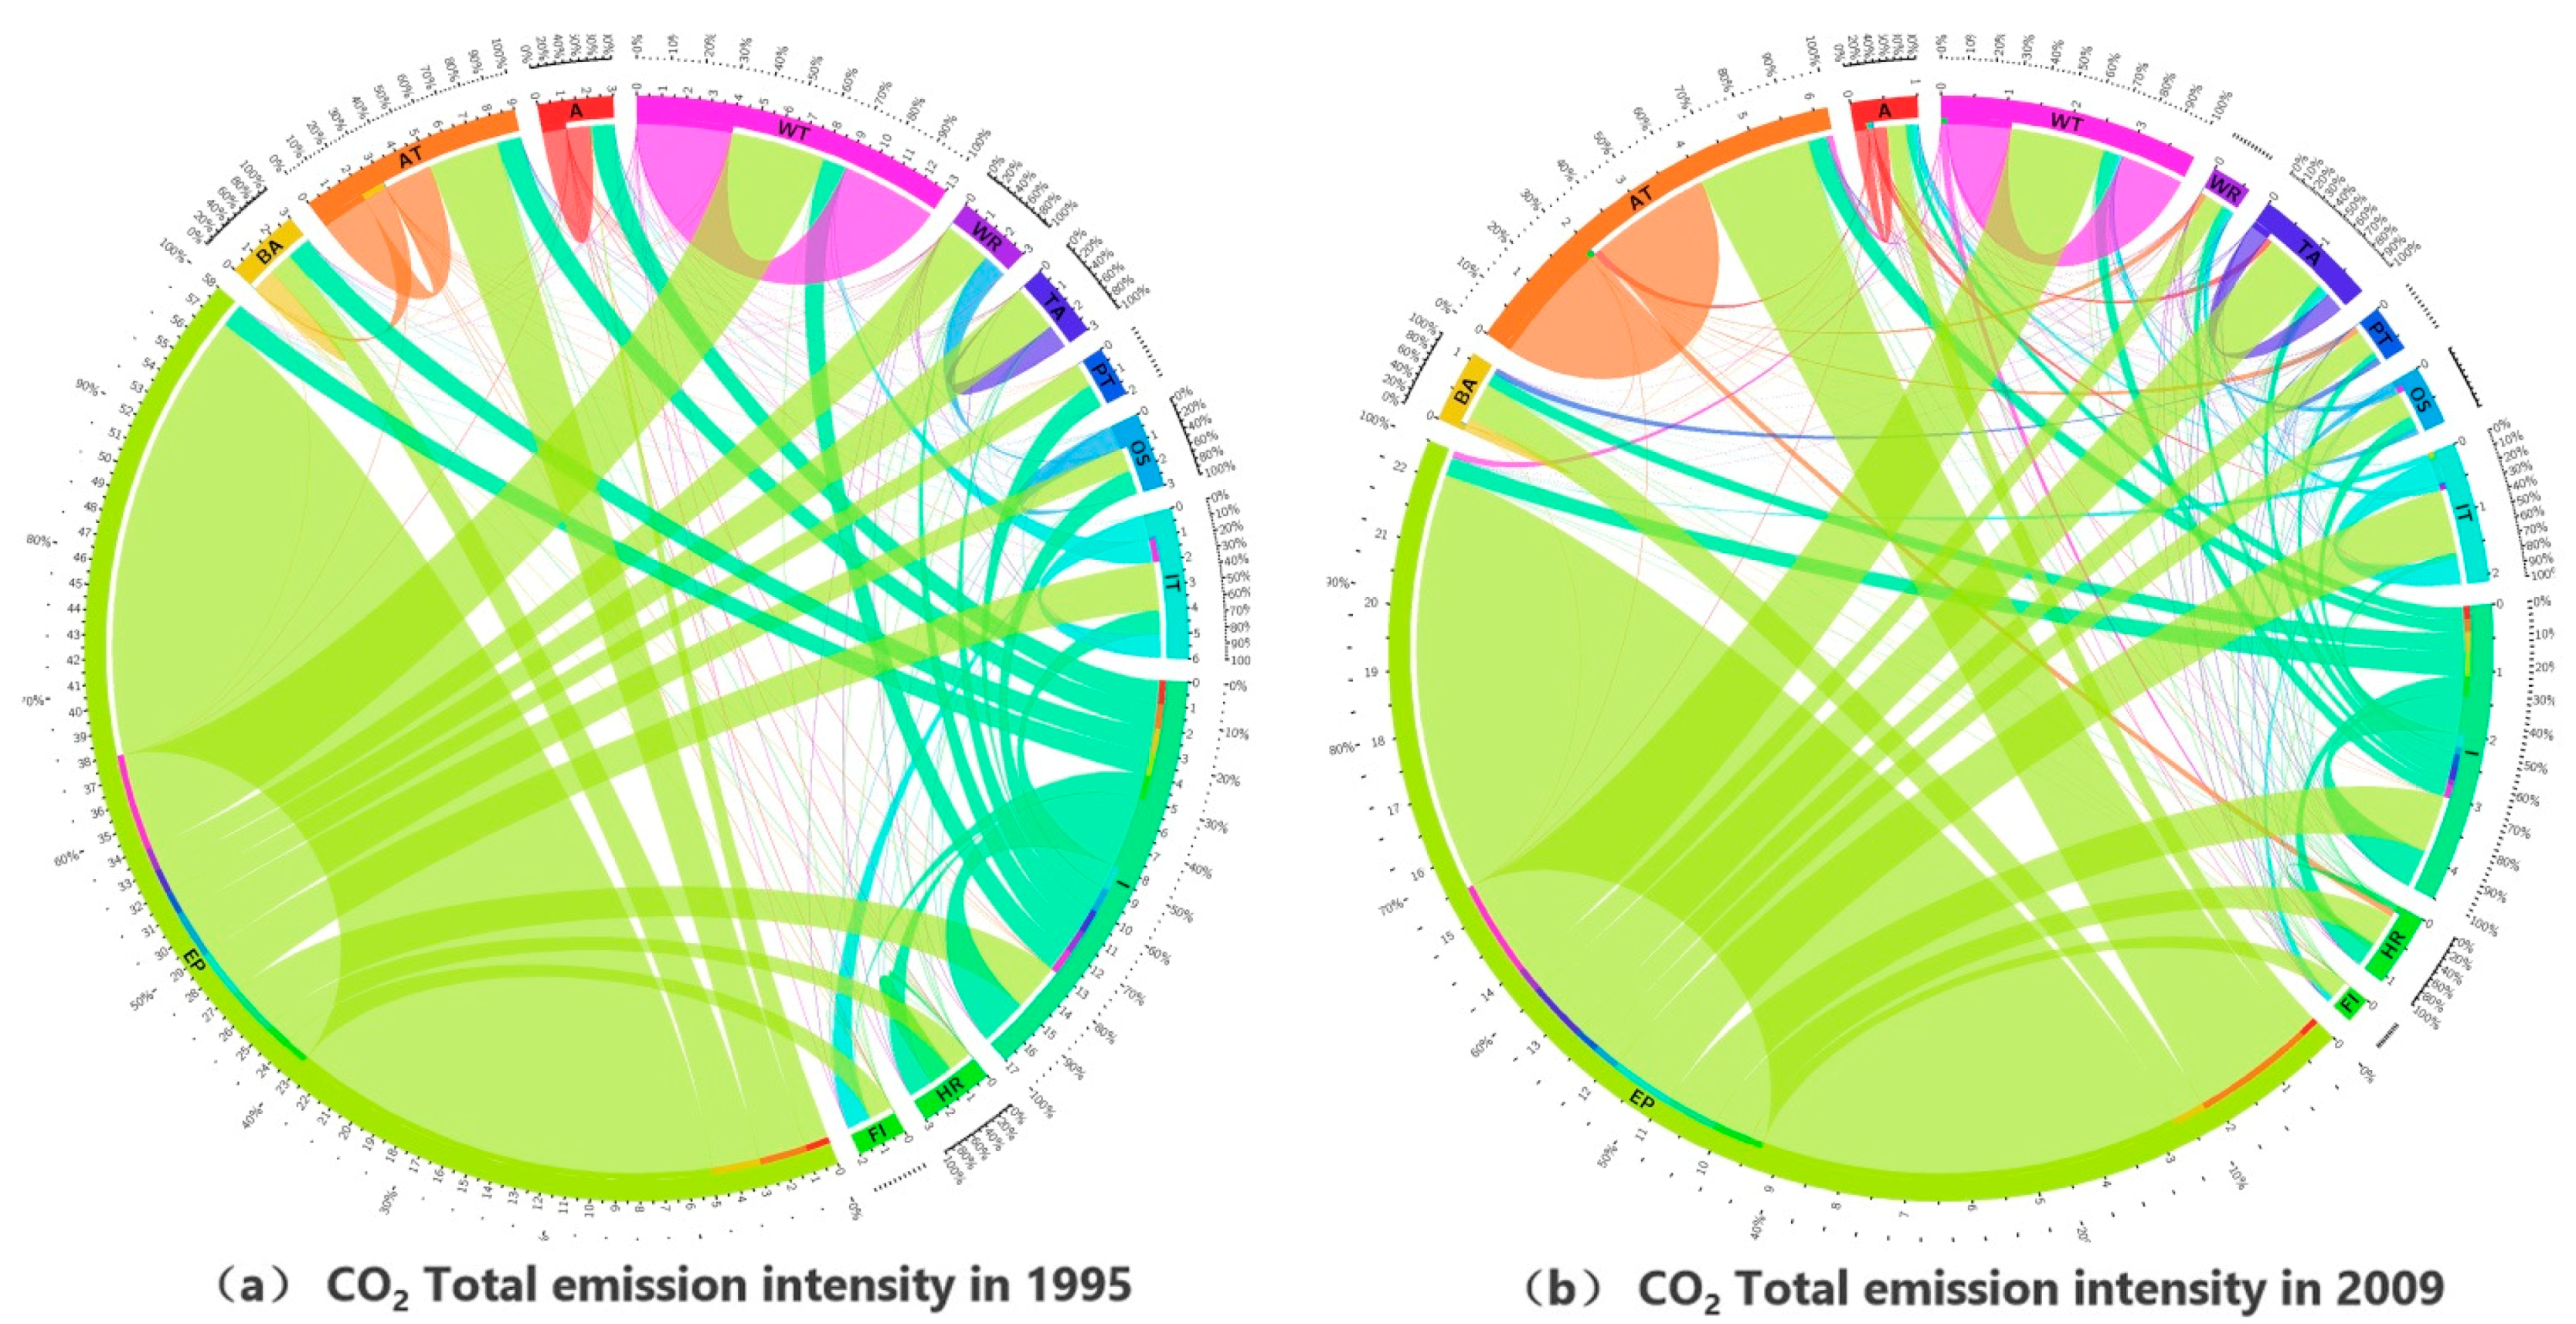
3.2. Total Emission and Total Emission Intensity

For the investigated period, the total emission amounts of CO2, NOx, and SOx from the tourism industry in China showed a stable increasing tendency, whereas the total emission intensity showed a decreasing trend from the beginning to end. The CO2 total emission increased from 42 × 106 t in 1995 to 157 × 106 t in 2009, with an annual increase rate of 9.2%, while the total emission intensity decreased from 2625 g/dollar in 1995 to 1243 g/dollar in 2009 with an annual increase rate of −4.9% (Figure 4a). Our estimation was close to the results of previous study [44]. The NOx total emission increased from 162 kt in 1995 to 527 kt in 2009 with an annual increase rate of 8.2%, whereas the total emission intensity decreased from 10.2 g/dollar in 1995 to 4.2 g/dollar in 2009 with an annual increase rate of −5.7% (Figure 4b). The SOx total emission increased from 345 kt in 1995 to 854 kt in 2009 with an annual increase rate of 6.2%, whereas the total emission intensity decreased from 21.9 g/dollar in 1995 to 6.8 g/dollar in 2009 with an annual decrease rate of 7.5% (Figure 4c).
The comparison between direct emission and total emission can indicate the industrial linkage effect in pollutant emission. From the perspective of all the tourism-related industries, one unit CO2 emission from the tourism industry caused about 1.7 and 1.5 units CO2 from the related industries in 1995 and 2009, respectively; one unit SOx emission from the tourism industry caused about 3.8 and 6.7 units SOx from the related industries in 1995 and 2009, respectively. From the perspective of the tourism industry, one unit CO2, NOx, and SOx emission from the “Travel Agencies” caused about 4.5~6.5 units CO2, NOx, and SOx from the tourism in a broad sense during 1995–2009. Overall, the strong relationship between the tourism industry and other sectors was reflected on the pollutant emissions. Their total environmental impacts cannot be neglected because of their complex linkage with the upstream and downstream industries. Additionally, the largest contributing sectors of CO2, NOx, SOx total emission were Hotels and Restaurants. Hence, judging whether the tourism industry is a green industry highly depends on the production and technical levels of the relative sectors.

3.3. Total Emission by Sector and by Pollutant

3.3.1. CO2

The total 42 × 106 t CO2 emission of the tourism industry in 1995 consisted of 20 × 106 t from Energy plant, 13 × 106 t from Industry and 2.5 × 10⁶ kt from Transport. The energy and secondary industrial sectors accounted for nearly ≈78% of total emissions. The total 157 × 106 t CO2 emission of the tourism industry in 2009 consisted of 88 × 106 t from Energy plant, 27 × 106 t from Transport (17 × 106 t from Air Transport), and 26 × 106 t from Industry. The energy sector was still the biggest contributor, accounting for 56% of total emissions. In addition, the transport showed the equal importance with Industry in 2009 (Figure 5). With the development of transportation, the long-distance travel and cross-regional travel are becoming more and more popular. More attention should be paid to the pollutant emission caused by tourism transportation.
Notably, the CO2 emission from all sectors was reported nearly 2723 × 106 t in 1995 and 6213 × 106 t in 2009; while the total CO2 emission from tourism industry accounted for 1.5% and 2.7% of the national CO2 emission. The value was a little lower than the reported global levels: 5.3% in 2001 [4]; 5.0% in 2004 [6], and 4.4% in 2005 [5], but showed an obvious increasing trend.
According to the total emission intensity, for example, in 1995, per unit output (i.e., one dollar) of Travel Agencies needed the most CO2 emission from the following sectors: Energy plant (1143 g), Industry (554 g), Air Transport (163 g), and itself (263 g) (Figure 6a). In 2009, one dollar output of Travel Agencies needed the most CO2 emission from the following sectors: Energy plant (969 g), Industry (175 g), Inland Transport (30 g), and Itself (286 g) (Figure 6b). From the changes in the strength of sector links, overall, the CO2 emission intensity of tourism-induced relative sectors decreased. The tourism industry has a strong relationship with the energy (such as electricity, gas, coke, refined petroleum, and nuclear fuel) and transport (such as inland, water, and air transport) sectors in terms of CO2 emission.

3.3.2. NOx

The total 162 kt NOx emission of the tourism industry in 1995 consisted of 48 kt from Energy plant, 48 kt from Inland Transport, 40 kt from Industry and 26 kt from other sectors. The energy and transport sector accounted for nearly 59% of total emissions. The total 527 kt NOx emission of the tourism industry in 2009 consisted of 128 kt from Energy plant, 117 kt from Agriculture, 71 kt from Industry, 69 kt from Inland Transport, 66kt from Air Transport and 76 kt from other sectors. The contribution of the energy and transport sector was stable (i.e., accounting for nearly 50% of total emissions). Agriculture became the second largest contributor, accounting for nearly 22% of total emissions (Figure 7). Compared to CO2, the tourism-induced NOx emission from inland and air transport showed the same decreasing tendency from 1995 to 2009; whereas the NOx emission from power plants remained stable over the same period. In fact, the denitrification technique used to remove NOx was more effective than decarburization; hence, the abatement potential of NOx was bigger than that of CO2. Notably, the substantial NOx emission in China from agriculture in 2009 was a result of the agricultural soils and biomass burning.
According to the total emission intensity, for example, in 1995, per unit output (i.e., one dollar) of Travel Agencies need the most NOx emission from the following sectors: Energy plant (2.8 g), Inland Transport (2.1 g), Industry (1.7 g), and itself (1.0 g) (Figure 8a). In other words, the Travel Agencies has a strong relationship with energy and transport sectors. In 2009, per unit (i.e., one dollar) output of Travel Agencies needed the most NOx emission from the following sectors: Energy plant (1.4 g), Agriculture (1.0 g), Inland Transport (0.5 g), and itself (0.7 g) (Figure 8b). In other words, the sectors most closely related to the tourism industry have changed and become: transport, energy, and agriculture.

3.3.3. SOx

The total 345 kt SOx emission of the tourism industry in 1995 consisted of 230 kt from Energy plant, 76 kt from Industry, 11 kt from Hotels and Restaurants, and 28 kt from other sectors. The power plant accounted for nearly 67% of total emissions. The total 854 kt SOx emission of the tourism industry in 2009 consisted of 442 kt from Energy plant, 285 kt from Agriculture, 84 kt from Industry, and 43 kt from other sectors. The power plant sector was still the largest contributor and accounted for nearly 52% of total emissions (Figure 9).
According to the total emission intensity, for example, in 1995, per unit output (i.e., one dollar) of output of Travel Agencies needed the most SOx emission from the following sectors: Energy plant (13.4 g), Industry (3.2 g), Inland Transport (0.3 g), and itself (1.8 g) (Figure 10a). Hence, the Travel Agencies has a strong relationship with energy (such as electricity, gas, coke, refined petroleum, and nuclear fuel) and transport (including water, air transport). Until 2009, one dollar output of Travel Agencies needed the most SOx emission from the following sectors: Energy plant (4.8 g), Agriculture (2.5 g) and Industry (0.6 g) (Figure 10b). Overall, the interdepartmental communication was stable in terms of tourism-induced SOx emissions.

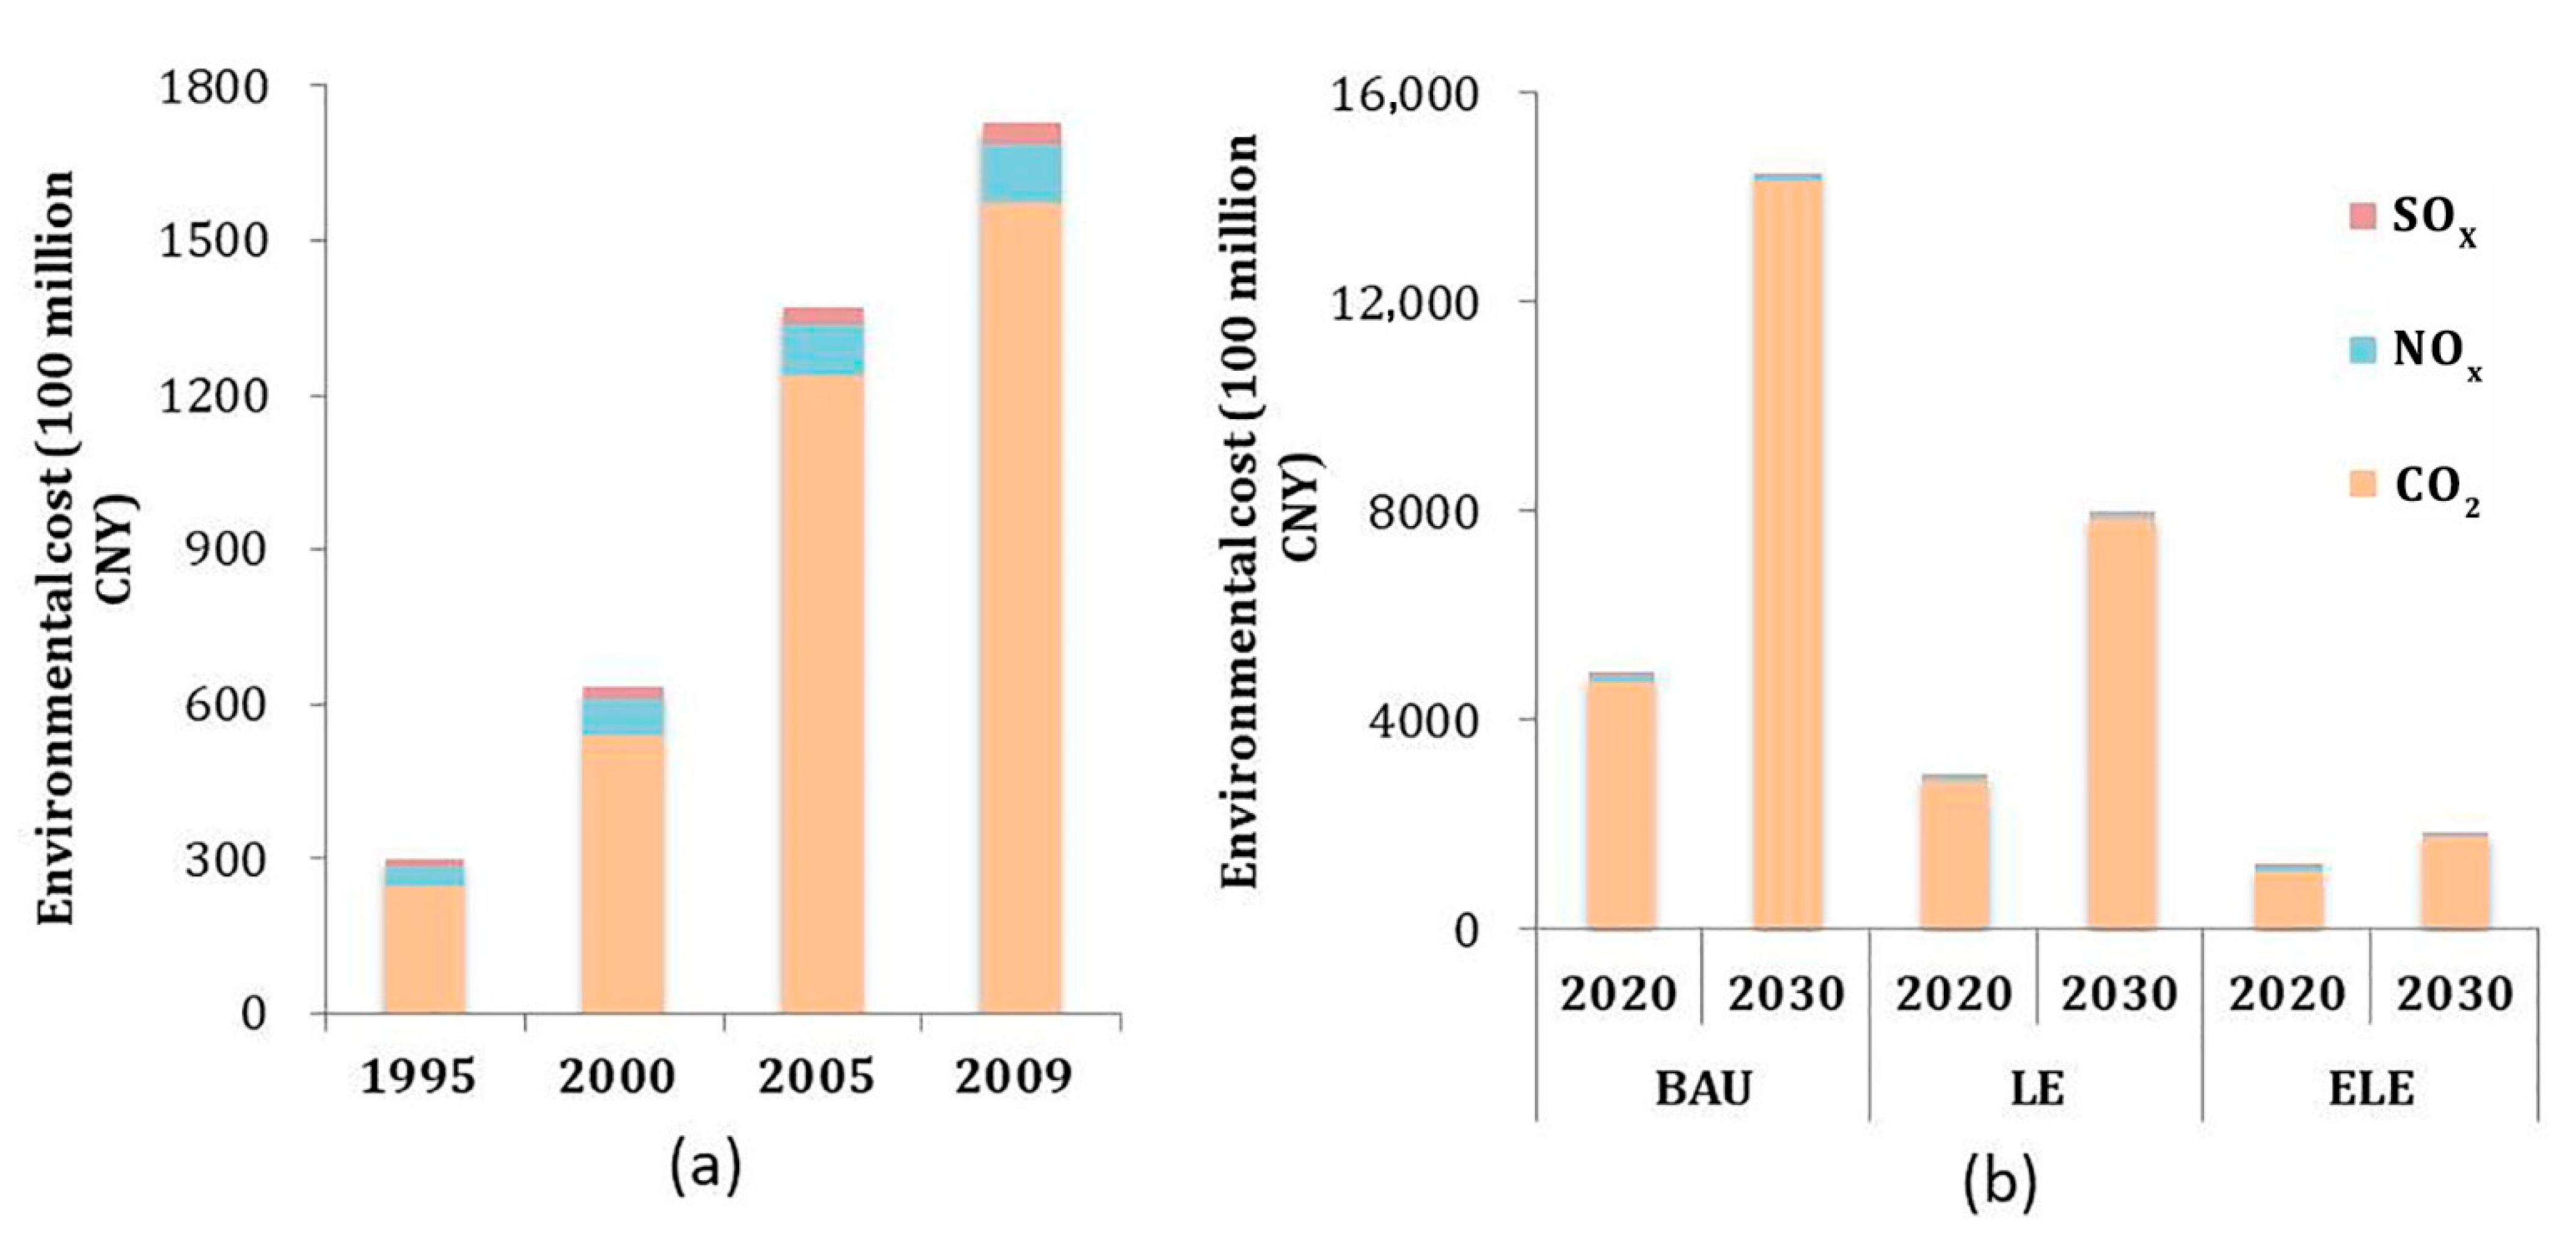
3.4. Environmental Cost of Tourism-Induced Pollutant and Prediction

Based on the shadow price of different pollutants, the environmental cost of the tourism industry in China was 30,170 and 172,812 million CNY in 1995 and 2009, respectively. In addition, the reduction cost of CO2 was 24,943 million CNY in 1995, while 3570 and 1657 million CNY were used for the abatement of SOx and NOx emissions, respectively. In 2009, the environmental cost of CO2 was 157,121 million CNY, while 11,592 and 4099 million CNY were used for the abatement of SOx and NOx emissions, respectively (Figure 11a). Hence, CO2 reduction was responsible for about 83% and 91% of the pollutant’s environmental cost of the tourism industry in 1995 and 2009, respectively. The conclusion is again emphasized: achieving sustainable tourism through reducing carbon emissions and mitigating climate change is still an important problem in China.
Under the BAU scenario, the total emissions of CO2 will reach 474 × 106 t, in 2020 and 1431 × 106 t in 2030; the reduction cost of CO2 was 474 billion CNY and 1431 billion CNY, respectively. CO2 reduction will be responsible for about 97–99% of the pollutant’s reduction environmental cost of the tourism industry for the coming decade. Both the total emissions and environmental costs will decrease largely because of the effective control measure by government. The LE scenario reduces the total emission of CO2 by 40% (in 2020) and 45% (in 2030) compared to the BAU scenario, ultimately appearing as a reduction in environmental cost effect of 39% and 45%, respectively. The ELE scenario reduces the total emission of CO2 by 60% (in 2020) and 77% (in 2030) compared to the BAU scenario, ultimately appearing as a reduction in environmental cost of 58% in 2020 and 78% in 2030 (Figure 11b).

4. Discussion

4.1. Tourism-Induced Direct and Indirect Environmental Impacts

The tourism industry is a special industry with a strong industrial relevance. To define the tourism industry and related industries scientifically, the National Bureau of Statistics of China has formulated and issued the new “Statistical Classification of National Tourism Industries (2018).” This classification divides the “board” tourism concept into the “tourism industry” and “tourism-related industry.” The tourism industry refers to the collection of services such as travel, accommodation, catering, sightseeing, shopping, and entertainment, while the tourism-related industry refers to the collection of activities such as providing assistance services and government tourism management services for tourists. However, in addition to the aforementioned services, according to our results, the economic activity, and pollutant emission of the tourism industry has a correlation with more industries. For example, the tourism agency should buy the water, electricity, gas from the related energy plants, while the energy consumption and pollutant emissions are embodied in the economic flows between the tourism and energy sectors. Similarly, the tourism agency should buy the products and services from the upstream suppliers such as the restaurants and hotels, while the pollutant emissions are embodied in the economic inputs and outputs exchanged between these sectors. In this view, the tourism-related industry should include these original suppliers of resource, material, and energy. According to our results, the tourism-induced CO2, NOx, and SOx emissions were strongly related to the energy-intensive sectors, such as Energy plant, Transport and Industry.
How can we identify the tourism industry as a green or smokeless industry? To this end, we should consider not only the direct environmental impact, but also the indirect or total impact resulting from tourism. Our results indicate that significant indirect effects resulting from the complex correlations between the tourism industry and other industries in terms of environmental impact. Most of the tourism-induced CO2, NOx, and SOx emissions were not from the tourism industry, but from the energy and industrial manufacture sectors. One unit CO2 emission from the “Travel Agencies” caused about 4.5~6.5 units CO2 from the tourism in a broad sense during 1995–2009; while one unit CO2 emission from the tourism industry further caused about 1.5~1.7 units CO2 from the tourism-related industries during the same period. The multiplier effect of the tourism industry is not only reflected in the economy, employment but also the environment (about 6.8–11 times). The analysis suggests that substantial emissions cuts depend on technical developments outside the tourism industry. The tourism industry was proven to have the strong pulling effect for the upstream enterprises with the higher backward industrial correlation [45]. In comparison with the economic driving effect of the tourism industry, the environmental impacts from the upstream enterprises cannot be ignored. Meanwhile, the composition of environmental emissions changed obviously over time inside the tourism industry. For example, the CO2 total emission percentage from Hotels and Restaurants changed from 44.1% in 1995 to 29.4% in 2009, while CO2 total emission percentage from Air Transport changed from 2.1% in 1995 to 20.7% in 2009. With the development of living standard and transportation condition, the long-distance travel and the cross-regional travel enforce the contribution of tourism transportation to environmental loads. Therefore, on the one hand, the environmental impacts of the tourism industry depend on the tourism and related services’ consumption patterns. On the other hand, it strongly relies on the production conditions and technology level of the related industrial sectors, especially the key ones such as electricity. The realization of a smokeless industry should satisfy the standards of both the consumption mode and technology indicators.

4.2. Sustainable Mobility Supporting Tourism Sustainability

According to the recent report, the greenhouse gas emission from global tourism industry increased from 38 × 108 t to 45 × 108 t during 2009–2013, accounting for 8% of global CO2 emissions in 2013. In addition, CO2 emissions from the tourism industry were primarily related to transport, which accounted for 75% of all energy demand [46]. According to a new report released by the World Tourism Organization, the global carbon emission of tourism traffic is expected to increase from 17 × 108 t in 2016 to 20 × 108 t, accounting for 5.3% of the total human CO2 emissions by 2030. To maintain the global tourism system, the system requires rapidly growing resource inputs, while, simultaneously, becoming increasingly vulnerable to disruptions in resource flows [3]. The tourism-induced global mobility trend and transport-related emissions severely damage the natural flora of the world [47] and result in unpredictable climate change in the world. Thus, a sustainable tourism should be linked to a concept of sustainable mobility [48].
As tourism develops, it will rely more on energy. However, there are huge differences on the energy amounts needed for different transport modes and trips. Energy use for a home-based bicycle tour may not require any direct input of fossil fuels at all, whereas long-distance trips involving flight and cruise may require energy inputs exceeding 3000 kg of fuel per traveler [49,50]. With the increase of income, people gradually choose the long-distance travel, and their dependence on aviation is also increasing. The inland transport, especially railway, will play an increasing role in domestic tourism. Our results indicate that all the transport modes are the major factors causing an increase in CO2 (from 6837 kt to 56,426 kt), NOx, (46 kt to 196 kt), and SOx emissions (56 kt to 190 kt) during the study period, even though specific technology has been applied to eliminate the pollutants. Given that technology is unlikely to sufficiently reduce the tourism transport’s impact on climate change and environmental damage, the behavioral change is necessary. The behavioral model has been created and tested with a dynamic version of the global tourism transport model. The ultimate goal of the model is to provide insights into the impacts of tourism on greenhouse gas emissions and the effectiveness of policies that seek to reduce those emissions [51]. Therefore, for domestic or inbound/outbound tourism, the choice of a green-travel mode and a low-emission consumption pattern can effectively support the sustainable development of tourism. The public should use public transport as much as possible instead of the private car travel. In 2016, the International Civil Aviation Organization (ICAO) adopted an “International Aviation Carbon Offset and Emission Reduction Plan.” It is planned that the aviation industry will spend about 2% of its revenue on reforestation and emission reduction projects after 2020, so as to control the new greenhouse gas emissions of the aviation industry. When choosing air travel, the public can choose to purchase carbon sink for carbon offset.

4.3. Emission Abatement Potential and Environmental Cost of Tourism Industry

Many public agencies use the benefit-use analysis to quantify and compare the economic benefits and costs for a particular project or management plan [52]. In the search for an appropriate measure of the impact of tourism growth, an increasing attention is being paid to the concept of “yield”, which refers to the net economic gain from tourism after considering the benefits and costs of tourism activities. Some valuable work has been undertaken to estimate the gross tourism expenditure and the contribution of tourism to particular economies [53]. For example, Tisdell estimated the economic contribution of tourism to several countries including China, the Maldives, Seychelles, Mauritius, and the Pacific island states [54]. Mike described a prototype tool for holiday products that could determine the circumstances in which overall benefits of tourism outweigh burdens. A cost-benefit tool for tourism products could help the industry with “choice editing” and identifying sustainability [55]. However, so far, such studies have fallen well short of providing an accurate estimate of the tourism yield. The net benefits of tourism are normally significantly lower than the aggregate expenditure of tourists because it is necessary to give up real resources, goods, and services to provide for these tourists [56].
In China, the government and scholars also endeavored to explore the indicators or indexes reflecting the real “yield” of tourism. All the indicators can be classified into three categories: market, industry, and social development. (i) The market index reflects the running posture of three markets, including the domestic, inbound, and outbound tourism markets. (ii) The industry index reflects the fundamental conditions of the tourism industry; for example, the total tourism revenue and added value. (iii) The social development index reflects the contribution of tourism to economy and social progress; for example, the direct/indirect employment and tourism investment. Among them, the total tourism revenue is used to reflect the economic effect or yield of the tourism industry for a long time. According to the statistical results of China, the total tourism revenue was 210 billion CNY in 1995 and 1290 billion CNY in 2009; while the reduction cost of the main pollutants (30.2 and 172.8 billion CNY in 1995 and 2009) accounted for nearly 14% of the total revenue, according to our estimation. According to our prediction, if the emission reduction measures are not taken in time and strictly, the growth speed of pollutant emission is very likely to exceed the tourism economic growth. As a result, the value of total tourism revenue will be further overestimated by government and statistical sector.

5. Conclusions

Our study is built on a prior work and constructs an environmental-economic Input-output model to assess the national environmental impact and cost of the tourism-induced pollutant emission. The main improvements and extensions that we have made is the implementation by combining the economic model and environmental account under a tourism perspective to assess the environmental impact and reduction cost of the tourism-induced emission in China. Our method makes a good progress in characterizing environmental impacts of tourism in a broad sense and giving a new prospective through applying the economic assessment to enhance environmental management. Our results indicate that the significant total/indirect environmental impacts are induced by the tourism-related industries, especially the energy and transport sectors. Therefore, our results strongly suggest that, the complex effect of tourism should be considered in the future sustainable development plan or environmental management.
The tourism industry in this study refers to the tourism in a broad sense. Our results show that the tourism-induced total emissions of CO2, NOx, and SOx have changed from 42 × 106 t, 162 kt, 345 kt in 1995 to 157 × 106 t, 527 kt, 854 kt in 2009. The CO2 total emission grew faster than NOx and SOx during 1995–2009; whereas the total emission intensity of three pollutants showed a decreasing trend from the beginning to end. The tourism-induced indirect environmental impacts cannot be neglected because of their strong impacts on the upstream and downstream industries. For example, one unit CO2 emission from the “Travel Agencies” caused about 4.5~6.5 units CO2 from the tourism in a broad sense during 1995–2009; while one unit CO2 emission from the tourism industry further caused about 1.5~1.7 units CO2 from the tourism-related industries during the same period. The pollutant abatement of tourism relies on not only the industry itself and tourists, but also the production conditions and technology level of related industrial sectors. Especially, the energy plant and industrial sectors showed the obvious relationship with China’s tourism industry (i.e., accounting for 73% of tourism-induced CO2 total emission in 2009, 54% of NOx total emission in 1995, and 62% of SOx total emission in 2009). In addition, the composition of environmental emissions changed obviously over time inside the tourism industry. The emission from transport increased (e.g., CO2 from Air Transport from 2.1% in 1995 to 20.7% in 2009) and became a large contributor to environmental loads. Therefore, the sustainable tourism should largely depend on the realization of sustainable mobility and transportation, through the low-emission behavior and energy-saving technology. To maintain the global tourism system, it requires rapidly growing resource inputs; however, it is simultaneously becoming increasingly vulnerable to environmental disruptions and economic cost. Based on our estimation, the emission reduction cost of the tourism industry in China was 30,170 and 172,812 million CNY in 1995 and 2009, respectively. The reduction cost accounted for nearly 14% of the total tourism revenue. If the emission reduction measures are not taken in time and strictly, the growth speed of pollutant emission is very likely to exceed the tourism economic growth.
At the time of COVID-19 pandemic, the “sustainability” has been proved to be the main factor that can influence the choice of tourist journey, for example, sustainable development ability, or tourism facilities with sustainable characteristics [12,13]. Future work could focus on constructing a hybrid method to measure the “sustainability” combining different approaches based on the life cycle assessment. The calculation of shadow price of tourism or accommodation is necessary through the marginal abatement cost curve. Future work could also focus on assessing other environmental indexes and other countries based on the availability of the national economic and environmental accounts through the provided database. A simultaneous multi-objective optimization for the complete set of environmental indexes of tourism industry should strive to optimize use pathways in a national economy to reduce environmental cost.

Supplementary Materials

The following are available online at https://www.mdpi.com/2071-1050/13/2/604/s1, Supplement S1: Dataset.

Author Contributions

Data curation, formal analysis, methodology and writing—review and editing, Y.S.; data curation, M.Y. All authors have read and agreed to the published version of the manuscript.

Funding

This research was supported by the National Natural Science Foundation of China under Grant 41807467 and Social Science Federation of Fujian Province under Grant FJ2018C006.

Institutional Review Board Statement

Not applicable.

Informed Consent Statement

Not applicable.

Data Availability Statement

Data is contained within the article or supplementary material. The data presented in this study are available in [Assessing the environmental impact and cost of the tourism-induced CO2, NOx, SOx emission in China].

Acknowledgments

The author(s) express their gratitude and thanks to the editor and the reviewers for their constructive comments and suggestions that helped to shape this article.

Conflicts of Interest

The authors declare no conflict of interest.

References

  1. WTTC. Travel & Tourism Global Economic Impact & Trends; World Travel & Tourism Council: London, UK, 2019. [Google Scholar]
  2. Mi, B. On the sustainable development system of regional tourism. J. Chem. Pharm. Res. 2014, 6, 854–858. [Google Scholar]
  3. Gössling, S.; Peeters, P. Assessing tourism’s global environmental impact 1900–2050. J. Sustain. Tour. 2015, 23, 639–659. [Google Scholar] [CrossRef]
  4. Gössling, S. Global environmental consequences of tourism. Glob. Environ. Chang. 2002, 12, 283–302. [Google Scholar] [CrossRef]
  5. Peeters, P.; Dubois, G. Tourism travel under climate change mitigation constraints. J. Transp. Geogr. 2010, 18, 447–457. [Google Scholar] [CrossRef]
  6. Scott, D.; Amelung, B.; Becken, S.; Ceron, J.-P.; Dubois, G.; Gössling, S.; Peeters, P.; Simpson, M. Climate Change and Tourism: Responding to Global Challenges; World Tourism Organization: Madrid, Spain, 2008. [Google Scholar]
  7. Buckley, R.C. Sustainable tourism: Research and reality. Ann. Tour. Res. 2012, 39, 528–546. [Google Scholar] [CrossRef] [Green Version]
  8. Lenzen, M.; Sun, Y.-Y.; Faturay, F.; Ting, Y.-P.; Geschke, A.A. The carbon footprint of global tourism. Nat. Clim. Chang. 2018, 8, 522–528. [Google Scholar] [CrossRef]
  9. Zhang, J.K.; Zhang, Y. Tourism, economic growth, energy consumption, and CO2 emissions in China. Tour. Econ. 2020. Available online: https://journals.sagepub.com/doi/10.1177/1354816620918458 (accessed on 21 April 2020). [CrossRef]
  10. Sajjad, F.; Noreen, U.; Zaman, K. Climate change and air pollution jointly creating nightmare for tourism industry. Environ. Sci. Pollut. Res. 2014, 21, 12403–12418. [Google Scholar] [CrossRef]
  11. Zhong, L.S.; Deng, J.Y.; Song, Z.W.; Ding, P.Y. Research on environmental impacts of tourism in China: Progress and prospect. J. Environ. Manag. 2011, 92, 2972–2983. [Google Scholar] [CrossRef]
  12. Roman, M.; Niedziółka, A.; Krasnodębski, A. Respondents’ Involvement in Tourist Activities at the Time of the COVID-19 Pandemic. Sustainability 2020, 12, 9610. [Google Scholar] [CrossRef]
  13. Fermani, A.; Sergi, M.R.; Carrieri, A.; Crespi, I.; Picconi, L.; Saggino, A. Sustainable Tourism and Facilities Preferences: The Sustainable Tourist Stay Scale (STSS) Validation. Sustainability 2020, 12, 9767. [Google Scholar] [CrossRef]
  14. Scott, D.; Peeters, P.; Grössling, S. Can tourism deliver its “aspirational” emission reduction targets? J. Sustain. Tour. 2010, 18, 393–408. [Google Scholar] [CrossRef]
  15. Becken, S.; Patterson, M. Measuring national carbon dioxide emissions from tourism as a key step towards achieving sustainable tourism. J. Sustain. Tour. 2006, 14, 323–338. [Google Scholar] [CrossRef]
  16. Jones, C. Scenarios for greenhouse gas emissions reduction from tourism: An extended tourism satellite account approach in a regional setting. J. Sustain. Tour. 2013, 21, 458–472. [Google Scholar] [CrossRef]
  17. Kuo, N.-W.; Chen, P.-H. Quantifying energy use, carbon dioxide emission, and other environmental loads from island tourism based on a life cycle assessment approach. J. Clean. Prod. 2009, 17, 1324–1330. [Google Scholar] [CrossRef]
  18. Baster, J. Input-output analysis of tourism benefits: Lessons from Scotland. Int. J. Tour. Manag. 1980, 1, 99–108. [Google Scholar] [CrossRef]
  19. Briassoulis, H. Methodological issues: Tourism input-output analysis. Ann. Tour. Res. 1991, 18, 485–495. [Google Scholar] [CrossRef]
  20. Becken, S.; Simmons, D.G. Understanding energy consumption patterns of tourist attractions and activities in New Zealand. Tour. Manag. 2002, 23, 343–354. [Google Scholar] [CrossRef]
  21. Gössling, S. Sustainable tourism development in developing countries: Some aspects of energy use. J. Sustain. Tour. 2000, 8, 410–425. [Google Scholar] [CrossRef]
  22. Katircioglu, S.T.; Feridun, M.; Kilinc, C. Estimating tourism-induced energy consumption and CO2 emissions: The case of Cyprus. Renew. Sustain. Energy Rev. 2014, 29, 634–640. [Google Scholar] [CrossRef]
  23. Suna, Y.-Y.; Cadarsob, M. Tourism carbon footprint inventories: A review of the environmentally extended input-output approach. Ann. Tour. Res. 2020, 82, 102928. [Google Scholar] [CrossRef]
  24. Tabatchnaia-Tamirisa, N.; Loke, M.K.; Leung, P.S.; Tucker, K.A. Energy and tourism in Hawaii. Ann. Tour. Res. 1997, 24, 390–401. [Google Scholar] [CrossRef]
  25. Huang, Q.Y. The Research on Sustainable Development of Tourism from the Perspective of Enviornmental Cost; Nankai University: Tianjin, China, 2011. [Google Scholar]
  26. Huang, W.Y. Tourism environment cost economics interpretation. Ind. Surv. 2013, 4, 130–133. [Google Scholar]
  27. Liu, Y. Study on Environmental Cost Accounting of Tourism Industry in China; China University of Geosciences: Beijing, China, 2015. [Google Scholar]
  28. Chen, J.H.; Xie, J.H. An review of environmental costs. Times Financ. 2013, 12, 316–320. [Google Scholar]
  29. Lee, S.-C.; Oh, D.; Lee, J. A new approach to measuring shadow price: Reconciling engineering and economic perspectives. Energy Econ. 2014, 46, 66–67. [Google Scholar] [CrossRef]
  30. Jain, R.K.; Kumar, S. Shadow price of CO2 emissions in Indian thermal power sector. Environ. Econ. Policy Stud. 2018, 20, 879–902. [Google Scholar] [CrossRef] [Green Version]
  31. Wang, K.; Che, L.N.; Ma, C.B.; Wei, Y.M. The shadow price of CO2 emissions in China’s iron and steel industry. Sci. Total Environ. 2017, 598, 272–281. [Google Scholar] [CrossRef]
  32. Maethee, M.; Andrew, L.J. Estimating the Shadow Prices of SO2 and NOx for U.S. Coal Power Plants: A convex nonparametric least squares approach. Energy Econ. 2012, 34, 723–732. [Google Scholar]
  33. Lee, C.Y.; Zhou, P. Directional Shadow Price Estimation of CO2, SO2 and NOx in the United States Coal Power Industry 1990–2010. Energy Econ. 2015, 51, 493–502. [Google Scholar] [CrossRef]
  34. Färe, R.; Grosskopf, S.; Noh, D.-W.; Weber, W. Characteristics of a polluting technology: Theory and practice. J. Econom. 2005, 126, 469–492. [Google Scholar] [CrossRef]
  35. Leontief, W. The Structure of American Economy; IASP Publishing: New York, NY, USA, 1941. [Google Scholar]
  36. Leontief, W. Studies in the Structure of the American Economy; Oxford University Press: London, UK, 1953. [Google Scholar]
  37. Carnegie Mellon University Green Design Institute (CMUGDI). Economic Input-Output Life Cycle Assessment (EIO-LCA). 2002. Available online: http://www.eiolca.net (accessed on 1 January 2008).
  38. Hendrickson, C.; Horvath, A.; Joshi, S.; Lave, L. Peer reviewed: Economic input-output models for environmental life-cycle assessment. Environ. Sci. Technol. 1998, 32, 184A–191A. [Google Scholar] [CrossRef]
  39. World Input-Output Table (WIOD) Database. 2013. Available online: http://www.wiod.org/home (accessed on 9 January 2021).
  40. Deng, X.L. Path Choice for Integrative Development of China’s Tourism Industry—Based on Input-Output Analysis. Innovation 2020, 1, 42–53. [Google Scholar]
  41. Chen, H.L.; Nie, W.L. Slacks-based efficiency measures and spatial analysis for measuring the shadow price of Chinese carbon emissions. Acta Ecol. Sin. 2018, 38, 5178–5186. [Google Scholar]
  42. Du, L.M.; Hanley, A.; Wei, C. Estimating the Marginal Abatement Cost Curve of CO2 Emissions in China: Provincial Panel Data Analysis. Energy Econ. 2015, 48, 217–229. [Google Scholar] [CrossRef] [Green Version]
  43. Zhang, F.F.; Xing, J.; Zhou, Y.; Wang, S.X.; Zhao, B.; Zheng, H.T.; Zhao, X.; Chang, H.Z.; Jang, C. Estimation of abatement potentials and costs of air pollution emissions in China. J. Environ. Manag. 2020, 260, 110069. [Google Scholar] [CrossRef]
  44. Liu, J.; Chen, X.P.; Zhang, Z.L. Features and factors decomposition of carbon dioxide emission of China’s tourism industry. Resour. Ind. 2017, 19, 67–76. [Google Scholar]
  45. Liu, X.X.; Hu, X.; Zhou, H. An Analysis of the Measurement of Correlationof China’s Tourism Industry and Macroeconomic Effects—Based on the Perspective of Input-output ables in 2002 and 2007. Tour. Trib. 2011, 26, 31–37. [Google Scholar]
  46. Gössling, S.; Michael, H.C.; Peeters, P. The future of tourism: Can tourism growth and climate policy be reconciled? A mitigation perspective. Tour. Recreat. Res. 2010, 35, 119–130. [Google Scholar] [CrossRef]
  47. Dubois, G.; Peeters, P.; Ceron, J.P.; Gössling, S. The future tourism mobility of the world population: Emission growth versus climate policy. Transp. Res. Part A Policy Pract. 2011, 45, 1031–1042. [Google Scholar] [CrossRef]
  48. Høyer, K.G. Sustainable tourism or sustainable mobility? The Norwegian case. J. Sustain. Tour. 2000, 8, 147–160. [Google Scholar] [CrossRef]
  49. Eijgelaar, E.; Thaper, C.; Peeters, P. Antarctic cruise tourism: The paradoxes of ambassadorship, last chance tourism and greenhouse gas emissions. J. Sustain. Tour. 2010, 18, 337–354. [Google Scholar] [CrossRef]
  50. Lamers, M.; Amelung, B. The environmental impacts of tourism, to Antarctica. A global perspective. In Tourism and Climate Change Mitigation. Methods, Greenhouse Gas Reductions and Policies; Peeters, P.M., Ed.; NHTV: Breda, The Netherlands, 2007; pp. 51–62. [Google Scholar]
  51. Peeters, P.M. Developing a long-term global tourism transport model using a behavioural approach: Implications for sustainable tourism policy making. J. Sustain. Tour. 2013, 21, 1049–1069. [Google Scholar] [CrossRef]
  52. Campen, J.T. Benefit, Cost, and Beyond: The Political Economy of Benefit-cost analysis. Atl. Econ. J. 1986, 18, 79–88. [Google Scholar]
  53. Li, J.F.; Li, M.Y. On the calculation of tourism industry and tourism adding value. Tour. Trib. 1999, 5, 16–20. [Google Scholar]
  54. Tisdell, C.A. Foreign tourism: Benefits to China and contribution to development. In Economic Development in the Contexts of China: Policy Issues and Analysis; Tisdell, C.A., Ed.; St Martins Press: London, UK, 1993. [Google Scholar]
  55. Mike, R. Socio-economic and environmental cost–benefit analysis for tourism products—A prototype tool to make holidays more sustainable. Tour. Manag. Perspect. 2013, 8, 114–125. [Google Scholar]
  56. Dwyer, L.J.; Forsyth, P. Measuring the benefits and yield from foreign tourism. Int. J. Soc. Econ. 1997, 24, 223–236. [Google Scholar] [CrossRef]
Figure 1. Study framework (the radius of fan-shaped on the left side from small to large represent the travel agency, the tourism industry and the tourism-related industry, respectively).
Sustainability 13 00604 g001
Figure 2. Calculation processes of environmental-economic input-output model.
Sustainability 13 00604 g002
Figure 3. (a) CO2, (b) NOx, (c) SOx direct emission and direct emission intensity of tourism in China.
Sustainability 13 00604 g003
Figure 4. (a) CO2, (b) NOx, (c) SOx total emission and total emission intensity of tourism in China.
Sustainability 13 00604 g004
Figure 5. Total emission of CO2 by sector; (a) in 1995; (b) in 2009
Sustainability 13 00604 g005
Figure 6. Total emission intensity matrix of CO2; (a) in 1995 (b) in 2009 (103 g/dollar, Agriculture (A), Energy plant (EP), Industry (I), Wholesale and Retail sale (WR), Hotels and Restaurants (HR), Inland Transport (IT), Water Transport (WT), Air Transport (AT), Activities of Travel Agencies (TA), Post and Telecommunications (PT), Financial Intermediation (FI), Business Activities (BA), Other Services (OS)).
Sustainability 13 00604 g006
Figure 7. Total emission of NOx by sector; (a) in 1995; (b) in 2009.
Sustainability 13 00604 g007
Figure 8. Total emission intensity matrix of NOx (g/dollar).
Sustainability 13 00604 g008
Figure 9. Total emission of SOx by sector.
Sustainability 13 00604 g009
Figure 10. Total emission intensity matrix of SOx (g/dollar).
Sustainability 13 00604 g010
Figure 11. Environmental cost of tourism industry in China (a) for the period 1995–2009. (b) for the year 2020 and 2030.
Sustainability 13 00604 g011
Table 1. Division of economic sectors in National Input-output Table.
Sector ClassificationCodeSectorStripping Coefficient of Tourism Consumption b
Tourism-related industryAgriculturec1Agriculture, Hunting, Forestry, and Fishing0
Energy plantc8Coke, Refined Petroleum, and Nuclear Fuel0
c17Electricity, Gas, and Water Supply
Industryc2Mining and Quarrying0
c3Food, Beverages, and Tobacco
c4Textiles and Textile Products
c5Leather, Leather, and Footwear
c6Wood and Products of Wood and Cork
c7Pulp, Paper, Paper, Printing, and Publishing
c9Chemicals and Chemical Products
c10Rubber and Plastics
c11Other Non-Metallic Mineral
c12Basic Metals and Fabricated Metal
c13Machinery, Nec
c14Electrical and Optical Equipment
c15Transport Equipment
c16Manufacturing, Nec; Recycling
c18Construction
c19Sale, Maintenance, and Repair of Motor Vehicles and Motorcycles; Retail Sale of Fuel
Tourism industryWholesale and Retail Tradec20Wholesale Trade and Commission Trade, Except of Motor Vehicles and Motorcycles0.07
c21Retail Trade, Except of Motor Vehicles and Motorcycles; Repair of Household Goods
Hotels and Restaurantsc22Hotels and Restaurants0.46
Inland Transportc23Inland Transport0.15
Water Transportc24Water Transport0.15
Air Transportc25Air Transport0.40
Activities of Travel Agencies ac26Other Supporting and Auxiliary Transport Activities; Activities of Travel Agencies1
Post and Telecommunicationsc27Post and Telecommunications0.08
Financial Intermediationc28Financial Intermediation0.01
Business Activitiesc30Renting of M&Eq and Other Business Activities0.01
Other Servicesc29Real Estate Activities0.01
c31Public Admin and Defence; Compulsory Social Security
c32Education
c33Health and Social Work
c34Other Community, Social and Personal Services
c35Private Households with Employed Persons
a Activities of Travel Agencies represent the narrow definition tourism. b The stripping coefficient of tourism consumption is from the ref. [40].
Table 2. Scenario analysis.
Scenario aYearCO2 Total Emission Intensity Reduction PercentageTotal Emission Reduction PercentageAnnual Increase Rate of Tourism Consumption
NOxSOx
BAU2020as 2009as 2009as 200912%
2030as 2009as 2009as 200912%
LE2020−40%−23%−25%as BAU
2030−60%−46%−50%as BAU
ELE2020−45%−23%−25%6%
2030−65%−46%−50%6%
a Our results of 2009 (in this paper) are used as the reference year.
Publisher’s Note: MDPI stays neutral with regard to jurisdictional claims in published maps and institutional affiliations.

