Abstract
The importance of non-face-to-face tourism is growing due to the impact of COVID-19, and VR (virtual reality) is attracting attention as a solution to this need. This research investigates the antecedents of utilitarian and hedonic values based on the experience of VR tourism and identifies the relations between values and user visit intention. We performed an empirical study with data collected from 207 respondents from major VR online user communities. The results of the research show the antecedents of utilitarian value to be information access, flow, and interactivity; whereas the antecedents of hedonic value are flow, interactivity, and telepresence. Utilitarian and hedonic values both positively affect user visit intention. The results also show group differences in the relationship between research variables according to the personal degree of extraversion. These results provide key understandings to enable the adoption of the VR technology in tourism.
Keywords:
VR experience; COVID-19; tourism; utilitarian value; hedonic value; visit intention; extraversion 1. Introduction
Tourism is an important source of income and jobs in many countries. Globally, tourism accounts for around 10.3% of the world economy, contributing a record $8.9 trillion and 330 million jobs in 2019. Growth in the tourism sector (3.5%) has outpaced global GDP growth (gross domestic product) (2.5%) for nine consecutive years [1]. However, the COVID-19 outbreak has had a massive impact on the global tourism industry due to travel restrictions and a decrease in demand from travelers. Many countries have introduced restrictions in a desperate attempt to stop the spread of the virus. In the pandemic context, the growth potential of VR (virtual reality) tourism is notable. The value of VR in the tourism sector stood at USD 74.6 million in 2018 and is estimated to reach USD 304.4 million by 2023, with a CAGR (compound annual growth rate) of 32.5% [2]. VR technology development allows users to have a realistic tourism experience in their desired location. We should consider VR tourism as a powerful tool in overcoming the limits of tourism’s intangibility since consumers have the opportunity to experience tourist attractions or destinations in advance of their visit [3].
The proliferation of technology has transformed the tourism industry by affecting how tourism destinations are perceived and consumed [4]. Recently, many researchers have explored the benefits of VR in the tourism context. From a tourist’s point of view, the main benefits of VR include entertainment [5,6], accessibility, tourism experience enhancement, and availability of images and information [5,7].
The representative model to explain an individual’s acceptance of information technology is the Technology Acceptance Model (TAM), designed by Davis [8], which assesses perceived usefulness, perceived ease of use, and user acceptance. The model has limitations in explaining the richness of the user-immersive VR experience because the model is composed of simple variables that were developed more than 30 years ago. Therefore, a new research model is required that overcomes these limitations and enables investigation of the user experience of VR tourism. Also, few studies have measured individuals’ VR experience empirically. Therefore, the contribution of this study stems from its use of large-scale empirical research that targets the actual user VR tourism experience and reflects recent technological developments beyond the constraints of the TAM model. The following research questions were developed:
- What is the underlying structure of the VR tourism experience?
- Which VR experience has the most effect on tourists’ values (Utilitarian/Hedonic)?
- Can consumer values increase visit intention for the real tourist attraction or destination?
- Can the group difference in relationships between the research variables be analyzed according to the degree of extraversion?
To answer the questions above, we developed our research framework based on the dual-path model of utilitarian and hedonic values [9] that demonstrated the existence of the two value dimensions relating to consumption variables. Extending this framework to the VR tourism experience context enables utilitarian and hedonic values to be used as the starting point for finding their own antecedents. Thus, the purpose of this research is to investigate the antecedents of utilitarian and hedonic values in the VR tourism experience and to verify the relationship between consumer values and visit intention. Also, group difference is tested to investigate the relationships between variables according to the degree of extraversion.
2. Literature Review
2.1. VR Experience
VR is one of the most exciting topics in the tourism research area, given its rapid growth and variety of applications. The term “virtual reality” was coined in the mid-1970s to explain the human-computer interface [7]. Burdea and Coiffet [10] suggested that VR is a virtual representation of the actual world or of an object within it. VR uses computer technology to create a 3D simulated environment, and places users inside an immersive experience where simulating senses such as vision, touch, hearing, and smell enables them to interact with 3D worlds [11]. VR is a multi-sensory experience with real-time induced graphics, complemented by new display technologies [12]. Practitioners often use VR technologies to encourage users to explore and experience marketing stimuli prior to their actual behaviors [13].
VR experience is a kind of consumer learning process for products via virtual technology. Consumer learning is a process that changes a consumer’s behavior while processing information. Previous studies have emphasized the role of providing “information” to enhance consumer learning, reduce ambiguity, and provide motivation to consumers by creating an engaging interaction with products [14,15,16].
Virtual experience requires that users learn about products through the virtual interface and, by mitigating problems arising from the lack of real contact, enables users to experience a product realistically [17]. Thus, the VR experience is defined as a consumer learning process that functions via a 3D simulated interface and presents tangible or intangible products without real contact. With the advent of VR, the gap between real and indirect experiences is reducing.
Previous research divides VR into two groups: immersive VR and non-immersive VR [17,18]. In the immersive environment, a user is enclosed in virtual surroundings by wearing HMD (head-mounted display) equipment which provides a full 3D experience. With non-immersive VR, a user experiences a virtual world via a 2D screen. The immersive VR user interface is closer to the real-world experience and offers a multimodal information channel, which the non-immersive VR type does not [18]. Because the sense of reality provided by immersive VR is better, most recent VR studies have focused on the application of this new technology. Tourism studies are no exception, and immersive VR content based on HMD devices has been used extensively in tourism content.
2.2. VR Tourism
VR tourism has great potential in a situation where the actual experience becomes difficult to obtain due to COVID-19. Many travel agencies have been severely affected by COVID-19, as lockdowns have been imposed by many governments to limit the spread of the virus. Travelers have also been barred from many destinations. Nan [19] suggested that it is time for the tourism sector to undergo an industry-wide transformation. The players in the industry might make increasing use of technology for future operations, and VR is one of the new technologies they could consider.
The rapid growth of VR technology provides an opportunity to experience tourism even under pandemic restrictions. VR technology can bring advantages, especially to people who cannot easily travel, because the VR experience does not require actual travel. VR technology is transforming ways to travel and experience a destination. It can remove the distance barrier by providing information about a destination before tourists make travel decisions or actually visit. VR experience can create business opportunities by building destination images that inform tourists and help them prepare their plans [20]. Moreover, the visitor experience of virtually designed attractions or destinations can induce physical visits by providing a pre-visit experience of a tourist attraction or extending the previous visitor tourism experience [21].
This research investigated the various VR experience studies listed in Table 1. Many of the studies use the TAM model designed by Davis [8] as the research framework, which consists of perceived usefulness, perceived ease of use, and user acceptance. TAM is a representative model in VR studies. However, there are some limitations to explaining recent VR user experience derived from modern technology and richness of experience because TAM is composed only of simple variables. Thus, a new exploratory research model is needed to investigate how to explain the user’s VR tourism experience beyond the constraints of the TAM model. It is also needed to perform a large-scale empirical study that is proven by samples that include actual VR tourism experience.

Table 1.
VR Experience studies.
To determine the dimensions of the VR tourism experience, we referred to various studies [5,17,23,24]. We take the VR experience to be a consumer learning process for tangible or intangible products that uses 3D simulated interfaces without real contact. In consumer learning, information plays an important role. In the empirical research on the effects of VR on consumer learning, Suh and Lee [17] identified the strengths of the VR interface as media richness, interactivity, and telepresence, and analyzed how these interfaces increase consumers’ actual and perceived product knowledge. The researchers showed how consumer attitudes to products and purchase intentions differ when products are presented with VR interfaces rather than static interfaces. They showed that a minimal VR experience does not improve participants’ knowledge of products. To reflect this limitation, they suggested using “flow” as defined by Hoffman and Novak [26]; “flow” is known to increase user learning and positive experiences with a high degree of user engagement and motivation in a computer-mediated environment. Based on this research, we determined that information access, flow, interactivity, and telepresence should be the key sub-dimensions of the VR tourism experience for this study.
2.3. Dual-Path Values
Several previous studies have argued that the dual-path model is useful in explaining consumer behavior. According to the self-determination theory [27], extrinsic and intrinsic motivation determines the behavior of individuals. Extrinsic motivation means doing something that leads to specific outcomes, whereas intrinsic motivation refers to doing something due to inherent interest and enjoyment. Based on this research, we identified two value types: utilitarian and hedonic values [9]. According to their conclusion, consumer utilitarian and hedonic motivations are centered on values, and the benefits of both value types contribute by different degrees [28] to the overall goodness of consumer behavior. This research expanded these results to the VR tourism context. Therefore, we added the antecedents of utilitarian and hedonic values from the VR tourism experience context by the linkages of user visit intention and identified our research framework.
Utilitarian value comes from functional benefits, whereas hedonic value results from the fun and excitement of a consumption experience [29]. Consumers’ decisions are based on evaluation of the hedonic and utilitarian value of alternative consumption objects. Therefore, consumption behaviors are regarded as relating to utilitarian and hedonic consumer needs [28,30]. Utilitarian value is defined as an evaluation of functional benefits [31]. From the utilitarian value perspective, consumers place consumption objects on a utilitarian dimension and evaluate how useful or beneficial objects are to them [28]. Thus, consumers who have a utilitarian value perspective are task-oriented and rational in their behavior. Utilitarian value is the result of rational thinking that can be perceived through an activity. It refers to an effective, helpful, informative, and practical achievement experience that is gained through the functional and efficient benefits of an experiential activity.
Hedonic value relates to emotional factors, such as enjoyment and playfulness, rather than task completion [29,32]. Hedonic value tends to be more personal and subjective than utilitarian value [33]. Consumers measure hedonic value according to the experiential effect associated with the object. From a hedonic value perspective, consumers measure subjective experiences of pleasure, fun, and playfulness that they gain from the use of a product or service [9,29]. Thus, from a hedonic value perspective, consumers desire an enjoyable experience in the process of purchase or use.
Although utilitarian and hedonic values can be distinguished as distinct dimensions, they are not always mutually exclusive. An example is easily seen in the consumer shopping experience. Utilitarian value can be found in the experience of efficiency and ease of product acquisition, whereas hedonic value can be found in the excitement of an experience [9].
3. Hypotheses
In this section, we present hypotheses based on our research framework. Figure 1 explains the research. Based on the literature review, we have defined the VR tourism experience as “a consumer learning process via a simulated interface of tangible or intangible products without real contact”. We identified information access, flow, interactivity, and telepresence as the key variables of the VR experience in the tourism context. Hypotheses H1–H4 concern the relationship between VR tourism experience and consumer values, and H5 the relationship between consumer values and real visit intention. H6 tests the group difference in the relationship of all variables based on degrees of extraversion.
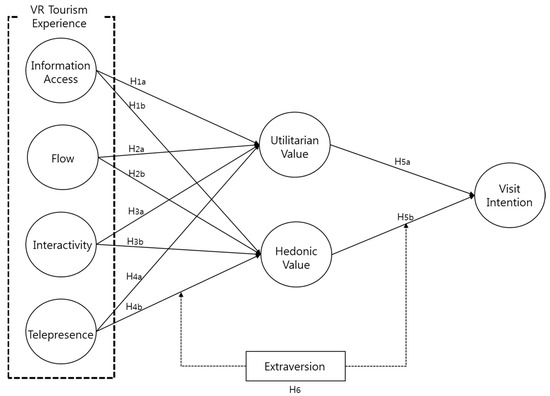
Figure 1.
Research model.
Information access reflects the consumer desire for product information and stimulates search behavior and the purchase intention for products [34]. Information access relates to the consumer information available regarding products or services in which consumers are interested. Consumers tend to access information to reduce uncertainty in making a decision [35,36]. In the tourism context, accessing information enables consumers to understand the features of a tourist attraction or destination. Therefore, information access is one of the critical factors in the VR tourism experience because VR technology can provide tourism information similar to a direct visit and remove the distance barrier facing potential tourists.
Information access increases consumers’ utilitarian value as access enables searches for product information. The utilitarian factor reflects thoughtful consideration on the part of consumers and enables them to evaluate product-related information before purchase [9]. However, we also assume that information access increases the hedonic value to consumers in the VR context, as VR uses enactive imagery and provides hedonic responsive information. Regarding this assumption, Goossens [37] suggests two propositions. First, enactive images have a greater potential to induce consumer emotional experiences and behavioral intention than non-enactive images; and second, hedonic responsive information will elicit stronger consumer emotional experiences and behavioral intentions than general stimulus information. Thus, we posit:
Hypotheses 1a (H1a).
Information access has a positive influence on consumer utilitarian value.
Hypotheses 1b (H1b).
Information access has a positive influence on consumer hedonic value.
Flow is defined as “the holistic sensation that people feel when they act with total involvement” [38] (p. 36). Although this definition is generally accepted, there are varying interpretations of the flow concept in social science. Flow is a sequence of responses related to the intrinsic enjoyment accompanying the loss of self-consciousness [26]. A flow experience includes enjoyment and time distortion with involvement and concentration during the user’s engagement [39,40]; a flow experience is mentally complete involvement and enjoyment accompanying the loss of time and space in the VR context [41]. Also, curiosity is mentioned as a dimension of flow as the general seeking of stimulation or novelty [42]; curiosity is known to play an important role in the flow experiences of web users [43]. After reviewing previous research, we define flow as being a mental state of total involvement, concentration, interest, uplifting of curiosity, and sense of time distortion during the user’s engagement in VR tourism. VR amplifies flow experience and significantly increases user satisfaction with media [24]. Consequently, flow is one of the key factors in amplifying the VR tour experience.
Studies have shown that flow can have significant effects on utilitarian and hedonic characteristics [44,45]. In various contexts, flow is related to both utilitarian and hedonic values. Flow is positively related to hedonic and utilitarian shopping experiences [46], and flow influences consumer hedonic value in the online shopping experience [47]. Research examining the flow experiences of mobile banking customers and the role of consumer continuous intention has shown that flow experience is positively influenced by both hedonic and utilitarian features [48]. Flow in a VR tourism experience elicits the flow state assumed to influence utilitarian and hedonic value. Therefore, we suggest the following:
Hypotheses 2a (H2a).
Flow has a positive influence on consumer utilitarian value.
Hypotheses 2b (H2b).
Flow has a positive influence on consumer hedonic value.
Interactivity is defined as the extent to which users can participate in modifying the form and content of a mediated environment in real-time [49]. The reason why VR is a useful tool in learning is that it utilizes the user’s body movements by interacting with a machine as they experience reality [50]. Thus, in the context of the VR experience, interactivity is defined as two-way man-machine interaction, with diverse exchanges between machine and user with timely reactions under the user’s control. Häubl and Trifts [51] found that interactivity aids e-commerce by significantly influencing consumer decision-making. Therefore, interactivity is considered to be one of the key factors in the VR tourism experience, because interactivity can assist user decision-making through sophisticated VR technologies.
Previous studies have examined the relationship between interactivity and values. In the e-retailing context, interactivity is affected by both utilitarian and hedonic values [52]. Also, interactivity has positive effects on users’ perceived value of websites [53,54]. Therefore, we propose:
Hypotheses 3a (H3a).
Interactivity has a positive influence on consumer utilitarian value.
Hypotheses 3b (H3b).
Interactivity has a positive influence on consumer hedonic value.
Presence means the sense of being in one’s physical environment, whereas telepresence is the experience of presence in a domain via a communication medium that is temporally or spatially distant from a “real” environment [49]. Therefore, telepresence means the perceived degree of the user experience which is functioning to the extent of feelings of presence in the VR experience. According to previous studies, telepresence increases product value [55] and boosts consumer intention to travel as a result of the information gained during a computer-mediated experience [56]. Thus, telepresence is a key factor in the VR tourism experience.
Telepresence positively influences the experiential value (efficacy and enjoyment) of a commercial website [53]. A sense of telepresence affects visitor evaluation of the utilitarian and hedonic performance of a destination marketing organization’s website [57]. Therefore, we propose the following:
Hypotheses 4a (H4a).
Telepresence has a positive influence on consumer utilitarian value.
Hypotheses 4b (H4b).
Telepresence has a positive influence on consumer hedonic value.
In general, perceived values influence consumer consumption decisions because consumer behavior is value-driven [28,30,58]. The perceived utilitarian and hedonic value of a destination marketing organization website affects consumer intention to visit the destination [57]. VR tourism also influences tourist decision-making when users gain pleasure from the VR experience [59], and enjoyment plays an essential role in VR tourism by increasing visit intention [3]. Furthermore, research has shown that perceived usefulness has an effect on the intention to use VR technology for travel planning [60]. Thus, we posit:
Hypotheses 5a (H5a).
Consumer utilitarian value has a positive influence on consumer visit intention.
Hypotheses 5b (H5b).
Consumer hedonic value has a positive influence on consumer visit intention.
Extraverts tend to be enthusiastic, active, and energetic. Extraverts evaluate themselves as being more pleasurably engaged in various situations around them than do introverts [61]. Extraversion is related to sociability to positive effect [62]. In this research, extraversion is defined as being sociable or outgoing, energetic, action-oriented, and enjoying frequent interaction with other people and spending time with them. Thus, we assume that there is a significant difference between groups with low and high extraversion. Thus, we propose the hypothesis:
Hypotheses 6 (H6).
The relationship between variables is different according to the degree of extraversion (high/low).
4. Research Method
4.1. Measurements
Every measure in the research model was borrowed from previous studies to ensure initial face validity and then translated and modified to fit the tourism research context. In the next step, a list of questionnaire items and constructs was sent to a group of tourism researchers to check content validity. The group members were asked to rate items on a five-point multiple Likert scale as to whether or not the items fitted the constructs. The operational definitions and items used in this research appear in Table 2. All questions were translated into Korean for the survey, and peer researchers reviewed the appropriateness of the translation.
Table 2.
Item and definition.
Next, we constructed an online survey website to facilitate the collection of data. The questions used a five-point Likert scale, where high scores indicated a high level of respondent agreement. The questionnaire included a set of background questions in order to obtain demographic data.
4.2. Sample Characteristics
According to a report by Statistica [66], the total market size of VR in the global is expected to reach USD 10.5 billion in 2019. However, detailed information on the number of VR users is not available, presumably because VR has begun to spread relatively recently, and full-scale consumer research has not yet been conducted. Statistical sampling was not possible because there is no population information on VR users, especially the number of people experiencing VR tourism content. Instead, we adopted the convenient sampling method. To obtain the right population sample, we surveyed VR online community members who enjoy frequently using VR, and the first question of the research was whether the person has experienced VR tourism content. A person who has never experienced VR tourism content was not invited to participate in the survey.
There are many VR online communities in Korea and users frequently join multiple communities. So, we determined that the VR community with the largest members could represent the group and selected the largest community as of the survey date. The survey began on 2 April 2019 and ended on 20 April 2019. There was a total of 11,252 members in the VR Internet community that we selected for the survey. Only 207 of these members responded as a result of requests for their participation through e-mail. The selected respondents answered the survey after they were reminded about the best VR tourism they had experienced. An online survey was considered appropriate for the research process because VR users mostly stay online as a matter of course. We provided incentives for encouraging participation in the survey. Respondents who completed the survey were offered a free mobile beverage coupon as a reward for participation. The sample size of this research exceeded the minimum required numbers (129 people) according to the G*Power 3.1 Program [67], with the given conditions of α = 0.05, power = 0.95, effect size = 0.15 (medium), and number of predictors = 4.
Respondent characteristics are presented in Table 3. Of the respondent group, 52.2% were male and 47.8% were female, and their average age was 33.03. The highest education level of the majority of respondents was college (78.8%). The largest income group, with a monthly income in the range 3–4 million won (about USD 2714–3891 equivalent), accounted for 23.7% of respondents.
Table 3.
Sample information.
4.3. Reliability and Validity
It is necessary to test the reliability and validity of the measures to perform the PLS-SEM test. The criteria to measure internal consistency required a Cronbach’s alpha score and a composite reliability score above 0.7 [68]. We confirmed that all indicators in Table 4 met the criteria.
Table 4.
Reliability test.
Factor analyses were performed separately for both exogenous variables and endogenous variables to test the validity of the variables in Table 5 and Table 6. This analysis adopted the principal component analysis (PCA) extraction method with a VARIMAX rotation option. In the analysis result of exogenous variables, four factors explaining 71.04% of the total variance were extracted. In the factor analysis of endogenous variables, three factors explaining 78.83% of total variance were extracted, as expected.
Table 5.
Factor analysis: exogenous variables.
Table 6.
Factor analysis: endogenous variables.
The Fornell–Larcker test was performed to check additional validity. Fornell and Larcker [69] suggested that the square root of average variance extracted (AVE) could be utilized to establish discriminant validity when the value is more substantial than other correlation values among the latent variables. In Table 7, the square roots of AVE are written in bold and are more substantial than other correlation values in the same row and column. Thus, the test results indicate that discriminant validity is established.
Table 7.
Fornell–Larcker test.
4.4. Test Results
A path model to identify the hypotheses was tested by using the PLS method. Hypotheses tests include path coefficients and t-statistics. In Table 8, an examination of the r2 value shows that the model demonstrates a substantial amount of the variance explained; the r2 values of UTIL, HEDO, and VIST are 0.568, 0.664, 0.464, respectively.
Table 8.
Analysis output.
According to the results, every relationship is accepted at the significance level of 0.05. INFO, FLOW, and INTE have positive and significant effects on UTIL. Also, FLOW, INTE, and TELE have positive and significant effects on HEDO. The causal relationships between UTL, HEDO, and VIST are shown to be significant.
4.5. Group Difference Test
A multi-group analysis based on PLS (PLS-MGA) was performed using the extraversion measurement items. The basic idea of PLS-MGA is to identify whether the variance of the path coefficients differs significantly across the sub-groups after the bootstrapping procedure [70]. For the multi-group test, all respondents were divided into two sub-groups according to the mean value of their extraversion scores. The average score of extraversion was 3.63. All respondents were classified as group 1 (low group, n = 106) when they were below average, and group 2 (high group, n = 101) when they were above average.
To find the group difference, we ran the bootstrap. In group 1, H1a, H2a, H2b, H5a, and H5b are supported, while H3a, H3b, and H4b are not supported at the significance level of 0.05. On the other hand, in group 2, every hypothesis except H1a and H4b is accepted. However, as revealed in the left column of Table 9, only two relationships (INTE → UTIL, HED → VIST) differ significantly across the two groups. To prove that the path coefficient is different across the two sub-groups, the t-value must be larger than the critical value of the t-distribution [70]. All other paths do not differ significantly except H3a and H5b.
Table 9.
Group difference analysis.
5. Conclusions
5.1. Conclusions and Implications
The results of this study have various academic and practical implications. The academic implications are as follows. First, this research performed an empirical analysis of factors affecting consumer perceived values of the VR tourism experience based on the dual-path value model. This study investigated the antecedents of consumer values (utilitarian/hedonic) among the factors affecting the VR tourism experience and proved the relationship between consumer value and visit intention. The analysis proposed that the antecedents of utilitarian value are information access, flow, and interactivity; whereas the antecedents of hedonic value are flow, interactivity, and telepresence. Also, both utilitarian and hedonic values affect user visit intention.
Second, in comparing the degree of influence, flow is the most important predictor of both utilitarian and hedonic value. This result implies that flow is the crucial factor in the VR tourism experience affecting consumer value and flow is the most potent factor with an indirect effect on visit intention. Therefore, methods for amplifying the flow state should be considered when designing VR tourism content to increase consumer utilitarian and hedonic values and to raise the probability of visit intention among users who experience VR tourism.
Third, information access and interactivity are other vital determinants influencing utilitarian value in the VR tourism context. When destination managers intend to increase consumer visit intention by providing utilitarian value, they need to consider consumer learning for easy access to information about the destination. They should also consider the seamless implementation of interactivity to minimize the gap between real tourism and indirect experience via VR because this can boost the reality in VR by using body movement.
Fourth, according to the result of testing the relationship between variables by degrees of extraversion (high/low), the intensity of the effects of interactivity on perceived utilitarian value was higher in the high extraversion group than in the low group. In the VR format, this implies that the presentation of activeness is more important to the high extraversion group. Furthermore, we found the effect of hedonic value on visit intention also to be higher in the high extraversion group. This result is because of the extravert personality, which is more enthusiastic in the high group than in the low group.
The practical implications of the study may be summarized as follows. First, the findings suggest that virtual content producers should focus on creating a flow experience because the effect of flow was found to have the most significant impact on both hedonic and utilitarian values. That is, tourism content creators could design their VR content with immersive characteristics by using attractive factors such as storytelling and gamification so that users gain a desirable experience. Given that the relationship between flow and hedonic value is much stronger than the relationship between flow and utilitarian value, VR content producers may highlight flow experience to increase the fun of the content.
Second, VR tourism content providers should focus on other attributes such as information access, interactivity, and telepresence, if they want users to become immersed in a virtual tour. However, these attributes are closely related not only to the content itself but also to the performance of the HMD device. VR tourism content providers need to secure devices with the best performance for VR through cooperation with hardware providers.
Third, since the impact of perceived hedonic and utilitarian values was found to be significant on user intention to visit the real destination, it is recommended that tourism marketers should provide active incentives for users to visit the destination after the VR experience. For example, it is possible to provide a VR content user with specific history or information on a tourist destination and consider providing a tourist discount coupon.
5.2. Research Limitations
This research has some limitations. First, even though we thoroughly investigated the consistency of the factors affecting the VR tourism experience, it remains possible that other factors affect the VR tourism experience, such as the media richness mentioned in Suh and Lee’s research [17].
Second, flow is a controversial variable among researchers because of the role and consistency of factors; the role and sub-factors of flow differ according to the research purpose. Finally, we investigated extraversion to test the degree of relationship between the variables. However, other personalities should be considered to enlarge the research spectrum.
Third, statistical sampling was not possible because there was no population information on VR users, and a convenient sampling method was used instead. We also provided a mobile beverage coupon to encourage participation in the survey. As a result, there is a limit to the generalization of the results of this study. In the future, once VR becomes more widespread, it will be necessary to calculate a statistical sample size that can represent the population and track the behavioral changes of users through the construction of user panels.
Lastly, there are limitations to online interview surveys, in that it is difficult to supervise the data gathering process. Proper interactions between researchers and respondents through face-to-face surveys will improve the accuracy of data collection. Future research may be conducted by improving these limitations.
Author Contributions
Conceptualization, W.-j.L. and Y.H.K.; methodology, W.-j.L.; validation, W.-j.L. and Y.H.K.; formal analysis, W.-j.L.; investigation, W.-j.L. and Y.H.K.; data curation, W.-j.L.; writing—original draft preparation, W.-j.L. and Y.H.K.; writing—review and editing, W.-j.L. and Y.H.K.; supervision, W.-j.L.; project administration, W.-j.L.; funding acquisition, W.-j.L. All authors have read and agreed to the published version of the manuscript.
Funding
This research received no external funding.
Institutional Review Board Statement
Not applicable.
Informed Consent Statement
Not applicable.
Data Availability Statement
Data sharing not applicable.
Conflicts of Interest
The authors declare no conflict of interest.
References
- World Travel & Tourism Council. Economic Impact Report. Available online: https://wttcweb.on.uat.co/Research/Economic-Impact (accessed on 11 November 2020).
- All the Research. Available online: https://www.alltheresearch.com/report/389/AR-VR-in-Travel-and-Tourism (accessed on 11 November 2020).
- Tussyadiah, I.P.; Wang, D.; Jung, T.H.; tom Dieck, M.C. Virtual reality, presence, and attitude change: Empirical evidence from tourism. Tour. Manag. 2018, 66, 140–154. [Google Scholar] [CrossRef]
- Huang, Y.C.; Backman, K.F.; Backman, S.J.; Chang, L.L. Exploring the implications of virtual reality technology in tourism marketing: An integrated research framework. Int. J. Tour. Res. 2016, 18, 116–128. [Google Scholar] [CrossRef]
- Guttentag, D.A. Virtual reality: Applications and implications for tourism. Tour. Manag. 2010, 30, 637–651. [Google Scholar] [CrossRef]
- Jung, T.; Lee, H.; Chung, N.; tom Dieck, M. Cross-cultural differences in adopting mobile augmented reality at cultural heritage tourism sites. Int. J. Contemp. Hosp. Manag. 2018, 30, 1621–1645. [Google Scholar] [CrossRef]
- Williams, P.; Hobson, J.S.P. Virtual reality and tourism: Fact or fantasy? Tour. Manag. 1995, 16, 423–427. [Google Scholar] [CrossRef]
- Davis, F.D. Perceived usefulness, perceived ease of use, and user acceptance of information technology. MIS Q. 1989, 13, 319–339. [Google Scholar] [CrossRef]
- Babin, B.J.; Darden, W.R.; Griffin, M. Work and/or fun: Measuring hedonic and utilitarian shopping value. J. Consum. Res. 1994, 20, 644–656. [Google Scholar] [CrossRef]
- Burdea, G.C.; Coiffet, P. Virtual Reality Technology; Wiley: Hoboken, NJ, USA, 2003. [Google Scholar]
- Bardi, J. What is Virtual Reality? [Definition and Examples]. Available online: https://www.marxentlabs.com/what-is-virtual-reality (accessed on 11 November 2020).
- Farah, M.F.; Ramadan, Z.B.; Harb, D.H. The examination of virtual reality at the intersection of consumer experience, shopping journey and physical retailing. J. Retail. Consum. Serv. 2019, 48, 136–143. [Google Scholar] [CrossRef]
- Li, M.; Mao, J. Hedonic or utilitarian? exploring the impact of communication style alignment on user’s perception of virtual health advisory services. Int. J. Inf. Manag. 2015, 35, 229–243. [Google Scholar] [CrossRef]
- Kempf, D.S.; Smith, R.E. Consumer processing of product trial and the influence of prior advertising: A structural modeling approach. J. Mark. Res. 1998, 35, 325–338. [Google Scholar] [CrossRef]
- Kim, T.; Biocca, F. Telepresence via television: Two dimensions of telepresence may have different connections to memory and persuasion. J. Comput. Mediat. Commun. 1997, 3, JCMC325. [Google Scholar] [CrossRef]
- Li, H.; Daugherty, T.; Biocca, F. The role of virtual experience in consumer learning. J. Consum. Psychol. 2003, 13, 395–407. [Google Scholar] [CrossRef]
- Suh, K.S.; Lee, Y.E. The effects of virtual reality on consumer learning: An empirical investigation. MIS Q. 2005, 29, 673–697. [Google Scholar] [CrossRef]
- Rosa, P.L.; Morais, D.; Gamito, P.; Oliveira, J.; Saraiva, T. The immersive virtual reality experience: A typology of users revealed through multiple correspondence analysis combined with cluster analysis technique. Cyberpsychol. Behav. Soc. Netw. 2016, 19, 209–216. [Google Scholar] [CrossRef] [PubMed]
- Nan, J. Under Covid-19, challenges and opportunities for hospitality and tourism industry of China. J. Tour. Hosp. 2020, 9, 1–3. [Google Scholar]
- Huang, Y.C.; Backman, S.J.; Backman, K.F. Exploring the impacts of involvement and flow experiences in Second Life on people’s travel intentions. J. Hosp. Tour. Technol. 2012, 3, 4–23. [Google Scholar] [CrossRef]
- Kim, M.J.; Hall, C.M. A hedonic motivation model in virtual reality tourism: Comparing visitors and non-visitors. Int. J. Inf. Manag. 2019, 46, 236–249. [Google Scholar] [CrossRef]
- Lee, J.; Kim, J.; Choi, J.Y. The adoption of virtual reality devices: The technology acceptance model integrating enjoyment, social interaction, and strength of the social ties. Telemat. Inform. 2019, 39, 37–48. [Google Scholar] [CrossRef]
- Hyun, M.Y.; Lee, S.; Hu, C. Mobile-mediated virtual experience in tourism: Concept, typology and applications. J. Vacat. Mark. 2009, 15, 149–164. [Google Scholar] [CrossRef]
- Kim, D.; Ko, Y.J. The impact of virtual reality (VR) technology on sport spectators’ flow experience and satisfaction. Comput. Hum. Behav. 2019, 93, 346–356. [Google Scholar] [CrossRef]
- Hudson, S.; Matson-Barkat, S.; Pallamin, N.; Jegou, G. With or without you? Interaction and immersion in a virtual reality experience. J. Bus. Res. 2019, 100, 459–468. [Google Scholar] [CrossRef]
- Hoffman, D.L.; Novak, T.P. Marketing in hypermedia computer-mediated environments: Conceptual foundations. J. Mark. 1996, 60, 50–68. [Google Scholar] [CrossRef]
- Deci, E.L.; Ryan, R.M. The general causality orientations scale: Self-determination in personality. J. Res. Personal. 1985, 19, 109–134. [Google Scholar] [CrossRef]
- Batra, R.; Ahtola, O.T. Measuring the hedonic and utilitarian sources of consumer attitudes. Mark. Lett. 1991, 2, 159–170. [Google Scholar] [CrossRef]
- Hirschman, E.C.; Holbrook, M.B. Hedonic consumption: Emerging concepts, methods and propositions. J. Mark. 1982, 46, 92–101. [Google Scholar] [CrossRef]
- Mano, H.; Oliver, R.L. Assessing the dimensionality and structure of the consumption experience: Evaluation, feeling, and satisfaction. J. Consum. Res. 1993, 20, 451–466. [Google Scholar] [CrossRef]
- Overby, J.W.; Lee, E.J. The effects of utilitarian and hedonic online shopping value on consumer preference and intentions. J. Bus. Res. 2006, 59, 1160–1166. [Google Scholar] [CrossRef]
- Hirschman, E.C. Predictors of self-projection, fantasy fulfillment and escapism. J. Soc. Psychol. 1983, 120, 63–76. [Google Scholar] [CrossRef]
- Yang, K.; Lee, H.J. Gender differences in using mobile data services: Utilitarian and hedonic value approaches. J. Res. Interact. Mark. 2010, 4, 142–156. [Google Scholar] [CrossRef]
- Anderson, K.C.; Knight, D.K.; Pookulangara, S.; Josiam, B. In fluence of hedonic and utilitarian motivations on retailer loyalty and purchase intention: A facebook perspective. J. Retail. Consum. Serv. 2014, 21, 773–779. [Google Scholar] [CrossRef]
- Jacoby, J.; Chestnut, R.W.; Fisher, W.A.; Jaccard, J.J.; Currim, I.; Kuss, A.; Ansari, A.; Troutman, T. Tracing the impact of item-by-item information accessing on uncertainty reduction. J. Consum. Res. 1994, 21, 291–303. [Google Scholar] [CrossRef]
- Moorthy, S.; Ratchford, B.T.; Talukdar, D. Consumer information search revisited: Theory and empirical analysis. J. Consum. Res. 1997, 23, 263–277. [Google Scholar] [CrossRef]
- Goossens, C. Tourism information and pleasure motivation. Ann. Tour. Res. 2000, 27, 301–321. [Google Scholar] [CrossRef]
- Csikszentmihalyi, M. Beyond Boredom and Anxiety; Jossey-Bass: San Francisco, CA, USA, 1975. [Google Scholar]
- Chen, H.; Wigand, R.; Nilan, M. Exploring Web users’ optimal flow experiences. Inf. Technol. People 2000, 13, 263–281. [Google Scholar] [CrossRef]
- Skadberg, Y.X.; Kimmel, J.R. Visitors’ flow experience while browsing a web site: Its measurement, contributing factors and consequences. Comput. Hum. Behav. 2004, 20, 403–422. [Google Scholar] [CrossRef]
- Shin, D. Empathy and embodied experience in virtual environment: To what extent can virtual reality stimulate empathy and embodied experience? Comput. Hum. Behav. 2018, 78, 64–73. [Google Scholar] [CrossRef]
- Berlyne, D.E. Conflict, Arousal and Curiosity; McGraw-Hill: New York, NY, USA, 1960. [Google Scholar]
- Pace, S.A. grounded theory of the flow experiences of Web users. Int. J. Hum. Comput. Stud. 2004, 60, 327–363. [Google Scholar] [CrossRef]
- Lowry, P.B.; Gaskin, J.; Twyman, N.; Hammer, B.; Roberts, T. Taking ‘fun and games’ seriously: Proposing the Hedonic-motivation system adoption model (HMSAM). J. Assoc. Inf. Syst. 2012, 14, 617–671. [Google Scholar] [CrossRef]
- Ozkara, B.Y.; Ozmen, M.; Kim, J.W. Exploring the relationship between information satisfaction and flow in the context of consumers’ online search. Comput. Hum. Behav. 2016, 63, 844–859. [Google Scholar] [CrossRef]
- Lim, W.M. Understanding the influence of online flow elements on hedonic and utilitarian online shopping experiences: A case of online group buying. J. Inf. Syst. 2014, 28, 287–306. [Google Scholar] [CrossRef]
- Senecal, S.; Gharbi, J.E.; Nantel, J. The influence of flow on hedonic and utilitarian shopping values. Adv. Consum. Res. 2002, 29, 483–484. [Google Scholar]
- Jamshidi, D.; Keshavarz, Y.; Kazemi, F.; Mohammadian, M. Mobile banking behavior and flow experience. Int. J. Soc. Econ. 2018, 45, 57–81. [Google Scholar] [CrossRef]
- Steuer, J. Defining virtual reality: Dimensions determining telepresence. J. Commun. 1992, 42, 73–93. [Google Scholar] [CrossRef]
- Bailenson, J. Experience on Demand: What Virtual Reality Is, How It Works, and What It Can Do; Korean Translation Copyright; East-Asia Publishing Co.: Seoul, Korea, 2019. [Google Scholar]
- Häubl, G.; Trifts, V. Consumer decision making in online shopping environments: The effects of interactive decision aids. Mark. Sci. 2000, 19, 4–21. [Google Scholar] [CrossRef]
- Yoo, W.S.; Lee, Y.; Park, J.K. The role of interactivity in e-tailing: Creating value and increasing satisfaction. J. Retail. Consum. Serv. 2010, 17, 89–96. [Google Scholar] [CrossRef]
- Chniti, N.A.; Bouslama, N. Effects of perceived interactivity on commercial web sites’ experiential value. Int. J. Innov. Sci. Res. 2015, 16, 514–525. [Google Scholar]
- Teo, H.H.; Oh, L.B.; Liu, C.; Wei, K.K. An empirical study of the effects of interactivity on web user attitude. Int. J. Hum. Comput. Stud. 2003, 58, 281–305. [Google Scholar] [CrossRef]
- Cheon, E. Energizing business transactions in virtual worlds: An empirical study of consumers’ purchasing behaviors. Inf. Technol. Manag. 2013, 14, 315–330. [Google Scholar] [CrossRef]
- Hyun, M.Y.; O’Keefe, R.M. Virtual destination image: Testing a telepresence model. J. Bus. Res. 2012, 65, 29–35. [Google Scholar] [CrossRef]
- Choi, J.; Ok, C.; Choi, S. Outcomes of destination marketing organization website navigation: The role of telepresence. J. Travel Tour. Mark. 2016, 33, 46–62. [Google Scholar] [CrossRef]
- Gutman, J. Means–end chains as goal hierarchies. Psychol. Mark. 1997, 14, 545–560. [Google Scholar] [CrossRef]
- Pantano, E.; Corvello, V. Tourists’ acceptance of advanced technology-based innovations for promoting arts and culture. Int. J. Technol. Manag. 2014, 64, 3–16. [Google Scholar] [CrossRef]
- Disztinger, P.; Schlögl, S.; Groth, A. Technology Acceptance of Virtual Reality for Travel Planning. In Information and Communication Technologies in Tourism; Schegg, R., Stangl, B., Eds.; Springer: Cham, Switzerland, 2017; pp. 255–268. [Google Scholar] [CrossRef]
- Watson, D.; Clark, L.A. Chapter 29—Extraversion and Its Positive Emotional Core. In Handbook of Personality Psychology; Hogan, R., Johnson, J., Briggs, S., Eds.; Academic Press: Cambridge, MA, USA, 1997; pp. 767–793. [Google Scholar] [CrossRef]
- Zillig, L.M.P.; Hemenover, S.H.; Dienstbier, R.A. What do we assess when we assess a big 5 trait? A content analysis of the affective, behavioral, and cognitive processes represented in big 5 personality inventories. Personal. Soc. Psychol. Bull. 2002, 28, 847–858. [Google Scholar] [CrossRef]
- McMillan, S.J.; Hwang, J.S. Measures of perceived interactivity: An exploration of the role of direction of communication, user control, and time in shaping perceptions of interactivity. J. Advert. 2002, 31, 29–42. [Google Scholar] [CrossRef]
- Novak, T.P.; Hoffman, D.L.; Yung, Y.-F. Measuring the customer experience in online environment: A structural modeling approach. Mark. Sci. 2000, 19, 22–42. [Google Scholar] [CrossRef]
- Tan, W.K.; Wu, C.E. An investigation of the relationships among destination familiarity, destination image and future visit intention. J. Destin. Mark. Manag. 2016, 5, 214–226. [Google Scholar] [CrossRef]
- Statista. Virtual reality (VR)—Statistics & Facts. Available online: https://www.statista.com/topics/2532/virtual-reality-vr (accessed on 1 December 2020).
- Faul, F.; Erdfelder, E.; Buchner, A.; Lang, A.-G. Statistical power analyses using G*Power 3.1: Tests for correlation and regression analyses. Behav. Res. Methods. 2009, 41, 1149–1160. [Google Scholar] [CrossRef] [PubMed]
- Chin, W.W. How to Write Up and Report PLS Analyses. In Handbook of Partial Least Squares. Springer Handbooks of Computational Statistics; Vinzi, V.E., Chin, W., Henseler, J., Wang, H., Eds.; Springer: Berlin/Heidelberg, Germany, 2010; pp. 655–690. [Google Scholar] [CrossRef]
- Fornell, C.; Larcker, D. Evaluating structural equation models with unobservable variables and measurement error. J. Mark. Res. 1981, 8, 39–50. [Google Scholar] [CrossRef]
- Wong, K.K. Partial least squares structural equation modeling (PLS-SEM) techniques using SmartPLS. Mark. Bull. 2013, 24, 1–32. [Google Scholar]

Publisher’s Note: MDPI stays neutral with regard to jurisdictional claims in published maps and institutional affiliations. |
© 2021 by the authors. Licensee MDPI, Basel, Switzerland. This article is an open access article distributed under the terms and conditions of the Creative Commons Attribution (CC BY) license (http://creativecommons.org/licenses/by/4.0/).