Article

The Taihang Mountain Region of North China is Experiencing A Significant Warming Trend

1
Key Laboratory of Agricultural Water Resources, Hebei Laboratory of Agricultural Water-Saving, Center for Agricultural Resources Research, Institute of Genetics and Developmental Biology, Chinese Academy of Sciences, Shijiazhuang 050021, China
2
Hebei Key Laboratory of Soil Ecology, Center for Agricultural Resources Research, Institute of Genetics and Developmental Biology, Chinese Academy of Sciences, Shijiazhuang 050021, China
3
Key Laboratory of Agro-Ecological Processes in Subtropical Region, Institute of Subtropical Agriculture, Chinese Academy of Sciences, Changsha 410125, China
4
University of Chinese Academy of Sciences, Beijing 100049, China
*
Author to whom correspondence should be addressed.
These authors contributed equally to the work.
Sustainability 2021, 13(2), 856; https://doi.org/10.3390/su13020856
Submission received: 15 December 2020 / Revised: 8 January 2021 / Accepted: 13 January 2021 / Published: 16 January 2021
(This article belongs to the Section Air, Climate Change and Sustainability)

Abstract

:
The Earth’s climate has warmed by approximately 0.6 °C over the last century, but temperature change in the Taihang Mountain region—an important transition zone in North China which functions as an ecological barrier for Beijing, Tianjin, and other big cities—is still unknown. In this study, we analyze the spatial and temporal trends in the average annual and seasonal surface air temperature in the Taihang Mountain region from 1968 to 2017. The effect of elevation, longitude, latitude, percent forestland, percent farmland, and gross domestic product (GDP) on temperature was also determined. Our results show that the Taihang Mountain has warmed by 0.3 °C/decade over the past five decades. Partitioned seasonally, average warming was 0.38, 0.14, 0.21, and 0.47 °C/decade in spring, summer, fall, and winter, respectively. Elevation and latitude were significantly negatively correlated with temperature but had no correlation with the temporal warming trend (i.e., the Z value from a Mann–Kendall test). The Z value was significantly negatively correlated with percent forestland and positively correlated with GDP, indicating that economic development has induced warming, but afforestation may reduce the rate of warming increase. Together, our results provide important insights into the rates and drivers of climate change within mountainous regions.

1. Introduction

Global warming has a significant effect on plant growth, biodiversity [1], drought [2], ecosystem services [3], and even economic inequality [4]. Based on the Intergovernmental Panel on Climate Change, a body of the United Nations, globally averaged surface temperature has increased by 0.6 ± 0.2 °C in the 20th century [5]. Global warming is caused by increased greenhouse gas emissions (e.g., CO2 and N2O). However, the trends of temperature increase are different for different regions and can exhibit high levels of noise, which has largely been removed from global temperature estimates through extensive averaging [6,7]. For example, in the Middle East region, average temperature increased by 0.07 °C/decade from 1950 to 1990 [8]. In Nepal, warming rates in Terai and the Trans-Himalayas (Jomsom) are estimated to be 0.24 and 0.29 °C/decade, respectively [9]. In Estonia, the average rise in annual air temperature was 0.1 °C/decade from 1880 to 2012 [10]. In China, the rate of temperature increase also varies by region. For example, linear trend analyses show that temperature over the Yunnan Plateau increased by 0.3 °C/decade from 1961 to 2004 [11]. In Xinjiang, temperature increased by 0.28 °C/decade from 1961 to 2005 [12]. In the Hengduan Mountain region, the temperature increased by 0.15 °C/decade from 1960 to 2008 [13]. In the Miyun Reservoir Basin, the temperature increased at a rate of 0.36 °C/decade [14]. As temperature trends can vary considerably across time and space, it is important to study regional climate changes and their influencing factors.
Not only have average annual temperatures changed, but also have seasonal temperatures changed drastically in different regions. For example, in Iran, minimum and maximum temperatures have no specific trends in winter but significant positive trends (and spatial variation among trends) in the other seasons [15]. In the Yunnan Plateau of Southwest China, a warming trend of 0.33 and 0.26 °C/decade was observed in winter and summer, respectively [11]. In the Hengduan Mountain region of China, average spring, summer, fall, and winter temperatures increased by 0.589, 0.153, 0.167, and 0.347 °C/decade, respectively [13]. Although different temperature trends have been noted in different seasons, it is apparent that most regions are experiencing warmer winters, potentially caused by snow–ice feedback and rapid greenhouse gas emissions [16,17].
Temperature is nearly always negatively correlated with elevation [18,19] and the average lapse rate is about 0.65 °C/100 m [20], although lapse rate can be highly region-dependent. Topographic relief in mountainous areas involves elevation changes that could significantly impact the spatial distribution and temporal trend of temperature changes [21,22]. Furthermore, the rate at which warming occurs can be influenced by elevation, with higher elevation regions increasing in temperature more rapidly than lower elevation regions [23]. Land use type can also influence temperature. For example, local temperature decreases in areas with land use change from bare soil to vegetation [24]. Temperature tends to be highest on bare rock, followed by built-up land, bare soil, scrubland, farm cropland, sparse vegetation, and then waterbodies. These trends can be explained by differences in heat flux, thermal conductivity and radiation, and anthropogenic influences [25]. An income–temperature analysis of 100 countries found that a 1.0 °C temperature rise would cause an estimated 3.8% drop in global gross domestic product (GDP) [26]. Furthermore, GDP is always considered as a measure of economic level. Economic development always combined with energy consumption as well as the use of fossil fuels, which inevitably leads to an increase in carbon emissions [27,28]. This, in turn, significantly influences temperature. Beside the topographical factors and GDP, land use type was also an important influencing factor of temperature. For example, farmland, in this case, dry land, was found to have an increasing rate of 0.13 °C/decade, yet the value for forestland was only 0.05 °C/decade [29]. The knowledge of the influence of land use on temperature will be crucial for gaining insights into regional climate changes and potential mitigation actions.
The Taihang Mountain region is located in North China and is an important transition zone between the Loess Plateau and the North China Plain [30]. In the Loess Plateau, average annual temperature increased by 1.91 °C from 1961 to 2010 [31]. In Shanxi Province (west of the Taihang Mountain region), average annual temperature increased by 1.20 °C from 1959 to 2008 [32]. In the Beijing–Tianjin–Hebei region (east of the Taihang Mountain region), the average warming rate was 0.35 °C/decade from 1976 to 2005 [17]. Although these studies were conducted in the regions near Taihang Mountain, there is still little information available about this transition zone. Knowing the spatial and temporal trends in this transition zone is helpful in weather forecasting water regulation, and even land use management. Some studies on Taihang Mountain have reported significant increases in annual temperature, but most focused on a relatively small area of the mountain. For instance, temperature increased by 0.5 °C/decade between 1960 and 2012 in a typical basin on the northern of side of the Taihang Mountain region [33]. While ample weather stations exist in the Taihang Mountain region, the amount of data available makes it difficult to produce widespread (and long-term) temperature trends. Moreover, the effect of elevation, land use, and human activity on warming in this region remains unclear.
In this study, we analyzed the available temperature data from weather stations across the Taihang Mountain region of North China to assess warming trends across space and time and to relate trends to geographic and anthropogenic variables. Specifically, our objectives were to: (1) assess the spatial distribution of temperature, (2) analyze temporal trends in temperature, and (3) determine the effects of elevation, land use, and GDP on temperature. The goal of this research was to provide a clearer picture of the nature and drivers of climate change in this region.

2. Materials and Methods

2.1. Site Description

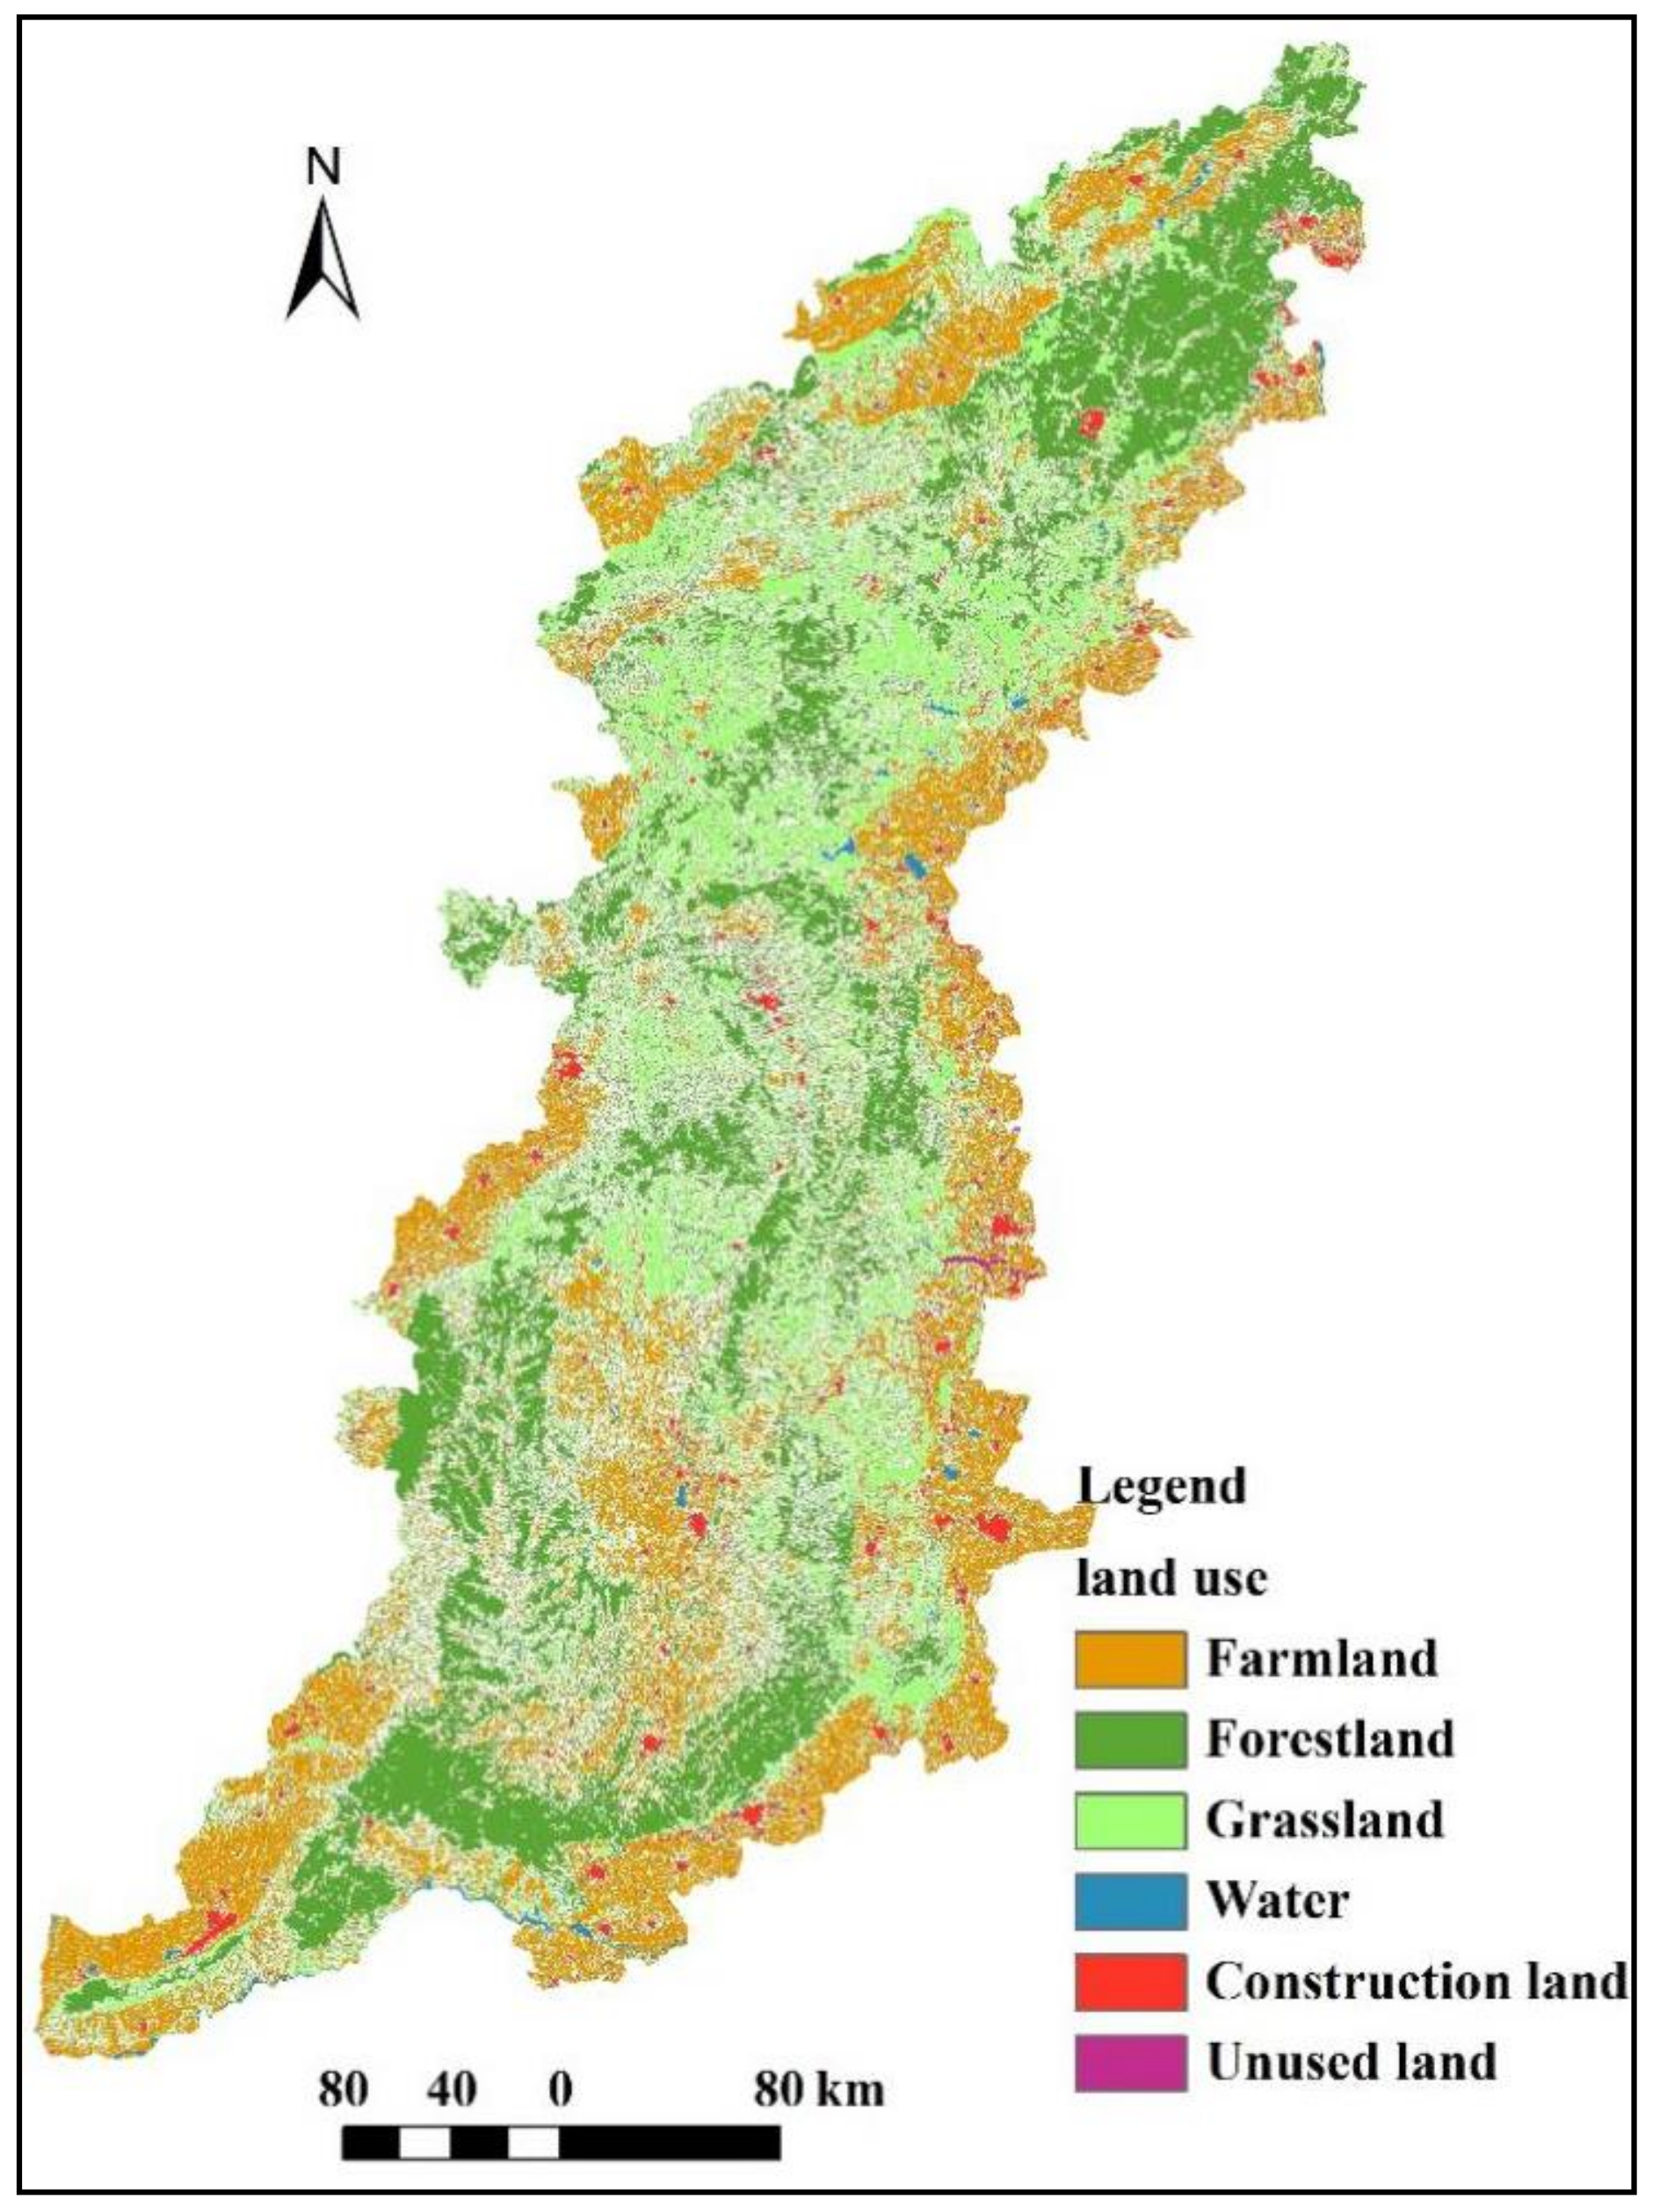
The Taihang Mountain region is located in North China and is a geographical divide between the Loess Plateau and the North China Plain (Figure 1a). The region has an area of 130,000 km2, with a northwest–southeast width of approximately 160 km and northeast–southwest length of approximately 800 km. The elevation decreases drastically from the northwest to the southeast, with the highest elevation in Wutai County. The region has a semi-humid continental monsoon climate, with a cold winter and hot summer. Summer heat tends to co-occur with monsoon rains. There are four distinct seasons in the study area: spring (March to May), summer (June to August), fall (September to November), and winter (December to February). July has the highest and January the lowest temperature. This mountain region covers 101 counties and four provinces, including Beijing, Hebei, Shanxi, and Henan. Many of the counties have experienced rapid development in the past 50 years. Based on 2015 data, the average GDP across all 101 counties is 16.75 billion yuan, with the highest (90.2 billion yuan) being Changping in Beijing and the lowest (2.16 billion yuan) being Shunping in Shanxi Province. The land use type is mainly farmland (35%), forestland (29%), and grassland (26%).

2.2. The Flowchart of This Study

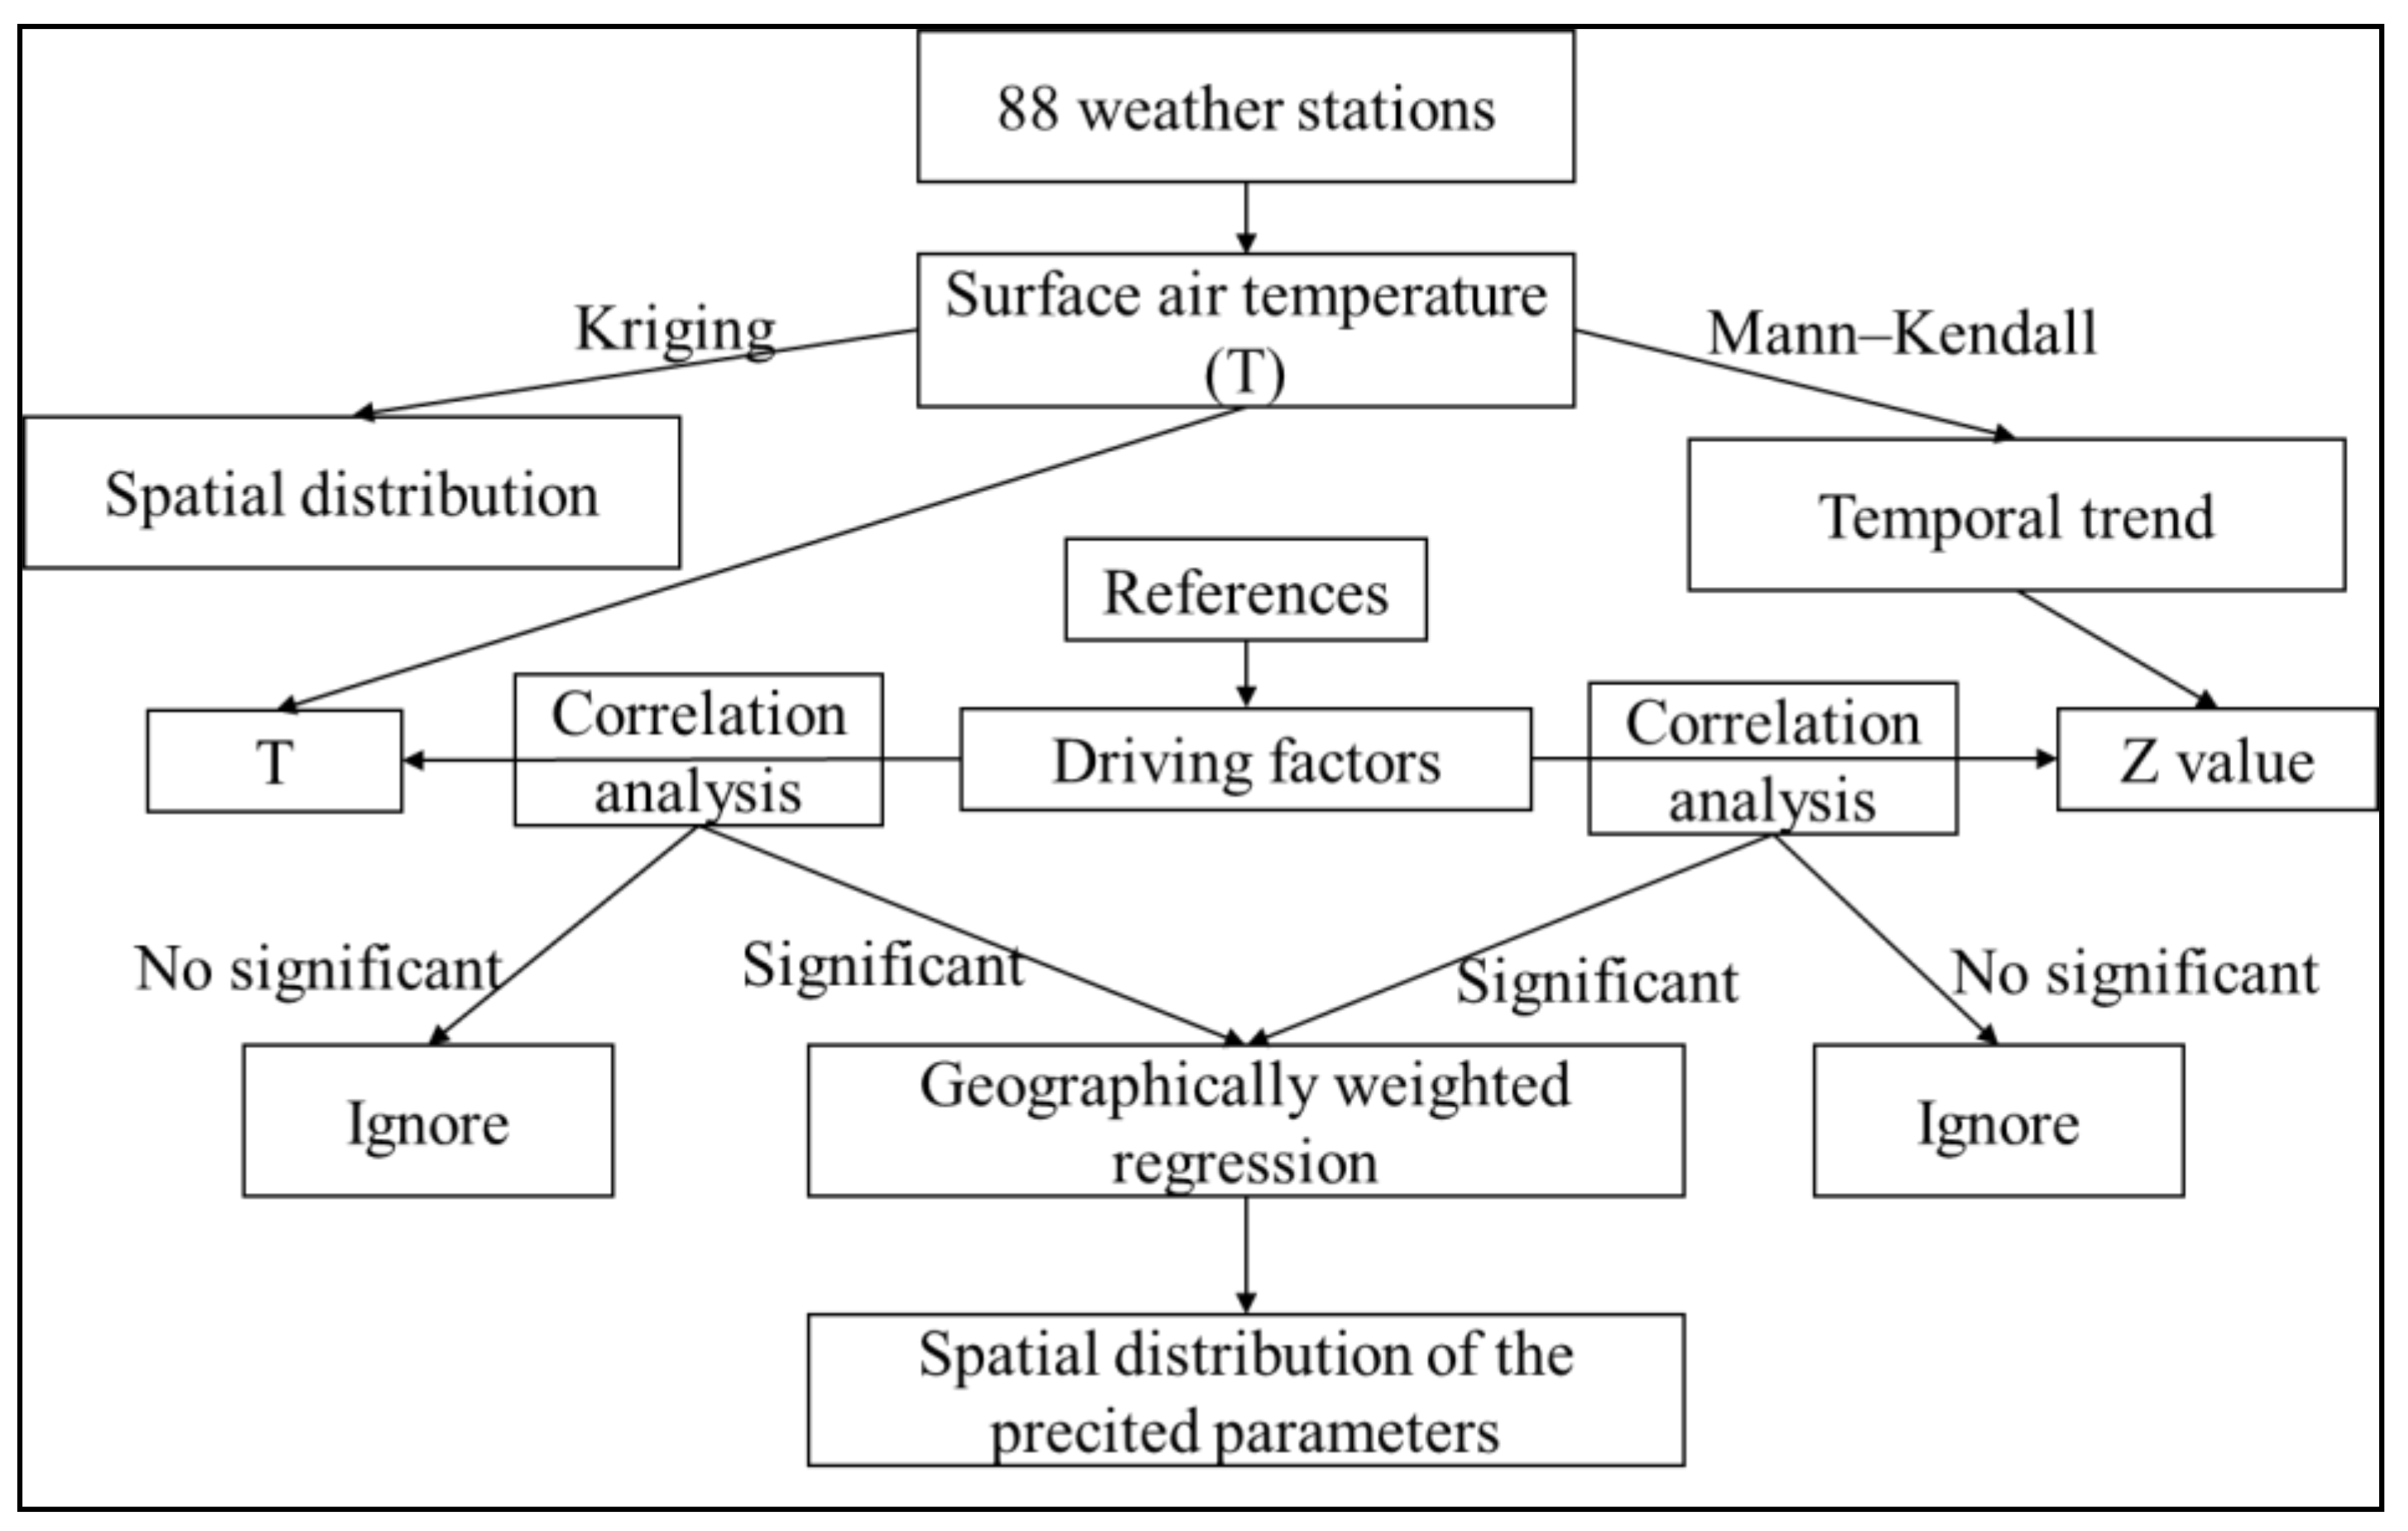
The detail steps of this paper is shown by a flowchart (Figure 2). Surface air temperature from 88 weather stations in Taihang Mountain region were analyzed (Figure 1b). The data spanned 50 years (1968–2017) and represents time intervals of 10 days for some stations and one month for others. The Kriging method was used to analyze the spatial distribution of temperature, and Mann–Kendall (MK) test was used in the analysis of temporal trend of temperature. The Z value in the MK test was used to represent the trend. The driving factors were selected based on previous studies. Natural factors and human factors are two important aspects that influence the spatial and temporal trend of temperature. In a mountainous region, latitude, longitude and elevation are the three most important geographical factors that affect temperature [23,31]. Therefore, these factors were chosen for the flowing analysis. For the human factors, it has been proven that increases in the greenhouse gas emissions can significantly influence temperature. GDP is a comprehensive factor for regional economic development and has a close relationship with greenhouse gas emission [28]. Therefore, GDP was chosen as a factor in this study. Land use type may also significantly correlate with greenhouse gas. Forestland may decrease greenhouse gas emissions, but farmland may increase them [34]. Moreover, forestland and farmland were the main land use types in the study are, accounting for about 65% (Figure 3), which is why these factors were chosen. A correlation analysis between the temperature and temperature trend (Z value in the MK test) and the selected factors was conducted. The factors that significantly correlated with temperature and Z value are used in the geographically weighted regression (GWR) analysis to show the spatial distribution of predicted value and the local coefficient of determination (R2).

2.3. Data Source and Analysis Software

Elevation data were derived from Advanced Spaceborne Thermal Emission and Reflection Radiometer Global Digital Elevation Model (30 m resolution), developed by the Japanese Ministry of Economy, Trade, and Industry and the United States National Aeronautics and Space Administration [35]. Information on GDP was obtained from the statistical yearbooks of the four provinces. Finally, land use data were obtained from the Landsat Thematic Mapper image for 2015, which was visually interpreted [36].
Spatial distributions of average annual and seasonal temperatures for the 50-year period were drawn in ArcMap 9.3 using the Kriging interpolation method. The effects of land use type, GDP, longitude, latitude, and elevation on temperature were analyzed using correlation analysis in SPSS 22.0 [25]. The temporal trend in temperature change was tested for significance using an MK test [37]. Geographically weighted regression was also done in ArcMap 9.3.

2.4. Mann–Kendall Tests

Mann–Kendall, abbreviated as MK, tests are widely used to test the significance of temporal trends in temperature. In the MK test, a statistical value (Z) indicates whether a trend is increasing (positive Z value) or decreasing (negative Z value). Based on this method, the null hypothesis is that the investigated time series is steady for a number (n) of independent and random elements [37,38]. For the time series of x1, x2, …, xn, Z is calculated as
Z = S 1 / q ( S > 0 ) 0 S = 0 S + 1 / q ( S < 0 )
where q is calculated as in Equation (2) and S as in Equation (3):
q = n n 1 2 n + 5 / 18
S = i = 2 n j = 1 i 1 s i g n X i X j .
The sign function used in Equation (3) is calculated as in Equation (4),
s i g n X i X j = 1 ( X i X j > 0 ) 0 ( X i X j = 0 ) 1 ( X i X j < 0 )
When |Z| > 1.98, the trend is significant at the p < 0.01 significance level. When |Z| > 1.67, the trend is significant at the p < 0.05 significance level. The MK test can also be used to determine specific years that experienced abrupt changes in climate using two functions, CF and CB, defined as:
C F = D k E D k / v a r D k ,
C B = C F
In these two functions, Dk is the test statistic and is calculated as
D k = i = 1 k m i 2 k n ,
m i = 1 ( x i x j > 0 ) 0 x i x j 0 j = 1   to   i .
In Equation (5), E(Dk) is the excepted value of Dk and var(Dk) is the variance of Dk. If CF exceeds the confidence line (y = 1.98 for p < 0.01 and y = 1.67 for p < 0.05), it indicates a significant increasing trend in the time series. Otherwise, it indicates a decreasing trend. If a significant trend is found and the intersection point of CF and CB is between the two confidence lines, this point can be considered a year that experienced an abrupt change in climate [38].

2.5. Geographically Weighted Regression

The GWR method is a local regression method, which always act as an extension of global regression method [39]. The global regression model can be expressed by Li et al. (2010) [40]:
P m = a 0 + n a n O m n + e m
In the formula, Pm is the dependent variable, Omn is the independent variable, a0 is the intercept, am is the slope coefficient for nth independent variable, and en is the random error. For the GWR, location information for each point is added to the model:
P m = a 0 u m , v m + n a n u m , v m O m n + e m
In Equation (10), (um, vm) means the coordinates of the mth point, em means the random error at point m, a0 and an are the efficient to be estimated. GWR method estimates parameters based on the distance between the predicted and observed values. The closer the observed points to the predicted point, the higher weight than the one far from it in the estimation.

3. Results

3.1. Spatial Distribution of Annual and Seasonal Temperature

The average annual temperature was 11.41 °C in the Taihang Mountain region from 1968 to 2017 (Table 1), with the lowest temperature being 10.22 °C in 1984 and the highest being 12.51 °C in 2017. The coefficient of variation (CV) of temperature across the 50-year recording period was 5.21%, indicating a weak variation. A significant difference in average temperature was found among the four seasons, with hot summers (23.81 °C) and cold winters (−2.35 °C). The CV for winter (50.5%) was much higher than that of other seasons (2.42–7.39%), indicating that temperature varied more extensively in the winter relative to other seasons.
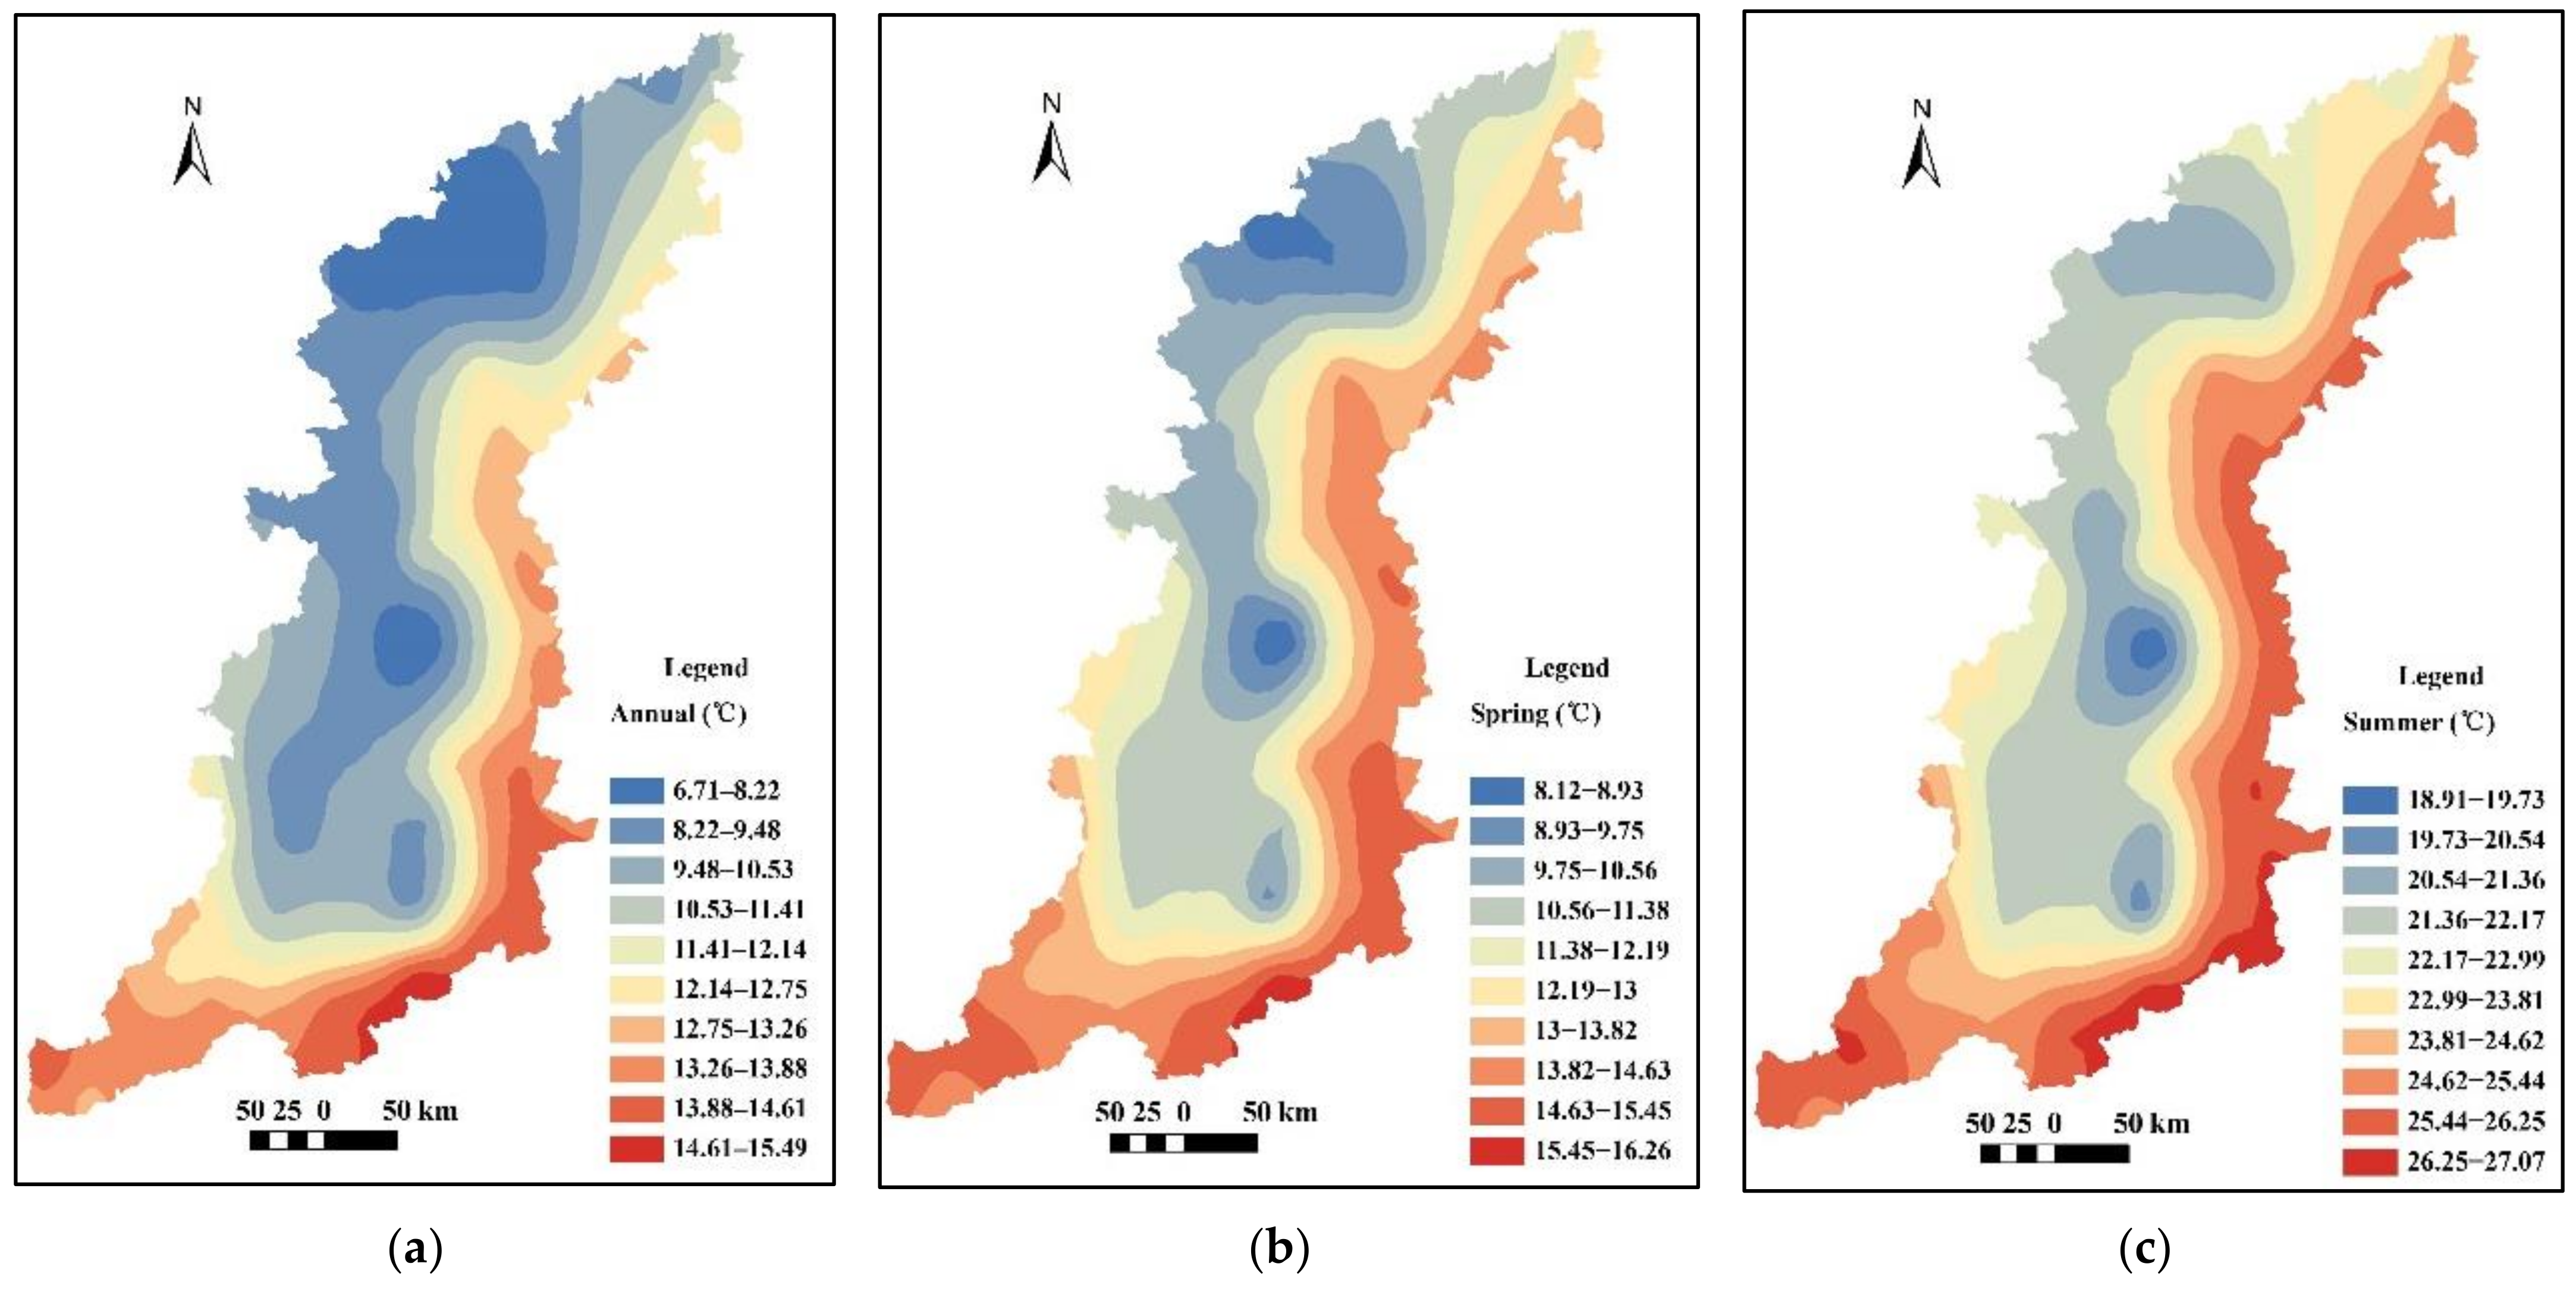
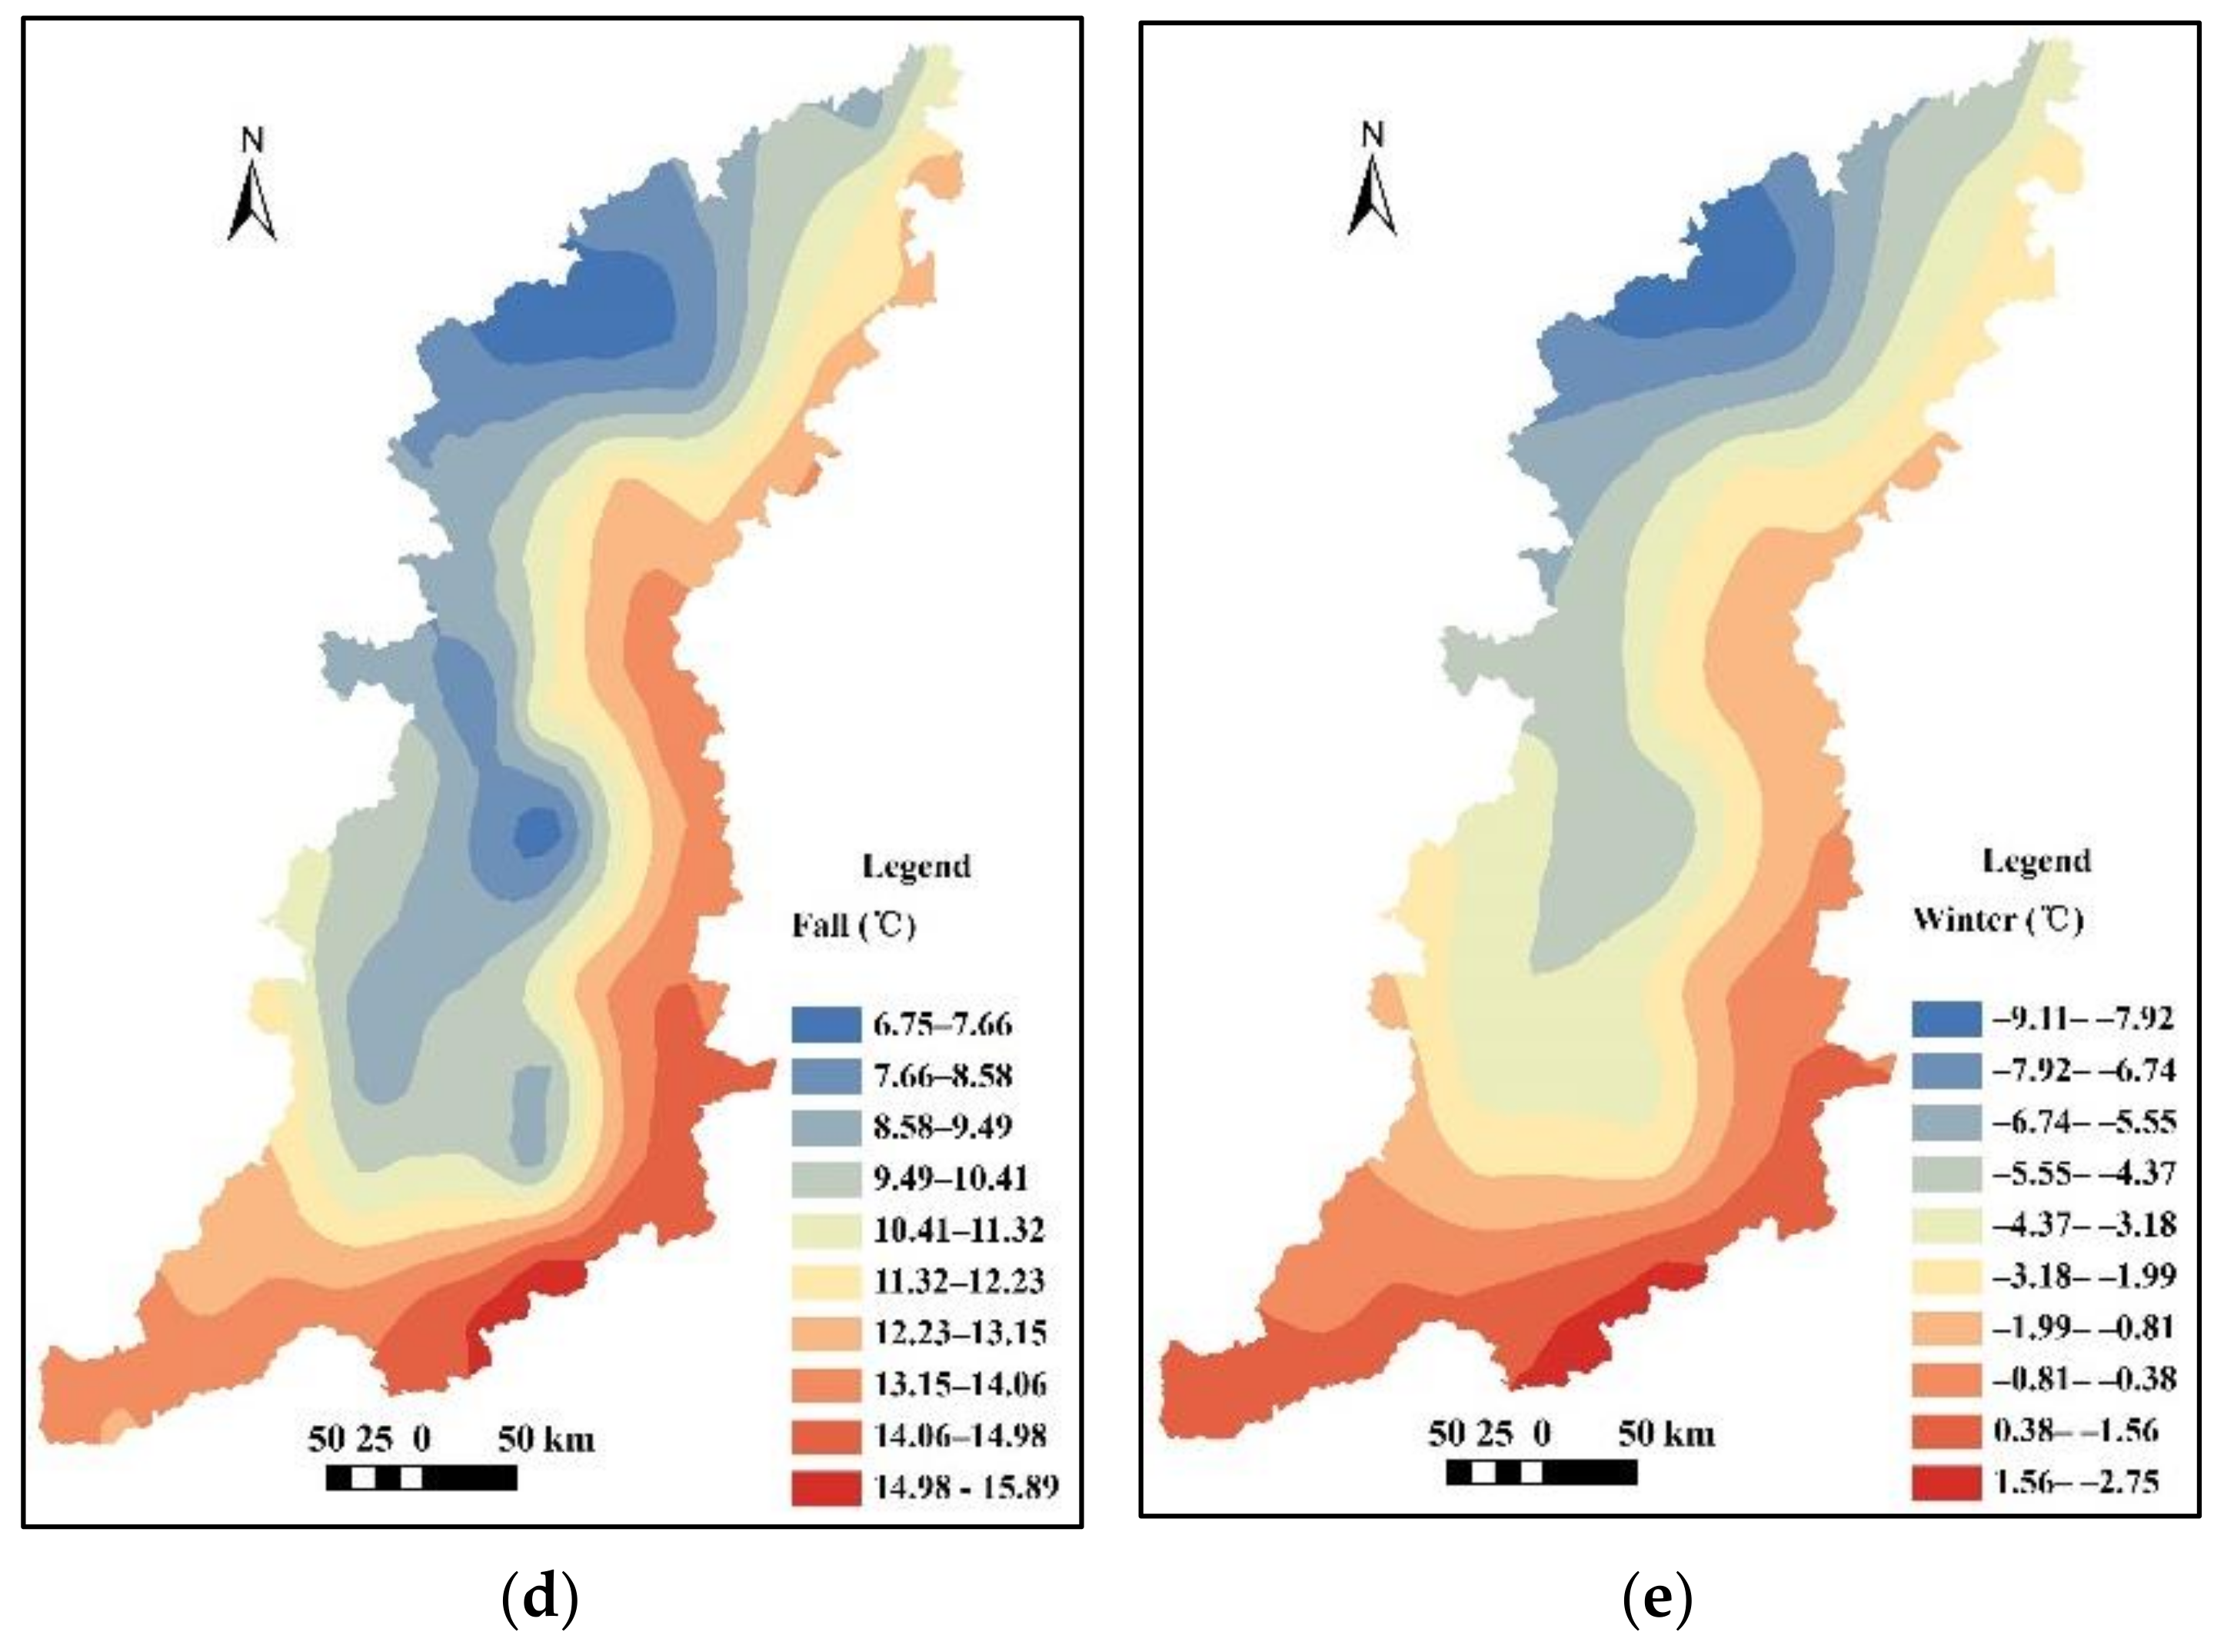
In general, the average annual temperature decreased from the southeast to the northwest (Figure 4a), with the highest (15.5 °C) at the Jiaozuo weather station in Henan Province and the lowest (6.7 °C) at the Hunyuan weather station in Shanxi Province. The spatial trends in temperature were similar for the four seasons (Figure 4b–e). However, temperature was more homogeneous in winter than the other seasons. Compared the results with Table 1, it is evident that winter temperature was homogeneous in space, but heterogenous in time.

3.2. Annual and Seasonal Temperature Trends

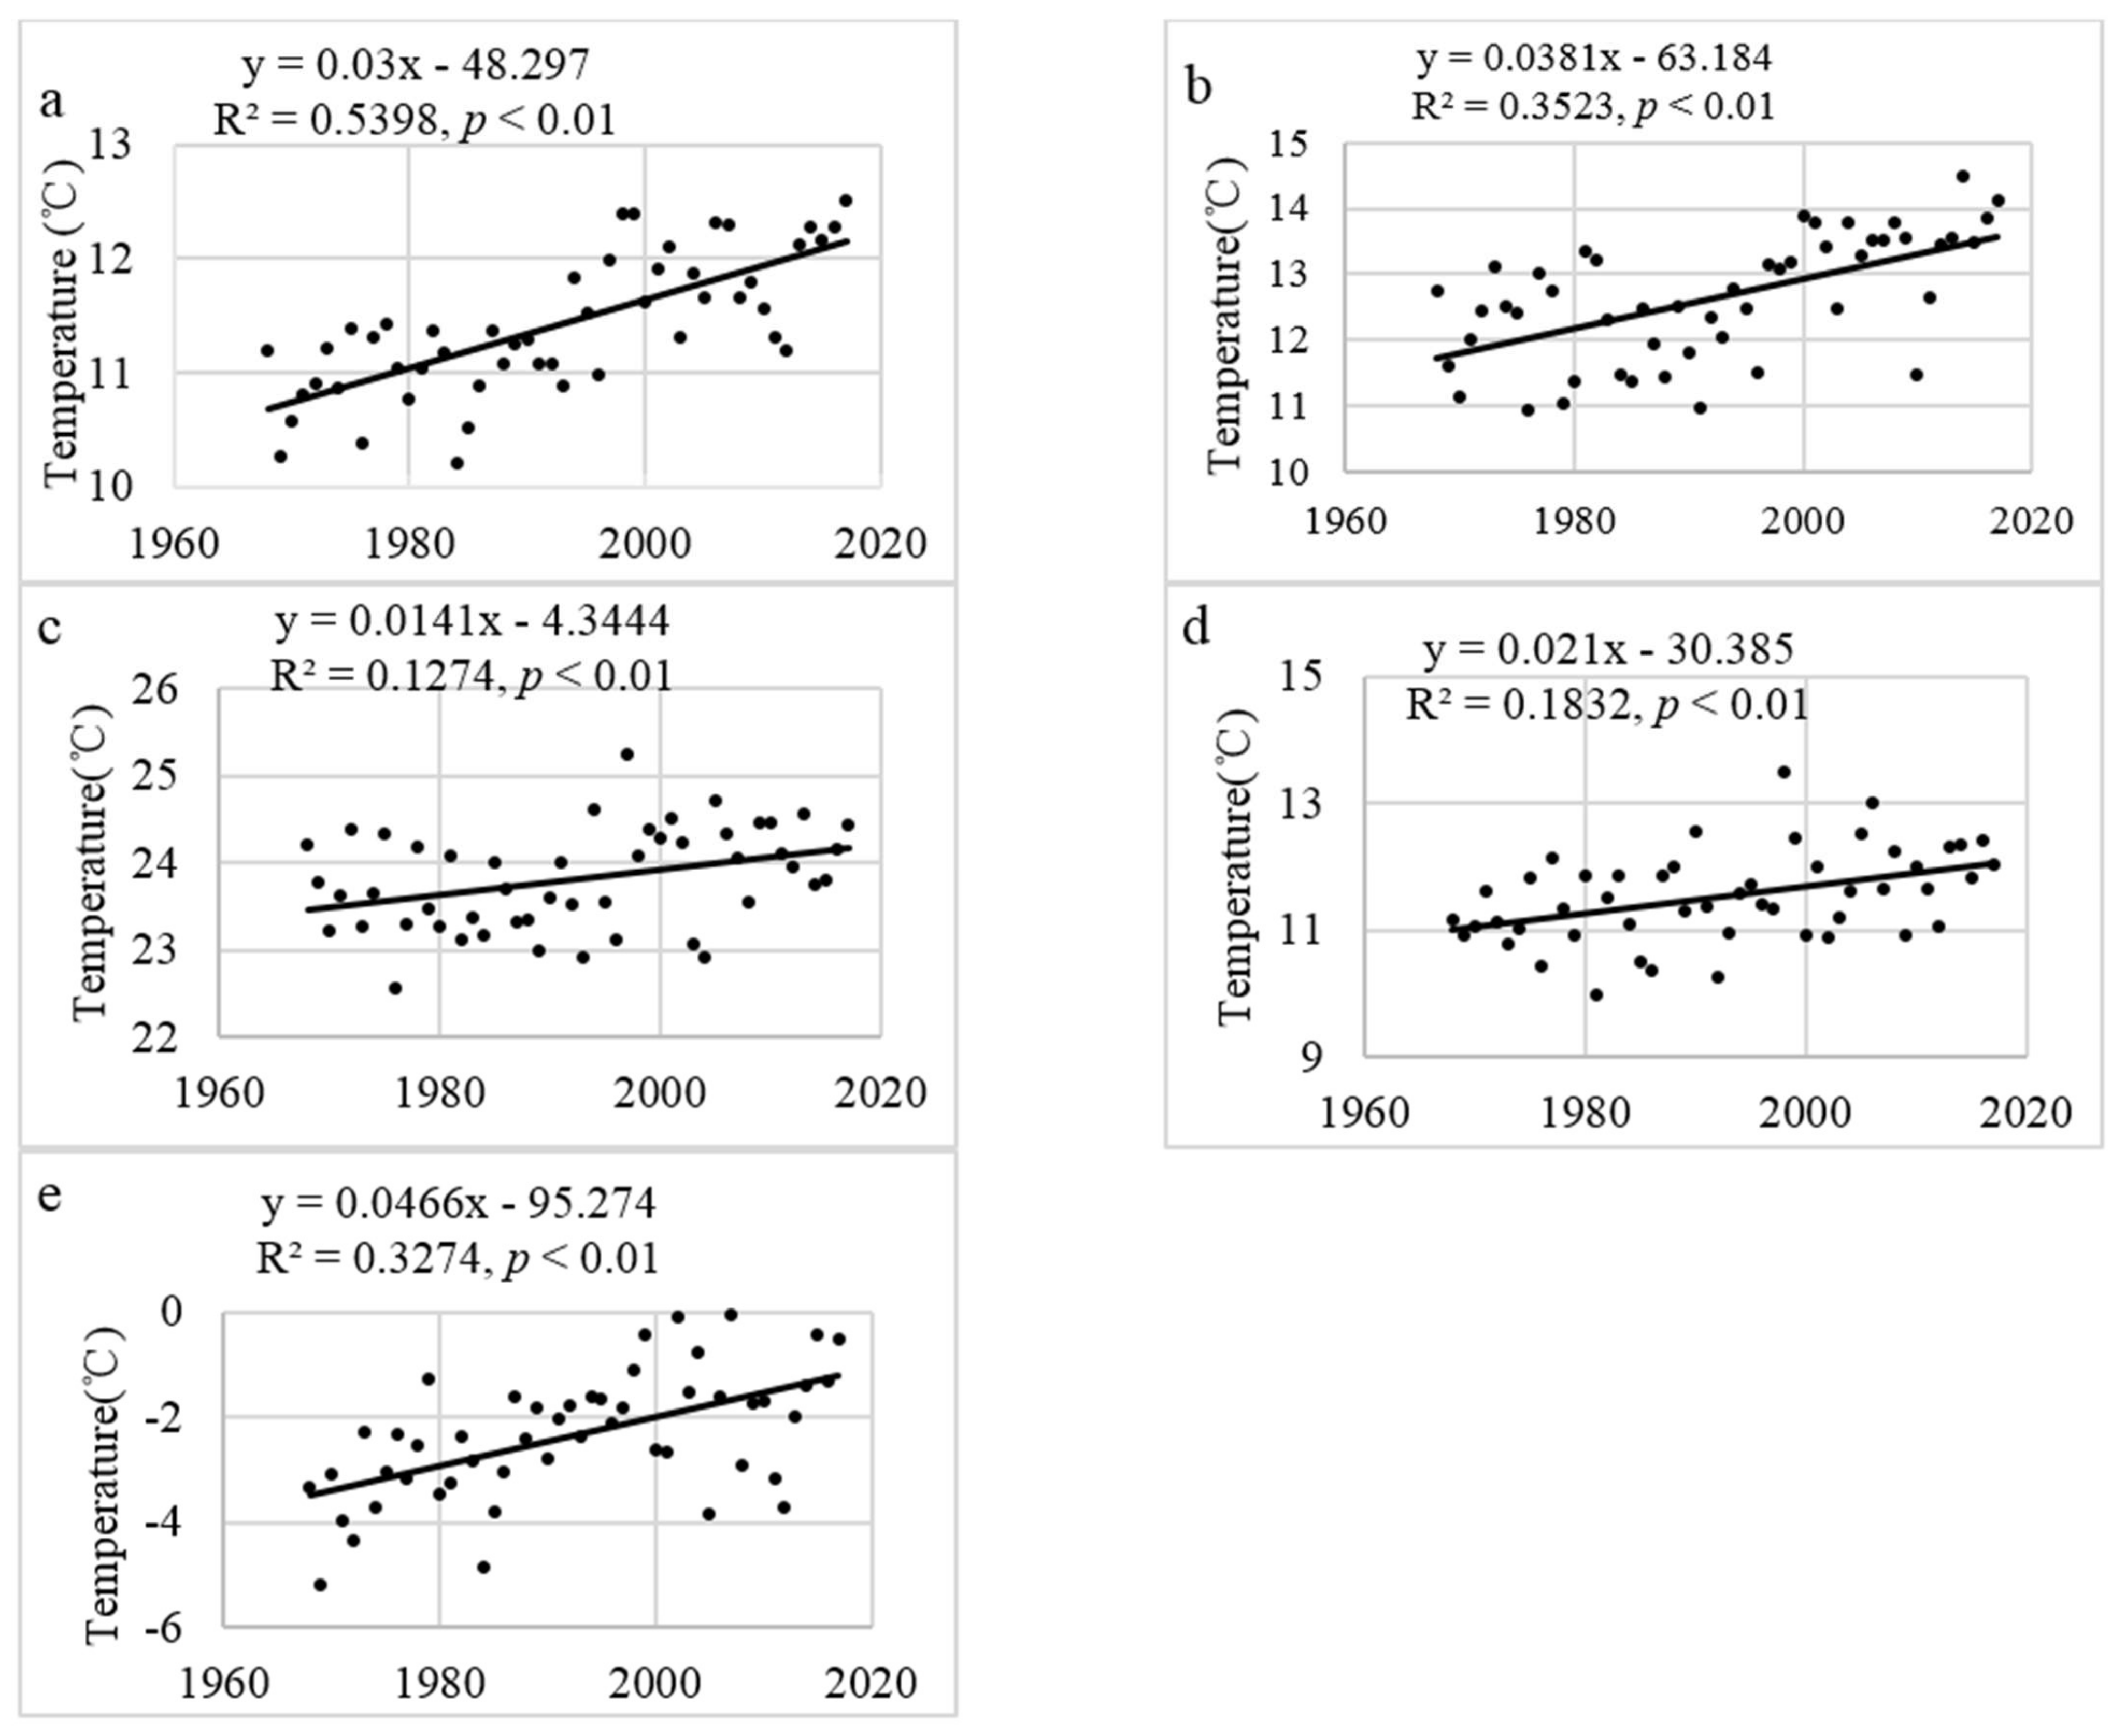
The average annual temperature increased significantly from 1968 to 2017 (R2 = 0.56, p < 0.01; Figure 5a). This suggests that temperature in the Taihang Mountain region increased by 0.03 °C/year, which is a severe degree of warming. Although all four seasons experienced significant warming, the degree of warming varied (Figure 5b–e). The season that experienced the most warming was winter (0.047 °C/year), followed by spring (0.038 °C/year), fall (0.021 °C/year), and then summer (0.014 °C/year). Thus, the temperature increase occurred mostly in spring and winter in the Taihang Mountain region. The coldest winter was in 1968 (with an average temperature of −5.20 °C) and the hottest winter was in 2007 (−0.03 °C). The hottest summer was in 1997 (25.25 °C) and the coldest in 1976 (22.55 °C).

3.3. Mann–Kendall Test of Annual and Seasonal Temperature Trends

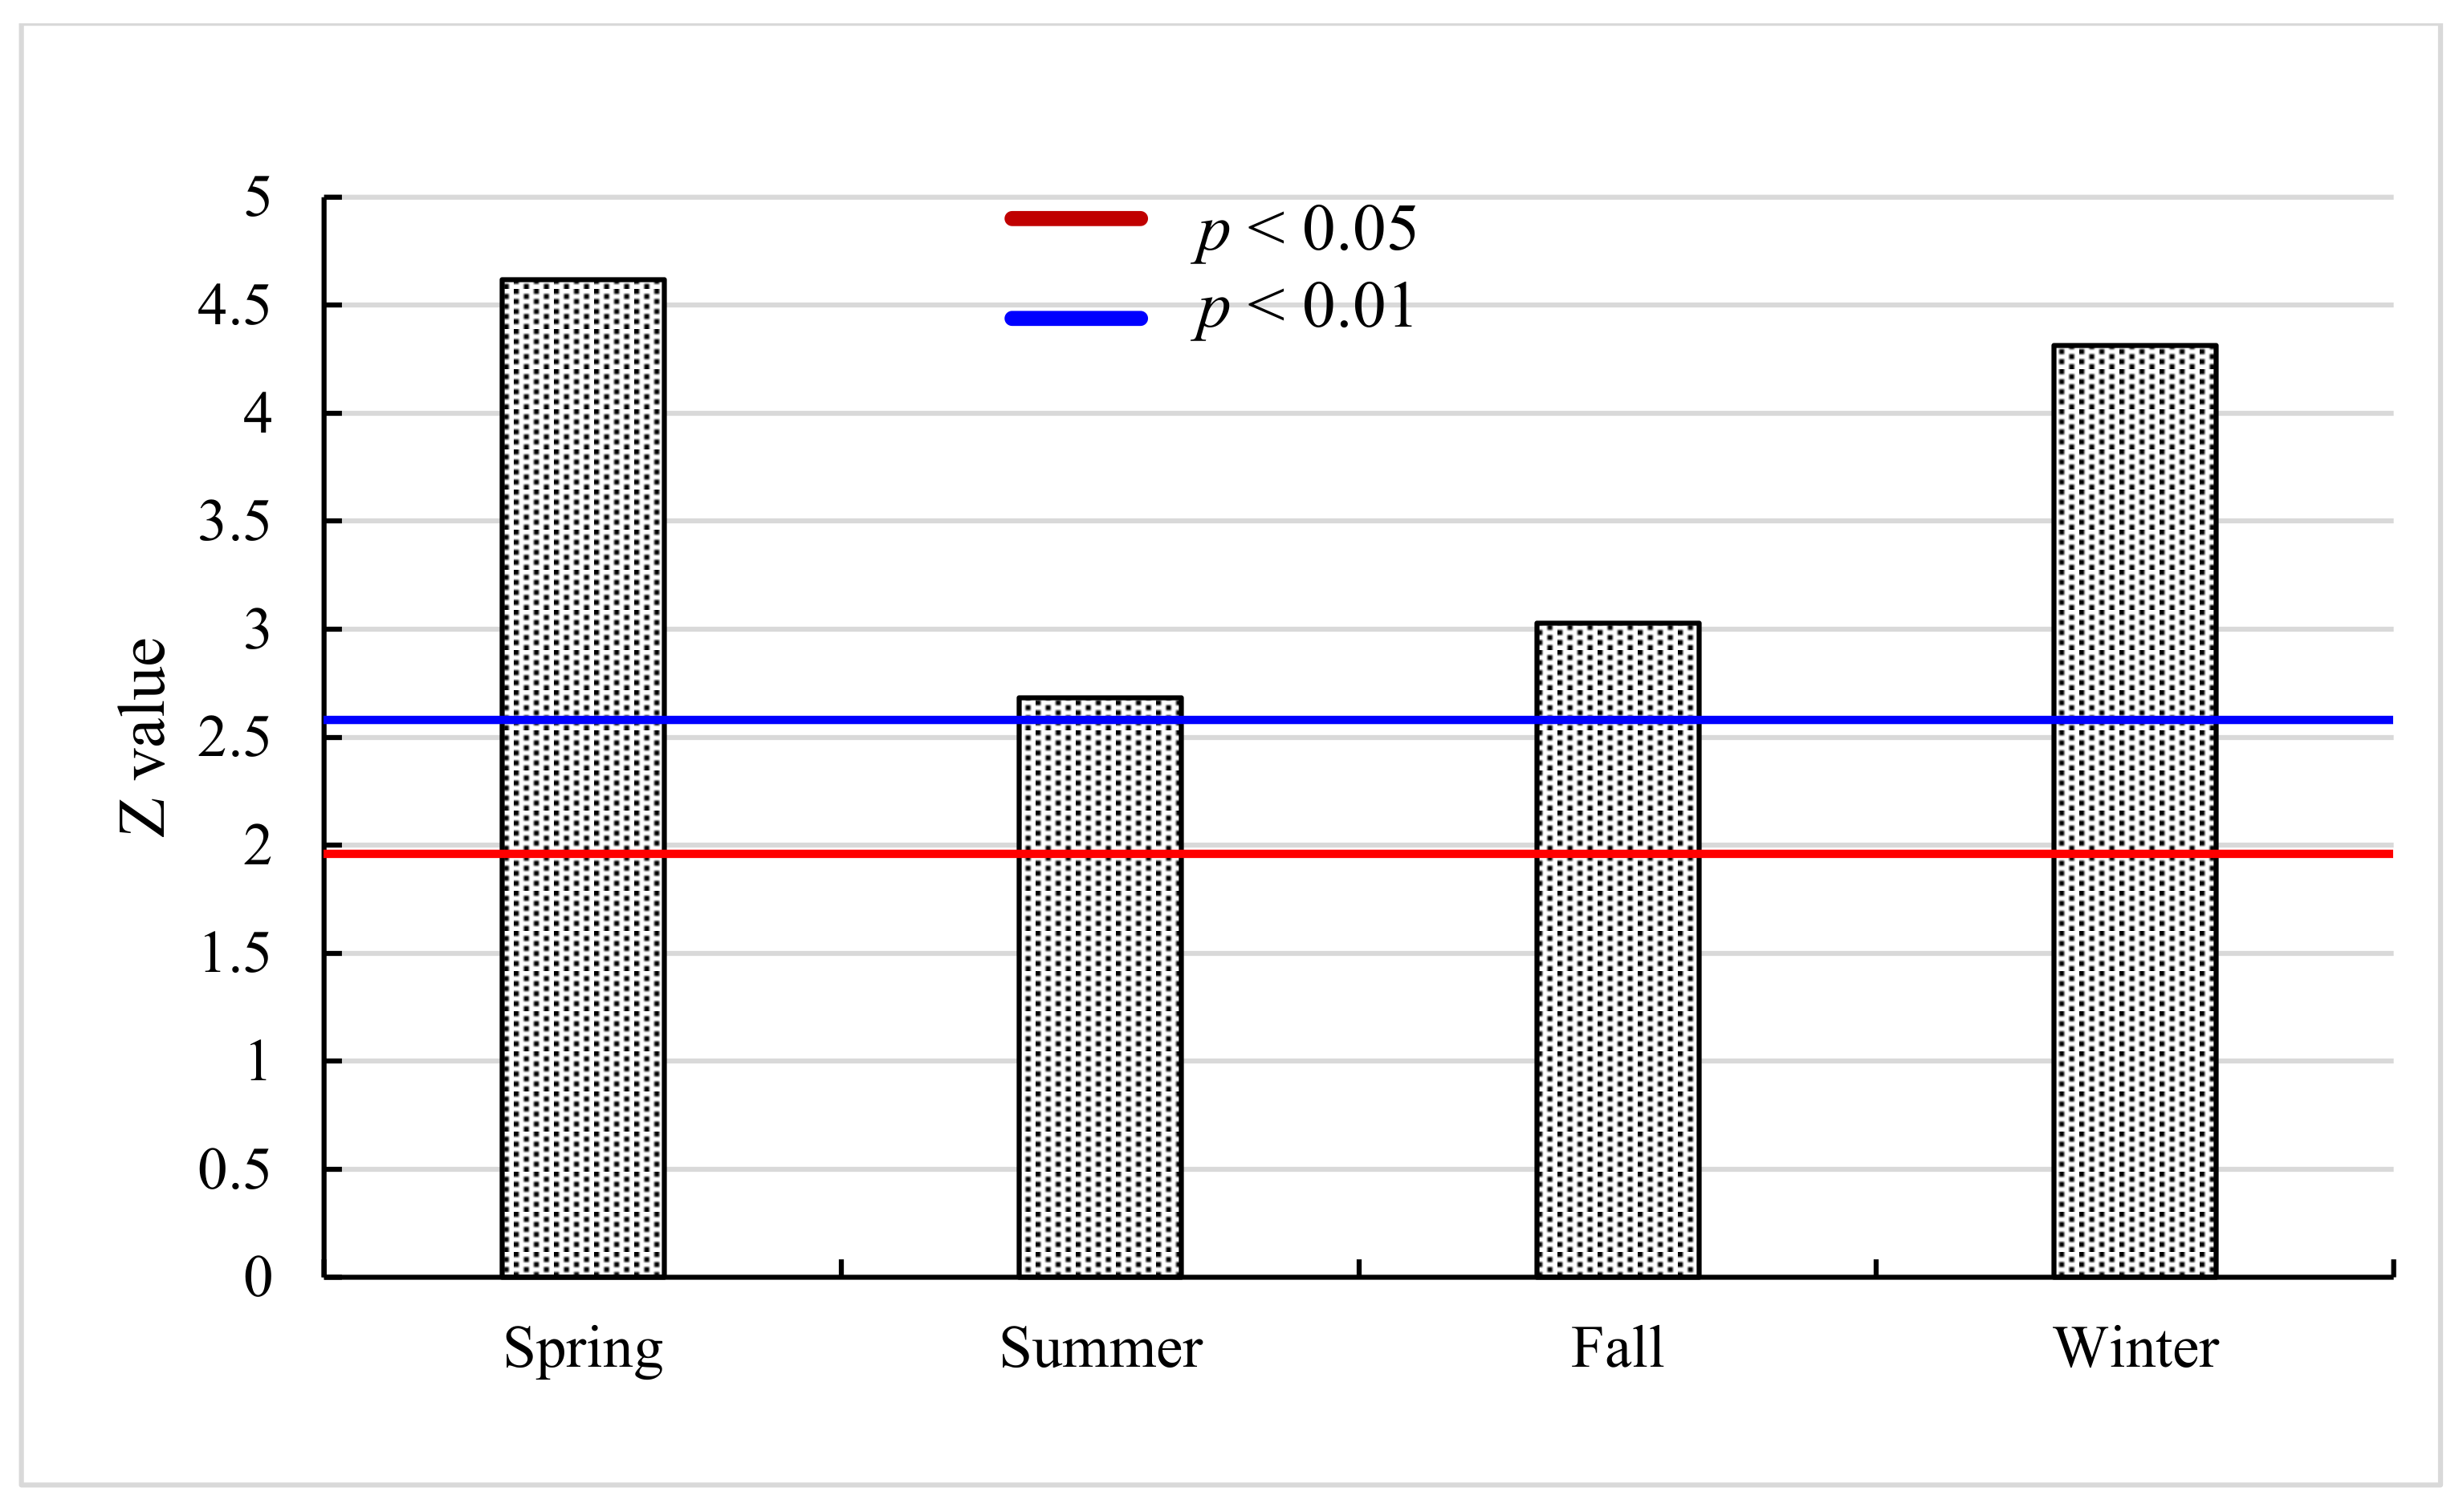
The MK test produced Z values that were 4.62, 2.69, 3.03, and 4.32 for spring, summer, fall, and winter, respectively (Figure 6). The Z values for spring and winter were much higher than for summer and fall, indicating that spring and winter experienced more significant warming in the study area. Although the Z values varied by season, all the seasons showed significant warming trends at the p < 0.01 level, with Z values higher than 2.56.
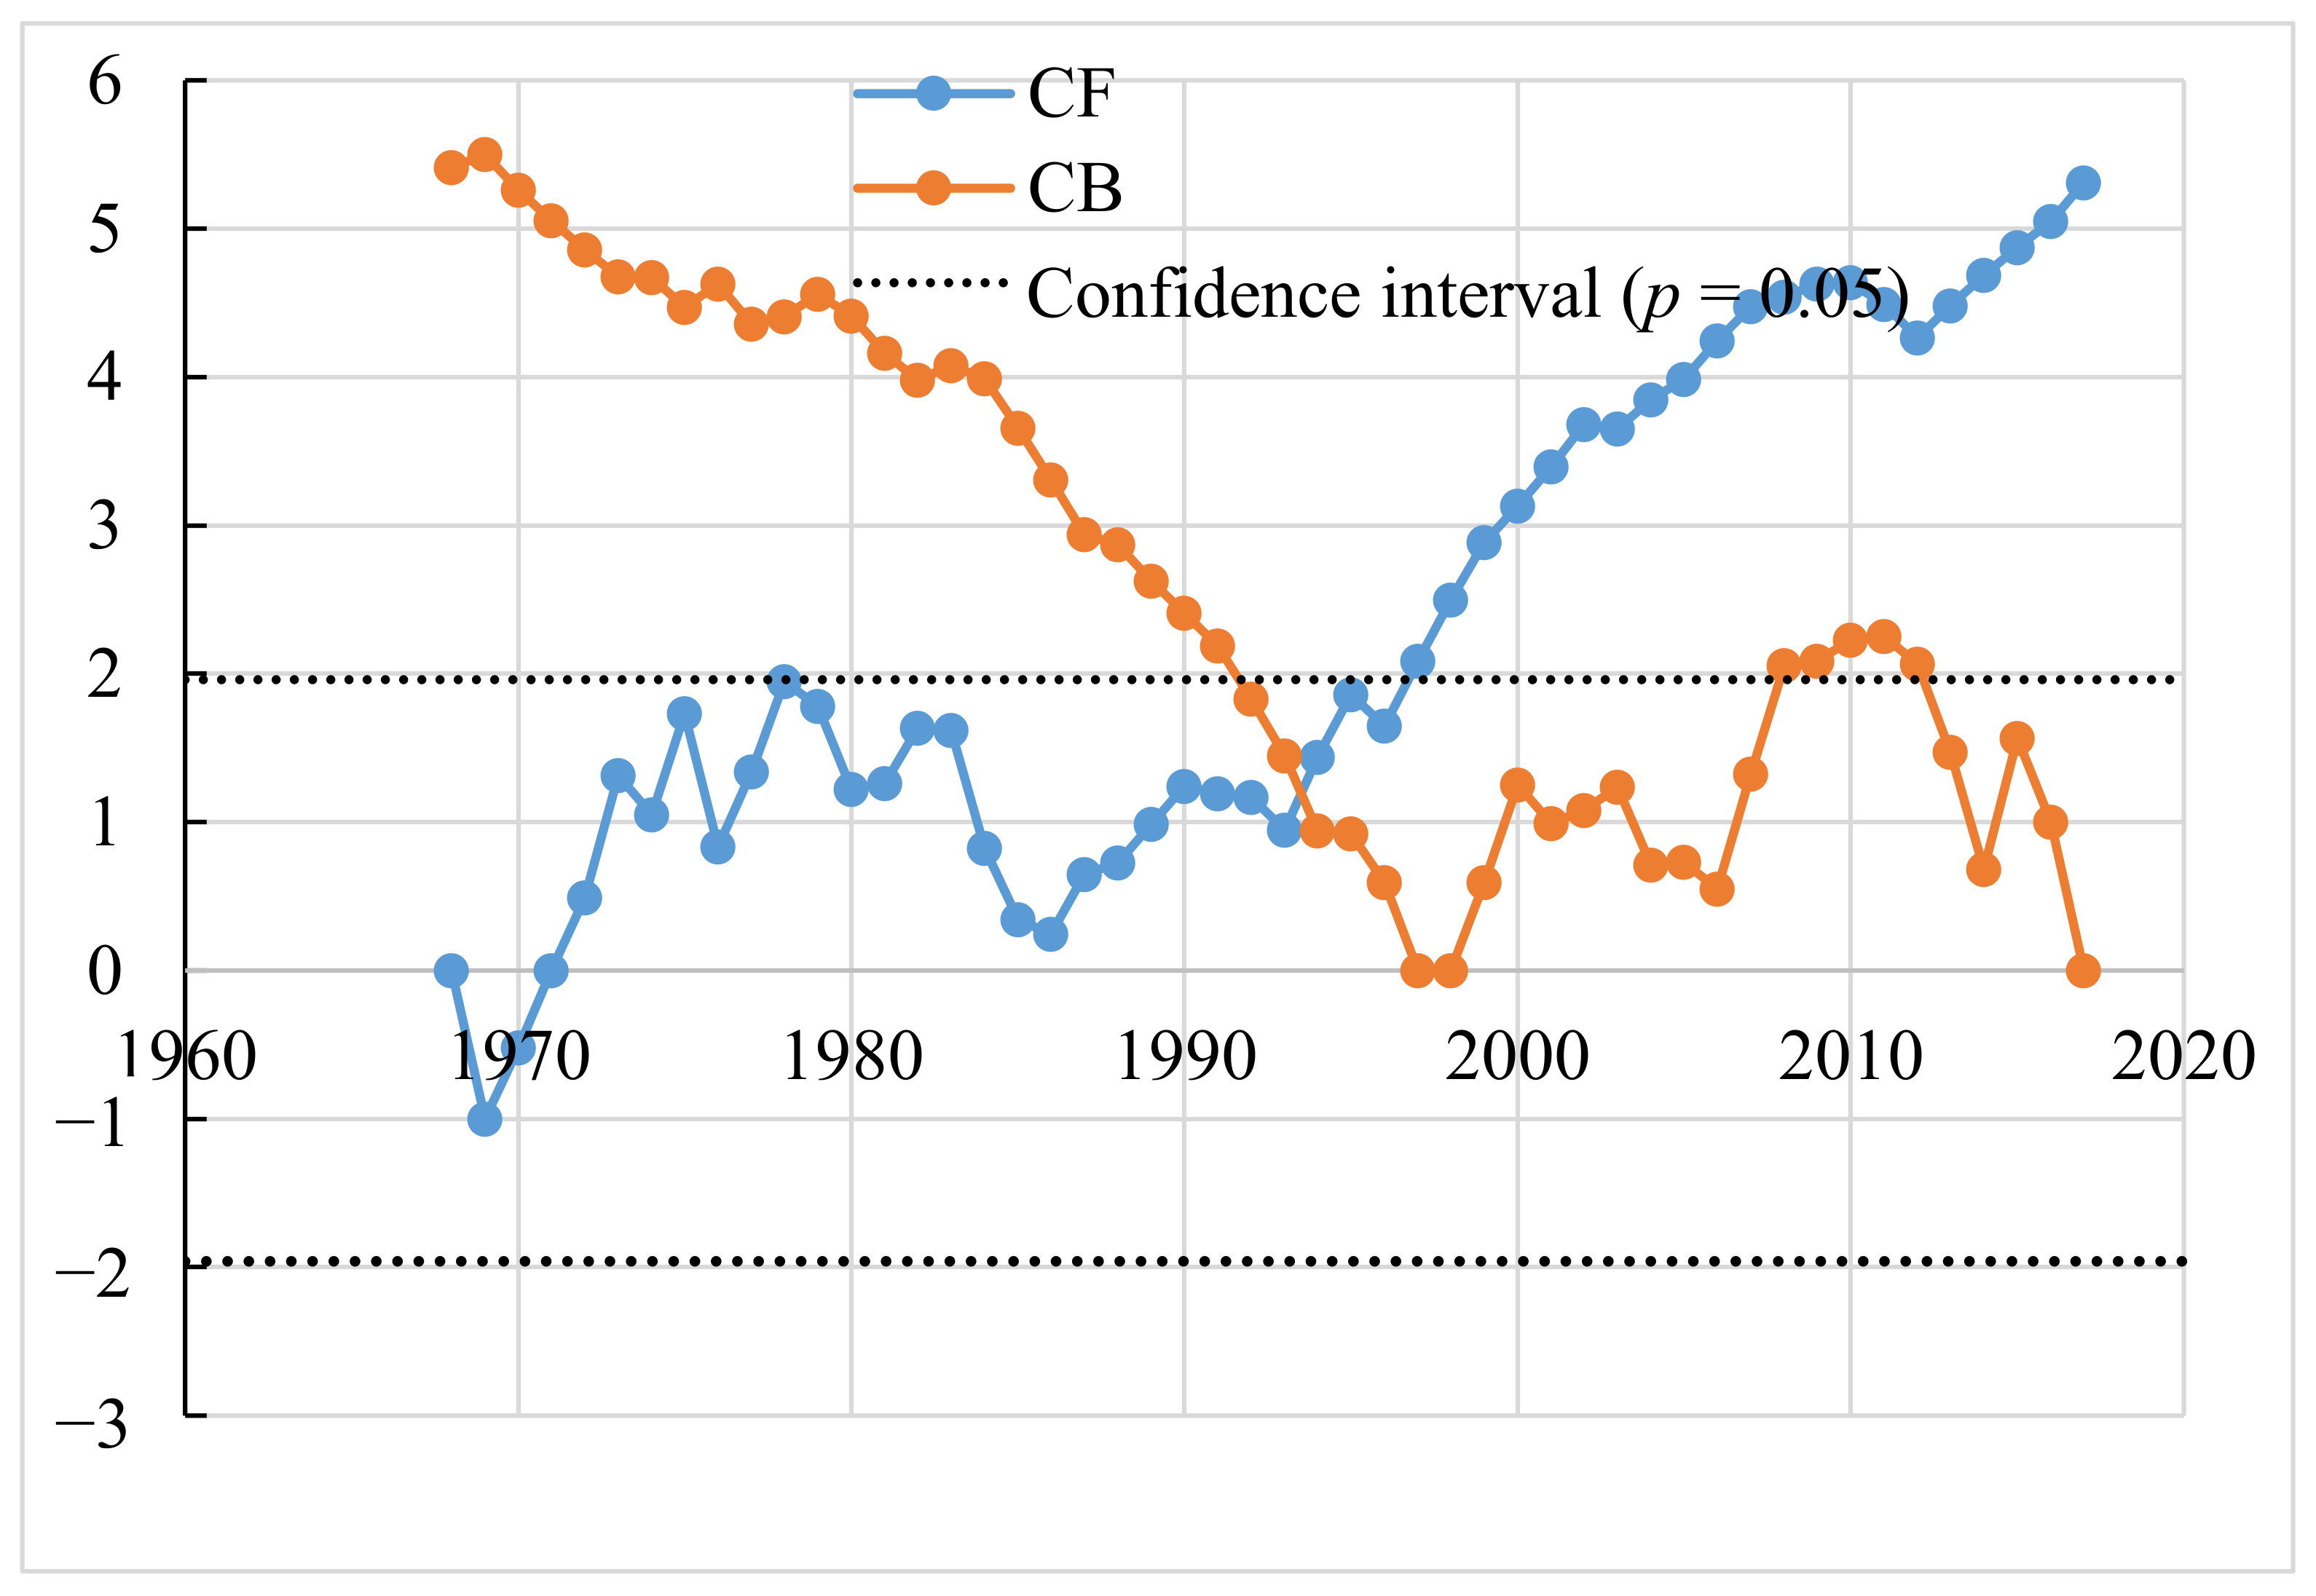
The MK test showed a clear abrupt change in 1994 (Figure 7), suggesting that temperature started to increase drastically in that year. For different weather stations, the years with abrupt change were different. Overall, 14 stations documented an abrupt change in 1997, and 13 in 1994, accounting for 15.7 and 14.6% of the stations in the study area, respectively. There were 18 stations did not show any abrupt change (Table 2). These discrepancies could be driven by spatial variations in temperature in the Taihang Mountain region study area.

3.4. Spatial Distribution of Increasing Temperature Trends

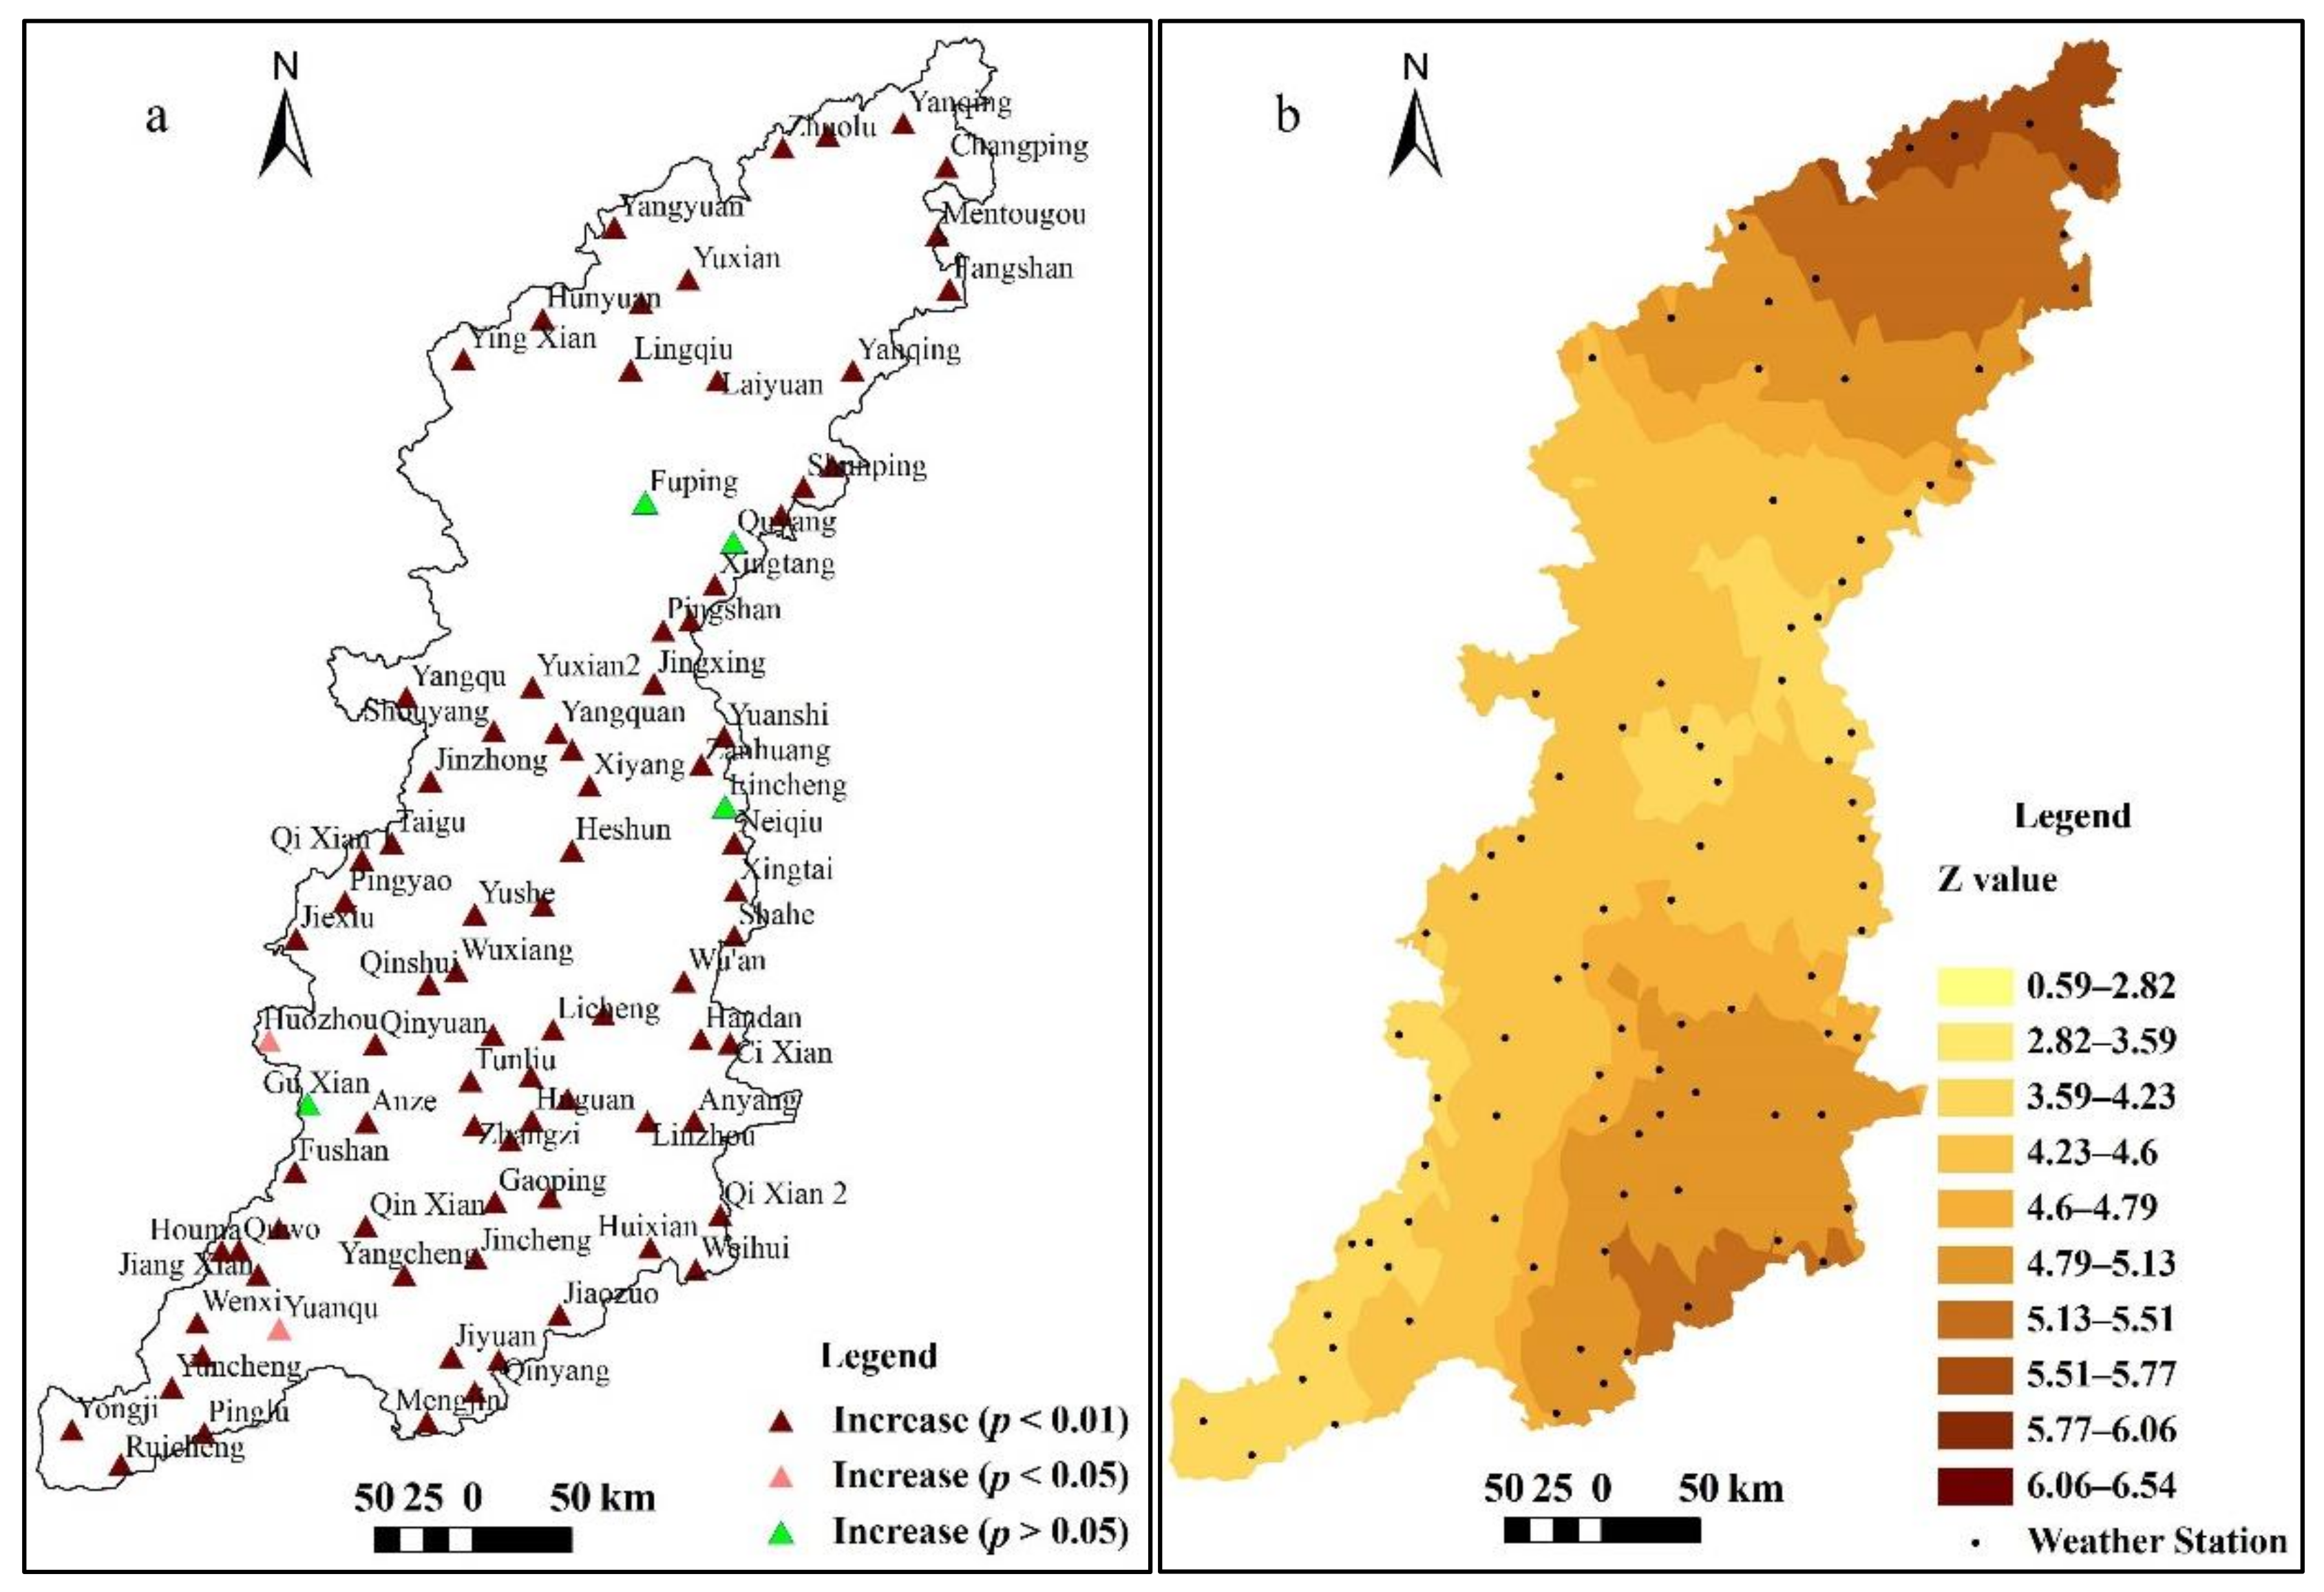
Of the 88 weather stations in the Taihang Mountain region study area, 83 had highly significant (p < 0.01) increasing temperature trends, two had significant trends (p < 0.05), and four had no trends that were statistically significant (p > 0.05; Figure 8a). Areas with non-significant temperature increases were mainly located in the central–east region of the study area. According to MK, Z values were higher in the north and southeast of study region (Figure 8b), indicating that these regions experienced more significant temperature increases.

3.5. Factors Influencing Temperature Trends

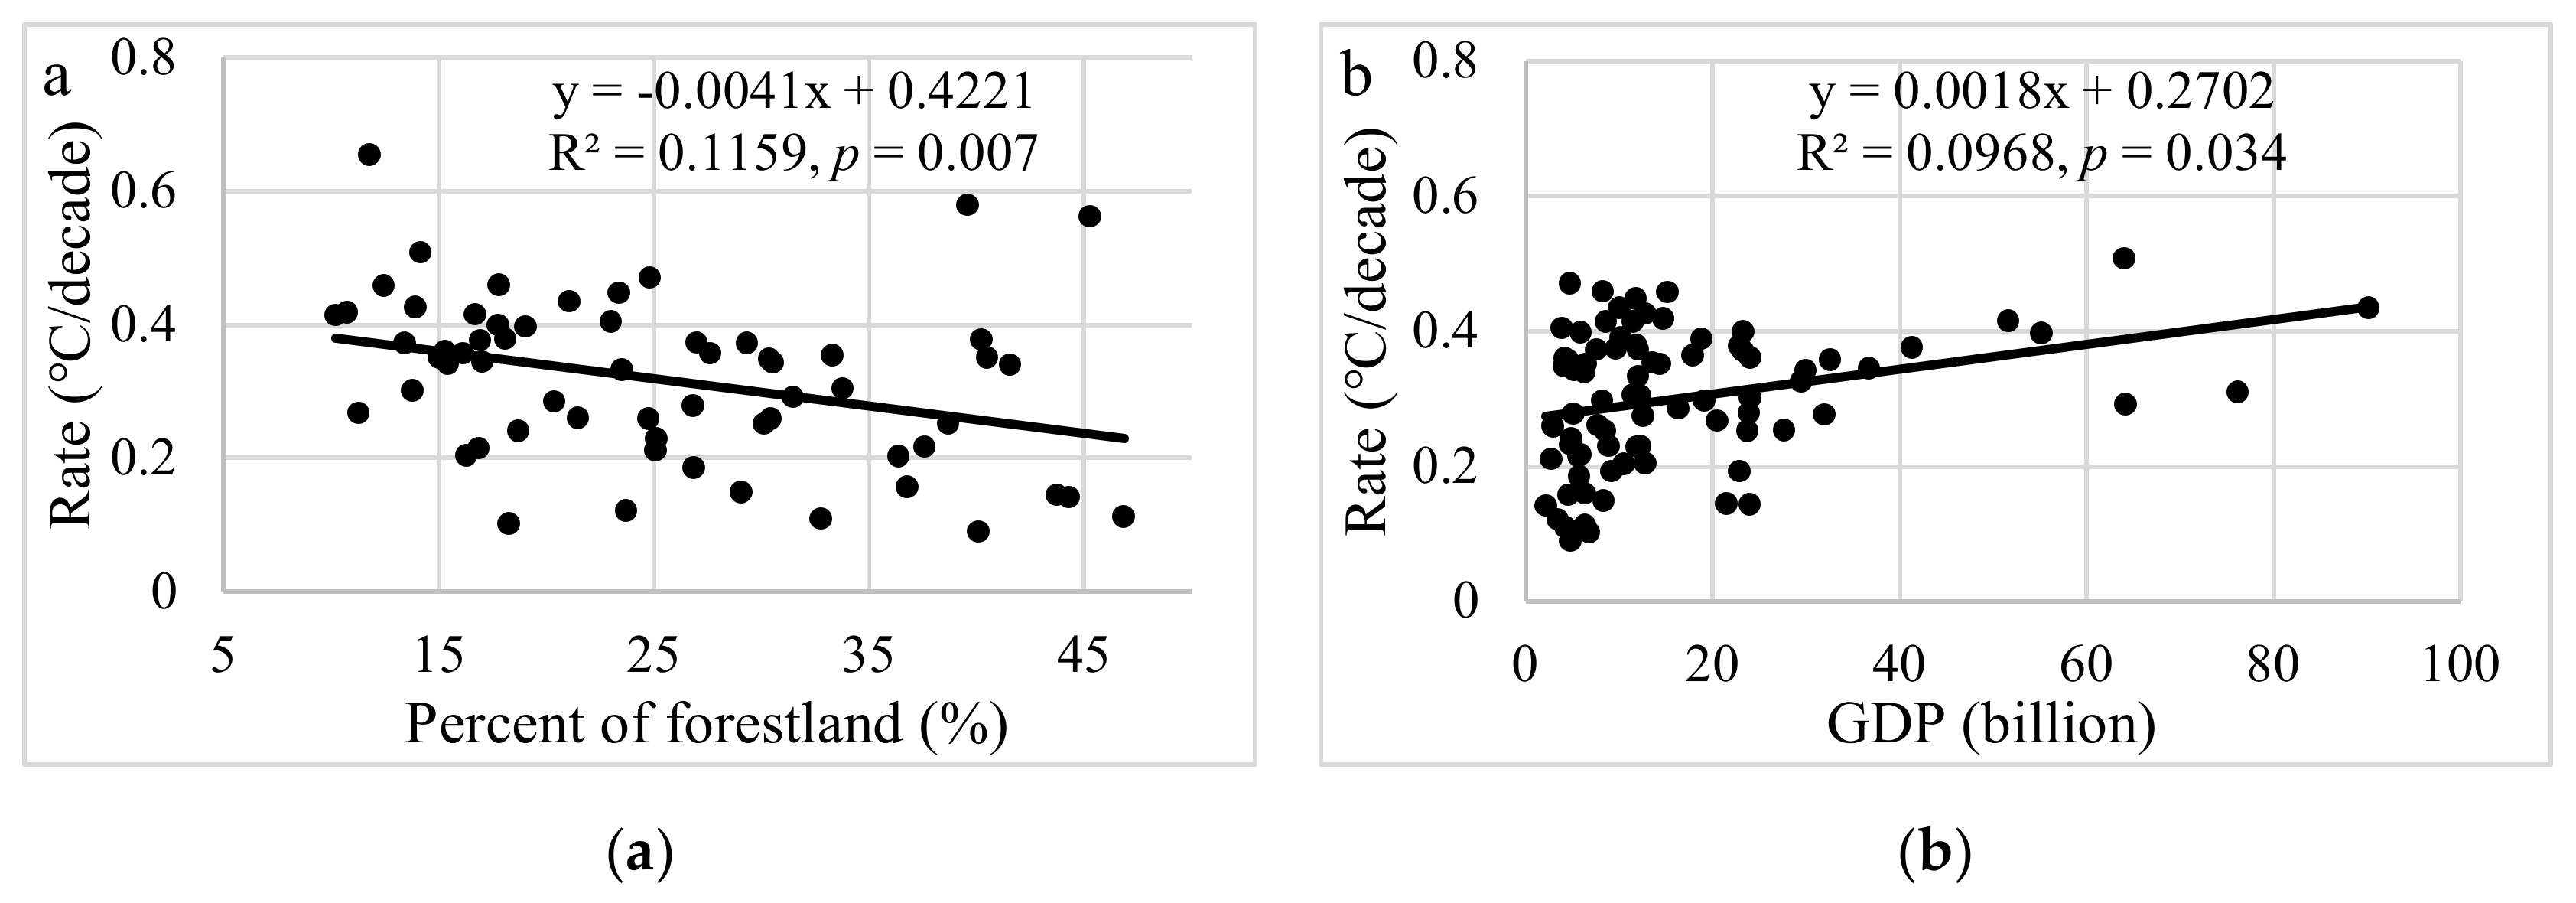
Temperature was significantly influenced by elevation and decreased as elevation increased (Table 3). Temperature was also significantly correlated with latitude (R = −0.467; p < 0.001). Unlike the latitude, longitude was not correlated with temperature with a correlation coefficient of −0.73 and a p value of 0.498. All geographical factors were relatively less correlated with Z values. This suggested that, while geographical factors had significant effects on temperature, their effects on the increasing trend of temperature was minimal. For the influence of GDP and land use type, temperature had no significant correlations with either land use or GDP, but the temperature trend was significantly correlated with both land use and GDP (Table 3). Regression analysis showed a significant negative correlation between temperature increasing rate and percent forestland (R2 = 0.1159, p = 0.007; Figure 9a), but the correlation with GDP was positive (R2 = 0.0968, p=0.034; Figure 9b). This suggests that the increase in temperature was slower in counties with high amounts of forested area and low GDP. When GDP was 0, temperature increase in the Taihang Mountain region was 0.27 °C/decade. In addition, with a 100 billion yuan increase in GDP, temperature would increase was 0.18 °C/decade according to these results. According to the correlation between percent forestland and rate of temperature increase, the temperature would increase by 0.4221 °C/decade if a county had no forestland, which is 0.12 °C/decade higher than the average temperature increase (0.3 °C/decade). Moreover, the temperature increase associated with a GDP of 100 billion yuan could be offset by a 17% increase in forested area in a given county.
As the temperature mainly influenced by elevation and latitude, the Z value mainly influenced by percent forestland, GDP, and longitude, the elevation and latitude were set as input in the prediction of temperature, and percent of forestland, GDP, and longitude were used to predict Z value by the GWR method. The results showed that the predicted temperature was between 6.94 and 14.82 (Figure 10a). The spatial distribution of the predicted temperature was similar with that of observed value. The R2 ranged from 0.807 to 0.957, with higher value zones located in the northern and southern parts, and the lower value zone located in the middle of the Taihang Mountain region (Figure 10b). The predicted Z value ranged from 3.92 to 5.68 (Figure 10c), but the R2 was relatively low (0.005–0.179) (Figure 10d). It indicated that the prediction precision was lower for the Z value than that for temperature by the GWR method.

4. Discussion

4.1. Spatial and Temporal Temperature Trends in the Taihang Mountain Region

Global warming is widely acknowledged and has been reported in many studies [41,42,43]. During 1902–2002, the Earth’s temperature increased by approximately 0.6  °C, and the rate of increase was more significant during the periods 1910–1945 and from 1976 onward [44]. In the Taihang Mountain region, the warming degree is more severe than global averages. Spatial temperature patterns are critical for understanding global warming [45] and are controlled by variations in direct solar radiation falling on the earth’s surface [46]. However, in mountain terrains, elevation, slope gradient, and slope aspect can influence the direct solar radiation and are therefore important additional factors influencing temperature [46]. In the Taihang Mountain region, temperature increased gradually from east to west (Figure 4) and the spatial distribution of temperature was significantly negatively correlated with elevation.
In this study, spatial and temporal trends of temperature varied with season. Temperature increase was more significant in winter and spring than in summer and fall, a pattern that has been noted elsewhere [10,14,17]. There are several reasons for more rapid warming in winter and spring. For example, snow–ice feedback can induce a rapid rise in temperatures near the annual 0 °C isotherm [16]. In addition, the relatively greater amount of greenhouse gas emissions typically released in cold periods can trigger temperature rise [17]. Both of these factors may have increased winter and spring warming in the Taihang Mountain region. Differences in warming trends could affect both the environment and human society and therefore require close monitoring.
Studies have assessed spatial and temporal temperature trends in areas near the Taihang Mountain region. The Loess Plateau, to the west of the study area, also warmed significantly from 1961 to 2010. Temperature increased annually, and in the spring, summer, fall, and winter by 0.382, temperatures increased 0.399, 0.338, 0.315, and 0.565 °C/decade, respectively [31]. In the Beijing–Tianjin–Hebei region, to the east of the Taihang Mountain region, the annual, spring, summer, fall, and winter temperature increases from 1956 to 2005 were 0.39, 0.389, 0.201, 0.262, and 0.563 °C/decade, respectively [17]. Compared to these studies, the Taihang Mountain region experienced similar trends, with rapid warming in winter and spring. However, the Taihang Mountain region exhibited greater spatial variation in temperature. This could be due to the fact that more complex, mountainous topography (e.g., elevation, slope aspect, and slope gradient) exists in this region, factors known to significantly affect temperature [21,25].

4.2. Effect of Geographical and Anthropogenic Factors on Temperature

Elevation, slope, zenith angle, aspect, and land use and land cover are often treated as key factors influencing land surface temperature in mountainous areas [25]. Temperature is known to decrease with increasing elevation and the lapse rate is generally estimated at 0.65 °C/100 m [20]. However, in the Taihang Mountain region, the lapse rate was lower, 0.51 °C/100 m. This could be caused by the fact that environmental conditions in the region are very complex, with high spatial variations in vegetation, soil, topography, among other factors [35,36,47]. In addition to the temperature changes associated with elevation, the rate of temperature increase caused by global warming is known to be influenced by elevation. However, this relationship is highly variable and can be positive [13], negative [48], or not significant [49]. In the Taihang Mountain region, the rate of temperature increase was not significantly correlated with elevation. However, it is possible that elevation was a key influencing factor of temperature, but that its impact was weakened by high environmental heterogeneity in the region. In this study, latitude was negatively correlated with temperature, which corroborates other studies finding that most regional warming has occurred at lower latitudes [4,17]. However, one study found that temperatures increased rapidly at higher latitudes, which could be driven by the fact that greenhouse gas concentrations are amplified at higher latitudinal zones [23]. Longitude had no significant correlation with either mean temperature or its increasing trend. This may because the longitudinal span of the Taihang Mountain region is relatively small. The temperature predicted by GWR method had a high precision. Moreover, the predicted precision was higher in the south and north than that of the middle of the Taihang Mountain region. Compared to temperature, the Z value showed a lower prediction precision. This suggested that the temperature could be predicted used geographical factors by the GWR method.
Besides geographical factors, anthropogenic factors also affect regional temperature. Studies have found economic development to be closely related to temperature [26]. In this study, mean temperature had no correlation with the GDP of the 88 counties (Table 3). This is likely because the study area is relatively small, and therefore the general climatic conditions were very similar. GDP could be more strongly influenced by county policy than by temperature. However, we did find that the increase in temperature rates was significantly affected by the economy, with more-highly developed counties experiencing greater temperature increases (Table 3). This is because regions with higher GDP have more industries that emit greenhouse gases [27]. Economic development and environmental protection have contrasting goals that often affect regional and global warming [4]. Our study showed that the percentage of forestland in a given county has a significantly negative correlation with the rate of temperature increase (Table 3). Therefore, the establishment and conservation of forests may be an effective means of alleviating regional warming given rapid development.

4.3. Regional Warming and Its Influence on the Environment and Human Health

Global warming has been proven to have significant impacts on the environment and human health, including polar ice melt, sea level rise, increasing droughts and heat waves, and spread of disease [17,41,44]. Global warming also has a significant effect on economic production. Overall economic productivity is non-linearly related to temperature. One study found that peak global productivity occurred at an average annual temperature of 13 °C and sharply declined at higher temperatures [50]. Moreover, global warming very likely exacerbates global economic inequality, including an approximately 25% increase in population-weighted between-country inequality over the past half century [4]. As with global warming, regional warming has several distinct impacts on the environment and human health. First, regional warming exacerbates the pace of global warming [51]. Second, regional warming increases evaporation, which, in turn, reduces precipitation and affects regional surface water budgets [42,52]. Studies show that precipitation has been decreasing in the Taihang Mountain region in recent years [53] and that irrigation has generally increased with decreasing precipitation [54]. Thus, with fewer water inputs, land development for agriculture will require increased groundwater funnel formation and may thereby increase the likelihood of water crisis. Third, regional warming increases the spread of diseases such as malaria [55]. Given the negative impacts associated with regional warming, it is important to take measures to slow down the warming process. Specifically, reducing greenhouse gas emissions, preserving intact forest, and increasing afforestation should be strongly encouraged.

5. Conclusions

Between 1968 and 2017, the temperature of the Taihang Mountain region has significantly increased at a rate of 0.3 °C/decade, much higher than the global average. Temperature increases mainly occurred in winter and spring, by 0.38 and 0.45 °C/decade, respectively. Temperature varied spatially and generally dropped from east to west. Elevation and latitude were significantly negatively correlated with mean annual temperatures, but not significantly correlated with trends of temperature increase, given Z values from MK tests. This indicates that geographical factors mainly affected mean temperature, rather than temperature trends. Mean temperature was not correlated with percent forestland and GDP, but the rates of temperature increase were significantly negatively correlated with percent forestland and positively correlated with GDP. Our results suggest that an increase in GDP by 100 billion yuan could increase temperature by 0.18 °C/decade, and that an approximately 17% increase in forestland would be required to offset this effect. This suggested that slowing economic development (particularly for industries with high greenhouse gas emissions), conservation of existing forests, and afforestation could effectively slow warming in the Taihang Mountain region.

Author Contributions

Conceptualization, T.F.; Data curation, H.G.; Investigation, H.G.; Methodology, H.L.; Resources, J.L.; Software, H.L.; Writing—original draft, T.F.; Writing—review and editing, J.L. All authors have read and agreed to the published version of the manuscript.

Funding

This research was funded by grants from the National Natural Science Foundation of China (No. 41930651 and No. 41807013), the Open Fund of Key Laboratory of Agro-ecological Processes in Subtropical Region, Chinese Academy of Sciences (No. ISA2017202), and the Youth Innovation Promotion Association of the Chinese Academy of Sciences (No. 2020102).

Institutional Review Board Statement

Not applicable.

Informed Consent Statement

Not applicable

Data Availability Statement

Not applicable.

Conflicts of Interest

The authors declare no conflict of interest.

References

  1. Liang, E.; Leuschner, C.; Dulamsuren, C.; Wagner, B.; Hauck, M. Global warming-related tree growth decline and mortality on the north-eastern Tibetan plateau. Clim. Chang. 2016, 134, 163–176. [Google Scholar] [CrossRef]
  2. Dai, A. Drought under global warming: A review. WIREs Clim. Chang. 2011, 2, 45–65. [Google Scholar] [CrossRef] [Green Version]
  3. Palomo, I. Climate Change Impacts on Ecosystem Services in High Mountain Areas: A Literature Review. Mt. Res. Dev. 2017, 37, 179–187. [Google Scholar] [CrossRef] [Green Version]
  4. Diffenbaugh, N.S.; Burke, M. Global warming has increased global economic inequality. Proc. Natl. Acad. Sci. USA 2019, 116, 9808–9813. [Google Scholar] [CrossRef] [PubMed] [Green Version]
  5. McCarthy, J.J.; Canziani, O.F.; Leary, N.A.; Dokken, D.J.; White, K.S. Climate Change 2001: Impacts, Adaptation, and Vulnerability: Contribution of Working Group II to the Third Assessment Report of the Intergovernmental Panel on Climate Change; Cambridge University Press: Cambridge, UK, 2001; Volume 2. [Google Scholar]
  6. Steve, L.; Richard, M.; William, P. Recent California climate variability: Spatial and temporal patterns in temperature trends. Clim. Res. 2007, 33, 159–169. [Google Scholar] [CrossRef] [Green Version]
  7. Mikkonen, S.; Laine, M.; Mäkelä, H.M.; Gregow, H.; Tuomenvirta, H.; Lahtinen, M.; Laaksonen, A. Trends in the average temperature in Finland, 1847–2013. Stoch. Environ. Res. Risk A 2015, 29, 1521–1529. [Google Scholar] [CrossRef] [Green Version]
  8. Nasrallah, H.A.; Balling, R.C. Spatial and temporal analysis of Middle Eastern temperature changes. Clim. Chang. 1993, 25, 153–161. [Google Scholar] [CrossRef]
  9. Nayava, J.L.; Adhikary, S.; Bajracharya, O.R. Spatial and temporal variation of surface air temperature at different altitude zone in recent 30 years over Nepal. Mausam 2017, 68, 417–428. [Google Scholar]
  10. Agu, E. Temporal and Spatial Variability of Air Temperatures in Estonia during 1756–2014. J. Climatol. 2016, 2016, 9426791. [Google Scholar] [CrossRef] [Green Version]
  11. Fan, Z.; Bräuning, A.; Thomas, A.; Li, J.; Cao, K. Spatial and temporal temperature trends on the Yunnan Plateau (Southwest China) during 1961–2004. Int. J. Climatol. 2011, 31, 2078–2090. [Google Scholar] [CrossRef]
  12. Li, Q.; Chen, Y.; Shen, Y.; Li, X.; Xu, J. Spatial and temporal trends of climate change in Xinjiang, China. J. Geogr. Sci. 2011, 21, 1007–1018. [Google Scholar] [CrossRef]
  13. Li, Z.; He, Y.; Wang, C.; Wang, X.; Xin, H.; Zhang, W.; Cao, W. Spatial and temporal trends of temperature and precipitation during 1960–2008 at the Hengduan Mountains, China. Quat. Int. 2011, 236, 127–142. [Google Scholar] [CrossRef]
  14. Yan, T.; Shen, Z.; Bai, J. Spatial and Temporal Changes in Temperature, Precipitation, and Streamflow in the Miyun Reservoir Basin of China. Water 2017, 9, 78. [Google Scholar] [CrossRef] [Green Version]
  15. Feizi, V.; Mollashahi, M.; Farajzadeh, M.; Azizi, G. Spatial and Temporal Trend Analysis of Temperature and Precipitation in Iran. Ecopersia 2014, 2, 727–742. [Google Scholar]
  16. Pepin, N.C.; Lundquist, J.D. Temperature trends at high elevations: Patterns across the globe. Geophys. Res. Lett. 2008, 35, L14701. [Google Scholar] [CrossRef] [Green Version]
  17. Liu, Y.; Yue, T.; Jiao, Y.; Zhao, Y.; Bao, Z. Fusion of Simulated and Observational Temperature Data in the Beijing-Tianjin-Hebei Region Based on High-Accuracy Surface Modeling. Adv. Meteorol. 2019, 2019, 8709575. [Google Scholar] [CrossRef]
  18. Ishida, T.; Kawashima, S. Use of cokriging to estimate surface air temperature from elevation. Theor. Appl. Climatol. 1993, 47, 147–157. [Google Scholar] [CrossRef]
  19. Collados-Lara, A.-J.; Fassnacht, S.R.; Pulido-Velazquez, D.; Pfohl, A.K.D.; Morán-Tejeda, E.; Venable, N.B.H.; Pardo-Igúzquiza, E.; Puntenney-Desmond, K. Intra-day variability of temperature and its near-surface gradient with elevation over mountainous terrain: Comparing MODIS Land Surface Temperature data with coarse and fine scale near-surface measurements. Int. J. Climatol. 2020. [Google Scholar] [CrossRef]
  20. Ding, Y. Response of Cryosphere to Climatic Warming SInce 1980 over the Northern Hemisphere. J. Glaciol. Geocryol. 1996, 18, 131–137, (In Chinese with English abstract). [Google Scholar]
  21. Beniston, M.; Diaz, H.F.; Bradley, R.S. Climatic change at high elevation sites: An overview. Clim. Chang. 1997, 36, 233–251. [Google Scholar] [CrossRef]
  22. Liu, X.; Chen, B. Climatic warming in the Tibetan Plateau during recent decades. Int. J. Climatol. 2000, 20, 1729–1742. [Google Scholar] [CrossRef]
  23. Mountain Research Initiative EDW Working Group; Pepin, N.; Bradley, R.S.; Diaz, H.F.; Baraer, M.; Caceres, E.B.; Forsythe, N.; Fowler, H.; Greenwood, G.; Hashmi, M.Z.; et al. Elevation-dependent warming in mountain regions of the world. Nat. Clim. Chang. 2015, 5, 424–430. [Google Scholar] [CrossRef] [Green Version]
  24. Ding, H.; Shi, W. Land-use/land-cover change and its influence on surface temperature: A case study in Beijing city. Int. J. Remote Sens. 2013, 34, 5503–5517. [Google Scholar] [CrossRef]
  25. Bindajam, A.A.; Mallick, J.; AlQadhi, S.; Singh, C.K.; Hang, H.T. Impacts of Vegetation and Topography on Land Surface Temperature Variability over the Semi-Arid Mountain Cities of Saudi Arabia. Atmosphere 2020, 11, 762. [Google Scholar] [CrossRef]
  26. Horowitz, J.K. The Income–Temperature Relationship in a Cross-Section of Countries and its Implications for Predicting the Effects of Global Warming. Environ. Resour. Econ. 2009, 44, 475–493. [Google Scholar] [CrossRef]
  27. Homoródi, R.; Osmólska, K. An Analysis of the Relationship between Carbon-Dioxide Emissions and Gross Domestic Product For 139 Countries Within the Time Period 1985–2004; University of Skövde: Skövde, Switzerland, 2009. [Google Scholar]
  28. Guo, X.; Ren, D.; Shi, J. Carbon emissions, logistics volume and GDP in China: Empirical analysis based on panel data model. Environ. Sci. Pollut. Res. 2016, 23, 24758–24767. [Google Scholar] [CrossRef]
  29. Yang, X.; Zhang, Y.; Liu, L.; Zhang, W.; Ding, M.; Wang, Z. Sensitivity of surface air temperature change to land use/cover types in China. Sci. China Ser. D Earth Sci. 2009, 52, 1207–1215. [Google Scholar] [CrossRef]
  30. Wang, Y.; Li, H. Initial formation and Mesozoic tectonic exhumation of an intracontinental tectonic belt of the northern part of the Taihang Mountain belt, eastern Asia. J. Geol. 2008, 116, 155–172. [Google Scholar] [CrossRef] [Green Version]
  31. Wang, Q.-X.; Fan, X.-H.; Qin, Z.-D.; Wang, M.-B. Change trends of temperature and precipitation in the Loess Plateau Region of China, 1961–2010. Global Planet Chang. 2012, 92–93, 138–147. [Google Scholar] [CrossRef]
  32. Fan, X.; Wang, M. Change trends of air temperature and precipitation over Shanxi Province, China. Theor. Appl. Climatol. 2011, 103, 519–531. [Google Scholar] [CrossRef]
  33. Wang, J.; Gao, Y.; Wang, S. Assessing the response of runoff to climate change and human activities for a typical basin in the Northern Taihang Mountain, China. J. Earth Syst. Sci. 2018, 127, 37. [Google Scholar] [CrossRef] [Green Version]
  34. Baah-Acheamfour, M.; Carlyle, C.N.; Lim, S.-S.; Bork, E.W.; Chang, S.X. Forest and grassland cover types reduce net greenhouse gas emissions from agricultural soils. Sci. Total Environ. 2016, 571, 1115–1127. [Google Scholar] [CrossRef] [PubMed]
  35. Fu, T.; Han, L.; Gao, H.; Liang, H.; Liu, J. Geostatistical analysis of pedodiversity in Taihang Mountain region in North China. Geoderma 2018, 328, 91–99. [Google Scholar] [CrossRef]
  36. Gao, H.; Fu, T.; Liu, J.; Liang, H.; Han, L. Ecosystem Services Management Based on Differentiation and Regionalization along Vertical Gradient in Taihang Mountain, China. Sustainability 2018, 10, 986. [Google Scholar] [CrossRef] [Green Version]
  37. Liu, Z.; Yang, M.; Wan, G.; Wang, X. The Spatial and Temporal Variation of Temperature in the Qinghai-Xizang (Tibetan) Plateau during 1971–2015. Atmosphere 2017, 8, 214. [Google Scholar] [CrossRef] [Green Version]
  38. Liu, Q.; Yang, Z.; Cui, B. Spatial and temporal variability of annual precipitation during 1961–2006 in Yellow River Basin, China. J. Hydrol. 2008, 361, 330–338. [Google Scholar] [CrossRef]
  39. Brunsdon, C.; Fotheringham, S.; Charlton, E. Geographically Weighted Regression: A Method for Exploring Spatial Nonstationarity. Geogra. Anal 2010, 28, 281–298. [Google Scholar] [CrossRef]
  40. Li, S.; Zhao, Z.; Miaomiao, X.; Wang, Y. Investigating spatial non-stationary and scale-dependent relationships between urban surface temperature and environmental factors using geographically weighted regression. Environ. Model. Softw. 2010, 25, 1789–1800. [Google Scholar] [CrossRef]
  41. Slangen, E. How humans and rising seas affect each other. Nature 2018, 558, 196–197. [Google Scholar] [CrossRef] [Green Version]
  42. Schlaepfer, D.R.; Bradford, J.B.; Lauenroth, W.K.; Munson, S.M.; Tietjen, B.; Hall, S.A.; Wilson, S.D.; Duniway, M.C.; Jia, G.; Pyke, D.A.; et al. Climate change reduces extent of temperate drylands and intensifies drought in deep soils. Nat. Commun. 2017, 8, 14196. [Google Scholar] [CrossRef]
  43. Hughes, T.P.; Kerry, J.T.; Álvarez-Noriega, M.; Álvarez-Romero, J.G.; Anderson, K.D.; Baird, A.H.; Babcock, R.C.; Beger, M.; Bellwood, D.R.; Berkelmans, R.; et al. Global warming and recurrent mass bleaching of corals. Nature 2017, 543, 373. [Google Scholar] [CrossRef] [PubMed]
  44. Walther, G.-R.; Post, E.; Convey, P.; Menzel, A.; Parmesan, C.; Beebee, T.J.C.; Fromentin, J.-M.; Hoegh-Guldberg, O.; Bairlein, F. Ecological responses to recent climate change. Nature 2002, 416, 389–395. [Google Scholar] [CrossRef] [PubMed]
  45. Przybylak, R. Temporal and spatial variation of surface air temperature over the period of instrumental observations in the Arctic. Int. J. Climatol. 2000, 20, 587–614. [Google Scholar] [CrossRef]
  46. Chuanyan, Z.; Zhongren, N.; Guodong, C. Methods for modelling of temporal and spatial distribution of air temperature at landscape scale in the southern Qilian mountains, China. Ecol. Model. 2005, 189, 209–220. [Google Scholar] [CrossRef]
  47. Li, Y.; Xu, Q.; Wang, Z. Discussion on Ecological Restoration in Taihang mountain area of Hebei Province. Soil Water Conserv. China 2004, 11, 10–11, (In Chinese with English abstract). [Google Scholar]
  48. Lu, A.; Kang, S.; Li, Z.; Theakstone, W.H. Altitude effects of climatic variation on Tibetan Plateau and its vicinities. J. Earth Sci. 2010, 21, 189–198. [Google Scholar] [CrossRef]
  49. Ceppi, P.; Scherrer, S.C.; Fischer, A.M.; Appenzeller, C. Revisiting Swiss temperature trends 1959–2008. Int. J. Climatol. 2012, 32, 203–213. [Google Scholar] [CrossRef] [Green Version]
  50. Burke, M.; Hsiang, S.M.; Miguel, E. Global non-linear effect of temperature on economic production. Nature 2015, 527, 235–239. [Google Scholar] [CrossRef]
  51. Li, L.; Zha, Y. Satellite-based regional warming hiatus in China and its implication. Sci. Total Environ. 2019, 648, 1394–1402. [Google Scholar] [CrossRef]
  52. Ma, Z.G.; Dan, L. Dry/wet variation and its relationship with regional warming in arid-regions of northern China. Chin. J. Geophys. 2005, 48, 1091–1099. [Google Scholar] [CrossRef]
  53. Du, J.; Jia, Y.; Hao, C.; Qiu, Y.; Niu, C.; Liu, H. Temporal and spatial changes of blue water and green water in the Taihang Mountain Region, China, in the past 60 years. Hydrol. Sci. J. 2019, 64, 2040–2056. [Google Scholar] [CrossRef]
  54. Sun, H.; Shen, Y.; Yu, Q.; Flerchinger, G.N.; Zhang, Y.; Liu, C.; Zhang, X. Effect of precipitation change on water balance and WUE of the winter wheat–summer maize rotation in the North China Plain. Agric. Water Manag. 2010, 97, 1139–1145. [Google Scholar] [CrossRef]
  55. Patz, J.A.; Hulme, M.; Rosenzweig, C.; Mitchell, T.D.; Goldberg, R.A.; Githeko, A.K.; Lele, S.; McMichael, A.J.; Le Sueur, D. Regional warming and malaria resurgence. Nature 2002, 420, 627–628. [Google Scholar] [CrossRef] [PubMed]
Figure 1. Location of the study area in the Taihang Mountain region of China (a) and a map of the study area showing the locations of weather stations where the data were collected (b).
Sustainability 13 00856 g001
Figure 2. The flowchart for analysis spatial and temporal tend of temperature and the influencing factors.
Sustainability 13 00856 g002
Figure 3. Land use type in the Taihang Mountain region.
Sustainability 13 00856 g003
Figure 4. Spatial distribution of average annual (a), spring (b), summer (c), fall (d), and winter (e) temperature from 1968 to 2017 in the Taihang Mountain region of North China.
Sustainability 13 00856 g004aSustainability 13 00856 g004b
Figure 5. Temporal trends in temperature plotted at annual (a), spring (b), summer (c), fall (d), and winter (e) scales from 1968 to 2017 in the Taihang Mountain region of North China.
Sustainability 13 00856 g005
Figure 6. Results of Mann–Kendall tests performed on temperature data partitioned by season and collected from 1968 to 2017 in the Taihang Mountain region of North China. Z values above the red line are significant at the p < 0.05 level and values above the blue line are significant at the p < 0.01 level.
Sustainability 13 00856 g006
Figure 7. Results from a Mann–Kendall test on changes of annual average temperature from 1968 to 2017 in the Taihang Mountain region of North China. The point where the UF(k) and UB(k) trend lines intersect indicates a year of particularly abrupt temperature change.
Sustainability 13 00856 g007
Figure 8. Plots depicting the significance of increasing temperature trends from 1968 to 2017 at 88 weather stations in the Taihang Mountain region of North China (a) and the spatial distribution of Z values derived from Mann–Kendall tests conducted on these data (b).
Sustainability 13 00856 g008
Figure 9. Correlations between the rate of temperature increase from 1968 to 2017 in the Taihang Mountain region of North China and percent of forestland (a) and gross domestic product (GDP) (b).
Sustainability 13 00856 g009
Figure 10. Spatial distribution of predicted temperature (a), R2 of for temperature (b), predicted Z value (c), and R2 of the for Z value (d) in geographically weight regression analysis.
Sustainability 13 00856 g010
Table 1. Statistical description of annual and seasonal temperatures from 1968 to 2017 in the Taihang Mountain region of North China. SD: standard deviation; CV: coefficient of variation.
Min.Max.MeanSDCV
Spring10.9314.4812.650.937.39
Summer22.5525.2523.810.582.42
Fall9.9713.5111.530.726.21
Winter−5.20−0.03−2.351.1950.50
Annual10.2212.5111.410.595.21
Table 2. Years between 1968 and 2017 that had abrupt temperature changes in the Taihang Mountain region of North China, according to a Mann–Kendall test performed on data recorded by 88 weather stations.
Abrupt YearNumber of StationsPercentage of StationsAccumulate Percentage
*2224.724.7
198111.125.8
198633.429.2
198711.130.3
198811.131.5
198944.536
199033.439.3
199144.543.8
199211.144.9
199344.549.4
19941314.664
199544.568.5
199644.573
19971415.788.8
199844.593.3
199911.194.4
200033.497.8
200311.198.9
200611.1100
* means the weather stations without abrupt years.
Table 3. Correlation analyses between influencing factors and mean annual temperature (T) as well as temperature trends (Z) from 1968 to 2017 in the Taihang Mountain region of North China, * means the correlation is significant at 0.05 level, and ** means the correlation is significant at 0.01 level.
Percent ForestlandPercent FarmlandGross Domestic ProductElevationLongitudeLatitude
TR0.151−0.1740.064−0.863 **−0.73−0.467 **
p0.1660.1080.560<0.010.498<0.001
ZR−0.27 *0.0640.236 *0.0220.209 *0.123
p0.0390.5520.0270.8400.050.252
Publisher’s Note: MDPI stays neutral with regard to jurisdictional claims in published maps and institutional affiliations.