Article

Changes in Regional Economic Resilience after the 2008 Global Economic Crisis: The Case of Korea

Department of Urban Planning and Engineering, Pusan National University, Busan 46241, Korea
*
Author to whom correspondence should be addressed.
Sustainability 2021, 13(20), 11392; https://doi.org/10.3390/su132011392
Submission received: 24 August 2021 / Revised: 6 October 2021 / Accepted: 13 October 2021 / Published: 15 October 2021
(This article belongs to the Special Issue Spatial Planning and Analysis in Urban Sustainability)

Abstract

:
This study investigated Korea’s regional economic resilience after the 2008 economic crisis and analyzed the spatial patterns therein from the perspective of evolution and engineering. We analyzed the employee statistics of 229 si-gun-gu (city-county-district) administrative units for the 2002–2016 period sourced from Business Census data using shift-share analysis, a panel data model, and exploratory spatial data analysis (ESDA). According to the analysis, most regions showed resilience after the crisis, revealing various patterns within the economic regions. Regarding the capital area, there were more structural improvements in Gyeonggi-do than in Seoul. For other regions, there were also more structural improvements in and around metropolitan areas. When comparing the absolute levels of post-crisis employment, the capital area showed low employment resilience in the CBD, while areas where industries such as IT and finance were clustered showed great employment resilience. In addition, non-capital areas showed a significant recovery in the manufacturing areas. This means that regional inequalities in the process of responding to economic crises are likely to include both quantitative and qualitative aspects, and that policies that accompany more structural improvements should be implemented.

1. Introduction

Given the various types of risks and crises that today’s urban environments are exposed to, the notion of resilience is rapidly gaining ground as an emergency response capacity. The concept of resilience has recently been a topic of discussion in the context of regional economics and development, such as labor market, income, and regional growth. In particular, regional economic resilience involves the relationship between economic crises and regional economies. Foster [1] defines regional economical resilience as “the ability of a region to anticipate, prepare for, respond to, and recover from a disturbance.” Hill, Wial, and Wolman [2] define regional economic resilience as “the ability of a region to recover successfully from shocks to its economy that either throw it off its growth path or have the potential to throw it off its growth path.”
Engineering and evolutionary views are the two major approaches to discussing resilience. Holling [3] defines engineering resilience as the ability of a system to return to equilibrium or steady-state resilience after a disturbance. In other words, engineering resilience is the ability to return to the pre-shock state. Martin [4] defines engineering resilience as a regional system’s resistance to shock or disturbance and the ability to “bounce back” to the pre-shock equilibrium. From the perspective of engineering resilience, any regional economic shock is temporary and has no permanent effects on the regional economy’s long-term growth ceiling or growth path [5]. Therefore, engineering resilience can be confirmed by examining whether the pre-shock state has been restored; this, in turn, can be measured quantitatively by comparing the pre- and post-shock growth paths. Ringwood, Watson, and Lewin [6] apply the notion of engineering resilience to analyze the employment resilience of various US regions during the Great Recession of 2008, using the differences between expected and actual employment. Caro [7] also verifies engineering resilience by analyzing whether a regional response to a shock appears linearly.
The regional economy, viewed from the standpoint of engineering resilience, follows a process of single equilibrium, which is a stable or steady growth path induced by periodic or large-scale shocks. However, while the notion of equilibrium is widely applied to biological and ecological resilience, whether urban or regional economies have ever been in equilibrium and whether an equilibrium model is appropriate for the urban or regional economic system have been questioned.
Evolutionary economists argue that economies cannot attain equilibrium because economic evolution depends on the activities of individual economic actors. Pike, Dawley, and Tomaney [8] state that the engineering approach is not suitable for explaining the diversity and heterogeneity of urban spatial resilience, considering the uncertainty of maintaining the pre-shock level of equilibrium amid unpredictable changes and confusion, as well as the complexity and diversity of cities. Simmie and Martin [9] point out that a regional economy is never in equilibrium, as the companies, organizations, and institutions that constitute it are constantly changing and adapting to the environment. Ramlogan and Metcalfe [10] also posit that an economy is constantly changing because it is based on knowledge that is constantly changing.
Therefore, to apply the equilibrium approach to regional economic resilience and explain regional differences in resilience, a new evolutionary perspective emerged. Berkes and Folke [11] define evolutionary resilience as a system’s ability to bring about transformation and change and adapt to stress and pressure, rather than returning to an earlier or new normal state. Likewise, Martin [4] understands resilience as the capacity of self-configuration necessary to maintain an acceptable growth path in output, employment, and wealth over time. From this perspective, resilience emphasizes regional adaptation as a strategy to cope with a recession. Diodato and Weterings [12] analyze the resilience of regional labor markets to economic shocks from an adaptive perspective in terms of regional resistance to and recovery from recession. Juntao, Pingyu, Kevin, Jing, and Shiwei, [13] also measure the economic resilience of resource-based cities from an evolutionary perspective using resilience indicators representing the stages of persistence, adaptability, and transformation. Stognief et al. [14] analyze the economic resilience based on the evolutionary concept of the Holling’s [15] model and Simmie and Martin [9] and suggest the structural difference of region. Shutters et al. [16] suggest the method for urban economic systems and compare the adaptive capacity of urban types.
This study aims to measure and compare Korea’s regional economic resilience to the 2008 global financial crisis using both engineering and evolutionary approaches. The 2008 global financial crisis, triggered by the bankruptcy of Lehman Brothers in the United States, had a significant negative impact on the Korean economy in terms of prices, employment, interest rates, and real estate value [17]. Therefore, a resilience analysis of the 2008 global financial crisis—the most recent crisis that emerged in the context of global economic conditions—could provide Korea (and other economies) with coping strategies for possible future economic crises, particularly given increasingly intertwined global economic environments [18].

2. Materials and Methods

2.1. Material

This study included 229 si-gun-gu (cities [si], counties [gun] of nine provinces, and districts [gu] of eight metropolitan areas) administrative units. Employee statistics were derived from the Census on Establishments applying the 9th revision of the Korean Standard Industrial Classification at the three-digit level. To measure evolutionary resilience, a shift-share analysis was used for time-series employment data (2002, 2008, and 2016) to identify the changes in industrial structure and structural changes in regional competitive advantages. To measure engineering resilience, a panel data model was constructed using annual data from the period 2002–2008 and the no-crisis employment growth rate was predicted and compared with actual post-crisis employment.

2.2. Methods

We applied shift-share analysis to observe how the industrial structure and location advantages of the region changed before and after the crisis (evolutionary resilience) and the panel data model to predict employment growth when a crisis does not occur and to measure resilience compared to actual employment (engineering resilience).

2.2.1. Shift-Share Analysis

Evolutionary resilience is a system’s capacity to adapt to a crisis by reconfiguration; that is, adapting its structure (firms, industries, technologies, and institutions) to maintain an acceptable growth path of employment, output, and wealth over time [4]. This reorganization-based regional adaptive capacity may be understood through shift-share analysis [19]. Resilience can be demonstrated by the post-shock maintenance or improvement of an industry through reorganization, which can be understood as the industrial mix and regional shift components.
Shift-share analysis is a decomposition analysis designed to derive the components of regional employment growth by comparing a region’s employment data from two points in time. The total employment change can be decomposed using Equation (1):
L i r t + m L i r t = N S t + m + I M t + m + R S t + m
The employment change in industry i in region r at one point in time between t + m and t can be broken down into the national shift (NS), industrial mix (IM), and regional shift (RS); these are growth components at the national, industrial, and regional levels, respectively. NS represents the change in employment induced by national growth. IM represents the employment change as region r’s share of the nationwide growth of a specific industry attributable to region r’s specification in that industry. RS represents the employment change due to region r’s own growth as a trickle-down effect of employment change due to regional growth. These components of regional employment change can be calculated using Equation (2):
g i r L i r t = g n L i t t + g i n g n L i t t + g i r g i n L i t t
The regional industrial growth rate can be broken down into three components by adding and subtracting the national growth rate g i n of industry i and national economic growth rate   g n at the point in time t from the regional growth rate   g i r of regional industry i at the point in time t set on both sides of the equation. As a result, the employment change of industry in region r at the point in time t is obtained in three components of NS, measured by the national employment growth rate ( g n ), IM measured by the difference between the national employment growth rate by industry and the national economic growth rate ( g i n g n ), and RS, measured by the difference between the regional employment growth rate by industry and the national employment growth rate by industry ( g i r g i n ).
This study defined the positive values of IM and RS with respect to regional employment change as the regional competitive advantages of industrial structure and geographic location. The identification of post-recession changes in the industrial structure and the locational advantages of a region enables the verification of the industrial reorganization and measurement of the evolutionary resilience of the region. In this study, all analyzed regions were classified into four categories, depending on the values (positive or negative) of IM and RS in the periods of 2002–2008 and 2008–2016. Then, the evolutionary resilience of each region was assessed by checking the presence or absence of post–2008 changes in each category, as shown in Table 1.

2.2.2. Panel Data Model

Engineering resilience refers to the ability of a regional economy to return to the pre-recession growth path or develop into a new path when the post-recession economic situation has improved or deteriorated [20]. As suggested by Angulo et al. [19], to measure engineering resilience, it is necessary to first predict the no-crisis employment scenario growth rate. Angulo et al. [19] considered the seasonal factors for estimation with fixed effect and spatial dependence. However, this study does not consider the seasonal effect due to the limitation of data before the shock. We used the annual data as the dummy variable with no consideration of the time-series effect. In addition, we used a panel data model with random effect—having been described as a highly accurate prediction model [21,22]—allowing for unobservable cross-sectional and time effects as compared to a pooled model based on ordinary least squares. Next, to measure engineering resilience, we compared the expected employment scenario obtained by the panel data model with the actual employment. Equation (3) describes the panel data model used in this study:
y r t = β 1 + β 2 D Q 2 + β 3 D Q 3 + β 4 D Q 4 + μ r + η r t , μ r ~ N 0 , σ u 2 ,   η r t ~ N 0 , σ η 2
where y r t denotes the employment growth rate in region r during the 2002–2008 period measured at four–year intervals. D Q is a dummy variable for annual regional employment growth within the four–year interval (1 = growth, 0 = no growth). Let the dependent variable be the employment growth rate of region r during the 2002–2006 period; then, the independent variables are the growth dummy variables in the 2002–2003, 2003–2004, and 2004–2005 periods. In the comparison of the annual values estimated by the panel data model and the actual employment data from 2009 and 2016, resilience was considered to be present when the actual value was larger than the estimated value and not present when the actual value was smaller than the estimated value.

2.2.3. Exploratory Spatial Data Analysis

An exploratory spatial data analysis (ESDA) was used to identify the spatial agglomeration of resilience. After obtaining the absolute values of employment resilience (differences between the expected employment obtained by the panel data model and the actual employment) during the period 2009–2016, clusters were identified using the local Moran’s I [Equation (4)] proposed by Anselin [23] regarding national employment resilience after the 2008 economic crisis. We used the Queen contiguity method for the spatial weight matrix because the spatial polygon in this study is an irregular polygon:
I i = x i μ j w i j x j μ ,
where w i j denotes the spatial weight matrix between region i and adjacent region j, x i j denotes the level of employment resilience of region i or j , and μ denotes the mean value for the entire region.

3. Results

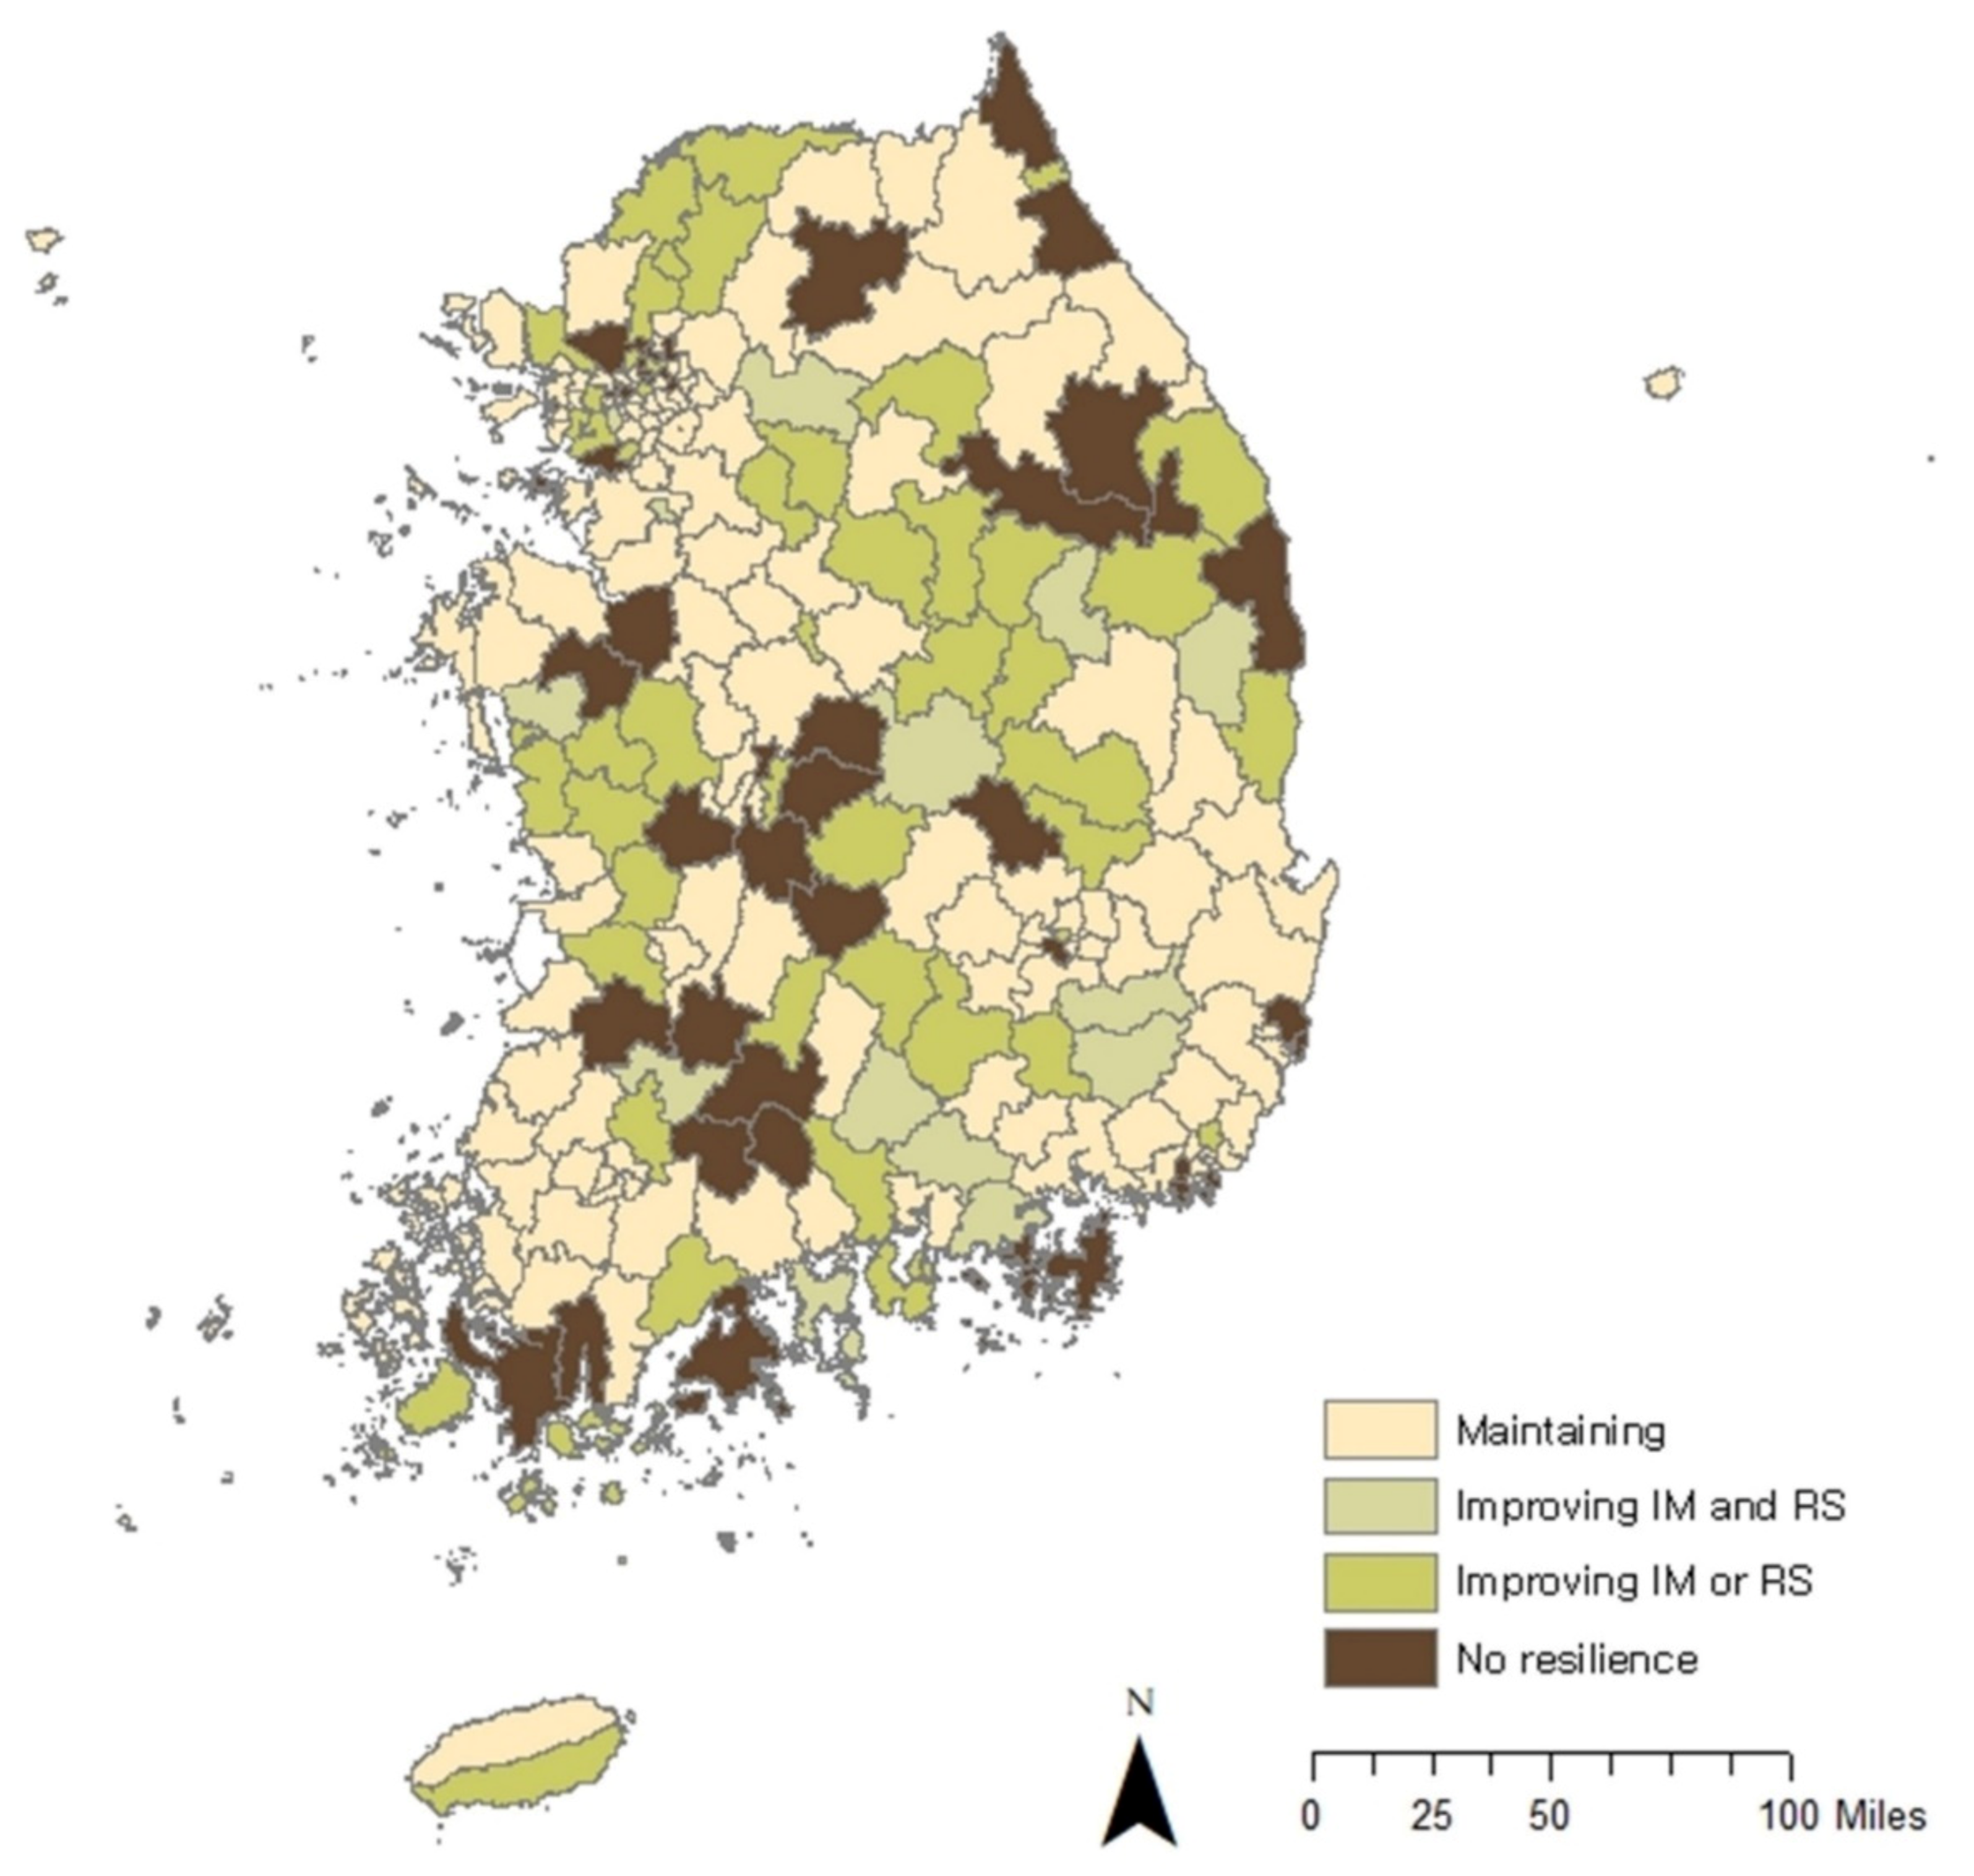
3.1. Evolutionary Resilience

Figure 1 illustrates the results of the shift-share analysis used to compare the regional differences in the IM and RS changes in the years before and after the 2008 global financial crisis. It is shown that at least one of the IM and RS scores has a positive value in most of the regions. This suggests that most regions had advantages related to industrial or geographical structures before and after the crisis.
Given that evolutionary resilience refers to the ability to adapt to crises through reconfiguration of regional structures, this study focused on regional industrial structures and verified resilience in industries with post-shock maintenance or improvement levels, achieved through industrial restructuring. This analysis revealed that, as shown in Figure 2, most regions across the country maintained or improved their pre-crisis economic performance levels by transforming their regional industrial structures or the regions themselves in the wake of the 2008 crisis, thereby proving to have evolutionary resilience.
Table 2 provides an overview of the post-crisis economic performance status of the 229 si-gun-gu units across the country in four categories: maintenance, improvement in IM or RS, improvement in IM and RS, and no resilience. It is worth noting that the regional economic resilience of the economic regions exhibits a certain pattern; an economic region refers to a functional region building a network of collaborations in industrial development and R&D investment going beyond the administrative boundaries of provinces and metropolitan areas [24]. In the capital economic region, Gyeonggido (n = 13) achieved more industrial structural improvement than Seoul (n = 3) and Incheon Metropolitan City (n = 1). In the Chungcheng economic region, Chungcheongbukdo (n = 5) and Chungcheongnamdo (n = 5) achieved more industrial structural improvement than Daejeon Metropolitan City (n = 1). Likewise, the Honam, Daegyeong, and Dongnam economic regions showed the same pattern of peripheral areas outperforming metropolitan areas in industrial restructuring and structural improvement.

3.2. Engineering Resilience

Table 3 presents the results of the panel data model analysis. All independent variables were statistically significant at the 95% confidence level. The beta value of each variable was checked to identify its impact on the employment growth rate (dependent variable). Furthermore, the annual employment growth rates were predicted under a no-recession scenario. Table 4 presents the comparison results between the predicted and actual employment growth rates for the period 2009–2016. For most regions, the difference between the actual and predicted values was positive, which demonstrates engineering resilience. However, higher absolute amounts of post–2009 employment appeared in the capital economic region and the adjacent parts of the Chungcheong and Dongnam economic regions, compared with other regions.
A comparison of the absolute amounts of post-crisis employment revealed various patterns of resilience within metropolitan economic areas. First, in the capital economic region, downtown areas, such as Jongno-gu and Jung-gu in Seoul, showed low employment resilience. Areas with higher employment resilience were Geumcheon-gu, Seocho-gu, and Gangnam-gu in Seoul, as well as Seongnam. These regions are located in the Gasan Digital Complex, Hi-Tech Valley, and Teheran-ro; they have high concentrations of entrepreneurship in industries such as the IT industry, fintech, and global trade. Meanwhile, in metropolitan economies other than the Seoul capital area, employment resilience tended to be high in regions that specialized in manufacturing, such as Changwon, Gumi, and Gunsan.

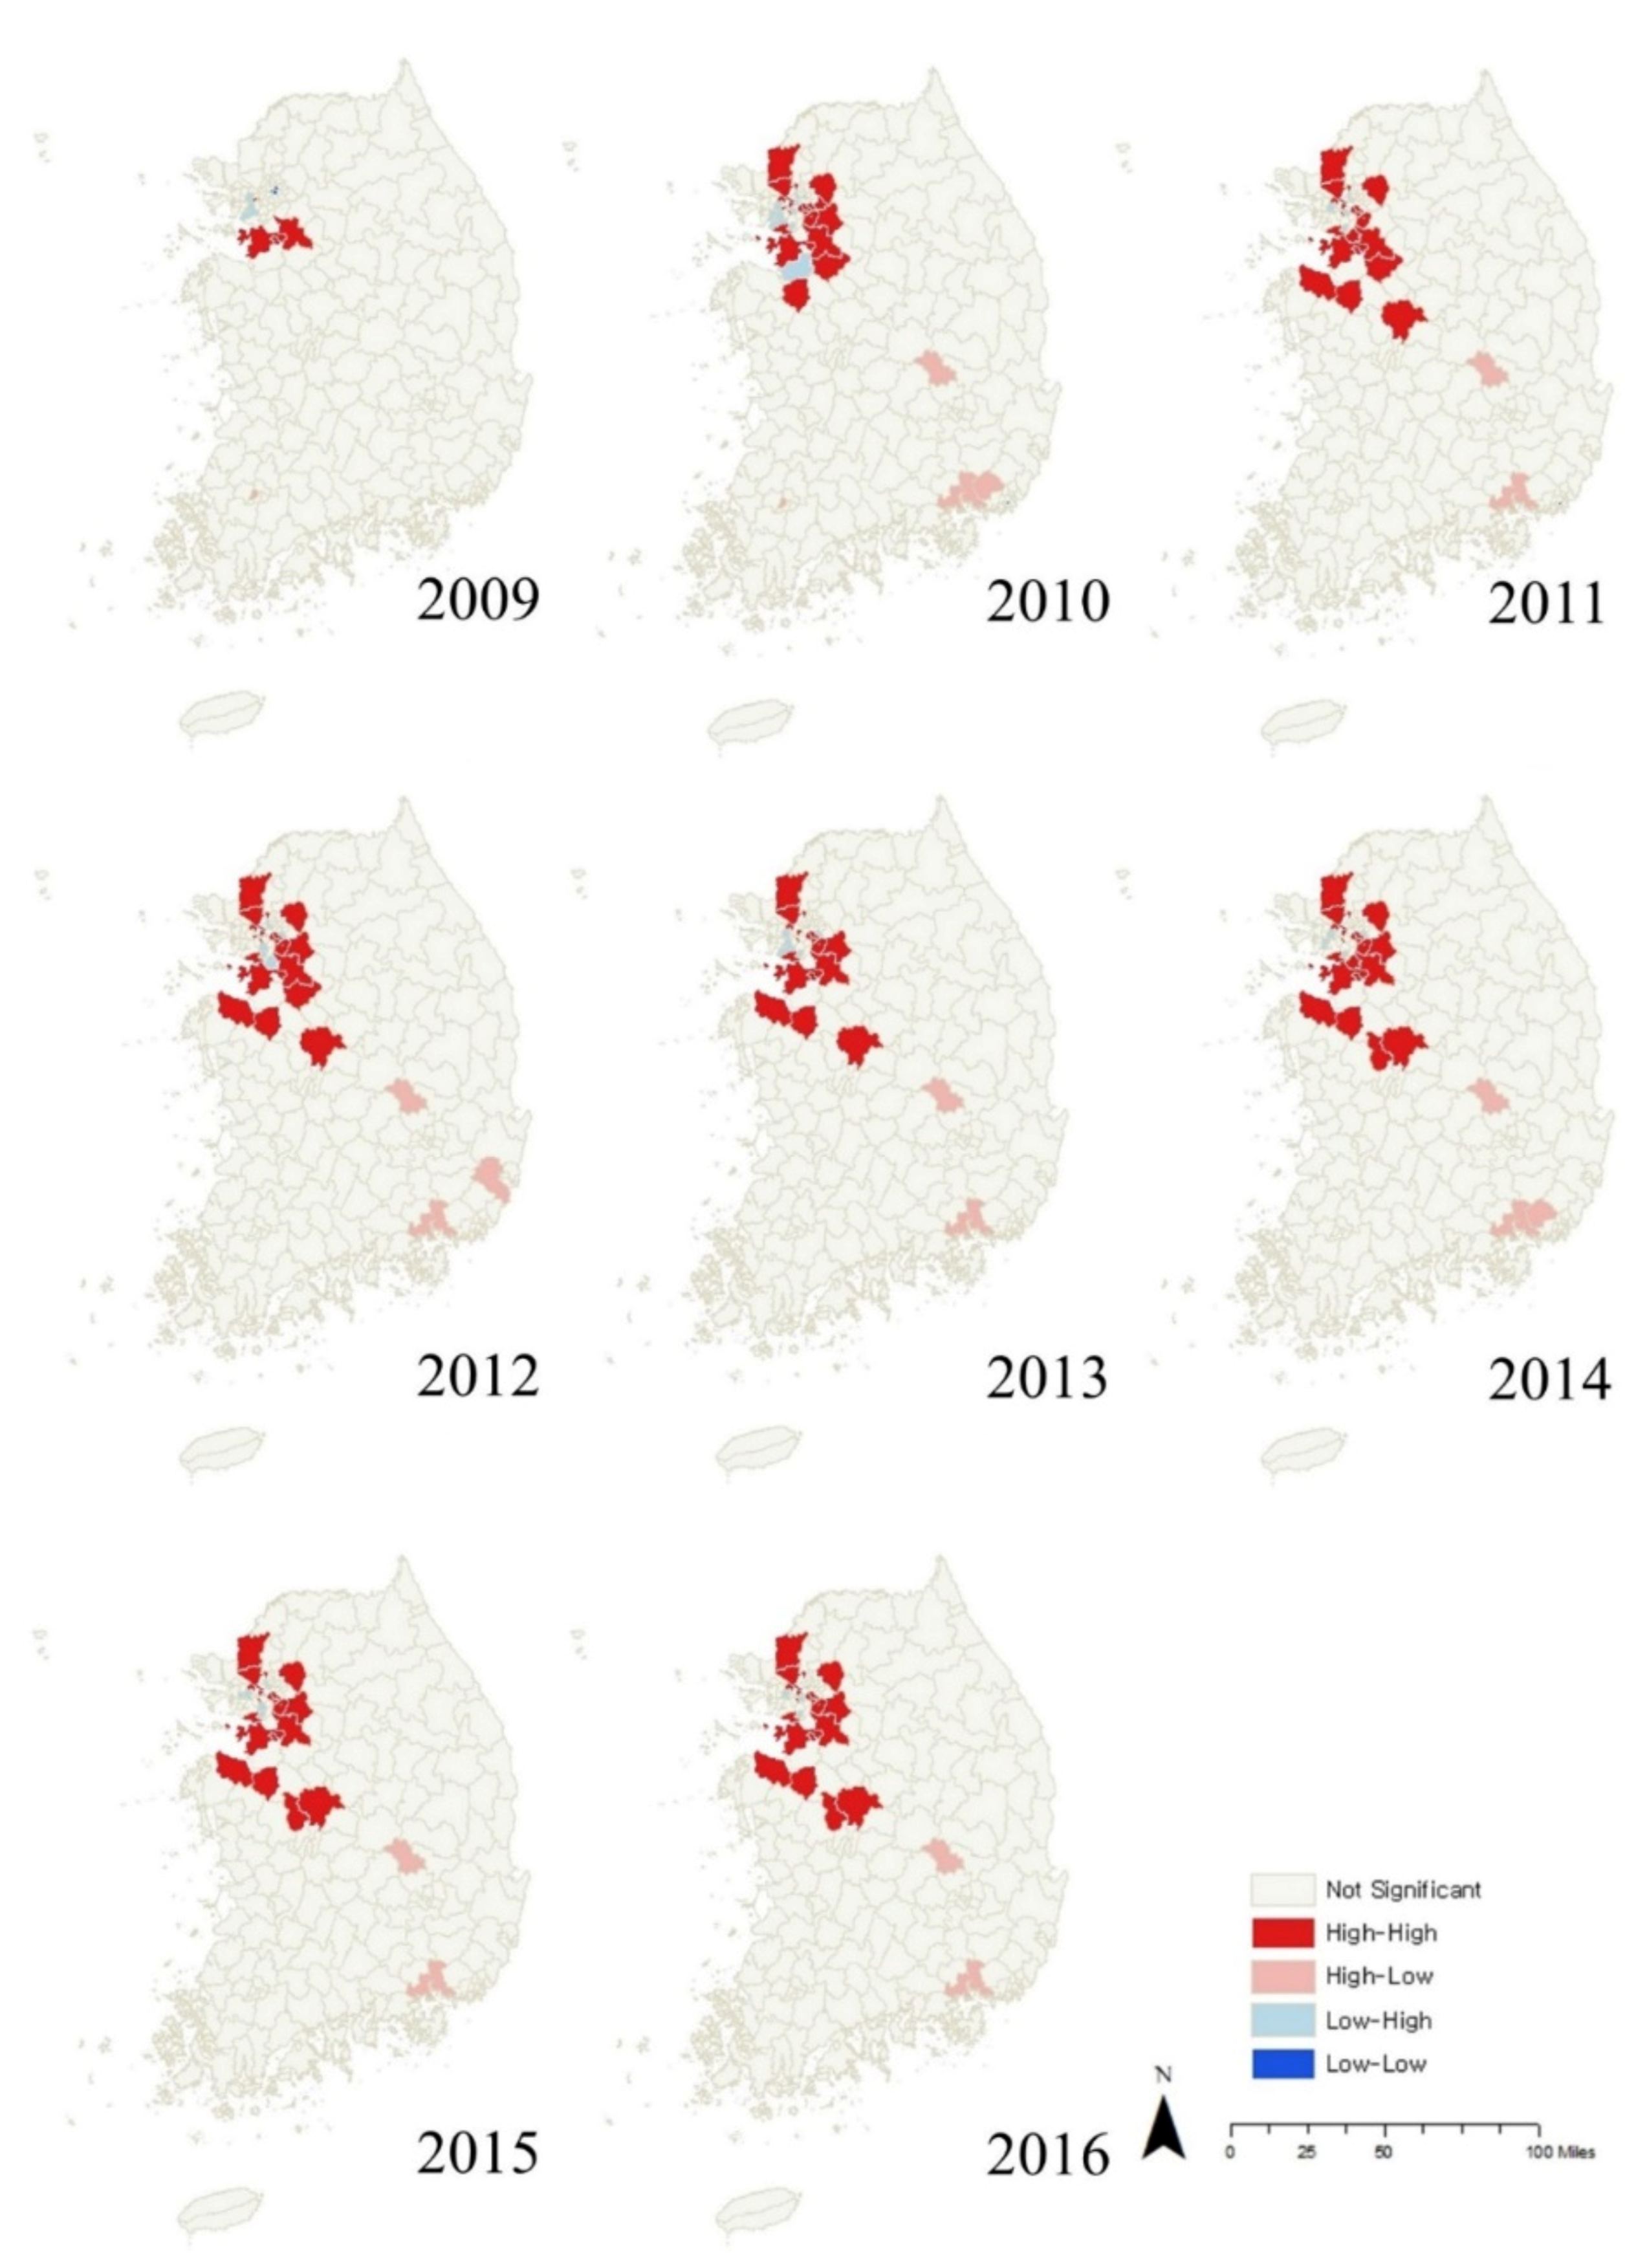
3.3. Spatial Concentration of Engineering Resilience

Local indicators of spatial association were applied to the engineering resilience values obtained to identify the existing clusters. Figure 3 illustrates the results. The HH (high-high) clusters of employment resilience in 2009 were Guro-gu (Seoul), Osan, Yongin, and Hwaseong, with a high spatial concentration around the capital economic region. From 2010, these HH clusters were extended to Mapo-gu, Gangseo-gu, Geumcheon-gu, Yeongdeungpo-gu, Seocho-gu, and Gangnam-gu in Seoul, Seongnam, Ansan, Goyang, Namyangju, Osan, Yongin, Paju, Hwaseong, and Gwangju in Gyeonggido. A few cities of the Chungcheong economic area, including Cheongju, Asan, and Dangjin, were also classified as HH clusters. This development indicates that the pattern of HH clusters was concentrated in the capital economic region in the wake of the 2008 financial crisis, extending to other districts and cities in and around this area with an increasing tendency over time, reaching out to some adjacent cities in the Chungcheong economic area.

4. Discussion and Conclusions

This study quantitatively measured the evolutionary and engineering resilience of Korea’s regional economies using a shift-share analysis and panel data model, respectively. The analysis of evolutionary resilience was performed to identify the presence of regional reconfiguration driven by the changes in the structural and locational advantages of regional industries. Engineering resilience was analyzed by comparing the predicted and actual post-crisis growth paths. This study focused on the annual pattern to deal with the employment resilience pattern because of the lack of monthly or quarterly employment data. However, there is a possibility that a time-series pattern exists in the employment data, and it is necessary to improve the analytic model considering stationary and cointegration of data. In this study, as in previous studies, the time of global economic crisis shock was fixed at 2008. However, the effects of global economic shock may appear at different times in each region. In order to analyze this, it is necessary to first understand the change in the time series pattern based on monthly or quarterly employment data, and then consider the timing of different shocks for each region. This study could not be carried out due to the data limitations, but it needs to be considered in future studies. Our main conclusions can be summarized in three key points. First, most regions in Korea exhibited both evolutionary and engineering resilience in the years following the 2008 global financial crisis; both analyses revealed that most regions in Korea displayed regional economic resilience against the crisis. Second, each regional economy showed a common pattern of regional economic resilience. Regarding evolutionary resilience, a pattern of structural improvements was shown in the peripheral areas of the metropolitan cities. Within the capital economic region, structural improvements were implemented more intensively in Gyeonggido than in Seoul, and a similar pattern was observed in the non-capital economic region. Third, the pattern of post–2008 employment resilience was skewed toward the capital economic region; however, over time, the pattern extended to other districts and cities within the capital economic region and some adjacent areas in the Chungcheong economic area. Other regions had lower employment resilience, showing considerable regional inequality in employment patterns, with a continuous overconcentration in the capital economic region.
The results of this study have implications for more resilient regional economic policies in the regional economic structure that is being transformed into a mega region. As suggested by Capello, Caragliu, and Fratesi [25], our study showed that the mega region or agglomeration region was more resilient. The economic region, which we consider a mega region, is divided into a metropolitan area and its surrounding area. It was found that the resilience of structural changes was more improved in the surrounding area than in the metropolitan area. This means that the quantitative degree of resilience and the structural changes can vary, depending on the functional role of the city in the mega region. The difference between the metropolitan area and the surrounding area is considered to be due to the negative impact of the level of complexity within the metropolitan area, as discussed by both Simmie and Martin [9] and Courvisanos, Jains, and Mardaneh [26]. Meanwhile, the structural changes and improved results of the employment rate in the surrounding regions support Capello et al.’s [25] work, which states that changes in the surrounding regions with more innovative capacity can aid the resilience of the entire economic region. Monsson [27] suggests that it is not easy to create a new growth path with only urban hinterlands in the economic region. This is especially true if the regional economy is based on low-skill manufacturing, residential service, and agriculture. In order to respond to the economic shock, the functions between the core area and the surrounding area in a regional economic unit should be linked, thus taking a holistic and dynamic approach rather than a policy that takes a different approach for each single city [28,29]. Therefore, the results of this study suggest that, to strengthen the resilience of the regional economy after an economic crisis, a decentralized investment and development strategy that considers the economic function between cities in mega regions is needed, rather than the existing strategy centered on the metropolitan area.
Furthermore, this study shows that differing recovery outcomes of the regional economies within a country after the economic crisis can lead to regional inequality. In the capital economic region, where the IT industry, finance, and global trade are concentrated, employment resilience appeared through structural transformation in terms of qualitative aspects; in the non-metropolitan region, however, we found that resilience was centered on the manufacturing sector. This is supported by a more concentrated pattern in the capital economic region, where concentration was intensified in the past in terms of the quantity of total employment. These results support that the occurrence of regional impacts in the resilience process were mainly in neighboring regions, and that, for Korea, differences may exist between regions in the process of overcoming the global economic crisis, as discussed by Fingleton et al. [5]. Such regional inequalities may arise based upon the linkages and effects of industries within and between regions; they may also vary according to technical links [12,30]. In addition, Martin et al. [31] stated that the influence of economic structure is decreasing in the recessionary phase, and Ezcurra [32] suggested a positive relationship between unemployment volatility and regional specialization. This means that employment resilience, which can be linked to regional inequality, can also be linked with economic structure that can be discussed in quantitative terms, as well as regional-specific factors that can be discussed in qualitative terms. Therefore, this study suggests that regional inequalities in the process of responding to economic crises are likely to include both quantitative and qualitative aspects, and that policies that accompany more structural improvements should be implemented.

Author Contributions

Research design, S.Y.; data collection and processing, S.Y.; analysis, S.Y.; writing—original draft preparation, S.Y.; guidance, D.K.; writing—review and editing, D.K. All authors have read and agreed to the published version of the manuscript.

Funding

This research was funded under the Basic Science Research Program through the National Research Foundation of Korea (NRF) supported by the Ministry of Education (No. 2020R1I1A3056561).

Institutional Review Board Statement

Not applicable.

Informed Consent Statement

Not applicable.

Data Availability Statement

All data of this study were taken from the KOSIS website by Statistics Korea (https://kosis.kr/eng/, accessed on 24 August 2021).

Conflicts of Interest

The authors declare no conflict of interest.

References

  1. Foster, K.A. A case study approach to understanding regional resilience. In Working Paper; Institute of Urban and Regional Development, University of California, Berkeley: Berkeley, CA, USA, 2007. [Google Scholar]
  2. Hill, E.W.; Wial, H.; Wolman, H. Exploring regional economic resilience. In Working Paper; Institute for Urban and Regional Development, University of California, Berkeley: Berkeley, CA, USA, 2008. [Google Scholar]
  3. Holling, C.S. Resilience and stability of ecological systems. Annu. Rev. Ecol. Evol. Syst. 1973, 4, 1–23. [Google Scholar] [CrossRef] [Green Version]
  4. Martin, R. Regional economic resilience, hysteresis and recessionary shocks. J. Econ. Geogr. 2012, 12, 1–32. [Google Scholar] [CrossRef]
  5. Fingleton, B.; Garretsen, H.; Marin, R. Recessionary shocks and regional employment: Evidence on the resilience of UK regions. J. Reg. Sci. 2012, 52, 109–133. [Google Scholar] [CrossRef]
  6. Ringwood, L.; Watson, P.; Lewin, P. A quantitative method for measuring regional economic resilience to the great recession. Growth Chang. 2019, 50, 381–402. [Google Scholar] [CrossRef] [Green Version]
  7. Caro, P.D. Testing and explaining economic resilience with an application to Italian regions. Pap. Reg. Sci. 2017, 96, 93–113. [Google Scholar] [CrossRef]
  8. Pike, A.; Dawley, S.; Tomaney, J. Resilience, adaptation and adaptability. Camb. J. Reg. Econ. Soc. 2010, 3, 59–70. [Google Scholar] [CrossRef]
  9. Simmie, J.; Martin, R. The economic resilience of regions: Toward an evolutionary approach. Camb. J. Reg. Econ. Soc. 2010, 3, 27–43. [Google Scholar] [CrossRef] [Green Version]
  10. Ramlogan, R.; Metcalfe, J.S. Restless capitalism: A complexity perspective on modern capitalist economies. In Complexity and Co-Evolution; Gransey, E., McGlade, J., Eds.; Edward Elgar Publishing: Cheltenham, UK, 2006. [Google Scholar]
  11. Berkes, F.; Folke, C. Linking Social and Ecological Systems: Management Practices and Social Mechanisms for Building Resilience; Cambridge University Press: New York, NY, USA, 1998. [Google Scholar]
  12. Diodato, D.; Weterings, A.B.R. The resilience of regional labour markets to economic shocks: Exploring the role of interactions among firms and workers. J. Econ. Geogr. 2015, 15, 723–742. [Google Scholar] [CrossRef]
  13. Juntao, T.; Pingyu, Z.; Kevin, L.; Jing, L.; Shiwei, L. Conceptualizing and measuring economic resilience of resource-based cities: Case study of Northeast China. Chin. Geogr. Sci. 2017, 27, 471–481. [Google Scholar]
  14. Stognief, N.; Walk, P.; Schöttker, O.; Oei, P.-Y. Economic resilience of German Lignite Regions in Transition. Sustainability 2019, 11, 5991. [Google Scholar] [CrossRef] [Green Version]
  15. Holling, C.S. Understanding the complexity of economic, ecological, and social systems. Ecosystems 2001, 4, 390–405. [Google Scholar] [CrossRef]
  16. Shutters, S.; Kandal, S.S.; Wei, F.; Kinzig, A.P. Resilience of urban economic structures following the great recession. Sustainability 2021, 13, 2374. [Google Scholar] [CrossRef]
  17. Lee, J.-W. Twenty years after the financial crisis in the Republic of Korea. In ADBI Working Paper No. 790; Asian Development Bank Institute: Tokyo, Japan, 2017. [Google Scholar]
  18. Martin, R.; Gardiner, B. The resilience of cities to economic shocks: A tale of four recessions. Pap. Reg. Sci. 2019, 98, 1801–1832. [Google Scholar]
  19. Angulo, A.M.; Mur, J.; Trívez, F.J. Measuring resilience to economic shocks: An application to Spain. Ann. Reg. Sci. 2018, 60, 349–373. [Google Scholar] [CrossRef]
  20. Evenhuis, E. New directions in researching regional economic resilience and adaptation. Geogr. Compass 2017, 11, 1–15. [Google Scholar] [CrossRef]
  21. Baltagi, B.H. Forecasting with panel data. J. Forecast. 2008, 27, 153–173. [Google Scholar] [CrossRef]
  22. Liu, L.; Moon, H.R.; Schorfheide, F. Forecasting with dynamic panel data models. Econometrica 2020, 88, 171–201. [Google Scholar] [CrossRef] [Green Version]
  23. Anselin, L. Local indicators of spatial association-LISA. Geogr. Anal. 1995, 27, 93–115. [Google Scholar] [CrossRef]
  24. OECD (Organisation for Economic Co-operation and Development). Industrial policy and territorial development: Lessons from Korea. In Development Centre Studies; OECD Publishing: Paris, France, 2012. [Google Scholar]
  25. Capello, R.; Caragliu, A.; Fratesi, U. Spatial heterogeneity in the costs of the economic crisis in Europe: Are cities sources of regional resilience? J. Econ. Geogr. 2015, 15, 951–972. [Google Scholar] [CrossRef]
  26. Courvisanos, J.; Jains, A.; Mardaneh, K.K. Economic resilience of regions under crises: A study of the Australian economy. Reg. Stud. 2016, 50, 629–643. [Google Scholar] [CrossRef]
  27. Monsson, C.K. Resilience in the city-core and its hinterland: The case of Copenhagen. Local Econ. 2015, 30, 191–214. [Google Scholar] [CrossRef]
  28. Ženka, J.; Slach, O.; Pavlík, A. Economic resilience of metropolitan, old industrial, and rural regions in two subsequent recessionary shocks. Eur. Plan. Stud. 2019, 27, 2288–2311. [Google Scholar] [CrossRef]
  29. Fratesi, U.; Rodríguez-Pose, A. The crisis and regional employment in Europe: What role for sheltered economies? Camb. J. Reg Econ. 2016, 9, 33–57. [Google Scholar] [CrossRef]
  30. Han, Y.; Goetz, S.J. Predicting US country economic resilience from industry input-output accounts. Appl. Econ. 2019, 51, 2019–2028. [Google Scholar] [CrossRef]
  31. Martin, R.; Sunley, P.; Gardiner, B.; Tyler, P. How regions react to recessions: Resilience and the role of economic structure. Reg. Stud. 2016, 50, 561–585. [Google Scholar] [CrossRef] [Green Version]
  32. Ezcurra, R. Unemployment volatility and regional specialization in the European Union. Reg. Stud. 2011, 45, 1121–1137. [Google Scholar] [CrossRef] [Green Version]
Figure 1. IM and RS changes between the years before (a) and after (b) the 2008 Global Financial Crisis. (IM means Industrial Mix and RS means Regional Shift in Shift-Share Analysis).
Sustainability 13 11392 g001
Figure 2. Regional changes in evolutionary resilience to the 2008 crisis. (IM means Industrial Mix and RS means Regional Shift in Shift-Share Analysis).
Sustainability 13 11392 g002
Figure 3. Spatial concentration of engineering resilience.
Sustainability 13 11392 g003
Table 1. Assessment of evolutionary resilience through industrial mix (IM) and regional shift (RS).
2002–20082008–2016Resilience Assessment
IM   ( g i n g n ) RS   ( g i r g i n ) IM   ( g i n g n ) RS   ( g i r g i n )
++++Maintenance
+++Maintenance
+++Maintenance
++Absence
+++Improvement
++Maintenance
++Maintenance
+absence
+++improvement
++maintenance
++maintenance
+absence
++presence
+presence
+presence
absence
Table 2. Changes in evolutionary resilience in the wake of the 2008 crisis.
Economic RegionAdministrative RegionMaintenanceImprovementNo Resilience
IM or RSIM and RS
Capital Economic RegionSeoul (Central Metropolitan Area)(n =14) Gangnam-gu, Gangdong-gu, Gangseo-gu, Gwanak-gu, Guro-gu, Geumcheon-gu, Dobong-gu, Dongjak-gu, Mapo-gu, Seodaemun-gu, Seocho-gu, Seongdong-gu, Songpa-gu, Jungnang-gu(n = 3) Yongsan-gu, Seongbuk-gu, Eunpyeong-gu (n = 8) Gangbuk-gu, Gwangjin-gu, Nowon-gu, Dongdaemun-gu, Yangcheon-gu, Yeongdeungpo-gu, Jongno-gu, Jung-gu
Inchon
(Periphery)
(n = 8) Ganghwa-gun, Gyeyang-gu, Nam-gu, Bupyeong-gu, Seo-gu, Yeonsu-gu, Ongjin-gun, Jung-gu(n = 1) Namdong-gu (n = 1) Dong-gu
Gyeonggido
(Periphery)
(n = 16) Gapyeong-gun, Gwacheon, Gwangju, Guri, Namyangju, Seongnam, Suwon, Anseong, Anyang, Yongin, Uiwang, Uijeongbu, Paju, Pyeongtaek, Hanam, Hwaseong(n = 10) Gunpo, Gimpo, Dongducheon, Bucheon, Siheung, Yangju, Yeojui, Yeoncheon-gun, Icheon, Pocheon(n = 3) Gwangmyeong, Yangpyeong-gun, Osan(n = 2) Goyang, Ansan
Dongnam Economic RegionBusan (Central Metropolitan Area)(n = 10) Gangseo-gu, Gijang-gun, Dong-gu, Dongnae-gu, Busanjin-gu, Buk-gu, Seo-gu, Suyeong-gu, Yeonje-gu, Haeundae-gu(n = 1) Geunjeong-gu (n = 5) Nam-gu, Sasang-gu, Saha-gu, Yeongdo-gu, Jung-gu
Ulsan
(Periphery)
(n = 3) Nam-gu, Ulju-gun, Jung-gu (n = 2) Dong-gu, Buk-gu
Gyeongsangnamdo
(Periphery)
(n = 7) Gimhae, Sacheon, Yangsan, Uiryeong-gun, Changwon, Haman-gun, Hamyang-gun(n = 5) Geochang-gun, Namhae-gun, Changnyeong-gun, Hadong-gun, Hapcheon-gun(n = 4) Goseong-gun, Miryang, Sancheong-gun, Jinju(n = 2) Geoje, Tongyeong
Daegyeong Economic RegionDaegu (Central Metropolitan Area)(n = 6) Nam-gu, Dalseong-gun, Dong-gu, Buk-gu, Suseong-gu, Jung-gu(n = 1) Seo-gu (n = 1) Dalseo-gu
Gyeongsangbukdo
(Periphery)
(n = 11) Gyeongsan, Gyeongju, Goryeong-gun, Gimcheon, Seongju-gun, Andong, Yeongcheon, Ulleung-gun, Cheongsong-gun, Chilgok-gun, Pohangi(n = 6) Gunwi-gun, Mungyeong-si, Bonghwa-gun, Yeongdeok-gun, Yecheon-gun, Uiseong-gun(n = 4) Sangju, Yeongyang-gun, Yeongju, Cheongdo-gun(n = 2) Gumi, Uljin-gun
Chungcheong Economic RegionDaejeon (Central Metropolitan Area)(n = 3) Seo-gu, Yuseong-gu, Jung-gu(n = 1) Dong-gu (n = 1) Daedeok-gu
Chungcheongbukdo
(Periphery)
(n = 4) Goesan-gun, Eumseong-gun, Jincheon-gun, Cheongju(n = 5) Danyang-gun, Yeongdong-gun, Jecheon, Jeungpyeong-gun, Chungju (n = 2) Boeun-gun, Okcheon-gun
Chungcheongnamdo
(Periphery)
(n = 7) Gyerong, Dangjin, Seosan, Seocheon-gun, Sejong, Cheonan, Taean-gun(n = 4) Gongju, Boryeong, Buyeo-gun, Cheongyang-gun(n = 1) Hongseong-gun(n = 4) Geumsan-gun, Nonsan, Asan, Yesan-gun
Honam Economic RegionGwangju (Central Metropolitan Area)(n = 5) Gwangsan-gu, Nam-gu, Dong-gu, Buk-gu, Seo-gu
Jeonllabukdo
(Periphery)
(n = 6) Gochang-gun, Gunsam, Buan-gun, Wanju-gun, Jeonju, Jinan-gun(n = 3) Gimje, Iksan, Jangsu-gun(n = 1) Sunchang-gun(n = 4) Namwon, Muju-gun, Imsil-gun, Jeongeup
Jeollanamdo
(Periphery)
(n = 12) Gwangyang, Naji, Mokpo, Muan-gun, Suncheon, Sinan-gun, Yeonggwang-gun, Yeongam-gun, Jangseong-gun, Jangheung-gun, Hampyeong-gun, Hwasun-gun(n = 4) Damyang-gun, Boseong-gun, Wando-gun, Jindo-gun(n = 1) Yeosu(n = 5) Gangjin-gun, Goheung-gun, Gokseong-gun, Gurye-gun, Haenam-gun
Gangwon Economic RegionGangwondo(n = 8) Gangneungi, Donghae, Yanggu-gun, Wonju, Inje-gun, Pyeongchang-gun, Hongcheon-gun, Hwacheon-gun(n = 4) Samcheok, Sokcho, Cheorwon-gun, Hoengseong-gun (n = 6) Goseong-gun, Yangyang-gun, Yeongwol-gun, Jeongseon-gun, Chuncheon, Taebaek
Jeju Economic RegionJeju(n = 1) Jeju(n = 1) Seoguipo
Table 3. Estimation results obtained using the employment prediction model.
Independent Var.CoefficientStandard Errort-Scorep-Value
DQ2 (regional employment growth between 2002 and 2003)0.08573860.004732418.120.000
DQ3 (regional employment growth between 2003 and 2004)0.08451640.004946117.090.000
DQ4 (regional employment growth between 2004 and 2005)0.09257280.005034118.390.000
constant0.89583740.0070548126.980.000
sigma   μ r 0.06360864
sigma   η r t 0.05580137
rho0.56510368
Table 4. Results of engineering resilience estimation.
Category20092010201120122013201420152016
Seoul Capital Areamean1910609871738199946712,20016,28917,677
max
(local)
27,490
(Geumcheon-gu, Seoul)
85,091
(Seocho-gu, Seoul)
90,274
(Seocho-gu, Seoul)
86,771
(Seongnam)
120,341
(Seongnam)
139,288
(Seongnam)
190,270
(Gangnam-gu, Seoul)
216,297
(Gangnam-gu, Seoul)
min
(local)
−19,710
(Jongno-gu, Seoul)
−18,321
(Jongno-gu, Seoul)
−28,083
(Jongno-gu, Seoul)
−30,882
(Jung-gu, Seoul)
−59,496
(Jung-gu, Seoul)
−61,787
(Jung-gu, Seoul)
−31,337
(Jung-gu, Seoul)
−65,875
(Jung-gu, Seoul)
Chungcheongmean212847946949793910,95513,83115,57417,315
max
(local)
12,420
(Yuseong-gu, Daegu)
23,358
(Yuseong-gu, Daegu)
32,905
(Cheongju)
51,586
(Cheongju)
59,135
(Cheongju)
73,719
(Cheongju)
90,559
(Cheongju)
104,070
(Cheongju)
min
(local)
−2538
(Jung-gu Daegu)
−969
(Boryeong)
−3171
(Daedeok-gu, Daejeon)
−1629
(Daedeok-gu, Daejeon)
−3894
(Jung-gu Daejeon)
−6327
(Daedeok-gu, Daejeon)
−8291
(Daedeok-gu, Daejeon)
−8537
(Daedeok-gu, Daejeon)
Honammean1962395755496351849710,62412,11413,305
max
(local)
15,389
(Gunsan)
21,876
(Gunsan)
26,936
(Gunsan)
26,476
(Gunsan)
31,618
(Gunsan)
36,541
(Gunsan)
40,539
(Gunsan)
39,370
(Gunsan)
min
(local)
−3495
(Buk-gu, Gwangju)
−8785
(Buk-gu, Gwangju)
−16,010
(Buk-gu, Gwangju)
−11,712
(Buk-gu, Gwangju)
−17,930
(Buk-gu, Gwangju)
−21,067
(Buk-gu, Gwangju)
−19,474
(Buk-gu, Gwangju)
−14,272
(Buk-gu, Gwangju)
Dongnammean169132634576538070768531999711,030
max
(local)
19,237
(Changwon)
25,439
(Changwon)
50,024
(Changwon)
58,647
(Changwon)
78,243
(Changwon)
83,798
(Changwon)
105,295
(Changwon)
115,125
(Changwon)
min
(local)
−3934
(Seo-gu, Busan)
−11,689
(Dong-gu, Busan)
−14,886
(Dong-gu, Busan)
−13,027
(Asang-gu, Busan)
−17,856
(Asang-gu, Busan)
−21,739
(Dong-gu, Busan)
−20,587
(Dong-gu, Busan)
−25,734
(Sasang-gu, Busan)
Daegu-Gyeongbukmean16133308459853237093861310,04711,158
max
(local)
8614
(Gumi)
26,571
(Gumi)
33,990
(Gumi)
34,595
(Gumi)
52,046
(Gumi)
52,318
(Gumi)
63,351
(Gumi)
62,095
(Gumi)
min
(local)
−3400
(Gyeongsan)
−4091
(Jung-gu, Daegu)
−5312
(Jung-gu, Daegu)
−5742
(Seo-gu, Daegu)
−7182
(Suseong-gu, Daegu)
−10,453
(Suseong-gu, Daegu)
−13,142
(Pohang)
−15,726
(Pohang)
Note: In the names of si (city), gun (county), and gu (district of a metropolitan city), those without -gun or -gu are cities.
Publisher’s Note: MDPI stays neutral with regard to jurisdictional claims in published maps and institutional affiliations.

