Abstract
This study aimed to investigate the dynamics of the nutrient budget of a macroalgal community exposed to water discharged from aquaculture farms. This study was conducted in the coastal area exposed to water discharged from aquaculture farms located on Jeju Island, Korea, in May and October of 2017. Water-column-dissolved inorganic nutrient concentrations were higher in the intertidal zone than in the subtidal zone. High nutrient concentrations in the intertidal zone resulted in the bloom of Ulva spp., consequently leading to a low species number. This indicates the vulnerability of the intertidal macroalgal community to discharge from land-based aquaculture. Ecklonia cava contributed to 29–53% of the total incorporation of carbon (C), nitrogen (N), and phosphorus (P) in the subtidal zone. In the intertidal zone, the highest tissue N content was found in Ulva spp. due to the high and rapid nutrient uptake rate from the effluent with high nutrient concentrations, thereby indicating high total N incorporation. The estimated total C, N, and P incorporation rates by macroalgae were 181.5, 8.6, and 0.95 tons year−1, respectively. These results suggest that the macroalgal community in this area absorbs or removes large amounts of nutrients from the water column and plays an important role in the budgets and cycling of nutrients in the surrounding coastal areas.
1. Introduction
Coastal areas are among the most valuable ecosystems in the world due to their high biodiversity and productivity [1]. However, coastal areas have been severely affected by natural and anthropogenic events such as climate change, coastal development, and excessive nutrient release from various human-related activities [2,3,4]. In particular, effluents from aquaculture and sewage treatments cause coastal eutrophication, which results in algal blooms, hypoxia, and changes in the macroalgal community [5,6,7]. Green macroalgal blooms in the Gulf of California are caused by fertilizer runoff through channels and streams [8]. Since 1986, the number of land-based fish farms on Jeju Island, Korea, has increased rapidly, with more than 350 land-based fish farms along the coast of Jeju Island as of 2020 [9]. As a result of this increase, a large amount of fish farm effluent with high nutrient concentrations is discharged off the coast of the island [10,11]. Therefore, macroalgal dynamics in terms of changes in community structure and nutrient incorporation by macroalgae have received considerable attention in an attempt to understand the nutrient budgets and current status of the coastal ecosystems off Jeju Island.
Macroalgae have been used as bioindicators in the assessment of ecosystem health status in the world [12,13]. Due to the sensitivity of macroalgae to various stresses, macroalgal assemblages are widely considered as ecological indicators for monitoring and impact evaluation studies [14,15,16]. In contrast to mobile marine organisms, the macroalgal assemblage on a rocky shore reflects the present, as well as previous, environmental conditions [17,18]. Macroalgae exhibiting distinct zonation patterns in the intertidal and subtidal zones are exposed to highly variable environmental conditions, depending on the tidal level [19,20,21]. Given that effluents from fish farms flow into nearby coastal areas, intertidal macroalgal communities are more sensitive to effluent exposure, compared with other communities [22,23]. Thus, the structure of a given macroalgal community has been used as an effective tool for investigating the effects of nutrient enrichment in rocky shore coastal ecosystems [6,21]. In particular, the macroalgal community of Jeju Island is expected to have distinctive distributional characteristics due to exposure to effluents from land-based fish farms.
Macroalgae are the primary producers in rocky shore coastal ecosystems, providing material circulation, food sources, habitats, and spawning grounds for various marine organisms such as fish and shellfish [21,24,25]. Macroalgae are involved in rapid carbon cycling due to short-lived perennials or annual ephemerals [26]. Specifically, the bloom-forming macroalgae or kelp species take up and sequester large amounts of nutrients such as carbon (C), nitrogen (N), and phosphorus (P), thereby serving as an efficient nutrient sink [27,28]. Macroalgae play an important role in nutrient cycling in coastal and estuarine ecosystems [29]. Macroalgae can be used as bioremediation agents for heavy-metal-contaminated effluents [30]. Recent studies have focused on the potential role of kelp forests as carbon sinks in blue carbon assessments [29,31]. In addition, macroalgae act as efficient biofilters for reducing excessive nutrients from fish farm effluents in integrated multi-trophic aquacultural systems [32]. Thus, the macroalgal community plays an important role in maintaining the global ecosystem balance by absorbing nutrients and heavy metals [30,33,34,35].
The purpose of this study was to investigate the dynamics of a coastal macroalgal community exposed to water discharged from aquaculture farms. In addition, we examined the total C, N, and P budgets of the macroalgal community based on biomass and biochemical composition measurements. We hypothesized that changes in the macroalgal community structure due to fish farm effluent exposure would occur in the intertidal zone and that this rocky shore macroalgal community plays important ecological roles in carbon sequestration and as a nutrient sink. The distribution, coverage, biomass, and biochemical composition of macroalgae from the intertidal to subtidal zones were investigated to test these hypotheses, with the aim of providing important scientific information on the ecological roles of macroalgal communities in the coastal area off Jeju Island.
2. Materials and Methods
2.1. Study Area
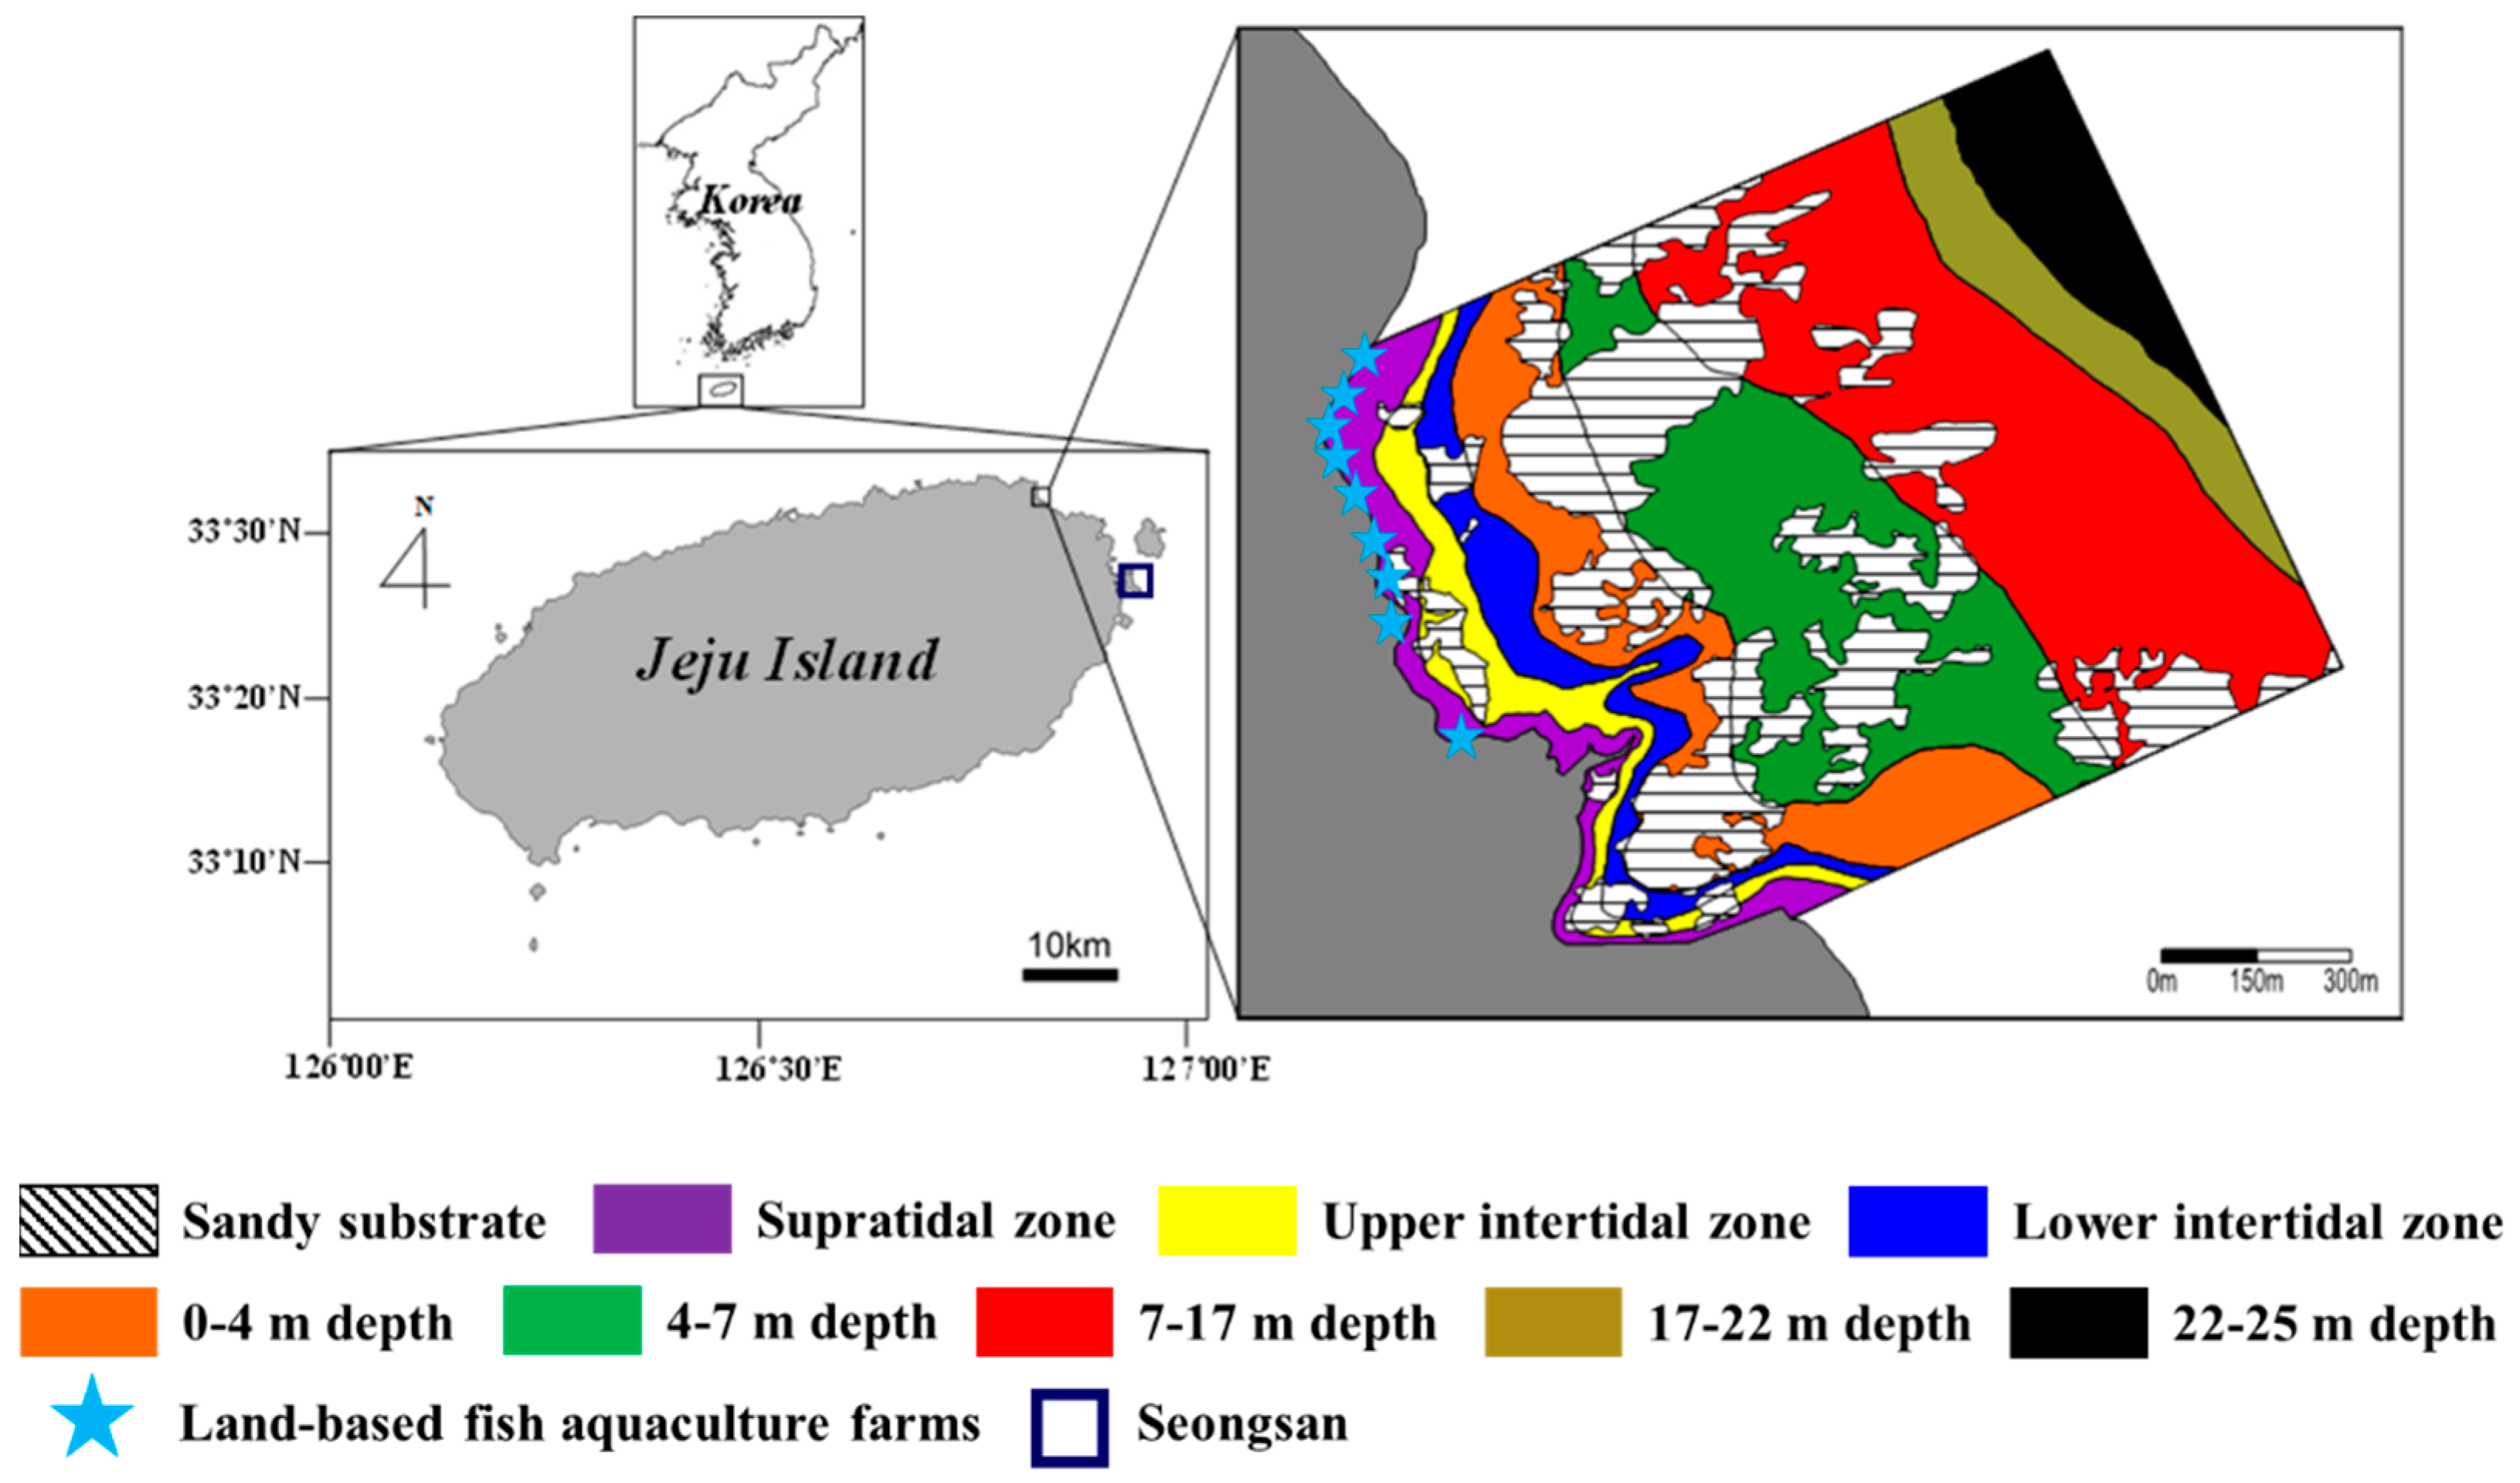
The study site was located off Handong (33°32′42.8″ N, 126°50′03.2″ E) on the northeastern coast of Jeju Island, Korea (Figure 1). This area has a rocky shore that is composed of flat volcanic bedrock and sand. Here, the coast is exposed to high wave action and rapid water flow due to high winds. Land-based fish aquaculture farms operate in the vicinity of the coastal area and discharge large amounts of inorganic nutrients [36]. Additionally, a considerable amount of submarine groundwater discharge with high nutrient concentrations flows into the area [10]. The high inflow of concentrated nutrients has resulted in eutrophication [10,37]. Oh et al. [36] provided detailed information related to the pattern in coastal waters caused by land-based fish farms’ wastewater-borne nutrients.
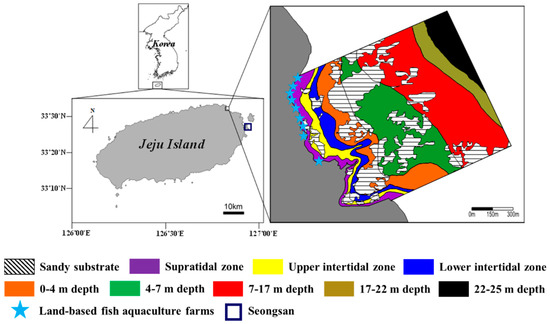
Figure 1.
Study area off Handong on the northeastern coast of Jeju Island, Korea. Each color represents a rocky shore zone in the study area. Total area of Handong is approximately 2,150,000 m2.
The tidal regime in this area is semidiurnal and mesotidal, with a maximum tidal range of approximately 2.2 m during spring tides (Tide Tables for the Coast of Korea, Korea Hydrographic and Oceanographic Administration; http://www.khoa.go.kr, accessed on 21 October 2021). Ulva spp., Corallina pilulifera, Chondracanthus tenellus, and crustose coralline algae are the most common algae in the intertidal zone. Undaria pinnatifida, Dictyota coriacea, Gelidium amansii, and crustose coralline algae dominate at a water depth range of 0–7 m, whereas the predominant species at 7–22 m are the red alga Peyssonnelia caulifera and the large brown alga Ecklonia cava.
2.2. Environmental Factors
Water temperature (°C) at 0–0.5 m below mean sea level was measured in Seongsan on the east coast of Jeju Island, approximately 13 km from the study area; measurements were taken every 10 min from January to December of 2017 using HOBO temperature data loggers (Onset Computer Corp., Bourne, MA, USA). Measured water temperatures were averaged daily. Four replicate surface water samples were collected in the study area in May and October of 2017 to determine the inorganic nutrient concentrations (NH4+, NO3− + NO2−, and PO43−) in the water column. All samples were filtered through GF/F filters (Whatman, pore size: 0.7 μm). The samples were stored in 50 mL conical tube and frozen until analysis. The NO3− + NO2− concentration in each sample was determined after running the sample through a column containing copper-coated cadmium, which reduces NO3− to NO2−. Water column nutrient concentrations were analyzed using standard colorimetric techniques, following the procedures of Parsons et al. [38].
2.3. Experimental Design and Data Collection
Field surveys were conducted along the rocky shore (approximately 1.42 km2 from the supratidal zone to the subtidal zone) in May and October of 2017. This study area was divided into six zones according to physical and biological factors establishing precise limits of distribution—two intertidal zones (upper intertidal zone (UI) and lower intertidal zone (LI)) and four subtidal zones (0–4 m (S1), 4–7 m (S2), 7–17 m (S3), and 17–22 m (S4) below mean sea level)—based on the macroalgal community structure. However, there were no macroalgae in the supratidal zone and in the 22–25-m zone of the subtidal zone. The area of rocky substrate was estimated for each zone based on actual measurement data acquired from scuba diving and satellite imagery via Google Earth. Six quadrats (0.25 m2) were randomly placed on rocky substrate in each zone to determine the coverage and biomass of macroalgae. The percentage cover of each species was measured in the field using a 0.25 m2 stainless-steel frame with 100 subplots. Only macroalgal thalli with holdfasts in the quadrat were included when recording data on cover. The recorded macroalgal percentage cover sometimes exceeded 100% because data on both canopy and understory cover were recorded. The percentage cover of each species was estimated using an efficient and accurate visual estimation method [39]. All quadrats were photographed for reconfirmation, and then all macroalgae, except for crustose coralline algae, inside the quadrat were collected for species identification and biomass measurement. Macroalgae were identified to the lowest possible taxonomic level, except coralline algae. For species identification, the scientific names were checked to see if they were currently accepted on “AlgaeBase” (http://www.algaebase.org, accessed on 21 October 2021). Additionally, species identification was determined using the following literature: Bae et al. [40], Boo et al. [41], Kang [42], Kim [43], Kim and Boo [44], Kim et al. [45], Kim and Hwang [46], Lee [47], Nam [48], Nam and Kang [49,50], and Yoshida [51]. The collected samples were thoroughly cleaned of epiphytes and sediment with tap water and dried at 60 °C to a constant weight. Dried samples were weighed, and the biomass of each species was converted into a dry weight per unit area estimate (g DW m−2).
2.4. Elemental Analysis and Nutrient Incorporation
Macroalgal samples (n = 3 per each species) were collected in May 2017 to determine tissue C, N, and P contents. The whole blade or thallus of samples was dried at 60 °C. The dried samples were then ground using a tissue grinder (TissueLyser II, QIAGEN, Hilden, Germany). Approximately 1.5–2.5 mg of ground tissue was placed in a tin capsule for the determination of tissue C and N contents using a CHN elemental analyzer (Flash EA 1112; Thermo Finnigan, Milan, Italy). Tissue P content was analyzed using the molybdovanadophosphate method after nitric acid/perchloric acid digestion [52]. Approximately 10–15 mg of ground macroalgal tissue was combusted at 550 °C for 5 h. The ash was dissolved with 2N hydrochloric acid, and distilled water was then added. Ammonium–vanadomolybdate reagent was added to the extracts, and colorimetric measurements were taken at 410 nm. Nutrient contents were calculated on a dry weight basis, and elemental ratios were calculated on a mole:mole basis.
The amounts of C, N, and P incorporated into tissues were estimated from the biomass and nutrient contents of each species. Most macroalgae recruit during the fall and winter, achieve their highest biomass during the spring, and then disappear during the summer. Thus, we used the biomass of each species measured between May and October of 2017 to estimate annual production. Nutrient incorporation, defined as the amount of C, N, or P allocated to macroalgal tissues, was calculated using the following equation:
Nutrient (C, N or P) incorporation (g C, N or P dry weight m−2)
= macroalgal biomass (g dry weight m−2) × tissue nutrient (C, N, or P) content/100.
= macroalgal biomass (g dry weight m−2) × tissue nutrient (C, N, or P) content/100.
The total C, N, and P amounts incorporated by the macroalgae in each zone were estimated by multiplying macroalgal C, N, and P incorporation by the macroalgal distributional area (area of rocky substrate × macroalgal percent cover) in each zone.
2.5. Data Analysis
The data are shown as the mean ± standard error. All data were tested for normality and homogeneity of variance to meet the assumptions of parametric statistical analysis. The significance of differences in dissolved inorganic nutrient (NH4+, NO3− + NO2−, PO43−) concentrations in the water column and the coverage and biomass of macroalgae among sampling times and zones was determined using two-way analysis of variance (ANOVA). Differences in tissue nutrient (C, N, and P) contents among macroalgal species were assessed using one-way ANOVA. When significant differences were observed among treatments, a Student–Newman–Keuls (SNK) post hoc test was performed. We used an alpha level of 0.05 for all statistical tests. All statistical analyses were performed using SPSS Statistics 20.0 (IBM Corporation, Armonk, NY, USA).
3. Results
3.1. Environmental Factors
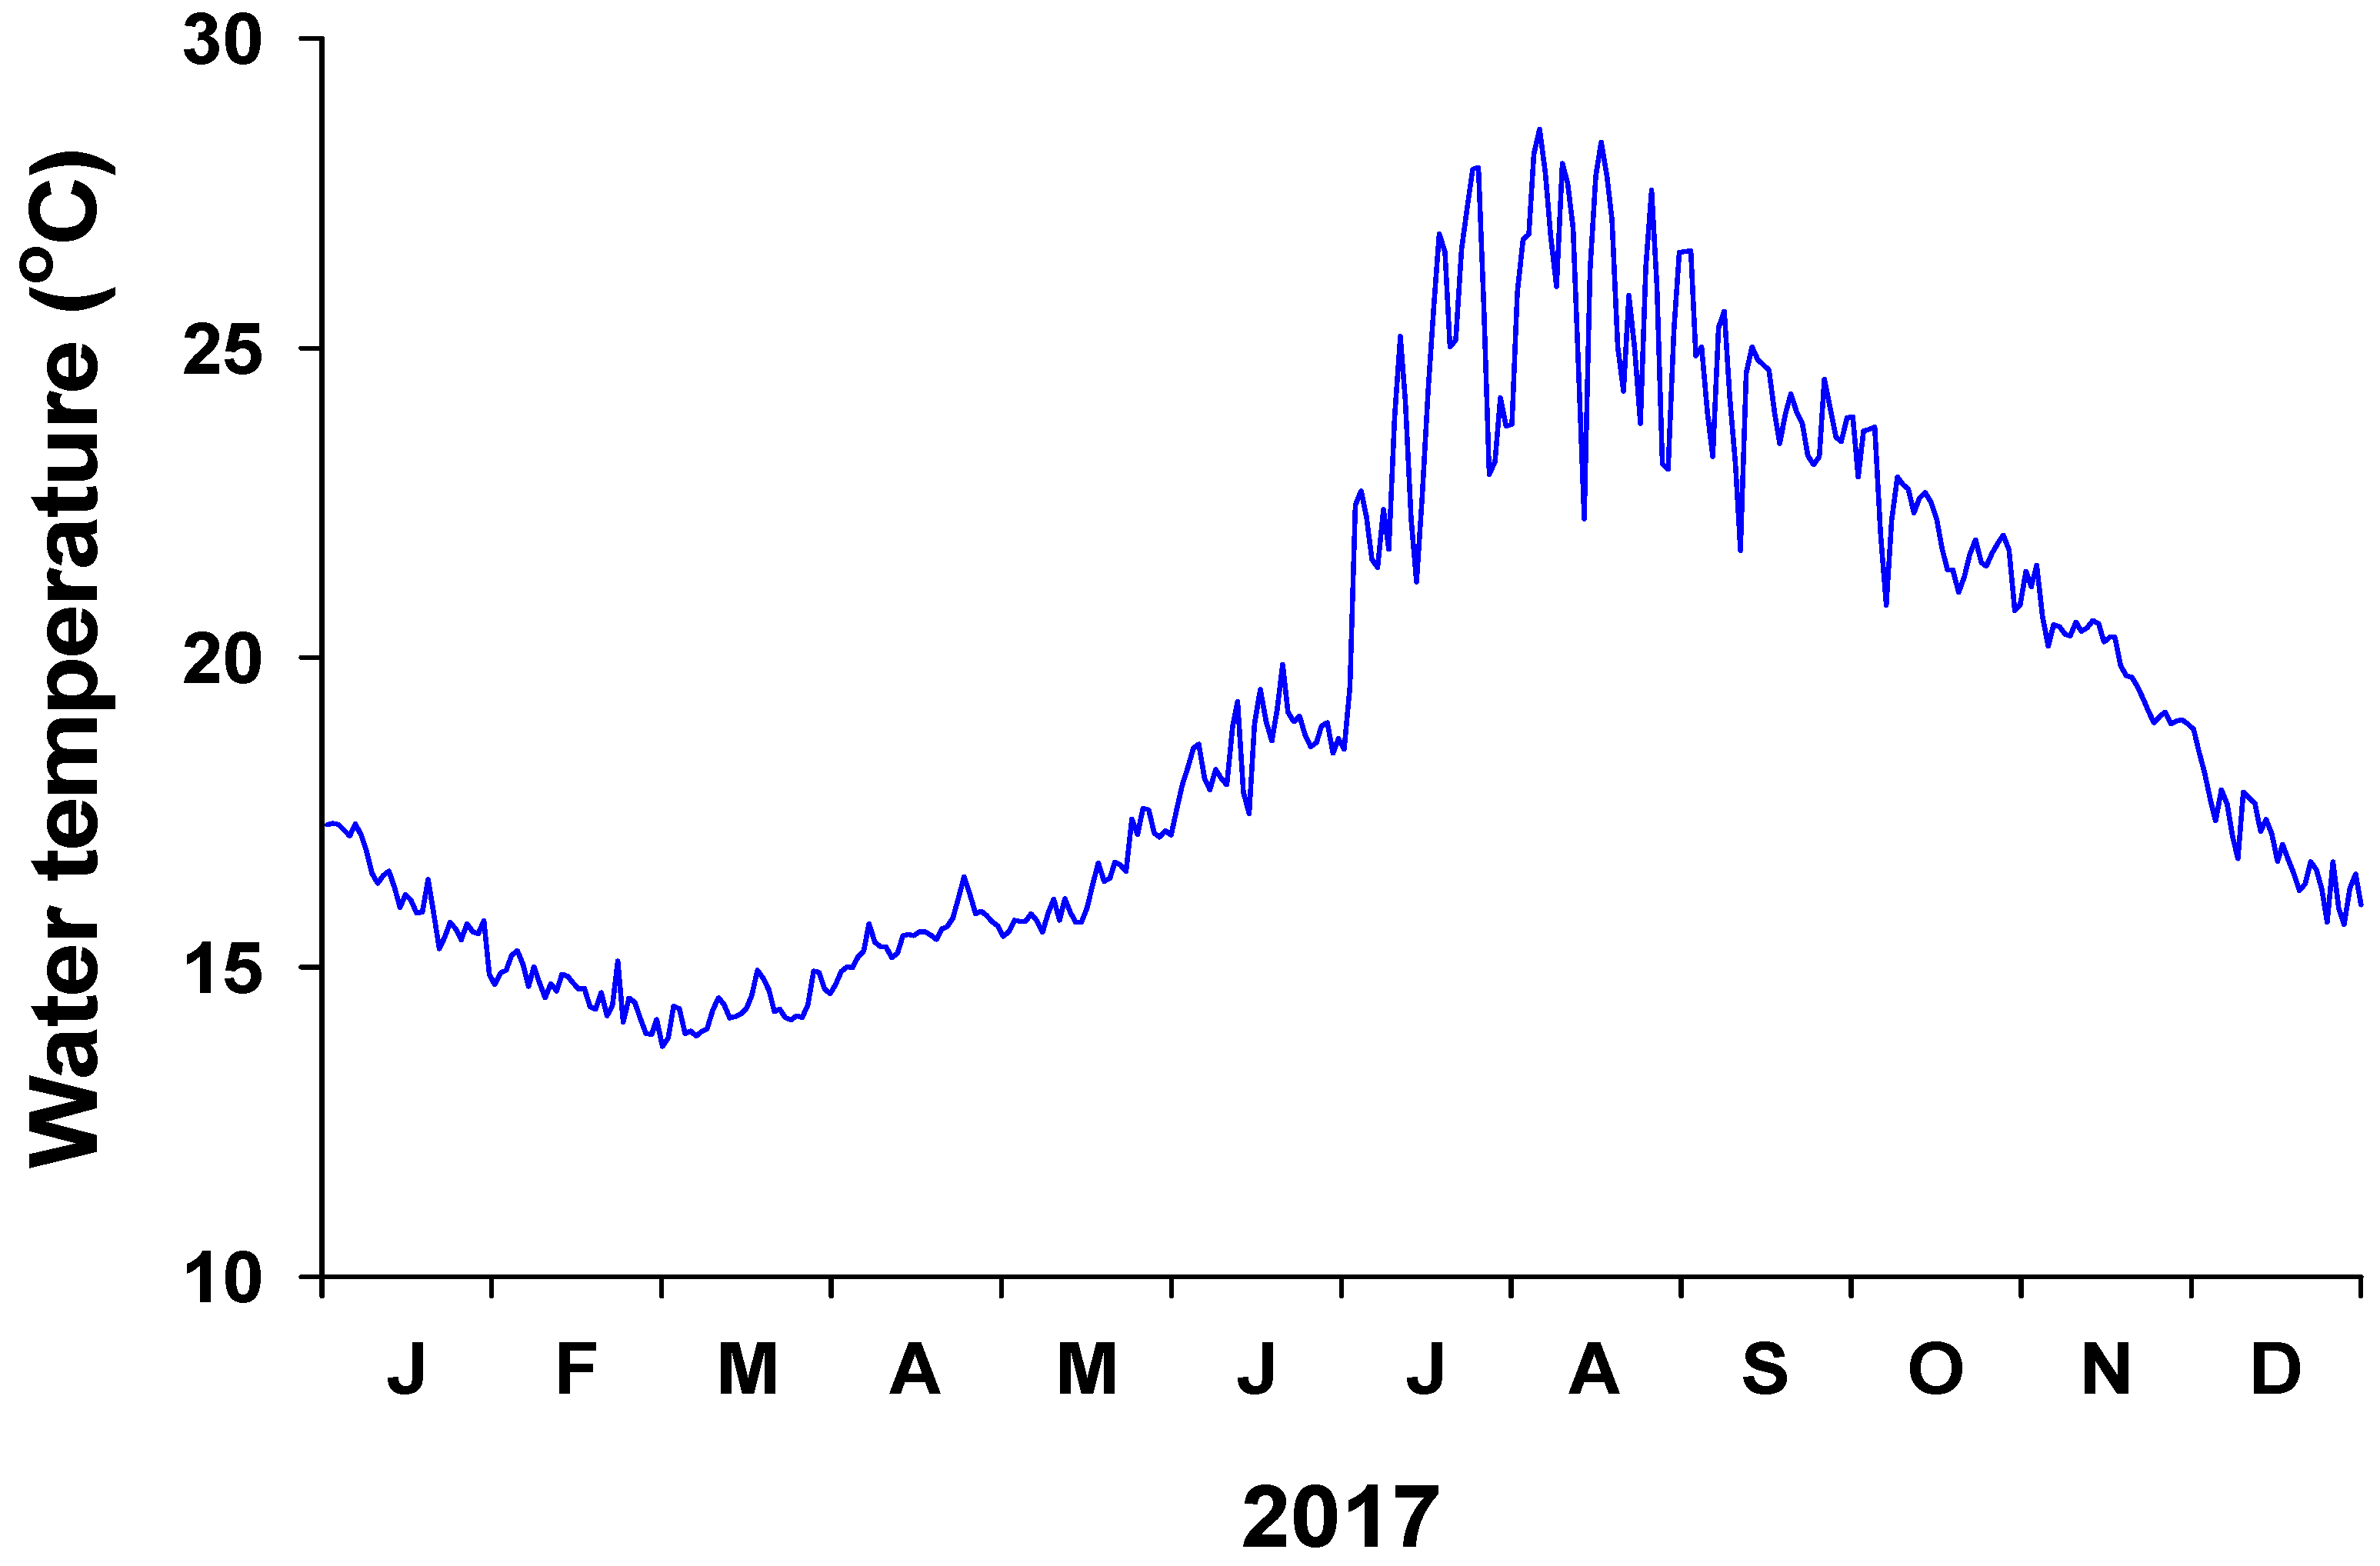
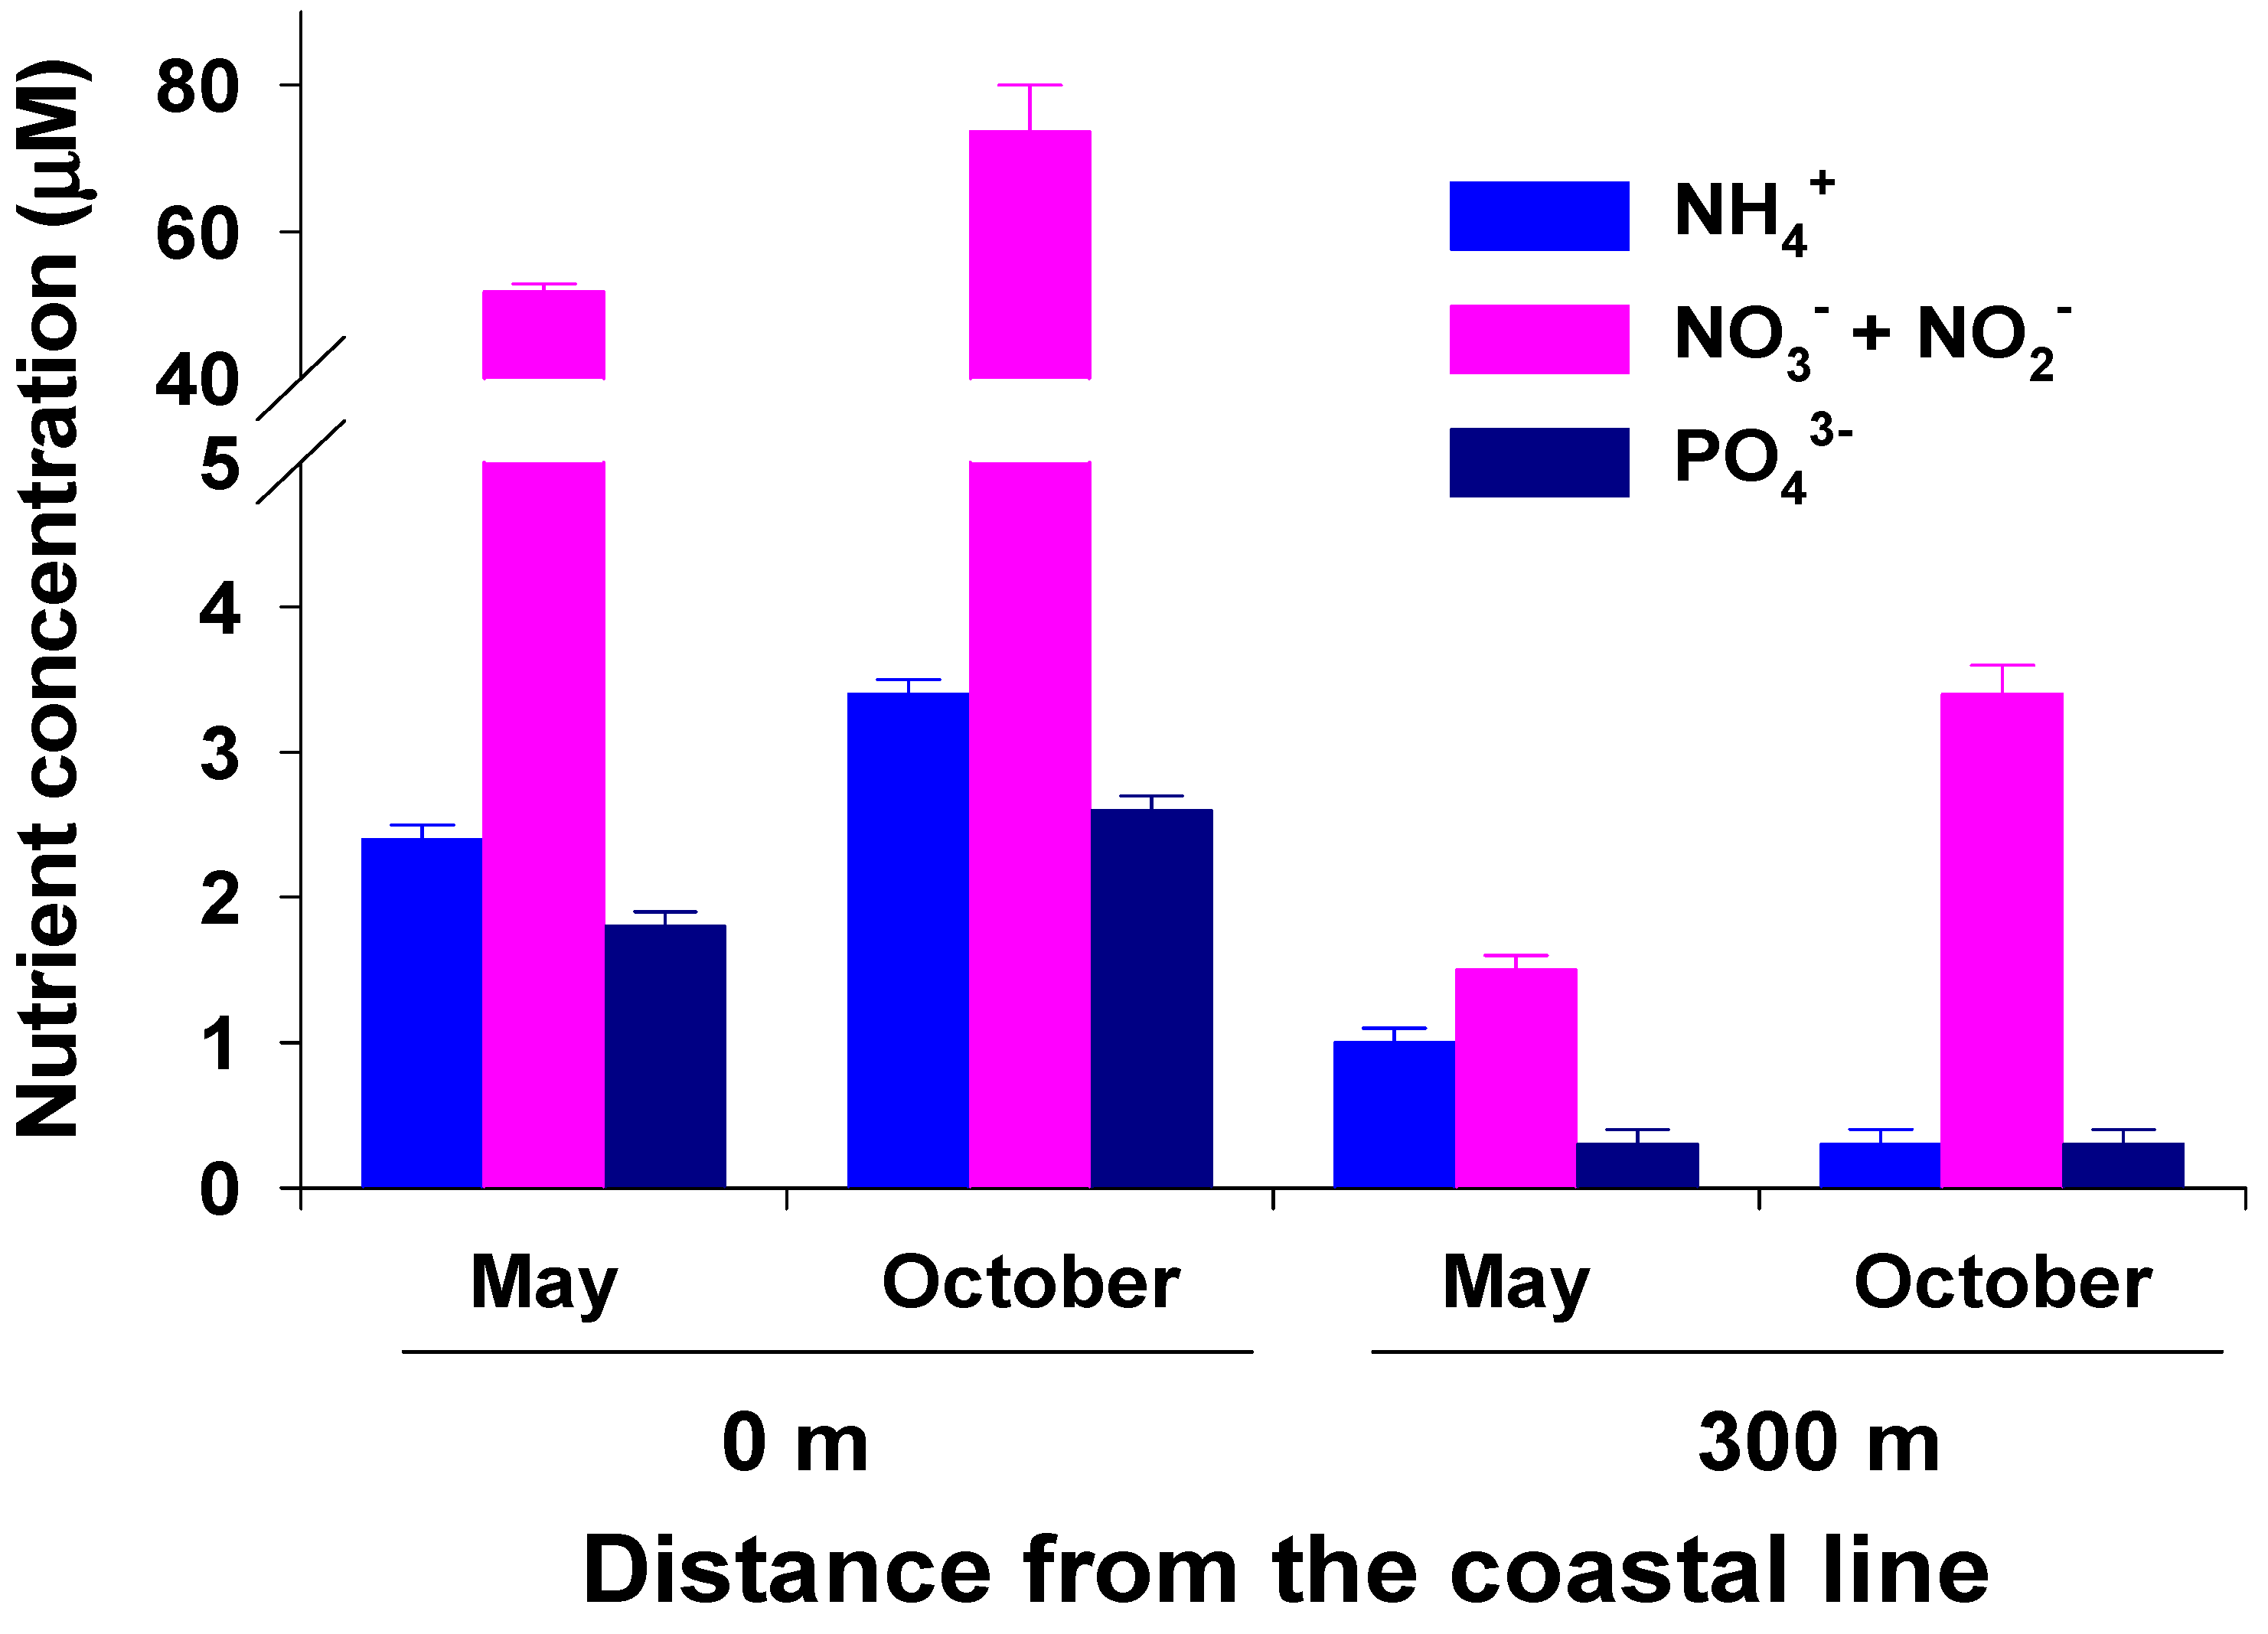
Daily water temperature exhibited a clear seasonal trend, being highest (28.5 °C) in August and lowest (13.7 °C) in March (Figure 2). The mean annual water temperature in 2017 was 19.1 °C. Water-column-dissolved inorganic nutrient (NH4+, NO3− + NO2−, PO43−) concentrations at 0 m from the coastline were significantly (P < 0.001 in all) higher than those at 300 m from the coastline in both May and October (Figure 3). The water column NH4+ concentration at 0 m ranged from 2.4 ± 0.1 to 3.4 ± 0.1 µM, whereas the average NH4+ concentration at 300 m was less than 1 µM. In particular, the water column NO3− + NO2− concentration was highest at 0 m (51.8 and 73.7 µM in May and October, respectively). At 300 m, the NO3− + NO2− concentration in the water column was 1.5 µM in May and 3.4 µM in October. The average water column PO43− concentrations at 0 and 300 m were 2.2 and 0.3 µM, respectively.
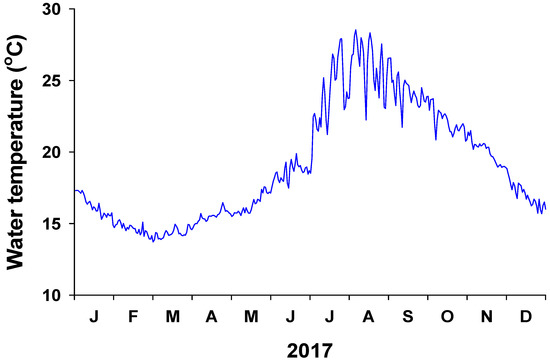
Figure 2.
Water temperature in the study area off Jeju Island from January to December 2017.
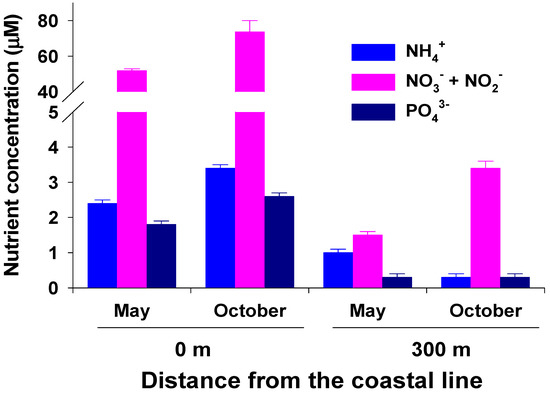
Figure 3.
Surface water NH4+, NO3− + NO2−, and PO43− concentrations in the study area off Jeju Island, Korea. Water-column nutrient concentrations are represented as the mean ± standard error (n = 4).
3.2. Distributional Area, Cover, and Biomass of Macroalgae
The total area of the study site was about 1,420,862 m2 (Figure 1; Table 1). Of this, the total areas of rocky and sand substrates were 1,058,600 (74.5%) and 362,262 m2 (25.5%), respectively. The rocky area in the intertidal zone was 123,312 m2 (8.7%), consisting of the UI zone (55,701 m2) and the LI zone (67,611 m2). The rocky area in the subtidal zone was 864,824 m2 (60.9%); notably, macroalgae were not found in the 22–25-m zone (84,483 m2, 5.9%). The S3 and S2 areas in the subtidal zone accounted for 24.6% and 15.3% of the total area, respectively.

Table 1.
Areas and distance from the coastline of rocky and sandy substrates and tidal zones and their percentages relative to the total study area.
Thirty-eight macroalgal species (2 Chlorophyta, 6 Phaeophyceae, and 30 Rhodophyta) were identified in the study area during the experimental period (Table 2 and Table 3). The total species numbers in the intertidal zone and subtidal zone were 19 and 23, respectively, with the highest numbers recorded in May and the lowest in October. The total species number was higher in the LI zone than in the UI zone throughout the experimental period (Table 2). Total algal cover in the two intertidal zones was highest (average 94.2%) in May and lowest (average 61.2%) in October. Ulva spp. were the dominant species in the intertidal zone in May (Table 2). The cover (and relative cover) of Ulva spp. in the UI and LI zones was 61.8% (70.3%) and 46.3% (46.9%), respectively. By contrast, the algal community in the two intertidal zones was dominated by crustose coralline algae in October, with the relative percentage cover of crustose coralline algae exceeding 50%. In the subtidal zone, the total species number was lowest in the S3 zone (Table 3). The total percentage cover in zones S1, S2, and S3 exceeded 100% due to the presence of a macroalgal canopy in those areas, whereas the macroalgal cover in zone S4 was less than 70% during May. The total algal percentage cover ranged from 50.5 ± 1.0% in zone S4 to 108.3 ± 5.8% in zone S3 in October. The dominant species were crustose coralline algae and Gelidium amansii in zone S1 and Ecklonia cava and erect coralline algae in zone S2. In particular, E. cava was the dominant species in terms of percentage cover (82.3 ± 3.9% in May and 56.6 ± 3.3% in October) in zone S3, with a relative percentage cover of more than 50%. Additionally, the percentage cover of Peyssonnelia caulifera and Grateloupia angusta, crustose and erect coralline algae, exceeded 10%. In zone S4, the percentage cover (and relative cover) of P. caulifera was 46.3 ± 4.5% (66.9 ± 3.8%) in May and 36.5 ± 1.0% (72.3 ± 2.1%) in October.

Table 2.
Macroalgal species number, percentage cover, relative percentage cover, and biomass in the intertidal zone in May and October of 2017. Values are presented as the mean ± standard error (n = 6).

Table 3.
Macroalgal species number, percentage cover, relative percentage cover, and biomass in the subtidal zone in May and October of 2017. Values are presented as the mean ± standard error (n = 6).
The macroalgal biomass was higher in May than in October (Table 2 and Table 3). The total biomass of macroalgae in zone S2 was significantly higher (P < 0.001) than those in the other zones. Additionally, the biomass of macroalgae in the subtidal zone was higher than that in the intertidal zone. In May, Ulva spp. and Corallina pilulifera had the highest biomasses (202.7 ± 26.5 and 158.8 ± 80.0 g DW m−2, respectively) in the UI zone, and the biomasses of three species (Ulva spp., Chondracanthus tenellus, and G. amansii) were more than 100 g DW m−2 in the LI zone (Table 2). In the subtidal zone, only one species (G. amansii) in zone S1 was observed to have a biomass greater than 100 g DW m−2 (Table 3). Ecklonia cava had the highest biomass in both S2 and S3. In zone S2, the biomass of erect coralline algae in May and October was 359.8 ± 62.0 and 150.6 ± 29.8 g DW m−2, respectively. Peyssonnelia caulifera had high biomass in zones S3 and S4, ranging from 110.0 ± 18.2 to 37.3 ± 15.4 g DW m−2.
3.3. Elemental Analysis and Nutrient Incorporation
The C, N, and P contents in macroalgal tissues varied according to the species (Table 4). Dictyota coriacea and G. amansii had the highest tissue C contents. The tissue C content across macroalgal species ranged from 15.7 ± 0.2% to 38.57 ± 0.15%. The tissue N content was highest (average 4.25%) in Ulva spp., Polyopes prolifer, and Grateloupia elata and lowest (0.20%) in erect coralline algae. The macroalgal tissue P content ranged from 0.061 ± 0.003% in erect coralline algae to 0.368 ± 0.013% in P. prolifer, with an average of 0.167%. The atomic C:N ratio of macroalgal tissues was highest in erect coralline algae and lowest in Ulva spp., P. prolifer, and G. elata (Table 4). The N:P ratio of macroalgal tissues ranged from 7.78 ± 1.83 in erect coralline algae to 56.32 ± 2.07 in Grateloupia textorii.

Table 4.
The tissue carbon (C), nitrogen (N), and phosphorus (P) content (%), C:N ratio, and N:P ratio of macroalgae in the study area off Jeju Island, Korea. Values are presented as the mean ± standard error (n = 3 per each species). UI: upper intertidal zone, LI: lower intertidal zone, S1: 0–4 m depth zone, S2: 4–7 m depth zone, S3: 7–17 m depth zone, S4: 17–22 m depth zone.
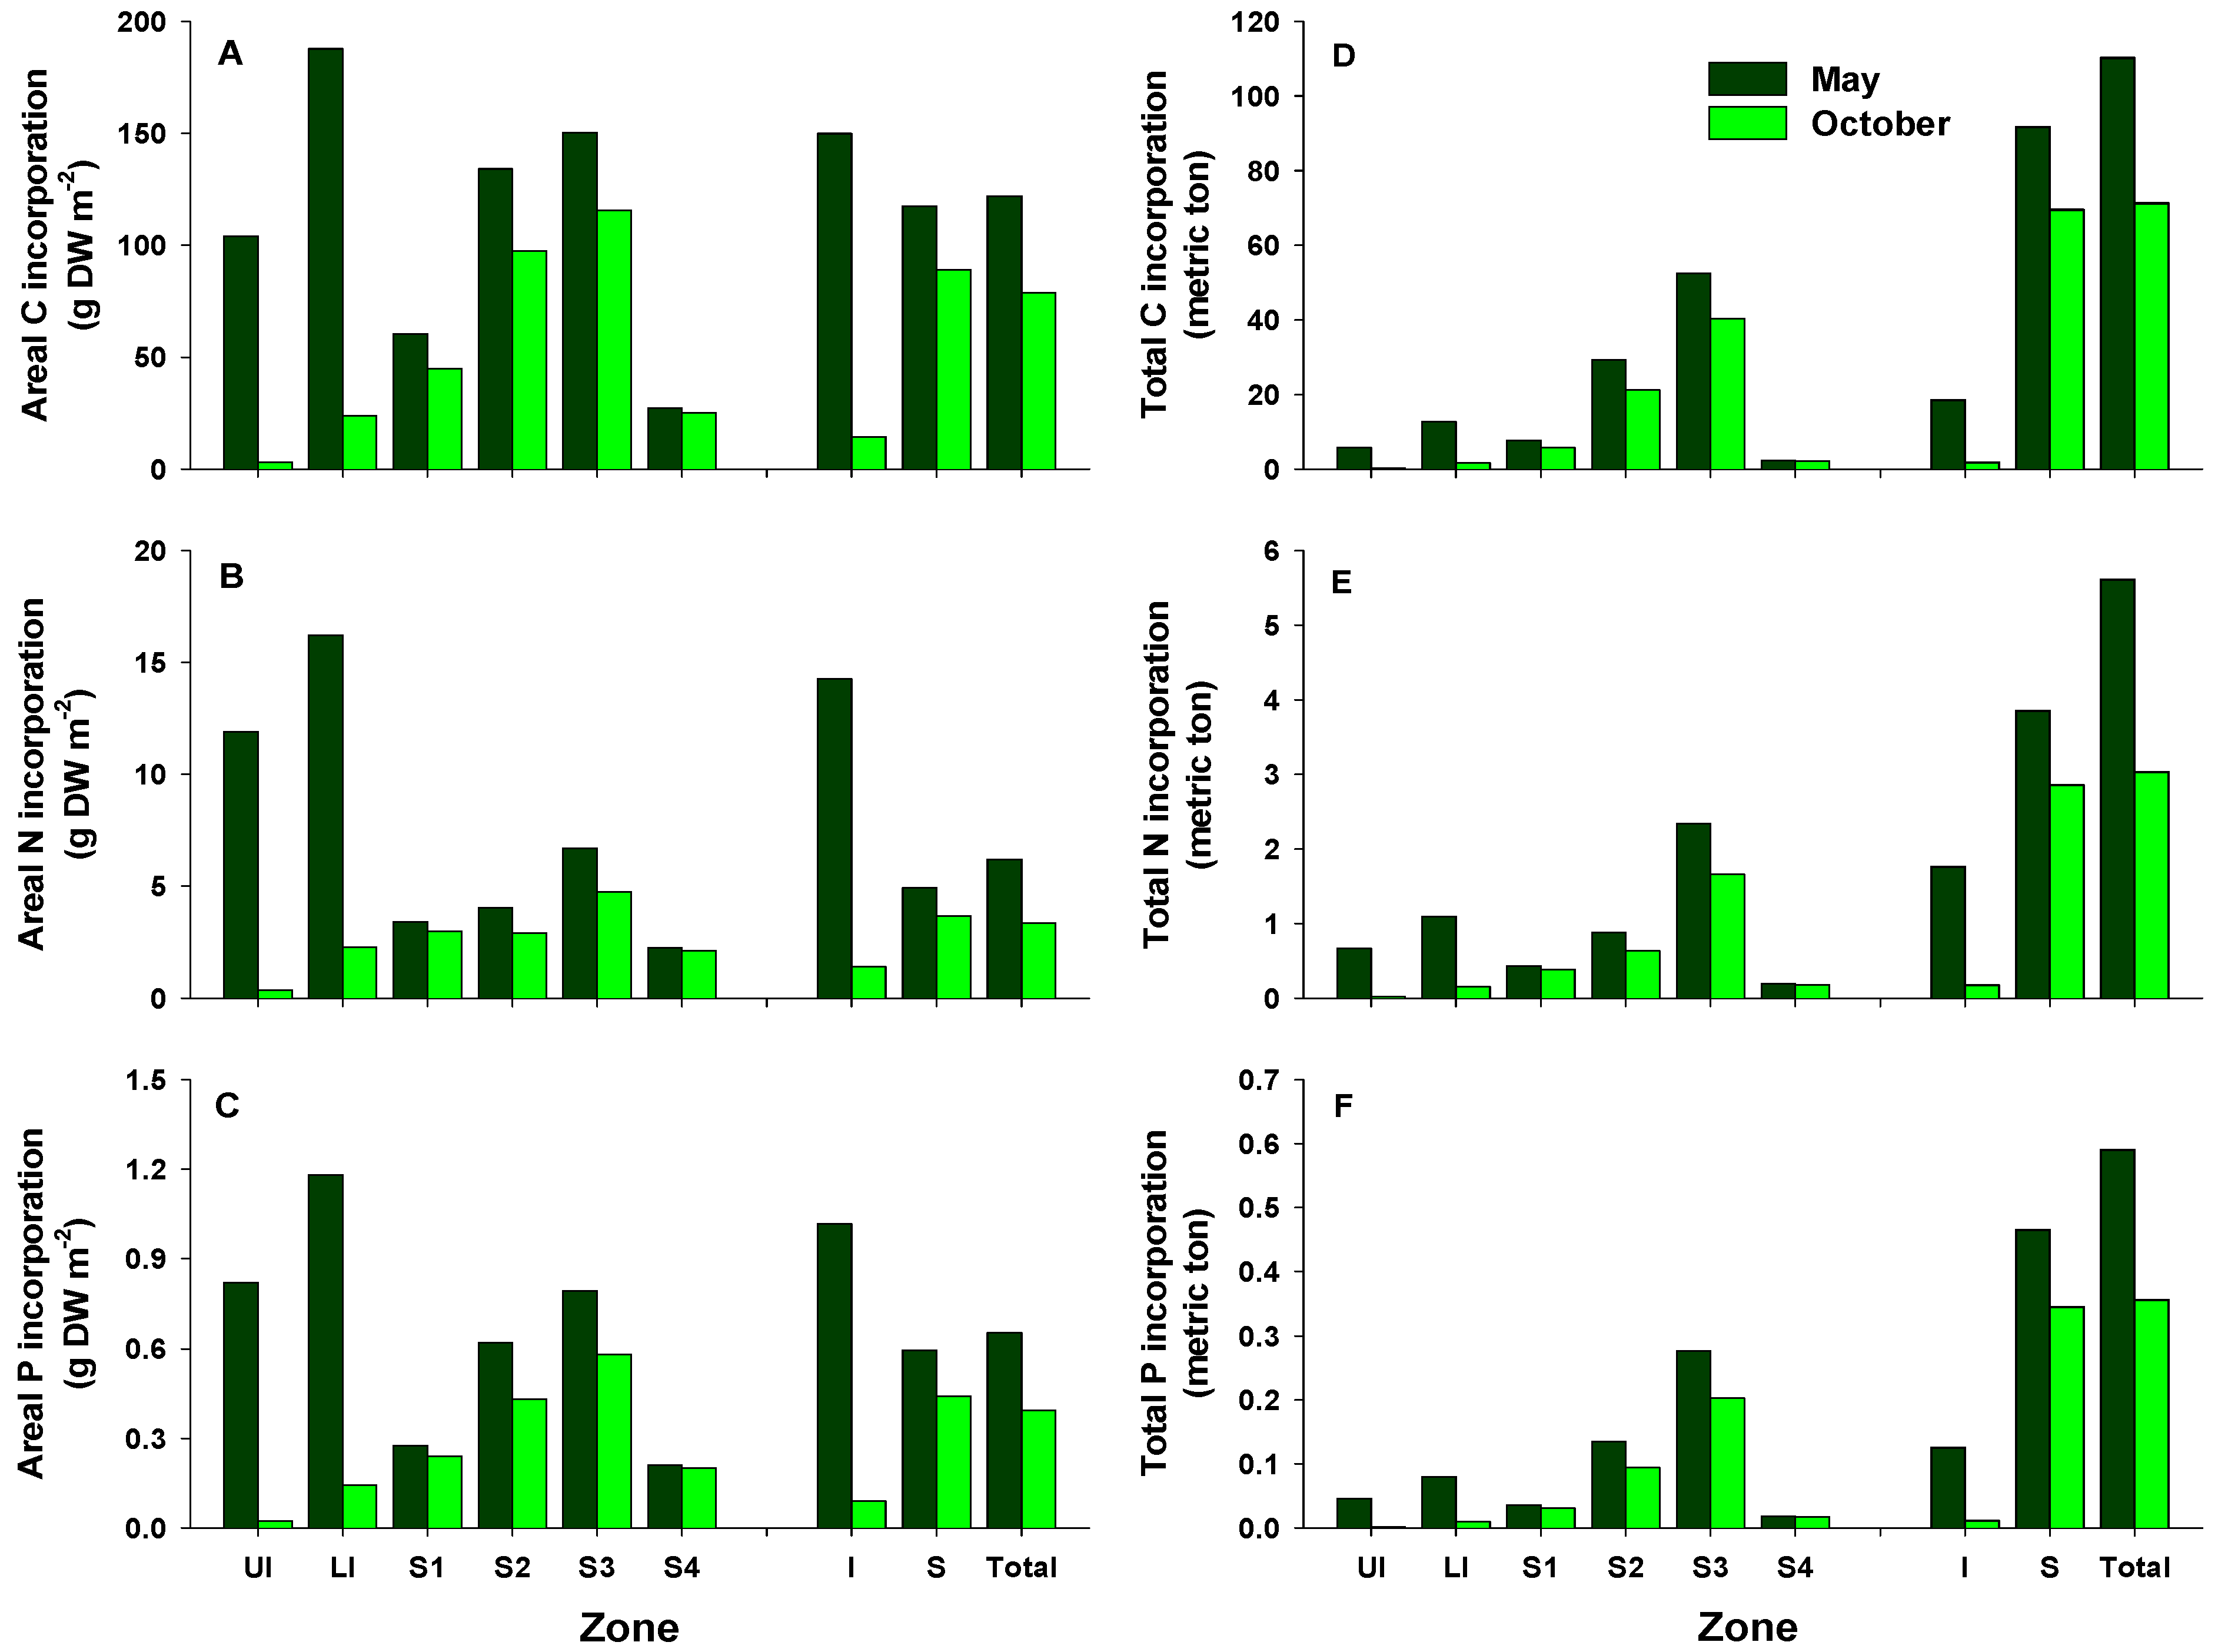
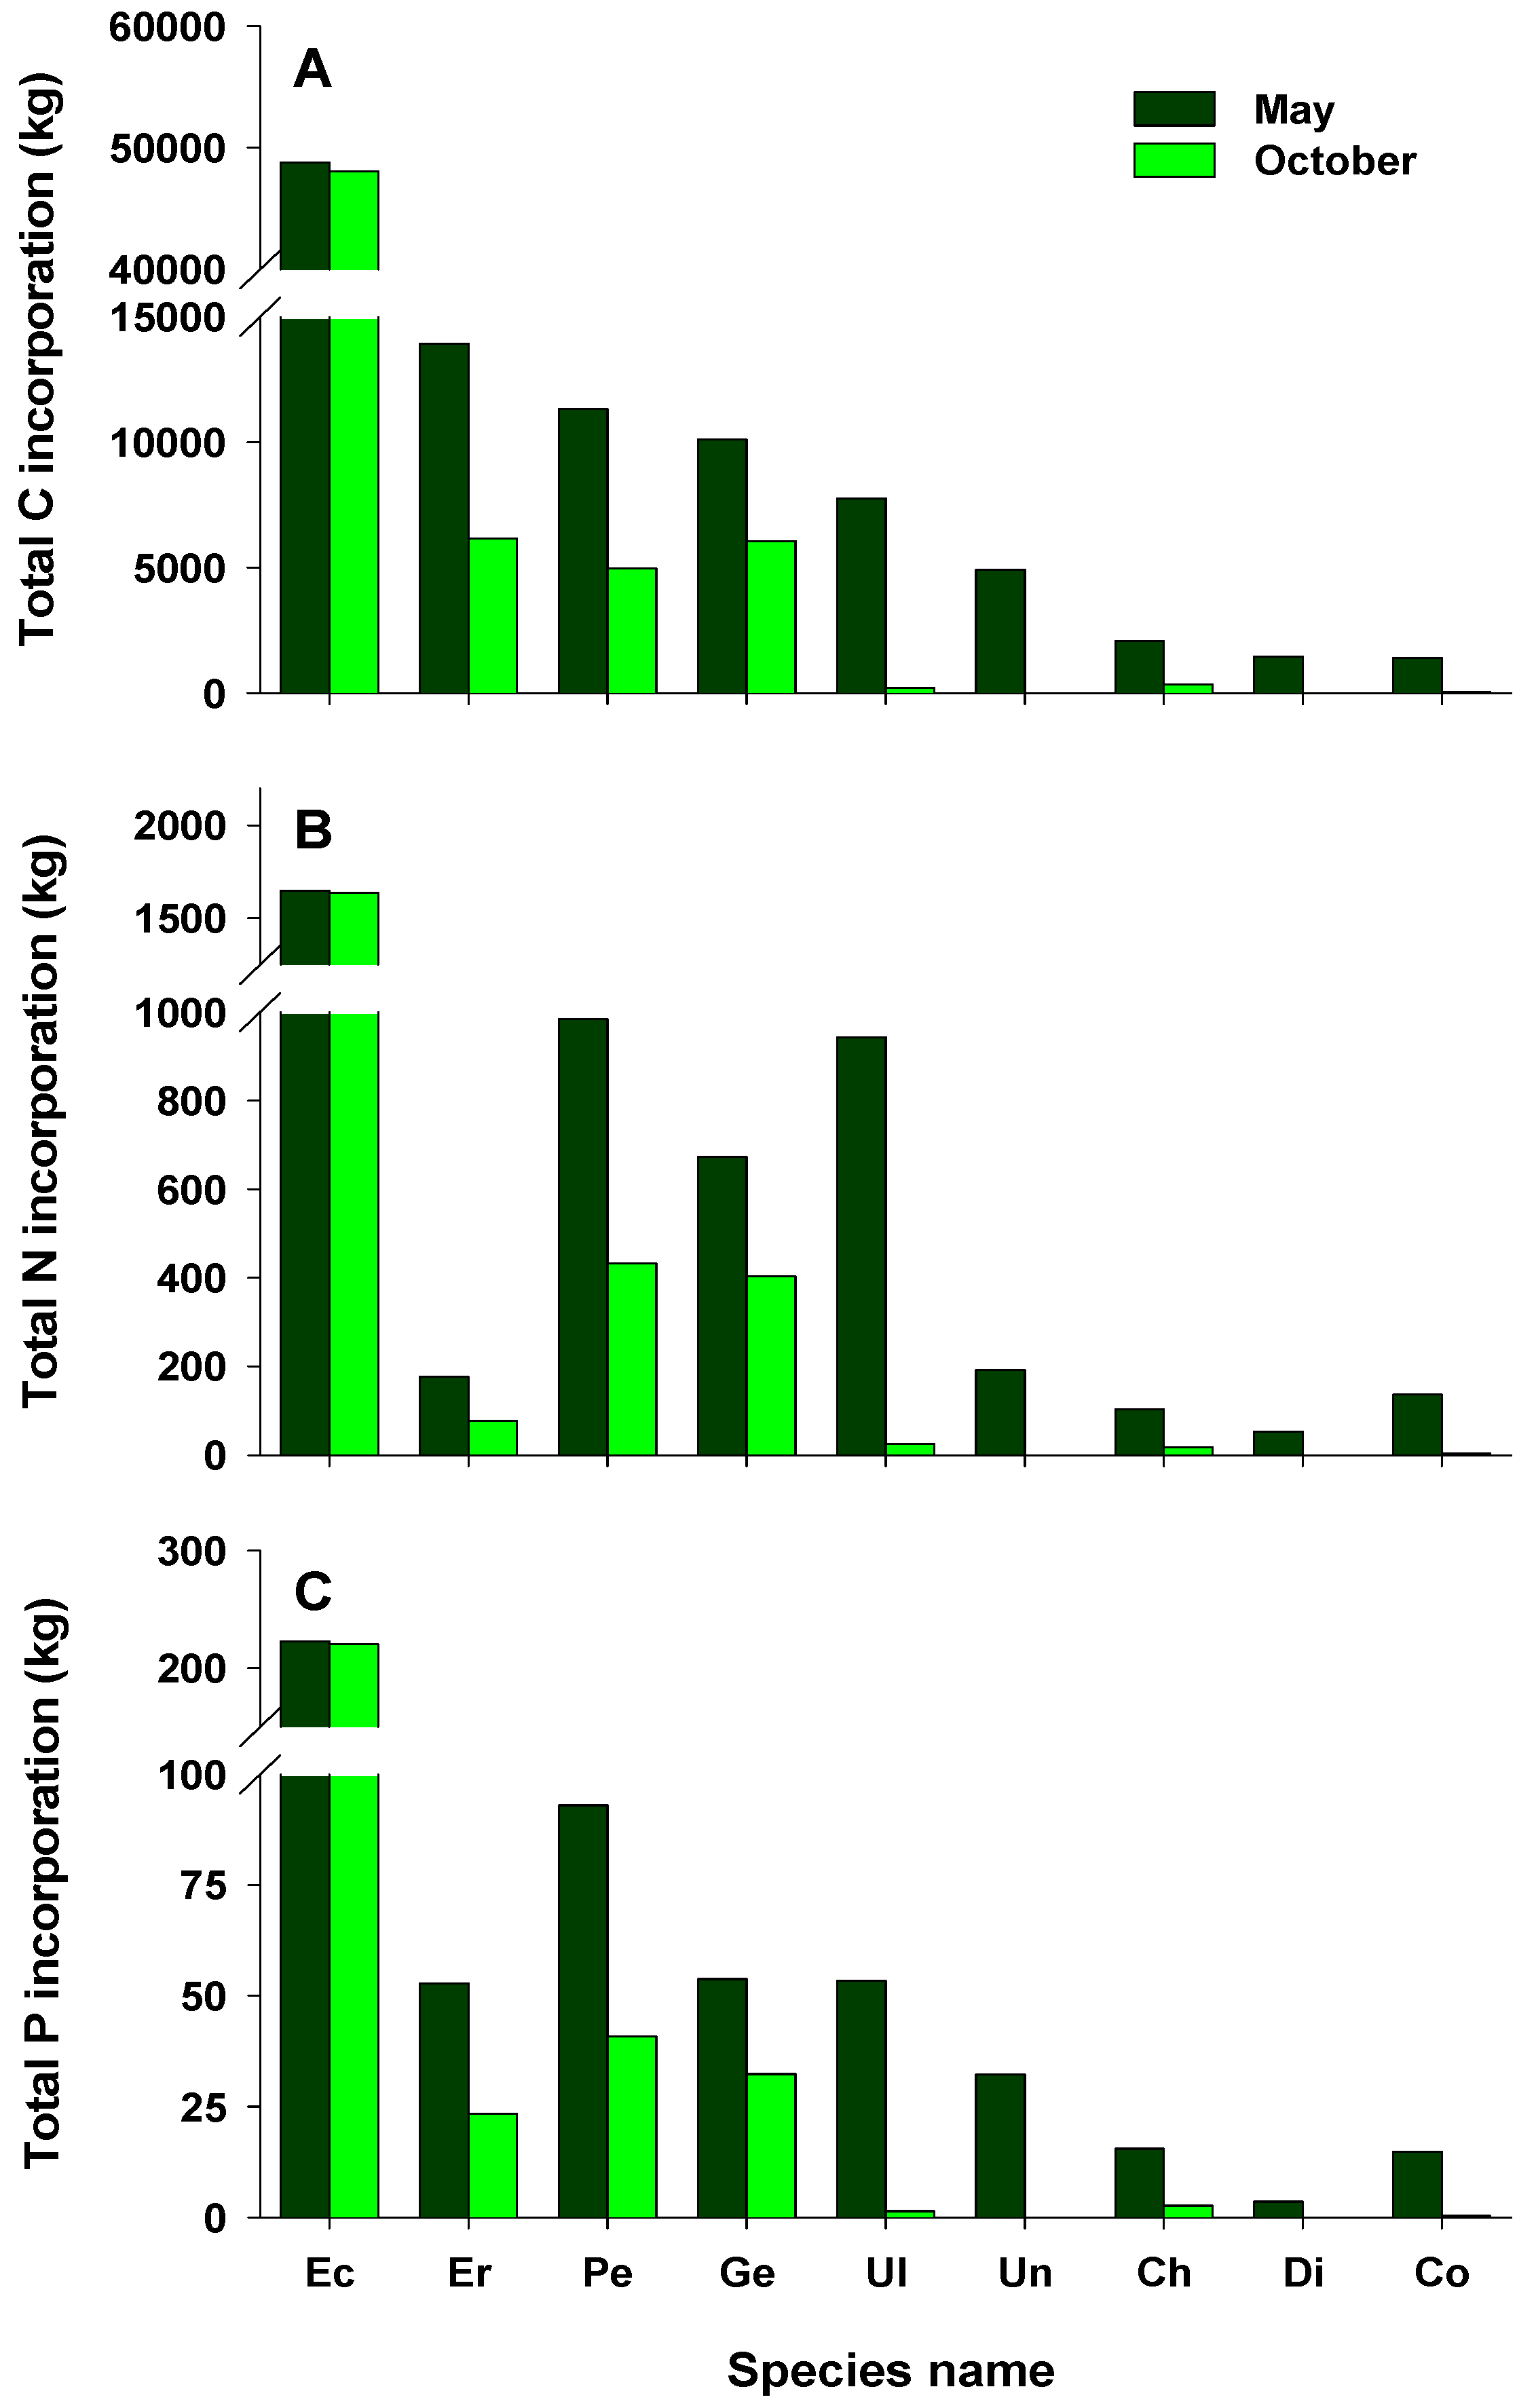
Areal C, N, and P incorporation into macroalgal tissues varied with the season, with the largest amounts incorporated in May and the lowest in October (Figure 4A–C). In May, areal C, N, and P incorporation was higher in the LI zone than in any other zones, whereas the highest areal C, N, and P incorporation in October was recorded for zone S3. Areal C, N, and P incorporation was higher in the intertidal zone than in the subtidal zone in May, whereas very large amounts were incorporated in the subtidal zone compared with the intertidal zone in October. The amounts of C, N, and P incorporated per unit area at the study site were 122.0, 6.2, and 0.7 g m−2 in May (79.0, 3.4, and 0.4 g m−2 in October), respectively. The total amounts of C, N, and P incorporated were higher in May than in October, with the highest values recorded for zone S3 (Figure 4D–F). In addition, the total amounts of C, N, and P incorporated in the subtidal zone were 5.0–39.0-, 2.2–16.4-, and 3.7–31.4-fold those in the intertidal zone, respectively. Total C incorporation into macroalgal tissues was estimated to be approximately 181.5 tons C year−1. The calculated N and P amounts incorporated annually into macroalgal tissues were about 8.6 and 1.0 tons, respectively. In this study, the total amounts of C, N, and P incorporated by perennial algae were higher than those by annual algae (Figure 5). Ecklonia cava, a perennial brown alga, incorporated the largest amounts of C, N, and P annually (96.9, 3.3, and 0.4 tons, respectively). Annual C incorporation by erect coralline algae, P. caulifera and G. amansii, was more than 10 tons. Only two annual species, Ulva spp. and Undaria pinnatifida, incorporated large total amounts of C, N, and P. In particular, Ulva spp. incorporated 0.9 tons of N in May, whereas the total P amounts incorporated by P. caulifera in May and October were 93.1 and 40.9 kg, respectively (Figure 5B,C).
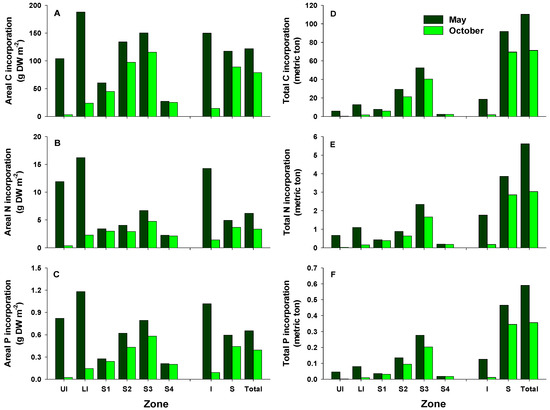
Figure 4.
Areal and total estimates of carbon (A,D), nitrogen (B,E), and phosphorus (C,F) incorporation by the macroalgal community off Handong, Jeju Island, Korea, in May and October. UI, upper intertidal zone; LI, lower intertidal zone; S1, 0–4 m below the mean sea level; S2, 4–7 m zone; S3, 7–17 m zone; S4, 17–22 m zone; I, intertidal zone; S, subtidal zone.
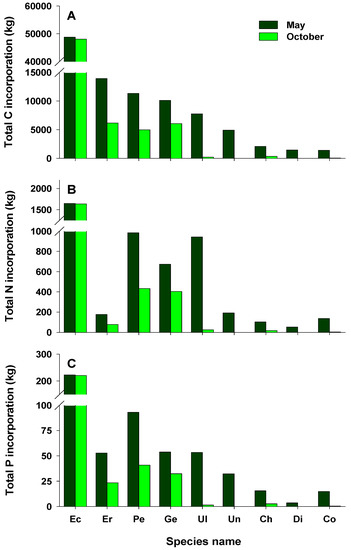
Figure 5.
Total estimates of carbon (A), nitrogen (B), and phosphorus (C) incorporated by the main macroalgae off Handong, Jeju Island, Korea in May and October; Ec, Ecklonia cava; Er, erect coralline algae; Pe, Peyssonnelia caulifera; Ge, Gelidium amansii; Ul, Ulva spp.; Un, Undaria pinnatifida; Ch, Chondracanthus tenellus; Di, Dictyota coriacea; Co, Corallina pilulifera.
4. Discussion
4.1. Macroalgal Community Dynamics
In the present study, changes in macroalgal community structure across the rocky shore may be affected by variations in water-column concentrations between the intertidal and subtidal zones. The macroalgal community in the intertidal zone clearly responded, in terms of changes in structure, to effluent from fish farms with high nutrient concentrations, especially in May. Higher N concentrations in the water allowed for an increase in the tissue N content of Ulva spp. (4.27 ± 0.10). This result is similar to that of Kim et al. [6], who reported the tissue N content of U. australis (4.34 ± 0.30) at the study site, which was close to a sewage treatment plant. Thus, this facilitated the growth and development of Ulva spp. Overall, Ulva spp. dominated in the intertidal zone where higher N concentrations in the water were observed. Additionally, only four species had a cover of more than 1% in the intertidal zone. Ulva spp. are characterized by high growth at high nutrient concentrations and a rapid uptake rate of nutrients, resulting in algal blooms [32,53]. Several studies have reported a decline in species diversity and an increase in opportunistic species, such as Ulva spp., upon exposure to sewage discharge [54,55,56]. Blooms of Ulva spp. resulted in a decline in species richness and diversity in a macroalgal community near a sewage outfall [57].
Erect and crustose coralline algae commonly observed in both intertidal and subtidal areas play an important role in ecological marine systems and are often found with over 50% coverage on rocky reefs in temperate climates [58,59]. Essentially, erect and crustose coralline algae showed high coverage along the coast of Jeju Island [60,61,62]. In this study, erect and crustose coralline algae exhibited high coverage from the intertidal to subtidal zones. In particular, the biomasses of erect coralline algae in the UI and S2 zones accounted for approximately 50% of the total biomass in May. Currently, their biomass and coverage are expanding from the intertidal to subtidal zones due to climate change and herbivory [63]. This may be due to the responses of coralline algae to rising seawater temperatures. The sea surface temperature in the coastal waters of Jeju Island has increased by 1.94 °C for the last 86 years (1924–2009) [64]. Although global ocean acidification results in low pH levels, which have negative impacts on the growth of coralline algae [65], elevated water temperature offsets the negative effects of ocean acidification [66]. This suggests that the decline of erect and crustose coralline algae may not be observed on the coast of Jeju Island.
In 2003, brown algae such as Sargassum thumbergii and S. fusiforme (reported as Hizikia fusiformis) were dominant in the intertidal zone along the northeastern coast of Jeju Island [62]. However, the brown alga, S. fulvellum, was recorded at less than 1% in this study. Large brown algae have been observed to decline in a macroalgal benthic community exposed to high N conditions [55,67]. Exposure to sewage effluent resulted in a decline in zygote germination, a delay in embryo growth, and increases in embryo mortality and the photosynthetic efficiency of brown algae [68,69]. Additionally, large brown or perennial algae were replaced by opportunistic or turf-forming species due to differences in their nutrient uptake rates [67,70]. Thus, these results indicate that large brown algae in the intertidal zone may be seriously affected by fish farm effluent with high nutrient concentrations.
In this study, the macroalgal community in the subtidal zone exhibited a distinct zonation pattern. Specifically, E. cava was the dominant species in terms of coverage and biomass (approximately >50%) in zones S2 and S3 in May and October. Kelp forests are called “ecosystem engineers” as they provide complex habitats for many organisms and affect the abiotic and biotic environments around them [12,71]. Ecklonia cava is a representative perennial alga that forms kelp forests in the subtidal zone off rocky coasts of Korea and Japan [72,73]. Overall, the number, cover, and biomass of macroalgal species in zones S2 and S3 were higher than those in intertidal areas, similar to the results of previous studies of other Jeju Island sites [60,62]. This indicates that the macroalgal community structure in the subtidal zone was not strongly affected by the effluent. Thus, our results strongly support our first hypothesis—that the response of the macroalgal community, in terms of changes in structure, to fish farm effluent would primarily occur in the intertidal zone.
4.2. Ecological Role as a Nutrient Sink
Discussion of the ability of vegetated coastal ecosystems to store and sequester large amounts of organic carbon (called “blue carbon”) is largely restricted to tidal marshes, mangrove forests, and seagrass beds [74]. Seaweed habitats including kelp forests have not been included in the blue carbon strategies [75]. Nevertheless, they certainly serve as a significant carbon sink [33]. Estimates of global carbon sequestration by all macroalgae are very high, ranging from 61 to 268 Tg C year−1 [76,77]; thus, seaweed habitats, typically kelp forests, may hold considerable carbon stocks in coastal areas, and their role as carbon sinks has become a major focus of international attention [31]. In this study, total C incorporation by seaweed was 110.2 tons in May and 71.3 tons in October. Among macroalgal species, E. cava, a large brown alga, incorporated the most C in both May and October. This result is attributable to the morphological characteristics and life cycle of E. cava. In temperate regions, most algae generally decline, or disappear completely, during the summer when the water temperature increases and then reappear during September and October; their biomass and productivity are especially high during the spring season [34,78,79]. By contrast, E. cava is a large perennial species and thereby maintains high biomass in the subtidal zone in autumn. Thus, E. cava beds play a vital role as standing stocks of organic carbon and are key components of organic carbon cycling off the coast of Jeju Island, considering that E. cava is the dominant species forming kelp forests and the major habitat-forming organism in subtidal areas.
Coralline algae act as a carbon dioxide sink via photosynthesis and CaCO3 dissolution; the potential estimate of global carbon sequestration by erect and crustose coralline alga is 1.6 × 10⁹ tons C year−1 [80]. In this study, erect coralline algae incorporated the second-highest amount of C annually due to high biomass in the UI and S2 zones and morphological characteristics. In addition, crustose coralline algae may incorporate a considerable amount of carbon into their skeleton. A few studies presented that the increase in atmospheric CO2 results in a reduction in seawater pH, which inhibits the growth of erect and crustose coralline algae [65,66]. However, elevated water temperature under low seawater pH enhances the growth of coralline algae [66]. These coralline algae prefer ammonium rather than nitrate as nitrogen sources [81]. The growth rate and calcification of encrusting coralline algae are considerably enhanced when they are exposed to high ammonium concentrations under ambient and high-pCO2 environments [82]. The effluent from land-based fish farms has relatively high concentrations of total ammonia nitrogen (ammonia + ammonium) as well as total oxidized nitrogen (nitrite + nitrate) [32]. Thus, the growth of coralline algae is maintained by high ammonia concentrations and the increase in water temperature. This indicates that coralline algae may play an important role as a carbon sink.
Similar to its incorporation of total C, E. cava also incorporated the most total N and P, with average values of 1,642.6 and 221.5 kg, respectively. Erect coralline algae showed low total N incorporation due to low tissue N content. Remarkably, Ulva spp. incorporated more total N (942.8 kg) in May, although the area covered by this species was low in the entire study area. Ulva species are green-tide-forming macroalgae that exhibit a high affinity for nutrients [83,84]. They are widely used as nutrient (especially N) biofilters for effluents from land-based integrated aquaculture systems due to their high N uptake rate, growth, and tissue N content [11,32,85]. Green tides caused by Ulva blooms have been observed off the southern coast of Korea during the winter–spring season [86,87]. In this study, Ulva spp., which had a high cover and biomass in the intertidal zone in May, were directly affected by the fish farm discharge. Moreover, Ulva spp. had a high tissue N content (4.27 ± 0.10%), reflecting the high N concentration in the water column. This implies that Ulva spp. contribute to improving water quality by acting as a nutrient sink; because these species incorporate very large amounts of nutrients, they may play an ecologically important role in nutrient cycling in coastal ecosystems.
5. Conclusions
Fish farm effluent with high nutrient concentrations distinctly impacted macroalgal community structure in the intertidal zone. Overall, Ulva spp. characterized by high growth at high nutrient concentrations and rapid nutrient uptake rates dominated the intertidal zone; only four species had a cover of more than 1%. By contrast, the macroalgal community structure in the subtidal zone was only slightly affected by the discharge from land-based aquaculture. Perennial algae such as E. cava, erect coralline algae, and P. caulifera had high cover and biomasses in the subtidal zone. This indicates that the assemblage structure and composition of intertidal macroalgae are conspicuously affected by fish farm effluent. Ecklonia cava incorporated the most total C, N, and P in May and October due to its high biomass and characteristics as a perennial alga. In particular, Ulva spp. appear to play an important role as a nutrient sink that removes anthropogenically generated nutrients from over-enriched discharge, such as that from fish farms during the spring. However, further work is required to elucidate the contribution of the macroalgal community to the carbon budget and nutrient cycling in coastal areas.
Author Contributions
Conceptualization, S.K.C., H.J.L., and S.R.P.; methodology, S.K.C., T.H.K., and S.R.P.; formal analysis, S.K.C., Y.H.K., S.K., T.L., Y.B.S., and S.R.P.; investigation, S.K.C., T.-H.K., J.K.K., and S.R.P.; writing–original draft preparation, S.K.C., H.J.L., and S.R.P.; writing–review and editing, S.K.C., H.J.L., and S.R.P. All authors have read and agreed to the published version of the manuscript.
Funding
This research was supported by the Ministry of Oceans and Fisheries, Korea (project title: Improvement of management strategies on marine disturbing and harmful organisms, No. 20190518), to S.R.P. and H.J.L. and the 2020 scientific promotion funded by Jeju National University to S.R.P.
Data Availability Statement
The raw data supporting the conclusions of this article will be made available by the authors, without undue reservation.
Acknowledgments
We would like to thank K.L. Moon and B.S. Song for field assistance and laboratory support.
Conflicts of Interest
The authors declare no conflict of interest.
References
- Jickells, T.D. Nutrient biogeochemistry of the coastal zone. Science 1998, 281, 217–222. [Google Scholar] [CrossRef] [PubMed]
- Burak, S.; Dogan, E.; Gazioglu, C. Impact of urbanization and tourism on coastal environment. Ocean Coast. Manag. 2004, 47, 515–527. [Google Scholar] [CrossRef]
- Park, S.R.; Kim, J.H.; Kang, C.K.; An, S.M.; Chung, I.K.; Kim, J.H.; Lee, K.S. Current status and ecological roles of Zostera marina after recovery from large-scale reclamation in the Nakdong River estuary, Korea. Estuar. Coast. Shelf Sci. 2009, 81, 38–48. [Google Scholar] [CrossRef]
- Savage, C.; Leavitt, P.R.; Elmgren, R. Effects of land use, urbanization, and climate variability on coastal eutrophication in the Baltic Sea. Limnol. Oceanogr. 2010, 55, 1033–1046. [Google Scholar] [CrossRef]
- Bonsdorff, E.; Rönnberg, C.; Aarnio, K. Some ecological properties in relation to eutrophication in the Baltic Sea. Hydrobiologia 2002, 475, 371–377. [Google Scholar] [CrossRef]
- Kim, S.; Park, S.R.; Kang, Y.H.; Kim, G.-Y.; Lee, K.-S.; Lee, H.J.; Won, N.-I.; Kil, H.-J. Usefulness of tissue nitrogen content and macroalgal community structure as indicators of water eutrophication. J. Appl. Phycol. 2014, 26, 1149–1158. [Google Scholar] [CrossRef]
- Park, S.R. Seasonal patterns and recruitment dynamics of green tide-forming Ulva species along the intertidal rocky shores of the southern coast of Korea. Ocean Sci. J. 2014, 49, 383–390. [Google Scholar] [CrossRef]
- Beman, J.M.; Arrigo, K.R.; Matson, P.A. Agricultural runoff fuels large phytoplankton blooms in vulnerable areas of the ocean. Nature 2005, 434, 211–214. [Google Scholar] [CrossRef] [PubMed]
- KIOSIS. Available online: https://kosis.kr/index/index.do (accessed on 31 July 2021).
- Lee, T.; Moon, J.-H.; Jung, S.-K.; Park, G.; Kwon, S.; Min, S.-H.; Son, Y.B. Changes in the nutrient budget due to physiochemical factors in the coastal area of Jeju, Korea. J. Coast. Res. 2020, 95, 57–61. [Google Scholar] [CrossRef]
- Samanta, P.; Shin, S.; Jang, S.; Song, Y.-C.; Oh, S.; Kim, J.K. Stable carbon and nitrogen isotopic characterization and tracing nutrient sources of Ulva blooms around Jeju coastal areas. Environ. Pollut. 2019, 254, 113033. [Google Scholar] [CrossRef] [PubMed]
- Steneck, R.S.; Graham, M.H.; Bourque, B.J.; Corbett, D.; Erlandson, J.M.; Estes, J.A.; Tegner, M.J. Kelp forest ecosystems: Biodiversity, stability, resilience and future. Environ. Conserv. 2002, 29, 436–459. [Google Scholar] [CrossRef] [Green Version]
- Stevenson, J. Ecological assessments with algae: A review and synthesis. J. Phycol. 2014, 50, 437–461. [Google Scholar] [CrossRef] [PubMed]
- Díez, I.; Bustamante, M.; Santolaria, A.; Tajadura, J.; Muguerza, N.; Borja, A.; Muxika, I.; Saiz-Salinas, J.; Gorostiaga, J. Development of a tool for assessing the ecological quality status of intertidal coastal rocky assemblages, within Atlantic Iberian coasts. Ecol. Indic. 2012, 12, 58–71. [Google Scholar] [CrossRef]
- Neto, J.M.; Gaspar, R.; Pereira, L.; Marques, J.C. Marine Macroalgae Assessment Tool (MarMAT) for intertidal rocky shores. Quality assessment under the scope of the European Water Framework Directive. Ecol. Indic. 2012, 19, 39–47. [Google Scholar] [CrossRef]
- Piazzi, L.; Ceccherelli, G. Alpha and beta diversity in Mediterranean macroalgal assemblages: Relevancy and type of effect of anthropogenic stressors vs. natural variability. Mar. Biol. 2020, 167, 32. [Google Scholar] [CrossRef]
- Gorostiaga, J.M.; Díez, I. Changes in the sublittoral benthic marine macroalgae in the polluted area of Abra de Bilbao and proximal coast (Northern Spain). Mar. Ecol. Prog. Ser. 1996, 130, 157–167. [Google Scholar] [CrossRef]
- Reish, D.J. The use of benthic communities in marine environmental assessment. In Memorias V Simposio en Biología Marina; Malagrino, G., Santoyo, H., Eds.; Universidad Autónoma Baja California Sur: La Paz, Bolivia, 1987; pp. 123–126. [Google Scholar]
- Balata, D.; Acunto, S.; Cinelli, F. Spatio-temporal variability and vertical distribution of a low rocky subtidal assemblage in the north-west Mediterranean. Estuar. Coast. Shelf Sci. 2006, 67, 553–561. [Google Scholar] [CrossRef]
- Davison, I.R.; Pearson, G.A. Stress tolerance in intertidal seaweeds. J. Phycol. 1996, 32, 197–211. [Google Scholar] [CrossRef]
- Lobban, C.S.; Harrison, P.J. Seaweed Ecology and Physiology; Cambridge University Press: Cambridge, UK, 1994; p. 384. [Google Scholar]
- Soltan, D.; Verlaque, M.; Boudouresque, C.F.; Francour, P. Changes in macroalgal communities in the vicinity of a Mediterranean sewage outfall after the setting up of a treatment plant. Mar. Pollut. Bull. 2001, 42, 59–70. [Google Scholar] [CrossRef]
- Torres, A.I.; Gil, M.N.; Esteves, J.L. Nutrient uptake rates by the alien alga Undaria pinnatifida (Phaeophyta) (Nuevo Gulf, Patagonia, Argentina) when exposed to diluted sewage effluent. Hydrobiologia 2004, 520, 1–6. [Google Scholar] [CrossRef]
- Lindstrom, S.C. The biogeography of seaweeds in Southeast Alaska. J. Biogeogr. 2009, 36, 401–409. [Google Scholar] [CrossRef]
- Mann, K.H. Seaweeds: Their productivity and strategy for growth. Science 1973, 182, 975–981. [Google Scholar] [CrossRef] [PubMed]
- Fourqurean, J.W.; Duarte, C.M.; Kennedy, H.; Marbà, N.; Holmer, M.; Mateo, M.A.; Apostolaki, E.T.; Kendrick, G.A.; Krause-Jensen, D.; McGlathery, K.J. Seagrass ecosystems as a globally significant carbon stock. Nat. Geosci. 2012, 5, 505–509. [Google Scholar] [CrossRef]
- McGlathery, K.J.; Anderson, I.C.; Tyler, A.C. Magnitude and variability of benthic and pelagic metabolism in a temperate coastal lagoon. Mar. Ecol. Prog. Ser. 2001, 216, 1–15. [Google Scholar] [CrossRef]
- Zertuche-González, J.A.; Camacho-Ibar, V.F.; Pacheco-Ruíz, I.; Cabello-Pasini, A.; Galindo-Bect, L.A.; Guzmán-Calderón, J.M.; Macias-Carranza, V.; Espinoza-Avalos, J. The role of Ulva spp. as a temporary nutrient sink in a coastal lagoon with oyster cultivation and upwelling influence. J. Appl. Phycol. 2009, 21, 729–736. [Google Scholar] [CrossRef]
- Bayley, D.; Brickle, P.; Brewin, P.; Golding, N.; Pelembe, T. Valuation of kelp forest ecosystem services in the Falkland Islands: A case study integrating blue carbon sequestration potential. One Ecos. 2021, 6, e62811. [Google Scholar] [CrossRef]
- Piccini, M.; Raikova, S.; Allen, M.J.; Chuck, C.J. A synergistic use of microalgae and macroalgae for heavy metal bioremediation and bioenergy production through hydrothermal liquefaction. Sustain. Energ. Fuels 2019, 3, 292–301. [Google Scholar] [CrossRef] [Green Version]
- Filbee-Dexter, K.; Wernberg, T. Substantial blue carbon in overlooked Australian kelp forests. Sci. Rep. 2020, 10, 12341. [Google Scholar] [CrossRef]
- Kang, Y.H.; Kim, S.; Choi, S.K.; Lee, H.J.; Chung, I.K.; Park, S.R. A comparison of the bioremediation potential of five seaweed species in an integrated fish-seaweed aquaculture system: Implication for a multi-species seaweed culture. Rev. Aquac. 2021, 13, 353–364. [Google Scholar] [CrossRef]
- Chung, I.K.; Oak, J.H.; Lee, J.A.; Shin, J.A.; Kim, J.G.; Park, K.-S. Installing kelp forests/seaweed beds for mitigation and adaptation against global warming: Korean Project Overview. ICES J. Mar. Sci. 2013, 70, 1038–1044. [Google Scholar] [CrossRef] [Green Version]
- Du, G.; Zhao, E.; Liu, C.; Tang, X. Estimating areal carbon fixation of intertidal macroalgal community based on composition dynamics and laboratory measurements. J. Oceanol. Limnol. 2019, 37, 93–101. [Google Scholar] [CrossRef]
- Xiao, X.; Agusti, S.; Lin, F.; Li, K.; Pan, Y.; Yu, Y.; Zheng, Y.; Wu, J.; Duarte, C.M. Nutrient removal from Chinese coastal waters by large-scale seaweed aquaculture. Sci. Rep. 2017, 7, 46613. [Google Scholar] [CrossRef] [PubMed] [Green Version]
- Oh, Y.H.; Kim, Y.; Park, S.R.; Lee, T.; Son, Y.B.; Park, S.-E.; Lee, W.C.; Im, D.-H.; Kim, T.-H. Spatiotemporal change in coastal waters caused by land-based fish farm wastewater-borne nutrients: Results from Jeju Island, Korea. Mar. Pollut. Bull. 2021, 170, 112632. [Google Scholar] [CrossRef]
- Koh, H.-J.; Park, S.-E.; Cha, H.-K.; Chang, D.-S.; Koo, J.-H. Coastal eutrophication caused by effluent from aquaculture ponds in Jeju. J. Korean Soc. Mr. Environ. Saf. 2013, 19, 315–326. [Google Scholar] [CrossRef] [Green Version]
- Parsons, T.R.; Maita, Y.; Lalli, C.M. A Manual of Chemical and Biological Methods for Seawater Analysis; Pergamon Press: Oxford, UK, 1984; p. 173. [Google Scholar]
- Dethier, M.N.; Graham, E.S.; Cohen, S.; Tear, L.M. Visual versus random-point percent cover estimations: ‘objective’ is not always better. Mar. Ecol. Prog. Ser. 1993, 96, 93–100. [Google Scholar] [CrossRef]
- Bae, E.H.; Kim, H.-S.; Kwon, C.-J.; Hwang, I.-K.; Kim, G.H.; Klochkova, T.A. Algal Flora of Korea. vol.1, no.1, Marine Green Algae; National Institute of Biological Resources: Incheon, Korea, 2010; p. 218. [Google Scholar]
- Boo, S.-M.; Lee, W.J.; Hwang, I.-K.; Geum, Y.S.; Oak, J.H.; Cho, G.Y. Algal Flora of Korea. vol.2, no.2, Marine Brown Algae; National Institute of Biological Resources: Incheon, Korea, 2010; p. 205. [Google Scholar]
- Kang, J.W. Illustrated Encyclopedia of Fauna & Flora of Korea. vol. 8 Marine Algae; Ministry of Education: Seoul, Korea, 1968; p. 465. [Google Scholar]
- Kim, H.-S. Algal Flora of Korea. vol.4, no.8, Marine Red Algae; National Institute of Biological Resources: Incheon, Korea, 2013; p. 183. [Google Scholar]
- Kim, H.-S.; Boo, S.-M. Algal Flora of Korea. vol.2, no.1, Marine Brown Algae; National Institute of Biological Resources: Incheon, Korea, 2010; p. 195. [Google Scholar]
- Kim, H.-S.; Boo, S.-M.; Lee, I.K.; Sohn, C.-H. National List of Species of Korea: Marine Algae; National Institute of Biological Resources: Incheon, Korea, 2013; p. 336. [Google Scholar]
- Kim, H.-S.; Hwang, I.-K. Algal Flora of Korea. vol.4, no.10, Marine Red Algae; National Institute of Biological Resources: Incheon, Korea, 2015; p. 140. [Google Scholar]
- Lee, Y.P. Marine Algae of Jeju; Academy Publication: Seoul, Korea, 2008; p. 477. [Google Scholar]
- Nam, K.W. Algal Flora of Korea. vol.4, no.3, Marine Red Algae; National Institute of Biological Resources: Incheon, Korea, 2011; p. 203. [Google Scholar]
- Nam, K.W.; Kang, P.J. Algal Flora of Korea. vol.4, no.9, Marine Red Algae; National Institute of Biological Resources: Incheon, Korea, 2013; p. 132. [Google Scholar]
- Nam, K.W.; Kang, P.J. Algal Flora of Korea. vol.4, no.11, Marine Red Algae; National Institute of Biological Resources: Incheon, Korea, 2015; p. 146. [Google Scholar]
- Yoshida, T. Marine Algae of Japan; Uchida–Rokakuho Publishing Company: Tokyo, Japan, 1998; p. 1222. [Google Scholar]
- Chapman, H.D.; Pratt, P.F. Methods of analysis for soils, plants, and waters. Soil Sci. 1961, 93, 63. [Google Scholar] [CrossRef] [Green Version]
- Teichberg, M.; Heffner, L.R.; Fox, S.; Valiela, I. Nitrate reductase and glutamine synthetase activity, internal N pools, and growth of Ulva lactuca: Responses to long and short-term N supply. Mar. Biol. 2007, 151, 1249–1259. [Google Scholar] [CrossRef]
- Díez, I.; Santolaria, A.; Gorostiaga, J.M. The relationship of environmental factors to the structure and distribution of subtidal seaweed vegetation of the western Basque coast (N Spain). Estuar. Coast. Shelf Sci. 2003, 56, 1041–1054. [Google Scholar] [CrossRef]
- Liu, D.; Bai, J.; Song, S.; Zhang, J.; Sun, P.; Li, Y.; Han, G. The impact of sewage discharge on the macroalgae community in the Yellow Sea coastal area around Qingdao, China. Water Air Soil Pollut. 2007, 7, 683–692. [Google Scholar] [CrossRef]
- Rodríguez Prieto, C.; Polo Albertí, L. Effects of the sewage pollution in the structure and dynamics of the community of Cystoseira mediterranea (Fucales, Phaeophyceae). Sci. Mar. 1996, 60, 253–263. [Google Scholar]
- Arévalo, R.; Pinedo, S.; Ballesteros, E. Changes in the composition and structure of Mediterranean rocky-shore communities following a gradient of nutrient enrichment: Descriptive study and test of proposed methods to assess water quality regarding macroalgae. Mar. Pollut. Bull. 2007, 55, 104–113. [Google Scholar] [CrossRef] [Green Version]
- Hepburn, C.; Pritchard, D.; Cornwall, C.; McLeod, R.; Beardall, J.; Raven, J.; Hurd, C. Diversity of carbon use strategies in a kelp forest community: Implications for a high CO2 ocean. Glob. Change Biol. 2011, 17, 2488–2497. [Google Scholar] [CrossRef]
- McCoy, S.J.; Kamenos, N.A. Coralline algae (Rhodophyta) in a changing world: Integrating ecological, physiological, and geochemical responses to global change. J. Phycol. 2015, 51, 6–24. [Google Scholar] [CrossRef]
- Kim, B.Y.; Ko, J.-C.; Ko, H.J.; Park, S.E.; Cha, H.K.; Choi, H.G. Seasonal variation in community structure of subtidal seaweeds in Jeju Island, Korea. Korean J. Fish. Aquat. Sci. 2013, 46, 607–618. [Google Scholar]
- Oak, J.H.; Keum, Y.S.; Hwang, M.S.; Oh, Y.S. Subtidal algal community of Supseom and Seongsanpo in Jeju Island. Underw. Sci. Tech. 2004, 5, 3–9. [Google Scholar]
- Yoo, J.-S. Community dynamics of benthic marine algae in the intertidal and subtidal rocky shore of Samyang, Jejudo Island. Algae 2003, 18, 301–309. [Google Scholar] [CrossRef]
- Hwang, S.-I.; Kim, D.-K.; Sung, B.-J.; Jun, S.-K.; Bae, J.-I.; Jeon, B.-H. Effects of climate change on whitening event proliferation the coast of Jeju. Korean J. Environ. Ecol. 2017, 31, 529–536. [Google Scholar] [CrossRef]
- Suh, Y.S.; Hwang, J.D.; Pang, I.C.; Han, I.S.; Jo, J.D.; Lee, N.K. Long-term variations of sea surface temperature in inshore and offshore waters of Jeju Island. Korean J. Nat. Conserv. 2011, 5, 135–140. [Google Scholar]
- Narvarte, B.C.V.; Nelson, W.A.; Roleda, M.Y. Inorganic carbon utilization of tropical calcifying macroalgae and the impacts of intensive mariculture-derived coastal acidification on the physiological performance of the rhodolith Sporolithon sp. Environ. Pollut. 2020, 266, 115344. [Google Scholar] [CrossRef]
- Kim, J.-H.; Kim, N.; Moon, H.; Lee, S.; Jeong, S.Y.; Diaz-Pulido, G.; Edwards, M.S.; Kang, J.-H.; Kang, E.J.; Oh, H.-J. Global warming offsets the ecophysiological stress of ocean acidification on temperate crustose coralline algae. Mar. Pollut. Bull. 2020, 157, 111324. [Google Scholar] [CrossRef]
- Connell, S.D.; Russell, B.D.; Turner, D.J.; Shepherd, S.A.; Kildea, T.; Miller, D.; Airoldi, L.; Cheshire, A. Recovering a lost baseline: Missing kelp forests from a metropolitan coast. Mar. Ecol. Prog. Ser. 2008, 360, 63–72. [Google Scholar] [CrossRef] [Green Version]
- Doblin, M.A.; Clayton, M.N. Effects of secondarily-treated sewage effluent on the early life-history stages of two species of brown macroalgae: Hormosira banksii and Durvillaea potatorum. Mar. Biol. 1995, 122, 689–698. [Google Scholar] [CrossRef]
- Scherner, F.; Barufi, J.B.; Horta, P.A. Photosynthetic response of two seaweed species along an urban pollution gradient: Evidence of selection of pollution-tolerant species. Mar. Pollut. Bull. 2012, 64, 2380–2390. [Google Scholar] [CrossRef] [PubMed]
- Middelboe, A.L.; Sand-Jensen, K. Long-term changes in macroalgal communities in a Danish estuary. Phycologia 2000, 39, 245–257. [Google Scholar] [CrossRef]
- Layton, C.; Shelamoff, V.; Cameron, M.J.; Tatsumi, M.; Wright, J.T.; Johnson, C.R. Resilience and stability of kelp forests: The importance of patch dynamics and environment-engineer feedbacks. PLoS ONE 2019, 14, e0210220. [Google Scholar] [CrossRef] [PubMed] [Green Version]
- Kim, S.; Kang, Y.H.; Kim, T.-H.; Park, S.R. Recovery pattern and seasonal dynamics of kelp species, Ecklonia cava population formed following the large-scale disturbance. J. Korean Soc. Oceanogr. 2016, 21, 103–111. [Google Scholar]
- Serisawa, Y.; Yokohama, Y.; Aruga, Y.; Tanaka, J. Photosynthesis and respiration in bladelets of Ecklonia cava Kjellman (Laminariales, Phaeophyta) in two localities with different temperature conditions. Phycol. Res. 2001, 49, 1–11. [Google Scholar] [CrossRef]
- Macreadie, P.I.; Anton, A.; Raven, J.A.; Beaumont, N.; Connolly, R.M.; Friess, D.A.; Kelleway, J.J.; Kennedy, H.; Kuwae, T.; Lavery, P.S. The future of Blue Carbon science. Nat. Commun. 2019, 10, 3998. [Google Scholar] [CrossRef] [Green Version]
- Krause-Jensen, D.; Lavery, P.; Serrano, O.; Marbà, N.; Masque, P.; Duarte, C.M. Sequestration of macroalgal carbon: The elephant in the Blue Carbon room. Biol. Lett. 2018, 14, 20180236. [Google Scholar] [CrossRef] [Green Version]
- Krause-Jensen, D.; Duarte, C.M. Substantial role of macroalgae in marine carbon sequestration. Nat. Geosci. 2016, 9, 737–742. [Google Scholar] [CrossRef]
- Queirós, A.M.; Stephens, N.; Widdicombe, S.; Tait, K.; McCoy, S.J.; Ingels, J.; Rühl, S.; Airs, R.; Beesley, A.; Carnovale, G. Connected macroalgal-sediment systems: Blue carbon and food webs in the deep coastal ocean. Ecol. Monogr. 2019, 89, e01366. [Google Scholar] [CrossRef] [Green Version]
- Choi, C.-G.; Kim, J.-H.; Chung, I.-K. Temporal variation of seaweed biomass in Korean coasts: Yokjido, Gyeongnam Province. Algae 2008, 23, 311–316. [Google Scholar] [CrossRef]
- Kang, J.C.; Choi, H.G.; Kim, M.S. Macroalgal species composition and seasonal variation in biomass on Udo, Jeju Island, Korea. Algae 2011, 26, 333–342. [Google Scholar] [CrossRef]
- van der Heijden, L.H.; Kamenos, N.A. Calculating the global contribution of coralline algae to carbon burial. Biogeosciences 2015, 12, 7845–7877. [Google Scholar] [CrossRef] [Green Version]
- Nguyen, H.T.T.; Pritchard, D.W.; Hepburn, C.D. Nitrogen and phosphorus ecophysiology of coralline algae. J. Appl. Phycol. 2020, 32, 2583–2597. [Google Scholar] [CrossRef]
- Johnson, M.D.; Carpenter, R.C. Nitrogen enrichment offsets direct negative effects of ocean acidification on a reef-building crustose coralline alga. Biol. Lett. 2018, 14, 20180371. [Google Scholar] [CrossRef] [Green Version]
- Keesing, J.K.; Liu, D.; Fearns, P.; Garcia, R. Inter-and intra-annual patterns of Ulva prolifera green tides in the Yellow Sea during 2007–2009, their origin and relationship to the expansion of coastal seaweed aquaculture in China. Mar. Pollut. Bull. 2011, 62, 1169–1182. [Google Scholar] [CrossRef]
- Zhang, Y.; He, P.; Li, H.; Li, G.; Liu, J.; Jiao, F.; Zhang, J.; Huo, Y.; Shi, X.; Su, R. Ulva prolifera green-tide outbreaks and their environmental impact in the Yellow Sea, China. Natl. Sci. Rev. 2019, 6, 825–838. [Google Scholar] [CrossRef] [Green Version]
- Kang, Y.H.; Hwang, J.R.; Chung, I.K.; Park, S.R. Development of a seaweed species-selection index for successful culture in a seaweed-based integrated aquaculture system. J. Ocean Univ. China 2013, 12, 125–133. [Google Scholar] [CrossRef]
- Kang, J.H.; Jang, J.E.; Kim, J.H.; Byeon, S.Y.; Kim, S.; Choi, S.K.; Kang, Y.H.; Park, S.R.; Lee, H.J. Species composition, diversity, and distribution of the genus Ulva along the coast of Jeju Island, Korea based on molecular phylogenetic analysis. PLoS ONE 2019, 14, e0219958. [Google Scholar] [CrossRef]
- Park, S.R.; Kang, Y.H.; Lee, H.J.; Ko, Y.W.; Kim, J.H. The importance of substratum and elevation in recruitment and persistence of ulvoid algal blooms on rocky intertidal shores of the southern Korean coast. Bot. Mar. 2014, 57, 55–66. [Google Scholar] [CrossRef]
Publisher’s Note: MDPI stays neutral with regard to jurisdictional claims in published maps and institutional affiliations. |
© 2021 by the authors. Licensee MDPI, Basel, Switzerland. This article is an open access article distributed under the terms and conditions of the Creative Commons Attribution (CC BY) license (https://creativecommons.org/licenses/by/4.0/).

