Review

Where Have Shared E-Scooters Taken Us So Far? A Review of Mobility Patterns, Usage Frequency, and Personas

1
Department of Built Environment, Aalto University, 02150 Espoo, Finland
2
Department of Civil and Environmental Engineering, University of Louisville, Louisville, KY 40292, USA
*
Author to whom correspondence should be addressed.
Sustainability 2021, 13(21), 11792; https://doi.org/10.3390/su132111792
Submission received: 31 August 2021 / Revised: 15 October 2021 / Accepted: 18 October 2021 / Published: 26 October 2021
(This article belongs to the Special Issue Behavioral Changes towards More Sustainable Travelling)

Abstract

:
The emergence of micromobility services in the form of dockless shared e-scooters has resulted in a wide range of behavioral changes in urban environments. In order to effectively steer these changes towards sustainability targets, the characteristics of e-scooter trips and users’ behaviors should be understood further. However, there is a lack of systematic literature reviews in this domain. To address this gap, we provide a two-fold systematic literature review. The first aspect focuses on the categorization of temporal and spatial patterns of shared e-scooter usage. The second aspect focuses on a deeper understanding of e-scooter users’ behaviors, utilizing the principles of persona design. The analysis of temporal patterns highlights the commonality of midday, evening, and weekend peak usage across cities, while spatial patterns suggest e-scooters are used for traveling to recreational and educational land use, as well as city center areas. The synthesis of findings on users’ behaviors has resulted in six categories, with four user types based on usage frequency (one time, casual, power, and non-adopters), and two motivation-based personas (users who are not satisfied with current mobility options and users who have had positive travel experience from e-scooter usage). The overall findings provide important lessons for evaluating this emerging mobility service, which should be considered for steering its development in public-private stakeholder networks.

1. Introduction

Recently, there have been rapid developments in both scooter vehicle technology and associated sharing business models, along with deployment across metropolitan areas [1,2,3,4]. Some of the literature argues that shared electric-powered scooters (e-scooters) could offer a viable alternative for first-mile and last-mile trips, as well as a reduction in fuel consumption and pollution [5,6,7,8]. There is a growing body of conceptual and review papers on different aspects of e-scooters and factors associated with their trips. These include studies on vehicle development, including battery life and recharge [9], optimization [10], life cycle assessment [11], vehicle dynamics [12], business model development [13], service loyalty [14], economic models [15], policy and regulation [16], shared space management [17], safety [18], environmental impact [19], parking analysis [20], geofences [21], e-scooter injuries [22], and COVID-19 [23]. While aspects such as infrastructure and commercialization are important, gaining a deep understanding of mobility behavior related to e-scooters plays a pivotal role in the ongoing transition of urban mobility systems worldwide [24].
In contrast to this importance, only a handful of review papers are available in this area. O’hern and Estgfaeller studied a wide range of electrically powered micromobility technologies (i.e., bikeshare, shared e-scooter, e-skateboard, and hoverboard), which focused on potential benefits to user behavior, vehicle technology, planning, policy, health, and safety [25]. They investigated the keyword clusters to see which researchers, in what journals, and in which geographical contexts, conducted electrically powered micromobility-related studies. Abduljabbar et al. reviewed twenty years of related micromobility research, and highlighted its importance as a low-carbon alternative mode of transportation [26]. They categorized micromobility research into four main clusters including benefits, policy, technology, and determinants of micromobility usage. Wang et al. reviewed the literature and focused on the shared e-scooter modal shift based on surveys in 26 cities across the world [27]. They suggested that shared e-scooters can be substitutes for car driving over short distances, while they can complement transit trips and result in increasing the total number of passengers. Oeschger et al. conducted a systematic literature review of studies that focused on integration of micromobility and Public Transit (PT) systems, and evaluated to what extent micromobility could act to fill the first-mile and last-mile gap associated with public transit [28]. They reviewed data sources, system characteristics, users, and impacts. Liao and Correia reviewed four themes for e-scooter use, i.e., performance, descriptions of the available systems, demand estimation studies, and impact evaluation studies [29]. They concluded that high-income and educated middle-aged men were more likely to be e-scooter users. Boglietti et al. reviewed the impacts of e-powered micro personal mobility vehicles such as e-bikes, e-scooters, and self-balancing vehicles. They reviewed 90 papers published between 2014 and 2020 [30]. The review classified studies into two categories, i.e., endogenous issues (impact on transport and urban planning) and exogenous issues (impact on safety and the environment). Regarding transportation equity, Dill and McNeil conducted a review study on shared mobility modes (including, shared e-scooter, bikeshare, and carshare) for disadvantaged groups that focused on race, gender, age, income, and disability status [31]. Their results indicated a higher percentage of e-scooter usage among men and younger individuals and found e-scooter users to be more diverse than bikeshare users. Moreover, they found no evidence that e-scooters enhanced the mobility of the elderly and, from a disability perspective, their study identified several negative impacts of e-scooters such as parked scooters blocking sidewalks [31]. In another study, Riggs et al. reviewed best practices for municipal e-scooter polices, and focused on 61 cities in the USA [32]. A specific focus of this policy review was on equity-related policies, such as low-income payment plans and distribution requirements.
Taking into consideration the previous review studies, there is no review with an explicit user-centered approach towards e-scooter usage in urban environments. Furthermore, a comprehensive review to specifically study e-scooter usage characteristics including a mobility pattern review is missing. Thus, the aim of this study is twofold. One, we focus on mobility patterns including the temporal and spatial analysis of shared e-scooter trips. Two, we focus on users’ profiles and characteristics described in the form of personas. The scope of this review provides an opportunity to better understand aspects of behavioral changes associated with shared e-scooter usage and their roles in the sustainability transition in urban environments. The next section outlines the methodology for the systematic literature review. The third section describes findings according to the two main aims listed above, while the last section presents a discussion of findings and conclusions for research and practice.

2. Systematic Review Methodology

2.1. Sampling

The development of the research methodology relied on a systematic review approach [33]. The methodology was also developed following suggestions from [34,35], which were in line with [33]. Following this approach, the papers were systematically searched, appraised, and finally the research evidence was analyzed and synthesized [33]. The methodological development followed the Preferred Reporting Items for Systematic reviews and Meta-Analyses (PRISMA) statement guideline. The PRISMA guideline is “an evidence-based minimum set of items for reporting in systematic reviews and meta-analyses” [36], and consists of a four-phase flow diagram. The four phases implemented in this systematic review process include identification, screening, eligibility, and inclusion of the documents that fall under the scope of this review (Figure 1).
Starting with the identification phase, the research goal and strategy were defined, including a clear and documented definition of search terms, as shown in Table 1. Since the scope of our research is rental or shared e-scooters, we only included papers with a focus on shared or rental e-scooters. In addition, identification included combinations of those terms in search strings, identification of databases to be used, filters, and inclusion and exclusion criteria on which to base the search and selection process. It is important to note, at this point, that in order to identify the most relevant articles, only those articles that had a travel-related analysis as the core of their research question were selected. Therefore, the papers with research questions such as safety and injury-related studies, policy and regulation, life-cycle assessment, battery and charging station optimization, marketing and business models, as well as data privacy and management were excluded. The search was conducted using six electronic databases, including Web of Science, Transport Research International Documentation (TRID), MDPI, Tandfonline, IEEE, and Scopus. Google Scholar was also included in the search process, since the review subject is new and limited, following examples from similar review literature [37,38]. The scope focused only on English, peer-reviewed, journal articles, book chapters, and conference proceedings. The set of literature included publications posted online on, or before, 31 December 2020. In some cases, a paper that was published online during 2020 was included, even if it was assigned to a 2021 issue. Since this subject is relatively new and as there is no existing review with this specific focus and scope, we did not consider a start date. The identification phase resulted in 152 unique documents.
In the screening phase, we evaluated previously identified studies based on their suitability for data extraction, by reading the abstract. All records were examined by two researchers. On the basis of the examination of abstracts, 109 publications were excluded from the total sample of 152 publications. In the third phase, eligibility of the articles was further checked by two researchers, based on reading the full publication text. After this phase, seven articles were excluded (Figure 1). Among the remaining 25 publications, 16 publications were included in the analysis sample, while 9 publications were included in the synthesis sample.

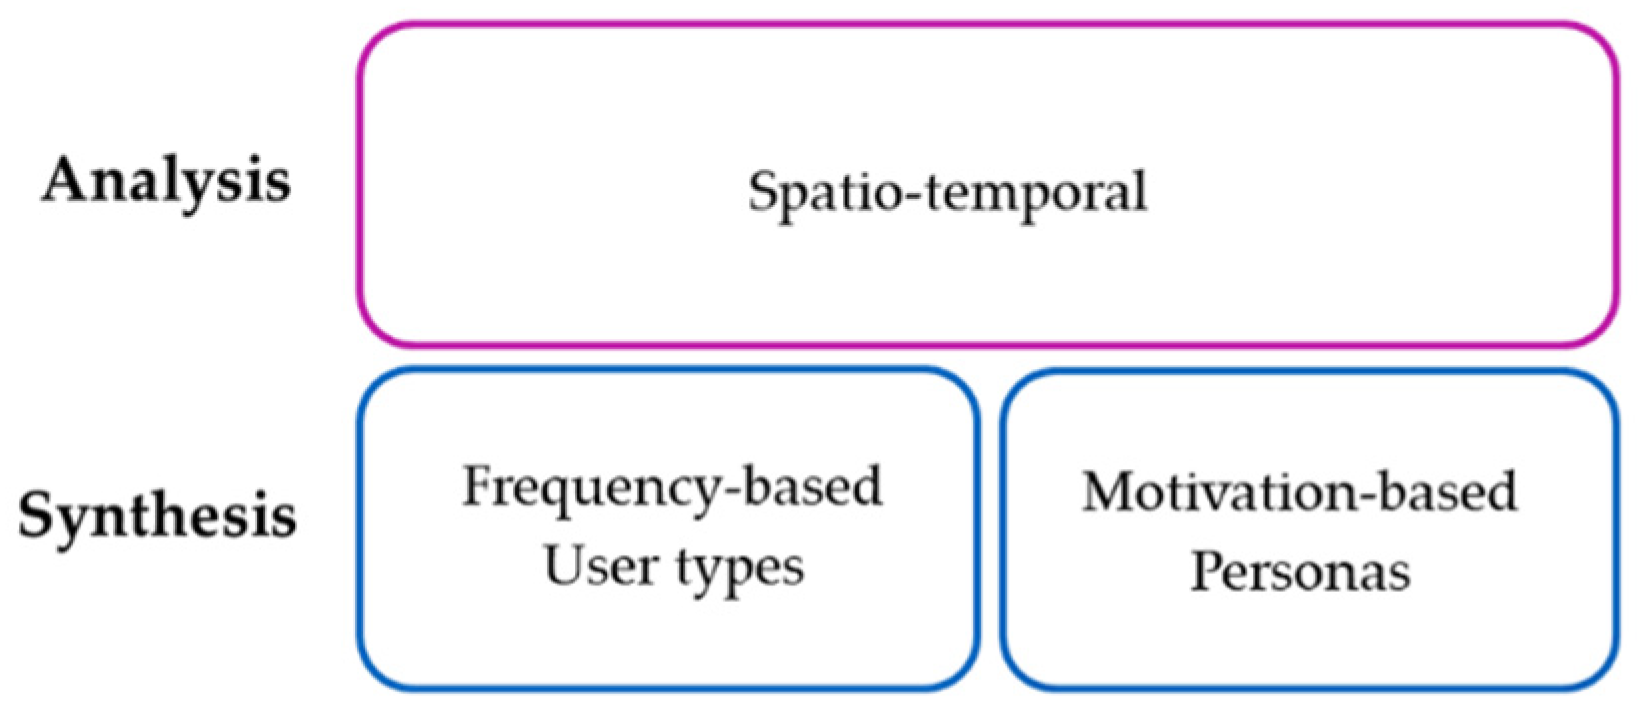
2.2. Analysis and Synthesis

The review methodology focused on two complementary aspects for understanding e-scooter usage: (1) analysis and (2) synthesis. The methodological framework behind the analysis and synthesis of sample papers is depicted in Figure 2. The analysis was introduced to identify individual factors influencing e-scooter usage, while the synthesis was introduced to provide a combination of findings. The analysis of literature followed standard practices of classification and categorization of research findings into groups. Thus, the analysis included all the papers which focused on temporal or spatial effects. However, these papers had only limited information about users of e-scooters. As a result, the analysis part provided findings on key spatio-temporal mobility patterns observed in the literature.
The second aspect of the review focused on a deeper understanding of e-scooter users’ perspectives through a synthesis of findings in the previous research. On the one hand, the synthesis focused on understanding usage frequency, aiming to classify users into specific user types. On the other hand, the synthesis focused on developing personas for gaining a deeper understanding of underlying reasons for users’ behavior. Personas originated from design research [39], and similar ideas have been used in transportation studies previously for market segmentation [40]. For example, Eldeeb and Mohamed utilized a persona-based approach to understand the preferences of the key transit market groups and estimate their willingness to pay for service improvements [41]. In another study, Magdolen et al. created eight mobility styles with behavioral and attitudinal characteristics as clustering criteria [42]. The difference between user types and personas is that, for the latter, we considered any user characteristics that could be found in the existing literature. The sample of papers used for synthesis of e-scooter (non)-users characteristics included research based on questionnaires, interviews, or video recordings of e-scooter users. In order to develop user types and personas, the following aspects were reviewed in each paper:
  • Demographic characteristics such as gender, age, living location, employment status, income, education level, etc.;
  • Trip purpose;
  • Usage frequency;
  • Motives to use e-scooters;
  • Deterrents from use of e-scooters.

3. Findings

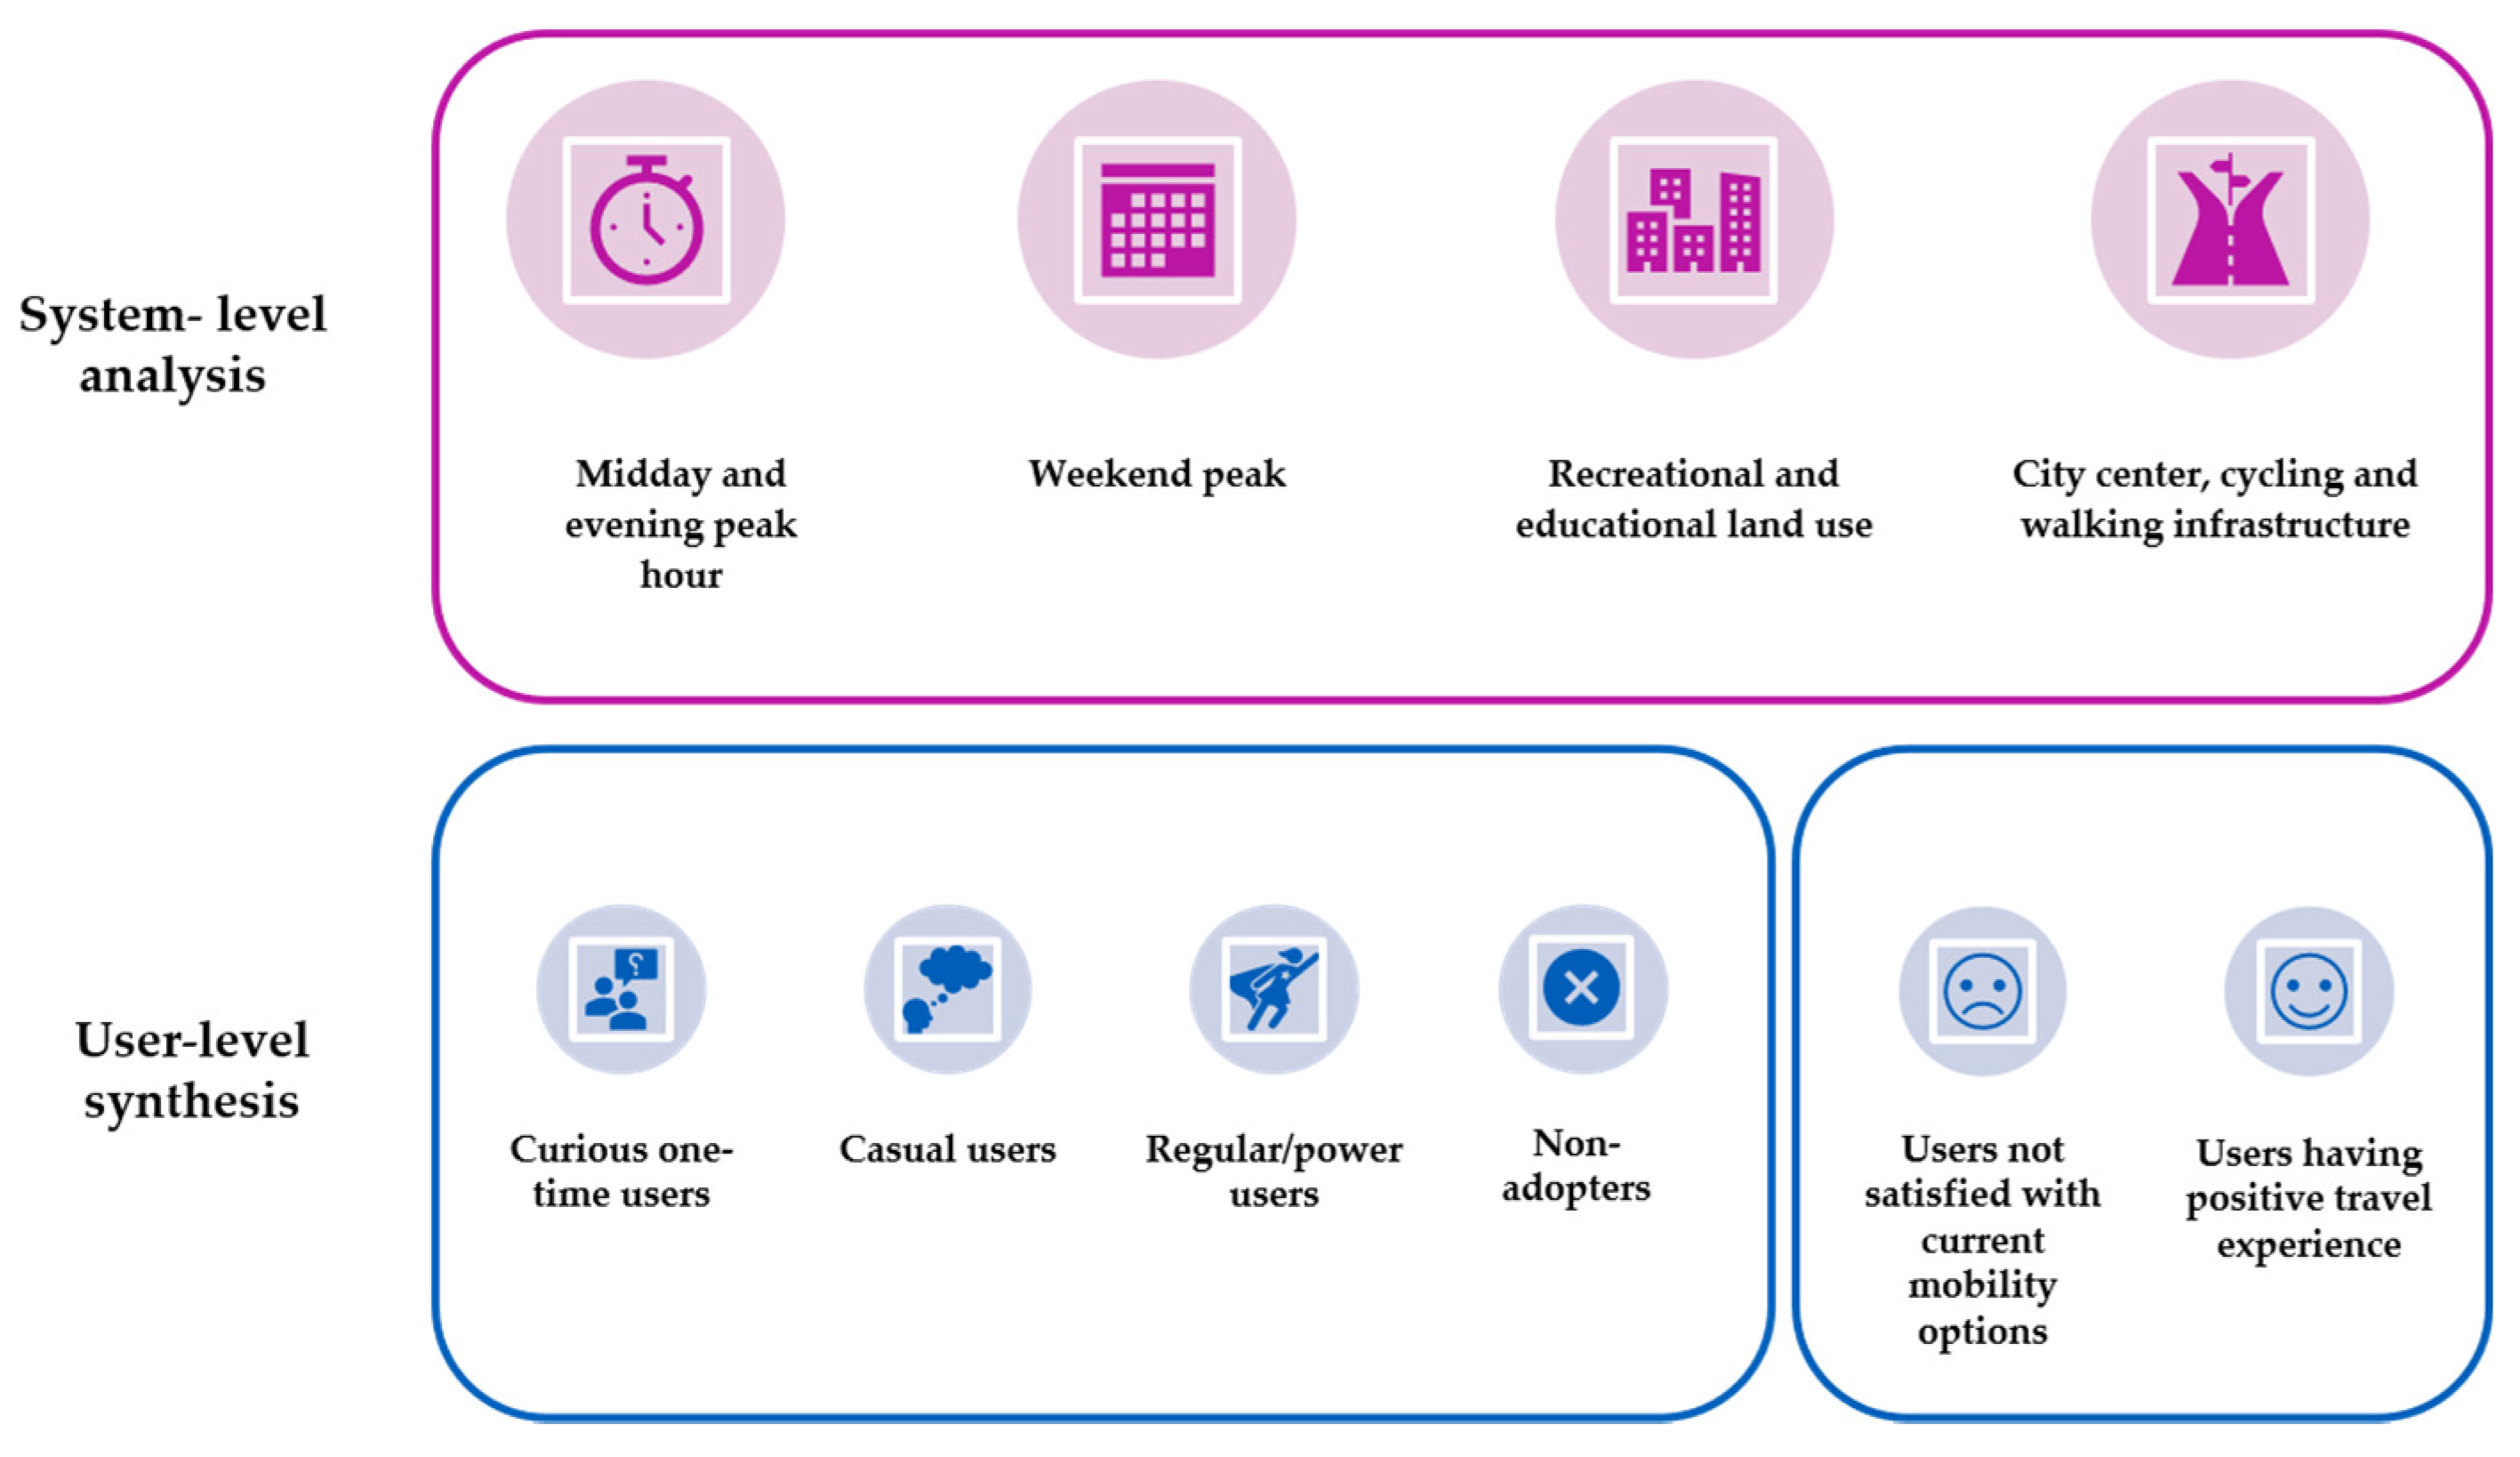
3.1. Spatio-Temporal Mobility Patterns

3.1.1. Temporal Analysis

The findings are presented in ascending order from temporal patterns within a day towards increasing the size of the temporal scale, such as seasonal variations related to weather or special events. The first group of papers focused mainly on analyzing temporal patterns within the day. McKenzie (2019) analyzed four months of e-scooter data in Washington, DC, USA and showed a midday peak for trips [43]. Jijo et al. (2019) investigated the temporal pattern of e-scooters in three months of data in Indianapolis, IN, USA and found 4 p.m. to 8 p.m. as peak e-scooter trip hours. Usage per day of only 15% of e-scooters were more than 1 h/day, while 50% of vehicles were used for around 40 min/day or less [44]. In Louisville, KY, USA, Hosseinzadeh et al. (2021) identified Saturdays between 1 p.m. and 5 p.m. as the peak e-scooter demand period [45]. The same results were found in Austin, TX, USA, where Jiao and Bai (2020) showed Saturdays from 1 p.m. to 5 p.m. as peak hours of shared e-scooter trips. In addition, trips on weekdays were longer in distance and duration but slower in speed than the weekends [46]. Zou et al. (2020) analyzed five weeks of e-scooter trips in Washington, DC, USA, and found the midday and evening peaks on principal and minor arterials match the peak hours of shared e-scooter trips [47]. Reck et al. (2020) conducted a study in Zurich, Switzerland on more than 18,000 e-scooter trips over a period of more than two weeks in January 2020 and found a negative association with morning peak (i.e., 6 a.m. to 9 a.m.) and positive association with nighttime (i.e., 9 p.m. to 5 a.m.) in relation to e-scooter trips and usage for very short trips (median 721 m). They also found higher probability of usage in e-scooters as compared with other micromobility modes at night and early mornings and for shorter distance trips [48].
A set of papers focused mainly on the temporal scale of one day. McKenzie (2019) subsequently examined the daily distribution of trips using cosine similarity and found Tuesday/Thursday and Saturday/Sunday as the days with the highest similarity in shared e-scooter usage pattern [43]. Almannaa et al. (2020) analyzed six months of shared e-scooter data based on their average speed in different days of the week and times of day in Austin, TX, USA. Implementing consensus clustering, they found two clusters: first, for weekends plus Fridays, and second, for the rest of the days. A two-sided Wilcoxon rank-sum test revealed a different mobility pattern in the distribution of average speed between the two clusters. The same approach resulted in two clusters: first, from 3 a.m. to 12 p.m. (average speed 2.78 m/s, s.d. 1.64) and second, one for the rest of the day (average speed 2.19 m/s; s.d. 0.73) [49]. In another study in Washington, DC, USA, McKenzie (2020) explored similarities and differences between micromobility providers, over a four-month period, using Watson’s U2 and CosSim. While the e-scooter variation during days showed general conformity, the least available provider resulted in a significantly dissimilar trend. He also compared the travel time of micromobility and ride hailing options across different TAZs and the results showed that 8–9 a.m. and 5 p.m. were the times that micromobility options were faster than available ride hailing options [50]. Bai and Jiao (2020) conducted a comparative analysis between e-scooter usage pattern in Austin, TX, USA and Minneapolis, MN, USA. They found that e-scooter usage happened mostly on weekends and peaked on Saturdays in Austin. Whereas in Minneapolis, evening rides had the highest proportion of the usage. Furthermore, the lowest ridership in Austin belonged to nights while in Minneapolis, the lowest ridership was in the morning [51].
Noland (2019) modeled the impact of temporal variables on e-scooter trips considering daily trips, average daily distance, and average daily speed as dependent variables. The study results showed a significantly higher number of trips on Saturdays, higher average trip distances, and lower average speed on Saturdays and Sundays. Rain and snow decreased the number of trips, rain reduced the distance of trips, and higher temperature was correlated with longer distances and faster speeds [52]. Mathew et al. (2019) used a negative binomial model to explore the impact of weather on e-scooter trips in Indianapolis, IN, USA. They found a negative association between e-scooter trips and snowfall, rainfall, visibility, wind speed, and freezing temperature. During winter, e-scooter trips reduced by 80% on average, while median distance and duration dropped only slightly. Trips were also more sensitive to snowfall rather than rainfall [53]. In another study in Indianapolis, IN, USA, Liu et al. (2020) captured a 76% decline in the number of trips during wintertime [54]. Zhu et al. (2020) found the peak hour at nighttime, suggesting the finding was due to a decline in the heat in Singapore at night. Furthermore, the impact of rainfall and temperature during different time of the day were studied and the results were not conclusive based on the time and intensity of temperature/rainfall [55].
Younes et al. (2020) conducted a study on e-scooters with seven months of shared e-scooter trip data in Washington, DC, USA, and based on a negative binomial model, found that midday trips (i.e., from 12 p.m. to 3 p.m.), holidays and gas price had a positive impact on shared e-scooter trips [56]. According to the elasticity analysis, 1% increase in temperature, humidity, and gas price, increased shared e-scooter trips by 1.12%, 0.39%, and 3.12%, respectively. Additionally, 1% increase in humidity, wind speed, and precipitation reduced e-scooter trips by 0.30%, 0.12%, and −0.01%, respectively [56]. Using ordinary least square with hourly median duration as dependent variables, temperature, midday, Saturdays, holidays, and special events significantly increased the hourly median duration of e-scooter trips. Humidity, wind speed, and precipitation decreased the hourly median duration [56]. In a study in Indianapolis, IN, USA, Liu et al. (2020) found a 130% increase in the number of e-scooter trips and a 181% increase in unique e-scooter in service during the Indianapolis 500 race special event as compared with the previous weekend [54]. A study in Singapore, analyzed four weeks of e-scooter trip data and found that the utilization of each e-scooter was 3.15 times per day on average with a 24.12% occurrence in repositioning of vehicles (11.06% for rebalancing and 13.06% for charging) [55]. Li and Axhausen (2021) explored the hourly changes of e-scooter trips before and during the COVID-19 pandemic and the peak hours of normal weekdays were 5 a.m., 12 p.m., 4 p.m. and 9 p.m. With the exception of 4 p.m. which mostly belongs to non-leisure activities, the other three were leisure-related peak hours. There was no clear trend of e-scooter riding during COVID-19 workday and weekend [23]. A summary of the temporal analysis findings is presented in Table 2.

3.1.2. Spatial Analysis

The spatial analysis includes a range of spatial scales and built environment characteristics. Bai and Jiao (2020) investigated the scooter ridership among 886,000 e-scooter trips in two cities of Austin, TX, USA and Minneapolis, MN, USA. The results showed that proximity to the city center and better access to public transit were positively correlated with higher e-scooter ridership in both cities [51]. Zou et al. (2020) analyzed five weeks of e-scooter trips in Washington, DC, USA, and found more than 70% of trips happened on streets with annual average daily traffic between 4000 and 20,000. Moreover, they found a positive association between bicycle facilities and the number of e-scooter trips, specially at nighttime. E-scooter riders depended more on bicycle infrastructure (such as cycle lanes) at nighttime [47]. Jiao and Bai (2020) employed six months of e-scooter trip data from Austin, TX, USA, and found distance to CBD and distance to public transit had negative impacts on the number of shared e-scooter trips [46]. Hosseinzadeh et al. (2021) examined 16 months of e-scooter trip data from Louisville, KY, USA. They applied a generalized additive model and found walk score and bike score positively impacted TAZ level e-scooter ridership density [45]. Reck et al. (2020) found a negative association between elevation and e-scooter trips. Moreover e-scooters were used mostly in even terrain areas (median 0.20, s.d. 16.7) [48].
A sizable portion of e-scooter related studies focused on different land uses and their impact on e-scooter trips. Caspi et al. (2020) conducted a spatial Durbin analysis of seven months of e-scooter trips data in Austin, TX, USA and found a positive association of e-scooter trips with residential, commercial, educational, and industrial land uses, while commercial and industrial land uses had the highest impact. They also implemented a geographically weighted regression (GWR) to assess local coefficients; for instance, they found residential land use was significant in downtown but not around the University of Texas campus and surroundings [57]. Hosseinzadeh et al. (2021) found a positive association between commercial land use, and negative association between industrial land use, in TAZ level e-scooter ridership density [45]. Li and Axhausen (2021) investigated changes in mircomobility activity characteristics before and during the COVID-19 pandemic. They analyzed 1818 e-scooter trips before and 1003 e-scooter trips during COVID-19 in Zurich, Switzerland. The results showed the highest increase in trip origins during the pandemic were for education (48%) and home (25%). The greatest decline in trip origins were for leisure activities (−19%) and shopping (−12%). The same measure for surges in destinations were for education (35%) and work (21%) and the highest decline was for parks (−28%) [23]. McKenzie (2019) analyzed the origin and destination of trips and found that 60% of shared e-scooter trips started and ended in similar land uses. Trips from public/recreational to public/recreational land uses had the highest frequency (28.2%) among the other land uses (i.e., residential and commercial) [43]. Jiao and Bai (2020) found urban environment variables such as the number of four-way intersections, land use mix (entropy index), commercial area, mixed-use area, educational land use, and parks had positive impacts and the number of cul-de-sacs had a negative impact on number of shared e-scooter trips [46]. Bai and Jiao (2020) concluded that greater land-use diversity, and office and public service land uses were positively associated with higher e-scooter ridership in both cities of Austin, TX, USA and Minneapolis, MN, USA [51]. A summary of spatial analysis findings is presented in Table 3.

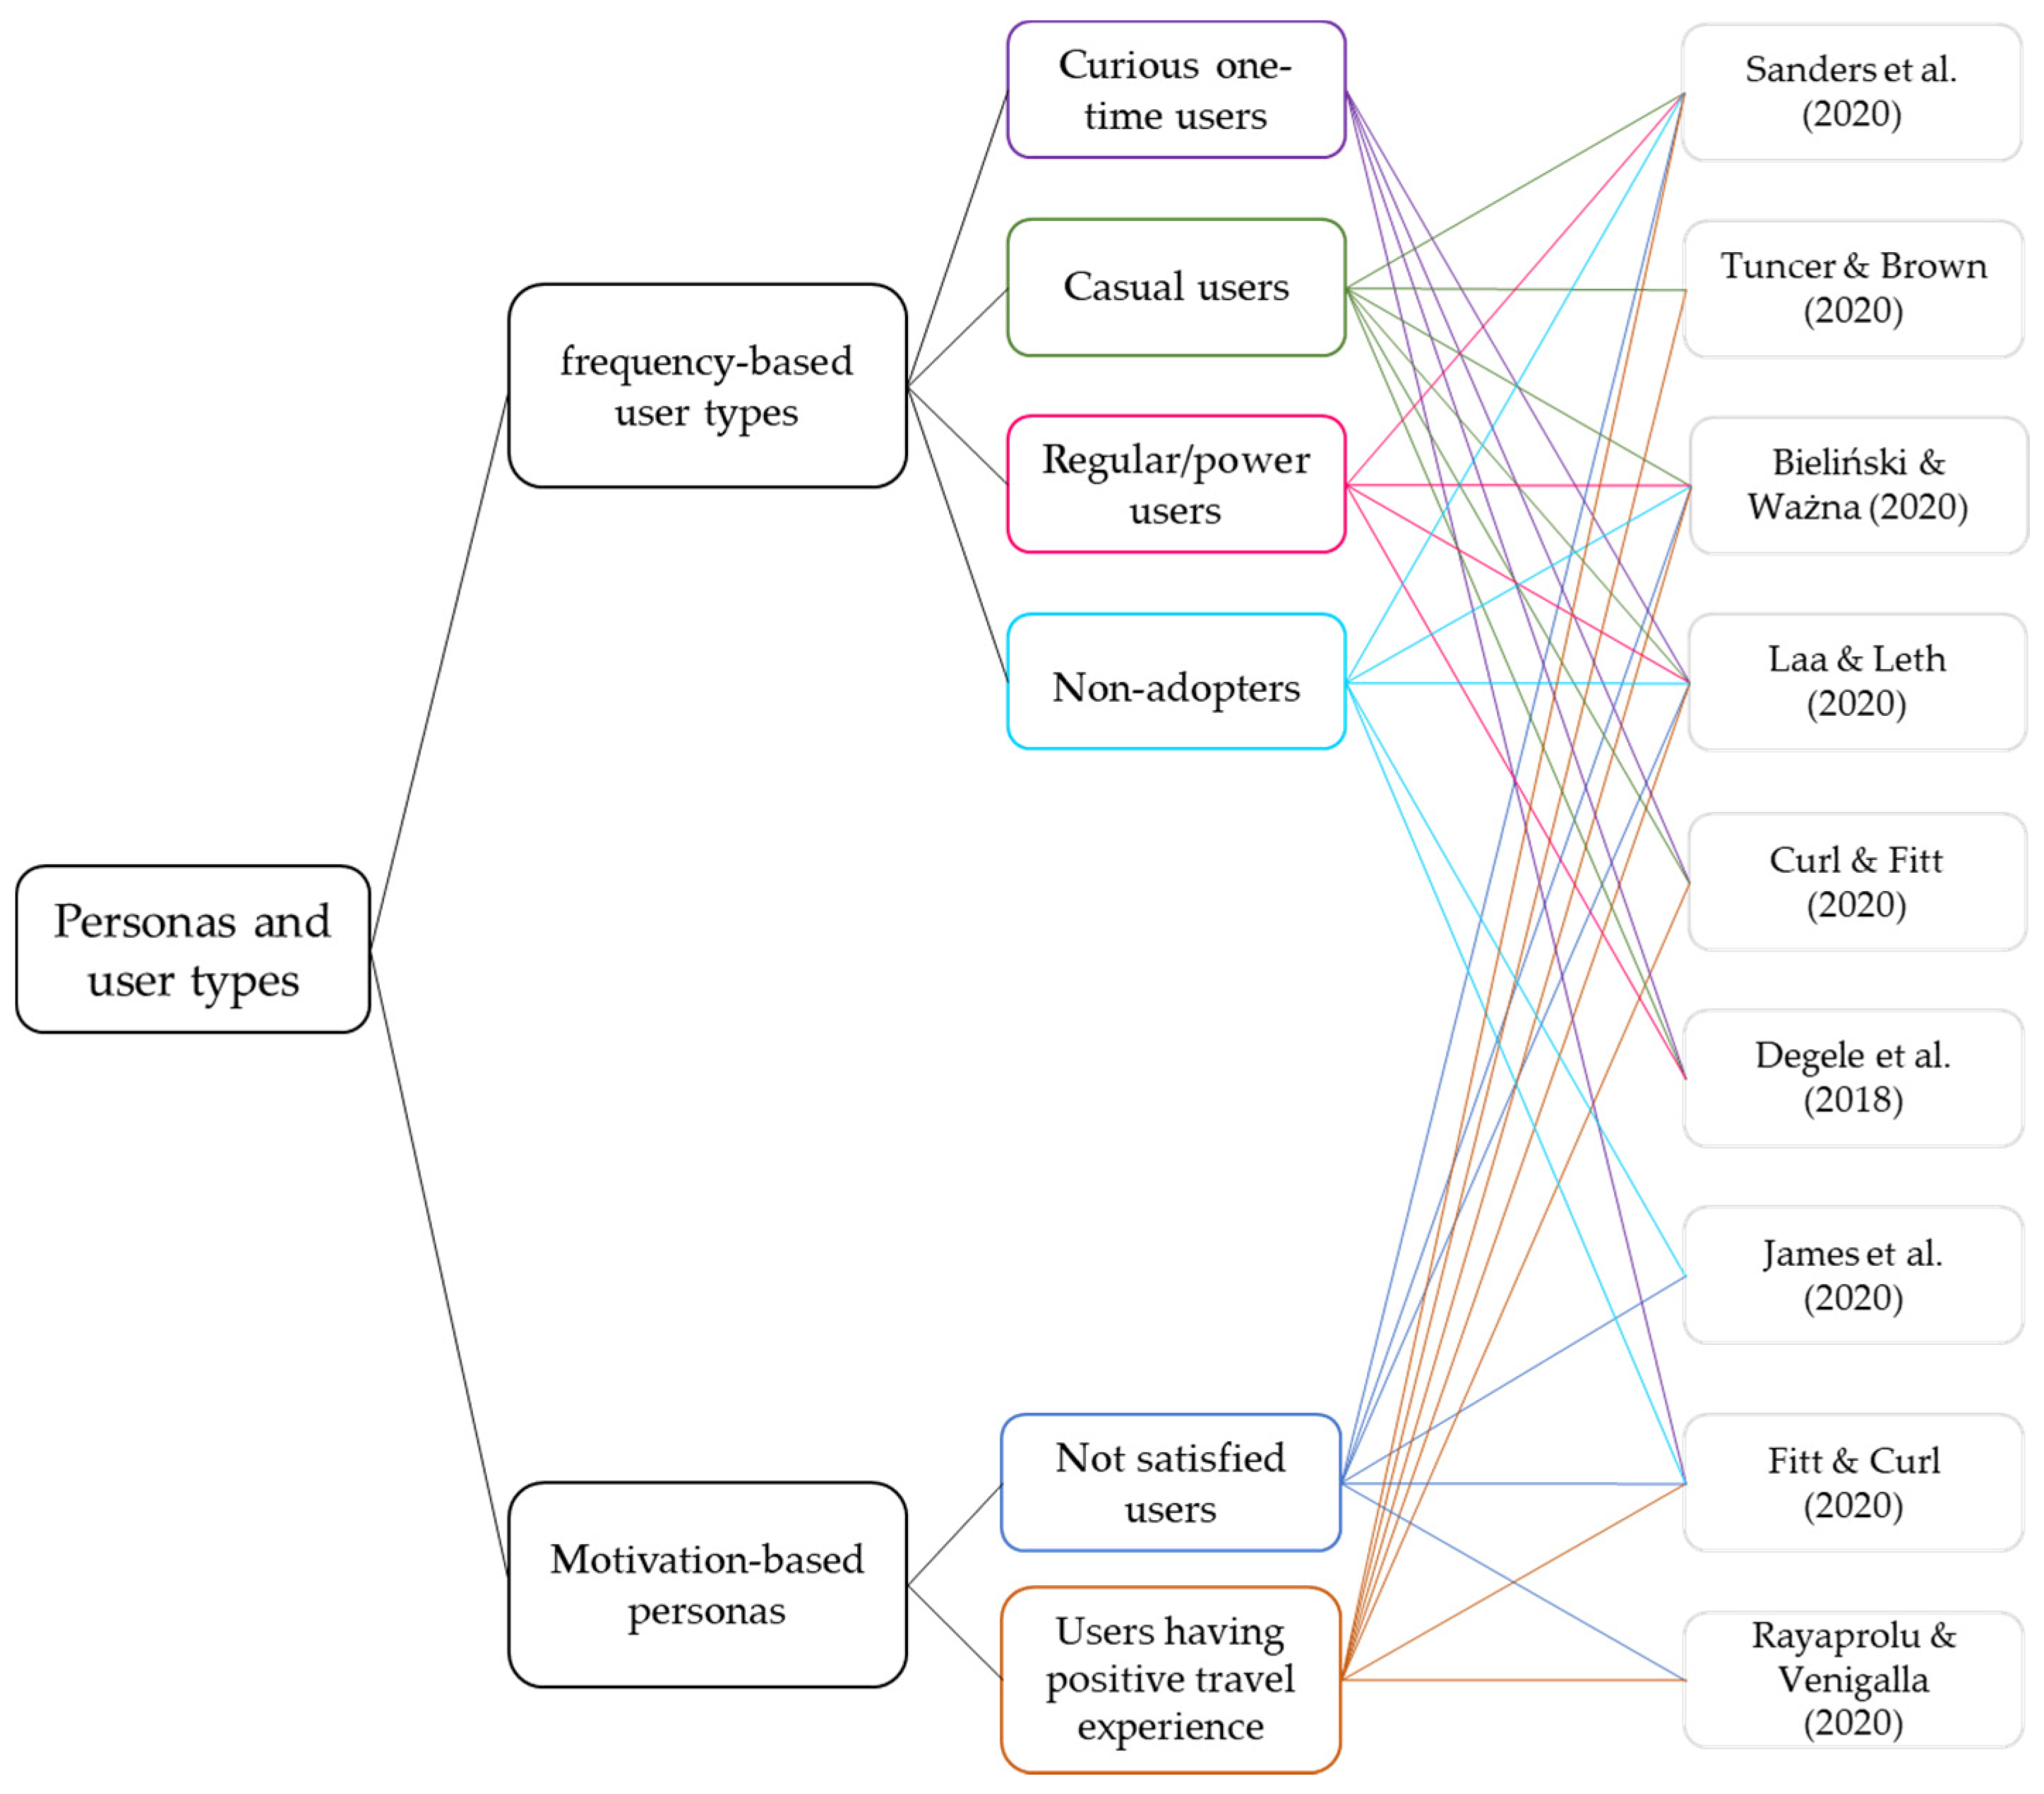
3.2. Synthesis of E-Scooter User Personas and User Types

This aspect of the review resulted in four user types and two personas based on two major characteristics: (a) frequency of usage and (b) motivation for selecting e-scooters (Table 4). Figure 3 depicts the classification system for two main user groups, i.e., frequency-based user types and motivation-based personas. Each one of these main groups then contains a set of subtypes, as well as associated papers where these particular features of persona have been identified. The following sections provide further details on each user type and persona.

3.2.1. Usage Frequency-Based User Types

According to the surveys in each paper, we synthesized four user types based on usage frequency. These user types span from very infrequent to very frequent users, but also include non-adopters, as people who have not tried an e-scooter or stated they were not willing to try one. Table 4 summarizes the usage frequency in the reviewed papers. The deployment date of shared e-scooters and the date of data collection is summarized in Table 5. Moreover, the demography of respondents is presented in Table 6.

Curious One-Time Users

As e-scooters were deployed in urban areas, many users rode one to just try it out and experience its usage. We synthesized “curious users” user type properties from the following four reviewed papers.
Fitt and Curl (2020) investigated shared e-scooter usage and people’s perceptions toward that in New Zealand [58]. The appearance of shared e-scooter usage in New Zealand was in late 2018 and early 2019 and the survey was in February and March 2019. Therefore, it is only normal and expected that a wide majority of individuals in this study were just trying out e-scooters (64%) [58]. Furthermore, the demographics of users who tried e-scooters are mostly young, educated, and wealthy. They might be excited by new technology and curious about e-scooters. Sometimes users were encouraged by their friends, colleagues, or family to try an e-scooter (17%) [58]. In another study by Curl and Fitt (2020), 16.9% out of 341 e-scooter trips were only one time usage [59]. Laa and Leth (2020) found that out of 110 shared e-scooter users in their study, 23.6% (26 individuals) were just trying out the e-scooter [60]. Degele et al. (2018) found that 13.72% of users used shared e-scooters only once and mostly on weekends. However, their ride was longer as compared with other groups. The average age of this group was 35 years old [13].

Casual Users

The properties of the “casual user” were synthesized from six papers. Tuncer and Brown (2020) asked e-scooter users about their usage pattern. Most of them stated that, rental e-scooter usage is opportunistic. As stated in this research, when a person sees an e-scooter, he or she may decide to use it [61]. Similarly, Curl and Fitt stated that 52.5% of 341 e-scooter users in their study used them on more than one occasion [59]. Laa and Leth (2020) found that 27.3% of the shared e-scooter users used an e-scooter several times per month and only 4.5% of them used them several times per week. These two groups count as casual users [60]. According to Bieliński and Ważna (2020), 7.3% of the respondents used e-scooters a few times per year (47 individuals) [62].
In Degele et al.’s study, 81.87% of e-scooter users were casual users, which could be inferred that they used it mainly for leisure purposes as the renting accrued very irregularly and mostly on weekends. They separated this type of user into two clusters, namely “casual users GenX+” and “casual users GenY”. The average age of GenX+ was 48, and each costumer rented around 7 times in 181 days on average. The average time between rides was 25 days. This group produced 16.17% of the revenue of the company. The average age of GenY was 28, and each customer rented around 9 times in 181 days on average. The average time between rides was 19.5 days and they produced 41.19% of the revenue [13]. According to Sanders et al. (2020), 147 individuals (12%) out of 1256 university staff had tried e-scooter at least once but not in the past month. This category was called “past riders” in their study. The other group was called “occasional riders” (195 individuals) who had ridden less than one ride per week in the last month (16%). The percentage of occasional and past riders was about 28% [63].

Regular/Power Users

There is a user type who uses e-scooters on a regular basis. The following four papers were used to synthesize the properties of the “regular/power user” user type. Degele et al. (2020) used clustering methods for e-scooter trip data to categorize the usage pattern of users [13]. A very small percentage of users (4.41%) used shared e-scooter on weekdays, which could be inferred that they used it for commuting or other weekday appointments and activities. On average, the time between rides was 4.6 days, and each user rented around 52 times in 181 days. However, this cluster was very small, while the age parameter was scattered, with the average age being 34 years old. According to this study, despite the small percentage of this group, it produced the highest share of revenue for the e-scooter company (41.46%) [13].
According to Bieliński and Ważna (2020), 0.3% of the respondents used e-scooters on a daily basis (one or two person out of 633 respondent) [62]. In contrast, no participants in Laa and Leth’s survey stated daily usage of e-scooter. According to Laa and Leth, this usage pattern was expected due to the unreliability and high fee of shared e-scooters [60]. However, based on Sanders et al. (2020), 5% of surveyed individuals (63 users) were counted as regular users who had ridden an e-scooters at least once per week in the last month [63].

Non-Adopters

There is a group of people in a society who are not immediately willing to try new transportation options. This group also is an important user type whose behavior needs to be understood. We synthesize the properties of the “non-adopter” user type from the following five papers. According to James et al. (2019), 62% of the respondents in their survey in April 2019 in Arlington, USA had never tried e-scooters even though e-scooters emerged in the USA in 2017 [20]. According to Fitt and Curl (2020), their survey had 341 users (69%) and 150 non-users (31%) out of 491 surveyed individuals [58]. E-scooters emerged in late 2018 in New Zealand and the survey was conducted in February 2019 (Table 5). Thus, even after about six months of e-scooter appearance in the country, 31% of people were not interested in trying e-scooters. Bieliński and Ważna (2020) found that 23.1% of e-scooter non-users did not need to, or want to, try riding an e-scooter in Tricity, Poland. Furthermore, 12.2% of them had never tried an e-scooter nor they did want to learn [62]. In Laa and Leth’s study, in Vienna, 22 out of 188 respondents had not tried an e-scooter (12%) [60]. According to Sanders et al. (2020), among 1256 university staff in their survey, 849 of them (67%) had never tried an e-scooter in Tempe, AZ, USA [63]. Among the respondents, about 46% of them (391 of non-users) were happy with their current transportation option or were not interested in trying an e-scooter. Furthermore, out of 149 past e-scooter riders (ridden an e-scooter, but not in the last month) about 19% of them were not interested in using an e-scooter again (29 persons). This shows that they only tried an e-scooter out of curiosity, and they may never ride it again. Similarly, around 7% of occasional riders and 4% of regular riders (14 and 3 individuals, respectively) were happy with their current transportation mode and not interested in riding an e-scooter. Women were more likely to select barriers related to safety than men, while men selected functionality-related barriers as comparing with that of women [63]. Hispanic/Latino and Black/African American non-riders stated that they had not had a chance to try an e-scooter, but they were interested (26% and 25%, respectively). Non-Hispanic white alone non-riders were the least likely group to have had a chance to ride an e-scooter (11%). Moreover, non-Hispanic white or Asian non-riders were significantly more likely than Black/African American alone and Hispanic/Latino riders alone to not be interested in e-scooters (51% and 47% as compared with 22% and 29%, respectively). People with two or more races (27%) and Asian non-riders (23%) were significantly more concerned about safety than others [63].

3.2.2. Motivation-Based Personas

Users Not Satisfied with Current Mobility Options

This persona subcategory includes users who are not completely satisfied with the current options for transportation modes available in their city. For instance, they are users who are in hurry and avoiding walking to transit stations or avoiding slow public transit travel, they prefer door-to-door access, favor secure modes, better cost-benefit ratio for mobility services, or even prefer dockless over docked micromobility, such as shared bikes. This could be due to different reasons such as having complex daily-activity spaces that current modes cannot cater to, due to different capabilities, such as ability to walk long distances, or due to different travel experience preferences, such as increased safety and security, or lacking previous experiences with micromobility. The following six papers were used to synthesize specific persona properties.
First, Fitt and Curl investigated the major motives for people to ride e-scooters. According to Fitt and Curl, 50% of the respondents were male and the majority of respondents (53%) were 18–34 years old. The largest percentage (22%) of their respondents stated that e-scooters are faster than the other alternatives and 15% said that e-scooters are more convenient than other alternatives. A small percentage of the respondents (7%) also mentioned that e-scooters were cheaper options as compared with other alternatives [58]. Second, based on the results of Laa and Leth (2020), individuals replace low speed modes such as walking and some slow public transit modes such as bus and tramways. The majority of e-scooter users were males, 16–35 years old, full-time employed, and residents of a city. For work or educational trips, respondents always and often (35%) replaced walking with an e-scooter. In addition, for leisure trips, people always and often (28%) substituted walking and bus trips with an e-scooter [60]. Third, Bieliński and Ważna investigated people’s motives and deterrents for e-scooter usage. E-scooter users were mostly men (74.2%), 16–35 years old (67%); 30.4% of the respondents stated that it was used as first-mile and last-mile solutions [62]. Fourth, James et al. (2019) stated that, since the emergence of e-scooter in Arlington, VA, USA, respondents had replaced their mode to e-scooters from Uber, Lyft, or taxi, in 52% of situations followed by 44% in shared bikes, 35% driving, and 28% walking. The e-scooter users were 56% female and 70% of the users were 18–44 years old [20].
Fifth, Sanders et al. conducted a detailed study on e-scooter users in three different categories, namely regular, occasional, and past riders. According to this study, about 92% of regular riders, 81% of occasional riders, and around 66% of past riders rode e-scooters because they were faster than walking [63]. Saving time was an important aspect for them, especially for regular riders. Therefore, they were looking for faster, more convenient travelling with no concerns for parking or congested areas. Moreover, in this study, people, especially women, used e-scooters because they felt safer from crime and traffic while riding an e-scooter. [63]. On the contrary, this study informed us that there were several barriers preventing people from using e-scooters, such as not being able to carry much or traveling together on the same vehicle, not being suitable for longer distances, limited availability nearby, or having functionality errors or low battery. Sixth, Rayaprolu and Venigalla investigated motivations and mode-choice behavior of micromobility users in Washington, DC, USA. Young males were the major e-scooter user (71% male and 63% young users). A trip purpose analysis of shared micromobility users showed that in 29.6% of the situations, e-scooters were used for first-mile and last-mile trips. This aligns with one of the major motives to use an e-scooter which is to save time (51%). Moreover, in 39% of the situations, the respondents found that an e-scooter was easy to use and hassle free [64]. Finally, this study also informed us that the decision to use a shared dockless e-scooter was related to their previous experience with a docked bike sharing system, such as in the case of Capital Bikeshare. To sum up, the major sociodemographic characteristic of this persona is young males, with mostly full-time employment, who use an e-scooter as an alternative because they are not completely satisfied with the current transportation modes.

Users Having a Positive Travel Experience

There is a user persona that mostly sees an e-scooter as a mode to ride and have fun. They are mostly men and young, students, or highly educated employees. The e-scooter usage is often for leisure, associated with the feeling of freedom. The demographics of these respondents is presented in Table 4. The following seven papers were used to synthesize the properties of this persona.
First, Tuncer and Brown (2020) analyzed shared e-scooter experiences of 20 users or potential users to investigate their demographics, intentions, major motives and deterrents, trip purpose, and mode substitution. The respondents were mostly men (90%) and 60% of the total respondents were younger than 35 years old and mostly residents of that city. According to their study, 90% of the respondents were men. Moreover, 55% of the sample were 25–35 years old and 80% of respondents were non-tourists [61]. Their major motive for using shared e-scooters was to have fun and they enjoy the feeling of freedom while riding an e-scooter. The continuous and quick movements gave users an opportunity to discover the city and could be pleasant for both tourists and citizens. Their respondents also found it very convenient, since they did not sweat while riding an e-scooter and they could wear their office clothes [61]. The conclusion from Tuncer and Brown (2020) was that e-scooters were not used for commuting purposes because of the unpredictability and lack of reliability of shared e-scooters and not being able to plan usage in advance.
Fitt and Curl (2020) also investigated e-scooter emergence and usage in New Zealand. They surveyed 491 respondents and 341 (69%) reported using an e-scooter at least one time [58]. As presented in Table 4, the respondents were mostly young (18–34 years old), highly educated, with a high income. The dominant demographics of e-scooter users also aligned with findings from the same authors in another study [59]. According to one of the questions in the survey, respondents mentioned that the potential users were young people, students, tourists, and sometimes commuters and businesspeople. A majority (55%) of the users used an e-scooter for having fun. In addition, users found e-scooters to be a low-cost mode, at least as compared with buying one, and easy to access.
Bieliński and Ważna (2020) studied the travel behavior difference between users of e-bike sharing and e-scooter sharing in Tricity, Poland. According to their study, the percentage of e-scooters was significantly lower than e-bike users. Similar to other studies, 51.8% of users rode e-scooters just to have fun, which was the most common reason for usage [62]. However, both e-scooter users and non-users found them expensive with some safety concerns. In addition, e-scooter users also mentioned unreliability issues of dockless shared e-scooters due to the e-scooters not always being available or at a convenient location [62].
According to Laa and Leth (2020) study, there were 92 fun trips out of 166 shared e-scooter trips (55%) with the major demography of young males [60]. Furthermore, about 18% of these trips would have not been taken if the e-scooter was not available [60]. Sanders et al. (2020) had a survey of 1256 respondents in Tempe, Arizona and from these respondents, 32% of them counted as e-scooter users. About 60% of regular riders, 61% of occasional riders and 47% of past riders would ride an e-scooter just to have fun and relax (Table 4). The demography of occasional users is mostly women, aged 25–34 years old, with a main mode of their transportation as personal vehicle (75%), while regular users are mostly men, aged 25–34 years old, with a main mode of their transportation as personal vehicle (49%). Moreover, occasional riders are more likely to be aware of benefits compared to past riders since past riders may not have ridden e-scooter long enough to be aware of all the benefits [63]. Lastly, Rayaprolu and Venigalla (2020) investigated respondents’ motives for using an e-scooter in Washington, DC, USA. They found that 59% of respondents used an e-scooter for having fun. Furthermore, the trip purpose distribution of shared micromobility users demonstrated that e-scooters were used for socializing purposes in 44.8% of the situations [64]. To sum up, somewhat similarly to the persona above, the majority of users are young males, who have a positive travel experience while riding an e-scooter.

4. Discussion and Conclusions

4.1. Summary of Findings

The ongoing emergence of shared e-scooters has already caused a variety of changes in city landscapes, users’ behaviors, and aggregate mobility patterns. To understand these changes further and develop actions to steer service development towards achieving sustainability goals, there is a need to understand the characteristics of e-scooter trips and users’ behaviors. As previous reviews have not completely address this need, this review study has two novel aims. Firstly, the categorization of temporal and spatial patterns of shared e-scooter usage was analyzed. The analysis of temporal patterns highlights that many cities see usage peaking in the middle of the day or in the evening, as well as during weekends. Moreover, the spatial distribution of trips is focused on recreational and educational land use, as well as areas in the city centers. Secondly, our aim was to provide a deeper understanding of e-scooter users’ behaviors by utilizing the concepts from design research. The synthesis of findings from previous research resulted in six categories which were based on the usage frequency and motivation for riding e-scooters. A summary of the findings is depicted in Figure 4.
In addition to these findings from the review, we can see a great potential of shared e-scooters to change the mobility behavior of some people. However, the factors explaining mobility patterns and users’ profiles varied in the reviewed literature. Such variation highlights a multiplicity of mechanisms for mobility behavior changes and, ultimately, lifestyle changes. Despite the impression that this mobility service has emerged quite rapidly around the world, we can see that only small groups of people were immediately interested in using it regularly. With the large majority of people, the lesson is that mobility behavior change takes some time to happen, especially due to the habitual nature of our everyday mobility decisions. For example, most of the e-scooter usage frequency belongs to one-time users and casual users with 13–65% [13,58,60] and 27–80%, respectively [13,59,60]. On the contrary, the smallest user group is regular users, with a 0–5% of usage proportion [13,60,62,63]. When adopted, we see that e-scooters have become part of these routines when they are able to cater to desired daily activity space [65] by being a faster or more available travel mode than some of the existing alternatives. In addition to fitting into the daily activity space, many users have habituated to e-scooters through the somewhat positive travel experience that they provide, either through embodied movement or through interaction with the surrounding environment, in line with other micromobility and active modes. As in the case of previous research with travel satisfaction [66], first-time positive or negative experiences with e-scooters have played a significant role in the willingness of users to continue interacting with this service.
The systematic nature of this review has also identified a lack of conceptual and methodological clarity. This lack of clarity goes hand in hand with the concept of emerging services which are still changing and are not embedded in society, not just in terms of infrastructure but also in terms of social meanings [67]. One example of this lack of clarity is that some of the literature includes different versions of scooter-like vehicles, without making a distinction in methodology or conceptualization. These vehicles range from both shared and private e-scooter usage [60] to using the term scooter for motorcycle-like vehicles that are steered while sitting down, i.e., moped e-scooter [68]. These fluid interpretations of technology can also be observed with various definitions of regular users in the different literature. For instance, Degele et al. (2020) categorized power users as those who rode a shared e-scooter every 4 to 5 days [13], while Bieliński and Ważna (2020) only counted daily users as power users [62]. In contrast, Sanders et al. (2020) defined regular users as those who had ridden an e-scooter at least once per week in the last month [63]. Moreover, the literature does not always distinguish between users who are not willing to use e-scooters and those who do not have the opportunity to find e-scooters within their regular daily activity space. However, the positive side of this interpretative flexibility is that the research topics also allow for more unconventional methods to be deployed in understanding user practices, such as video recording and ethnomethodology [69].

4.2. Limitations and Future Research Directions

Turning towards limitations of the implemented methodology, we must underline that the application of conventional principles of categorization, as used here to analyze spatio-temporal patterns, has had to overcome the above interpretative flexibility of e-scooter technology. However, those challenges have not been as great as in the case of developing synthesis-based categorization, especially user personas. The field of mobility studies lacks cases where qualitative design methods have been successfully applied for studying emerging mobility technologies. Thus, this research provides novelty by applying persona principles to the systematic review methodology. The application of persona concept has actually helped in discovering a fundamental challenge in the existing literature. That challenge revolves around the lack of sufficient details of the user perspective, such as clearly explaining the connection between sociodemographic and usage data. In our results, there might be overlap between user types and personas. However, we have to bear in mind that despite the lack of clear and solid boundaries between current categories, the discussion about possible and desirable urban mobility futures does not stop by simply having those categories created. Usage and user categorization, be it based on user types, personas, clusters or segments, is meant to be the beginning of a discussion, expect the process would happen on a more human scale [70] than if we would simply focus on aggregate spatio-temporal patterns. In addition, the sample size for this review had to be limited to the end of 2020, in order to allow sufficient time for review. As such, the research sample has mostly included publications from the USA, which has inevitably affected the results. For example, there could be a number of unobserved behavioral parameters and implications from e-scooter usage.
Having in mind potential future research directions, deploying personas is in line with a recommendation that transport studies should move away from conventional static representations of both mobility patterns and user profiles. This recommendation is especially relevant in the context of emerging mobility services which change over time as the society around them also changes, as opposed to more stabilized modes, such as public transit. In order to further interpret change and assign causality, we need to move forward on several fronts. One, we need to continue to deploy novel methodologies that are capable of a longitudinal and context-dependent analysis that could help with identifying different underlying behavioral reasons and processes. Two, for the development of these methods, we need to deepen our conceptualization of what is to be a human on the move in a city, away from traditional assumptions around the homo economicus model of behavior [70,71]. Finally, we need to identify various other perspectives for explaining travel behavior, such as understanding if and how user profiles change over time. Here, aspects of social norms and signaling must be further considered. For example, we need a further understanding of the relationship between conflicts among walking, cycling, and e-scooter usage; degradation of the public sense of place; and also cultural norms around physical activity. Although previous studies in the literature have lacked an analysis of individual user profiles over time, we hope that further reliance on interdisciplinary methods, such as design studies, would help provide some fruitful pathways for methodological development.

4.3. Implications for Steering Mobility Service Development

In addition to implications for future research, this review provides some useful points for steering mobility service development and deployment in line with sustainability transition [24]. More specifically, as already identified in the literature, a transition to sustainable urban mobility systems will have to relate to shifts in the modes of traveling we are using [72]. Thus, the development and deployment of shared e-scooter mobility services needs to be strongly aligned with that overarching goal. Currently, we still do not know if shared e-scooters are actually helping individual cities transition out of their system of automobility. Thus, we cannot assume a default positive perspective about the implications from this emerging technology. Simultaneously, we have to account for the fact that revenue related to e-scooter usage is an important factor for most private sector companies developing and deploying this service. What we know from this review is that, although companies try their best to motivate people to use e-scooters with different campaigns or service design parameters, a curious user persona is the least profitable for them [13]. From the company perspective, ideally, positive first-time experiences can be a pathway for users becoming casual or power users, which increases service profitability. However, given the complexity of factors related to behavior change and to associated plethora of positive and negative impacts, simply increasing the number of service subscribers and their usage cannot be the main objective.
In conclusion, just as our current transport infrastructure planning should not fail to understand multimodal human behavior, similarly, shared e-scooter services should be developed and deployed as part of an urban multimodal system. This is not just a question of transport policy anymore, but also relates to innovation policy at large. To further develop the understanding of integration and effects between transport and innovation policy, we need further institutionalization of evaluation frameworks for these emerging services. Such evaluation frameworks should be able to account for both systemic and user perspectives, while relying on responsible data sharing between public and private sectors [73]. However, we have to recognize that such data sharing should carefully account for and aim beyond privacy requirements stemming from the General Data Protection Regulation [74]. Thus, hand in hand with evaluation frameworks, emerging mobility services will have to be accompanied by the development of adequate regulation. Ultimately, we hope that this research has shed light on the importance of human scale in our mobility systems and a plethora of challenges lying ahead of the emergence of shared e-scooter technology. Having future discussions about emerging urban mobility technologies at a human scale has the potential to increase empathy for the users, but most likely also among the actors in public-private sector stakeholder networks. Regardless of the complex challenges and uncertainties, nurturing a culture of systemic empathy might be an inevitable ingredient for successful transition management processes lying ahead our mobility commons.

Author Contributions

Conceptualization, S.D. and M.N.M.; Methodology, S.D. and M.N.M.; Validation, R.K. and A.H.; Formal Analysis, S.D. and A.H.; Writing—Original Draft Preparation, S.D. and A.H.; Writing—Review and Editing, M.N.M. and R.K.; Visualization, S.D and A.H.; Supervision, M.N.M. and R.K.; Funding Acquisition, M.N.M. All authors have read and agreed to the published version of the manuscript.

Funding

This research was partially funded by the FinEst Twins Center of Excellence (H2020 European Union funding for Research & Innovation grant 856602).

Institutional Review Board Statement

Not applicable.

Informed Consent Statement

Not applicable.

Data Availability Statement

Not applicable.

Conflicts of Interest

The authors declare no conflict of interest.

References

  1. Roukouni, A.; de Almeida Correia, H.G. Evaluation methods for the impacts of shared mobility: Classification and critical review. Sustainability 2020, 12, 504. [Google Scholar] [CrossRef]
  2. Campisi, T.; Basbas, S.; Skoufas, A.; Tesoriere, G.; Ticali, D. Socio-Eco-Friendly Performance of E-Scooters in Palermo: Preliminary Statistical Results. In Proceedings of the 11th International Conference on Innovation in Urban and Regional Planning, Catania, Italy, 8–10 September 2021; Springer: Cham, Switzerland, 2021; pp. 643–653. [Google Scholar]
  3. Nikiforiadis, A.; Paschalidis, E.; Stamatiadis, N.; Raptopoulou, A.; Kostareli, A.; Basbas, S. Analysis of attitudes and engagement of shared e-scooter users. Transp. Res. Part D Transp. Environ. 2021, 94, 102790. [Google Scholar] [CrossRef]
  4. Hosseinzadeh, A.; Algomaiah, M.; Kluger, R.; Li, Z. Spatial analysis of shared e-scooter trips. J. Transp. Geogr. 2021, 92, 103016. [Google Scholar] [CrossRef]
  5. Warnick, A. Shareable Scooters Offer Risks, Benefits for Transportation. Am. J. Public Health 2019, 109, 1479. [Google Scholar]
  6. Moreau, H.; De Jamblinne De Meux, L.; Zeller, V.; D’Ans, P.; Ruwet, C.; Achten, W.M.J. Dockless e-scooter: A green solution for mobility? Comparative case study between dockless e-scooters, displaced transport, and personal e-scooters. Sustainability 2020, 12, 1803. [Google Scholar] [CrossRef] [Green Version]
  7. Clewlow, R. The Micro-Mobility Revolution: The introduction and adoption of electric scooters in the United States. In Proceedings of the Transportation Research Board (TRB) Annual Meeting, Washington, DC, USA, 13–17 January 2019. [Google Scholar]
  8. Chang, A.Y.; Miranda-Moreno, L.; Clewlow, R.; Sun, L. TREND OR FAD? Deciphering the Enablers of Micromobility in the U.S.; A Report of SAE International; SAE International: Pittsburgh, PA, USA, 2019. [Google Scholar]
  9. Hu, J.S.; Lu, F.; Zhu, C.; Cheng, C.Y.; Chen, S.L.; Ren, T.J.; Mi, C.C. Hybrid Energy Storage System of an Electric Scooter Based on Wireless Power Transfer. IEEE Trans. Ind. Inform. 2018, 14, 4169–4178. [Google Scholar] [CrossRef]
  10. Chen, Y.W.; Cheng, C.Y.; Li, S.F.; Yu, C.H. Location optimization for multiple types of charging stations for electric scooters. Appl. Soft Comput. J. 2018, 67, 519–528. [Google Scholar] [CrossRef]
  11. De Bortoli, A.; Christoforou, Z. Consequential LCA for territorial and multimodal transportation policies: Method and application to the free-floating e-scooter disruption in Paris. J. Clean. Prod. 2020, 273, 122898. [Google Scholar] [CrossRef]
  12. Garman, C.; Como, S.G.; Campbell, I.C.; Wishart, J.; O’Brien, K.; McLean, S. Micro-Mobility Vehicle Dynamics and Rider Kinematics during Electric Scooter Riding; SAE Technical Paper 2020-01-0935; SAE International: Pittsburgh, PA, USA, 2020. [Google Scholar] [CrossRef]
  13. Degele, J.; Gorr, A.; Haas, K.; Kormann, D.; Krauss, S.; Lipinski, P.; Tenbih, M.; Koppenhoefer, C.; Fauser, J.; Hertweck, D. Identifying E-Scooter Sharing Customer Segments Using Clustering. In Proceedings of the 2018 International Conference on Engineering, Technology and Innovation, ICE/ITMC, Stuttgart, Germany, 17–20 June 2018; Institute of Electrical and Electronics Engineers Inc.: Piscataway, NJ, USA, 2018. [Google Scholar]
  14. Popov, A.I.; Ravi, Y. Conceptualization of Service Loyalty in Access-Based Services in Micromobility: A Case of E-Scooter Sharing Services. Master’s Thesis, Faculty of Arts and Sciences, Linköping University, Linkoping, Sweden, 2020. [Google Scholar]
  15. Nocerino, R.; Colorni, A.; Lia, F.; Luè, A. E-bikes and E-scooters for Smart Logistics: Environmental and Economic Sustainability in Pro-E-bike Italian Pilots. Transp. Res. Procedia 2016, 14, 2362–2371. [Google Scholar] [CrossRef] [Green Version]
  16. Zagorskas, J.; Burinskiene, M. Challenges caused by increased use of E-powered personal mobility vehicles in European cities. Sustainability 2020, 12, 273. [Google Scholar] [CrossRef] [Green Version]
  17. Gibson, H.; Curl, A.; Thompson, L. Blurred boundaries: E-scooter riders’ and pedestrians’ experiences of sharing space. Mobilities 2021, 1–16. [Google Scholar] [CrossRef]
  18. Sikka, N.; Vila, C.; Stratton, M.; Ghassemi, M.; Pourmand, A. Sharing the sidewalk: A case of E-scooter related pedestrian injury. Am. J. Emerg. Med. 2019, 37, 1807.e5–1807.e7. [Google Scholar] [CrossRef] [PubMed]
  19. Smith, C.S.; Schwieterman, P.J. E-Scooter Scenarios: Evaluating the Potential Mobility Benefits of Shared Dockless Scooters in Chicago; Chaddick Institute Policy Series; DePaul University: Chicago, IL, USA, 2018. [Google Scholar]
  20. James, O.; Swiderski, J.I.; Hicks, J.; Teoman, D.; Buehler, R. Pedestrians and e-scooters: An initial look at e-scooter parking and perceptions by riders and non-riders. Sustainability 2019, 11, 5591. [Google Scholar] [CrossRef] [Green Version]
  21. Moran, M.E.; Laa, B.; Emberger, G. Six scooter operators, six maps: Spatial coverage and regulation of micromobility in Vienna, Austria. Case Stud. Transp. Policy 2020, 8, 658–671. [Google Scholar] [CrossRef]
  22. Lavoie-Gagne, O.; Siow, M.; Harkin, W.; Flores, A.R.; Girard, P.J.; Schwartz, A.K.; Kent, W.T. Characterization of electric scooter injuries over 27 months at an urban level 1 trauma center. Am. J. Emerg. Med. 2021, 45, 129–136. [Google Scholar] [CrossRef] [PubMed]
  23. Li, A.; Axhausen, K.W. Understanding the variations of micro-mobility behavior before and during COVID-19 pandemic period in Switzerland. In Proceedings of the Transportation Research Board 100th Annual Meeting, Virtual Conference, 21–29 January 2021. [Google Scholar]
  24. Geels, F.W.; Sovacool, B.K.; Schwanen, T.; Sorrell, S. Sociotechnical transitions for deep decarbonization. Science 2017, 357, 1242–1244. [Google Scholar] [CrossRef]
  25. O’hern, S.; Estgfaeller, N. A scientometric review of powered micromobility. Sustainability 2020, 12, 9505. [Google Scholar] [CrossRef]
  26. Abduljabbar, R.L.; Liyanage, S.; Dia, H. The role of micro-mobility in shaping sustainable cities: A systematic literature review. Transp. Res. Part D Transp. Environ. 2021, 92, 102734. [Google Scholar] [CrossRef]
  27. Wang, K.; Qian, X.; Circella, G.; Lee, Y.; Malik, J.; Fitch, D.T. What Mobility Modes Do Shared E-Scooters Displace? A Review of Recent Research Findings. In Proceedings of the Transportation Research Board 100th Annual Meeting, Virtual Conference, 21–29 January 2021. [Google Scholar]
  28. Oeschger, G.; Carroll, P.; Caulfield, B. Micromobility and public transport integration: The current state of knowledge. Transp. Res. Part D Transp. Environ. 2020, 89, 102628. [Google Scholar] [CrossRef]
  29. Liao, F.; Correia, G. Electric carsharing and micromobility: A literature review on their usage pattern, demand, and potential impacts. Int. J. Sustain. Transp. 2020, 1–30. [Google Scholar] [CrossRef]
  30. Boglietti, S.; Barabino, B.; Maternini, G. Survey on e-powered micro personal mobility vehicles: Exploring current issues towards future developments. Sustainability 2021, 13, 3692. [Google Scholar] [CrossRef]
  31. Dill, J.; McNeil, N. Are Shared Vehicles Shared by All? A Review of Equity and Vehicle Sharing. J. Plan. Lit. 2021, 36, 5–30. [Google Scholar] [CrossRef]
  32. Riggs, W.; Kawashima, M.; Batstone, D. Exploring best practice for municipal e-scooter policy in the United States. Transp. Res. Part A Policy Pract. 2021, 151, 18–27. [Google Scholar] [CrossRef]
  33. Grant, M.J.; Booth, A. A typology of reviews: An analysis of 14 review types and associated methodologies. Health Info. Libr. J. 2009, 26, 91–108. [Google Scholar] [CrossRef]
  34. Wee, B.V.; Banister, D. How to Write a Literature Review Paper? Transp. Rev. 2016, 36, 278–288. [Google Scholar] [CrossRef] [Green Version]
  35. Transportation Research Board of the National Academies. Literature Searches and Literature Reviews for Transportation Research Projects; Transportation Research Circular E-C194; Transportation Research Board of the National Academies: Washington, DC, USA, 2015. [Google Scholar]
  36. Page, M.J.; McKenzie, J.E.; Bossuyt, P.M.; Boutron, I.; Hoffmann, T.C.; Mulrow, C.D.; Shamseer, L.; Tetzlaff, J.M.; Akl, E.A.; Brennan, S.E.; et al. The PRISMA 2020 statement: An updated guideline for reporting systematic reviews. PLoS Med. 2021, 18, e1003583. [Google Scholar] [CrossRef]
  37. Cavalieri, M.; Cristaudo, R.; Guccio, C. Tales on the dark side of the transport infrastructure provision: A systematic literature review of the determinants of cost overruns. Transp. Rev. 2019, 39, 774–794. [Google Scholar] [CrossRef]
  38. Gadsby, A.; Watkins, K. Instrumented bikes and their use in studies on transportation behaviour, safety, and maintenance. Transp. Rev. 2020, 40, 774–795. [Google Scholar] [CrossRef]
  39. Miaskiewicz, T.; Kozar, K.A. Personas and user-centered design: How can personas benefit product design processes? Des. Stud. 2011, 32, 417–430. [Google Scholar] [CrossRef]
  40. Arian, A.; Meiyu Pan, M.; Chiu, Y.-C. Personas: A Market Segmentation Approach for Transportation Behavior Change. Transp. Res. Rec. J. Transp. Res. Rec. 2021. [Google Scholar] [CrossRef]
  41. Eldeeb, G.; Mohamed, M. Understanding the transit market: A persona-based approach for preferences quantification. Sustainability 2020, 12, 3863. [Google Scholar] [CrossRef]
  42. Magdolen, M.; von Behren, S.; Burger, L.; Chlond, B. Mobility styles and car ownership—Potentials for a sustainable urban transport. Sustainability 2021, 13, 2968. [Google Scholar] [CrossRef]
  43. McKenzie, G. Spatiotemporal comparative analysis of scooter-share and bike-share usage patterns in Washington, D.C. J. Transp. Geogr. 2019, 78, 19–28. [Google Scholar] [CrossRef]
  44. Jijo, M.; Mingmin, L.; Howell, L.; Sonya, S.; Darcy, M.B. Analysis of E-Scooter Trips and Their Temporal Usage Patterns. Inst. Transp. Eng. J. 2019, 89, 44–49. [Google Scholar]
  45. Hosseinzadeh, A.; Algomaiah, M.; Kluger, R.; Li, Z. E-scooters and sustainability: Investigating the relationship between the density of E-scooter trips and characteristics of sustainable urban development. Sustain. Cities Soc. 2021, 66, 102624. [Google Scholar] [CrossRef]
  46. Jiao, J.; Bai, S. Understanding the shared e-scooter travels in Austin, TX. ISPRS Int. J. Geo-Inf. 2020, 9, 135. [Google Scholar] [CrossRef] [Green Version]
  47. Zou, Z.; Younes, H.; Erdoğan, S.; Wu, J. Exploratory Analysis of Real-Time E-Scooter Trip Data in Washington, D.C. Transp. Res. Rec. 2020, 2674, 285–299. [Google Scholar] [CrossRef]
  48. Reck, D.J.; Guidon, S.; Haitao, H.; Axhausen, K.W. Shared micromobility in Zurich, Switzerland: Analysing usage, competition and mode choice. In Proceedings of the 20th Swiss Transport Research Conference (STRC 2020), Virtual Conference, 13–14 May 2020; IVT, ETH: Zurich, Switzerland, 2020; p. 66. [Google Scholar]
  49. Almannaa, M.H.; Ashqar, H.I.; Elhenawy, M.; Masoud, M.; Rakotonirainy, A.; Rakha, H. A comparative analysis of e-scooter and e-bike usage patterns: Findings from the City of Austin, TX. Int. J. Sustain. Transp. 2021, 15, 571–579. [Google Scholar] [CrossRef]
  50. McKenzie, G. Urban mobility in the sharing economy: A spatiotemporal comparison of shared mobility services. Comput. Environ. Urban Syst. 2020, 79, 101418. [Google Scholar] [CrossRef]
  51. Bai, S.; Jiao, J. Dockless E-scooter usage patterns and urban built Environments: A comparison study of Austin, TX, and Minneapolis, MN. Travel Behav. Soc. 2020, 20, 264–272. [Google Scholar] [CrossRef]
  52. Noland, R.B. Trip Patterns and Revenue of Shared E-Scooters in Louisville, Kentucky. Transp. Find. 2019. [Google Scholar] [CrossRef]
  53. Mathew, J.K.; Liu, M.; Bullock, D.M. Impact of Weather on Shared Electric Scooter Utilization. In Proceedings of the 22nd IEEE Intelligent Transportation Systems Conference, ITSC 2019, Auckland, New Zealand, 27–30 October 2019; Institute of Electrical and Electronics Engineers Inc.: Piscataway, NJ, USA, 2019; pp. 4512–4516. [Google Scholar]
  54. Liu, M.; Mathew, J.K.; Horton, D.; Bullock, D.M. Analysis of Recreational and Last Mile E-Scooter Utilization in Different Land Use Regions. In Proceedings of the 32nd IEEE Intelligent Vehicles Symposium, Las Vegas, NV, USA, 19 October–13 November 2020; Institute of Electrical and Electronics Engineers Inc.: Piscataway, NJ, USA, 2020; pp. 1378–1385. [Google Scholar]
  55. Zhu, R.; Zhang, X.; Kondor, D.; Santi, P.; Ratti, C. Understanding spatio-temporal heterogeneity of bike-sharing and scooter-sharing mobility. Comput. Environ. Urban Syst. 2020, 81, 101483. [Google Scholar] [CrossRef]
  56. Younes, H.; Zou, Z.; Wu, J.; Baiocchi, G. Comparing the Temporal Determinants of Dockless Scooter-share and Station-based Bike-share in Washington, D.C. Transp. Res. Part A Policy Pract. 2020, 134, 308–320. [Google Scholar] [CrossRef]
  57. Caspi, O.; Smart, M.J.; Noland, R.B. Spatial associations of dockless shared e-scooter usage. Transp. Res. Part D Transp. Environ. 2020, 86, 102396. [Google Scholar] [CrossRef]
  58. Fitt, H.; Curl, A. The early days of shared micromobility: A social practices approach. J. Transp. Geogr. 2020, 86, 102779. [Google Scholar] [CrossRef]
  59. Curl, A.; Fitt, H. Same same, but different? Cycling and e-scootering in a rapidly changing urban transport landscape. N. Z. Geogr. 2020, 76, 194–206. [Google Scholar] [CrossRef]
  60. Laa, B.; Leth, U. Survey of E-scooter users in Vienna: Who they are and how they ride. J. Transp. Geogr. 2020, 89, 102874. [Google Scholar] [CrossRef]
  61. Tuncer, S.; Brown, B. E-scooters on the Ground: Lessons for Redesigning Urban Micro-Mobility. In Proceedings of the Conference on Human Factors in Computing Systems, Honolulu, HI, USA, 25–30 April 2020; Association for Computing Machinery: New York, NY, USA, 2020. [Google Scholar]
  62. Bieliński, T.; Ważna, A. Electric scooter sharing and bike sharing user behaviour and characteristics. Sustainability 2020, 12, 9640. [Google Scholar] [CrossRef]
  63. Sanders, R.L.; Branion-Calles, M.; Nelson, T.A. To scoot or not to scoot: Findings from a recent survey about the benefits and barriers of using E-scooters for riders and non-riders. Transp. Res. Part A Policy Pract. 2020, 139, 217–227. [Google Scholar] [CrossRef]
  64. Rayaprolu, S.; Venigalla, M. Motivations and Mode-choice Behavior of Micromobility Users in Washington, DC. J. Mod. Mobil. Syst. 2020, 1, 110–118. [Google Scholar] [CrossRef]
  65. Axhausen, K. Activity spaces, biographies, social networks and their welfare gains and externalities: Some hypotheses and empirical results. Mobilities 2007, 2, 15–36. [Google Scholar] [CrossRef] [Green Version]
  66. De Vos, J.; Singleton, P.A.; Gärling, T. From attitude to satisfaction: Introducing the travel mode choice cycle. Transp. Rev. 2021, 1–18. [Google Scholar] [CrossRef]
  67. Mladenović, M.N.; Haavisto, N. Interpretative flexibility and conflicts in the emergence of Mobility as a Service: Finnish public sector actor perspectives. Case Stud. Transp. Policy 2021, 9, 851–859. [Google Scholar] [CrossRef]
  68. Eccarius, T.; Lu, C.C. Adoption intentions for micro-mobility—Insights from electric scooter sharing in Taiwan. Transp. Res. Part D Transp. Environ. 2020, 84, 102327. [Google Scholar] [CrossRef]
  69. Tuncer, S.; Laurier, E.; Brown, B.; Licoppe, C. Notes on the practices and appearances of e-scooter users in public space. J. Transp. Geogr. 2020, 85, 102702. [Google Scholar] [CrossRef]
  70. Mladenović, M.; Toivonen, T.; Willberg, E.; Geurs, K. Transport in Human Scale Cities; Edward Elgar Publishing: Cheltenham, UK, 2021. [Google Scholar]
  71. Mladenović, M.N.; Lehtinen, S.; Soh, E.; Martens, K. Emerging urban mobility technologies through the lens of everyday urban aesthetics: Case of self-driving vehicle. Essays Philos. 2019, 20, 146–170. [Google Scholar] [CrossRef]
  72. Banister, D. The sustainable mobility paradigm. Transp. Policy 2008, 15, 73–80. [Google Scholar] [CrossRef]
  73. Mladenović, M. Data is not the new oil, but could be water or sunlight? From ethical to moral pathways for urban data management. In Proceedings of the International Conference on Computers in Urban Planning and Urban Management (CUPUM), Espoo, Finland, 9–11 June 2021. [Google Scholar]
  74. Cottrill, C.D. MaaS surveillance: Privacy considerations in mobility as a service. Transp. Res. Part A Policy Pract. 2020, 131, 50–57. [Google Scholar] [CrossRef]
Figure 1. Flowchart of sampling papers.
Sustainability 13 11792 g001
Figure 2. Framework of analysis and synthesis for systematic review.
Sustainability 13 11792 g002
Figure 3. Summary of related papers and personas and user types.
Sustainability 13 11792 g003
Figure 4. Summary of analysis and synthesis findings from the systematic review.
Sustainability 13 11792 g004
Table 1. List of the search terms.
Key ConceptsSynonyms/Related Concepts/Variations
E-scooter“E-scooter” OR “electric scooter” OR “scooter” OR “self-balancing scooter” OR “light-weight scooter” OR “electric kick scooter”
Micromobility“Micromobility” OR “micro-mobility” OR “micro mobility” OR “micro-transit”
Sharing“Shared” OR “sharing” OR “public” OR “dockless” OR “shared vehicles” OR “free-floating” OR “rental” OR “rented”
Table 2. Summary of reviewed papers in temporal analysis.
Author(s), YearData IntervalTrip Data Sample SizeStudy AreaMethodDay of WeekTime of DayOther Specific Indices
McKenzie, (2019) [43]132 Days
(13 June–23 October 2018)
937 kWashington, DC, USACosine similarityHighest similarity: Tuesday-Thursday and Saturday-SundayMid-day peak-
Jijo et al. (2019) [44]3-Month
(4 September–
30 November 2018)
425kIndianap-olis, IN, USAExplanatory analysis-Peak hour: 4 p.m. to 8 p.m.-
Hosseinzadeh et al., (2021) [45]16-months
(November 2018–
February 2020)
501 kLouisville, KY, USAGeneralized additive modelPeak time of SaturdaysPeak time from 1 p.m. to 5 p.m.-
Jiao and Bai, (2020) [46]11-Months
(April 2018–
February 2019)
1.74 MAustin, TX, USANegative binomial regressionSaturdaysSaturdays from 1 p.m. to 5 p.m.-
Zou et al., (2020) [47]5-Weeks
(March–April 2019)
113 kWashington, DC, USAExplanatory analysis-Midday and evening peak in principal and minor arterial-
Reck et al., (2020) [48]15 days
(8–23 January 2020)
18 kZurich, SwitzerlandMultinomial logit--Morning peak: negative and night peak: positive
-Higher probability of e-scooters as compared with other micromobility modes at nights and early mornings
-E-scooter used for very short trips (median: 721 m)
-Negative association of distance and e-scooter usage
Almannaa et al. (2020) [49]6-Months
(3 December 2018–20 May 2019)
6 MAustin, TX, USAConsensus clusteringTwo similar clusters:
First, weekends plus Fridays; Second, the rest of the days
-3 a.m. to 12 p.m. (average speed 2.78 m/s, s.d. 1.64);
Rest of the day (average speed 2.19 m/s; s.d. 0.73)
McKenzie (2020) [50]4-Months (December 2018–March 2019)378 kWashington, DC, USAWatson’s U2 and CosSim Faster micromobility options comparing with ride hailing options at 8–9 a.m. and 5 p.m. -
Bai and Jiao (2020) [51]4-Months
(August 2018 – November 2018)
886 kAustin, TX; Minneapolis, MN, USANegative binomial modelWeekends and peaked on Saturdays in AustinLowest rides in nights in Austin;
Peak evening rides and lowest ridership in the morning in Minneapolis
-
Noland, (2019) [52]7-Months
(August 2018–
February 2019)
88 kLouisville, KY, USAOrdinary least squares regressionSaturdays: positive-Holidays: positive
Rain: negative
Snow: negative
Duration (distance): 0
Mathew et al. (2019) [53]6-Months
(4 September 2018–
28 February 2019)
532 kIndianapolis, IN, USANegative binomial model, Explanatory analysis--Temperatures drop below freezing: negative
Visibility: negative
Rain: negative
Snow: negative
Wind speed: negative
Liu et al., (2020)
[54]
8-months
(September 2018–
May 2019)
500 kIndianapolis, IN, USAExplanatory analysis-Broad Ripple fall 2018: 6 p.m. to 9 p.m.
Butler University fall 2018: evening
Downtown Trip fall 2018: 6 p.m. to 9 p.m.
−130% Increase in number of e-scooter trips and 181% in unique e-scooter in service during Indianapolis 500 race special event
-Higher median distance/duration of recreational trips as compared with non-recreational
Zhu et al., (2020) [55] 4-Weeks
(1-28 February 2019)
52 kSingaporeExplanatory analysis, Pearson correlationNot conclusivePeak hours at nightTemperature: not conclusive
Rain: not conclusive
Duration: 0
Younes et al., (2020) [56]7-Months
(December 2018–
June 2019)
727 kWashington, DC, USANegative binomial regressionBase is Sunday,
Saturdays: positive,
The rest of the days: negative
-Holidays: positive
Special events (cherry blossom festival): positive
Temperature: positive
Visibility: positive
Humidity: negative
Gas price: positive
Caspi et al., (2020) [57]7-months
(August 2018–
February 2019)
2 MAustin, TX, USASpatial Lag, Spatial Durbin, and geographically weighted regressionsHigher median trip distance and duration on weekends/holidaysComparing weekends and weekdays hourly trips
Higher number of trips, median trip distance, and duration of evening peaks as compared with morning peaks
-
Li & Axhausen (2021) [23]Normal period (15 February–
14 March 2020) COVID-19 period (15 March–14 April 2020)
1818 k before COVID-19
1003 k during COVID-19
Zurich, SwitzerlandComparison studyPeak times before and during COVID-19Before COVID-19:
5 a.m., 12 p.m., 4 p.m., and 9 p.m. for weekdays
Before COVID-19 for workdays 4 p.m. is the peak hour of non-leisure activities,
Leisure peak hours are 5 a.m., 12 p.m. and 9 p.m.
(-) Not tested; (0) tested but not significant; (positive) positive impact on number of trips; (negative) negative impact on number of trips; (not conclusive).
Table 3. Summary of reviewed papers focused on modeling of spatial and land use impacts on e-scooter usage.
ParametersJiao and Bai (2020)
[46]
Bai and Jiao (2020)
[51]
Caspi et al. (2020) [57]Hosseinzadeh et al. (2021) [45]
Data11 months
(April 2018–
February 2019)
4 months
(August 2018–
November 2018)
7 months
(August 2018–
February 2019)
16 months
(November 2018–
February 2020)
City, countryAustin, TX, USAAustin, TX/Minneapolis, MN, USAAustin, TX, USALouisville, TX, USA
MethodZ-scoreNegative binomialSpatial DurbinGeneralized additive model
Number of trips1740 k886 k2 M501 k
Distance to CBDNegativeNegative0 (origins)/negative (destination)-
Land use mix indexPositiveNot conclusive0 (origins)/0 (destination) 0
Residential land use0-Positive (origins)/positive (destination)0
Commercial land usePositiveNot conclusivePositive (origins)/positive (destination)Positive
Office land use-Positive--
Industrial land use-Not conclusivePositive (origins)/positive (destination)Negative
Institutional/Educational land usePositivePositive0 (origins)/0 (destination)0
Recreational/parks land usePositiveNot conclusive0 (origins)/0 (destination)0
Walk-related scores---Positive
Bicycle-related scores--Positive (origins)/0 (destination)Positive
Transit-related scoresPositive-Positive (origins)/positive (destination)0
Employment density--Positive (origins)/positive (destination)0
Intersection densityPositive-0 (origins)/positive (destination)0
Cul-de-sac densityNegative---
local roads density ---0
Job proximity index---0
Elevation---0
(-) Not tested; (0) tested but not significant; (positive) positive impact on number of trips; (negative) negative impact on number of trips; (not conclusive).
Table 4. Travel behavior of users in reviewed papers.
Author(s), YearTrip PurposeMode SubstitutionMotivesDeterrentsHow Often and WhenOther
Fitt and Curl (2020)
[58]
--Trying it for the first time, 64%
Fun, 55%
Faster than the alternative, 22%
Recommended by others, 17%
Convenient, 15%
Cheaper than the alternative, 7%
Economical as compared with purchasing
Not having the essential material to rent an e-scooter (bank card, smartphone, etc.);
Not being able to check the condition and functionality of e-scooter before riding one
When you see one, you may use it (material availability)Majority of e-scooter users had never used a kick scooter
Curl and Fitt (2020)
[59]
----Once 16.9%
More than one
occasion 52.5%
Those who cycle are more likely to have used an e-scooter than those who do not cycle; Age over 45, with health issues are less likely to use e-scooters
Laa and Leth (2020)
[60]
- **In general, replaces walking followed by other slower PT modes (bus and tramway);
Often or always replace walking in 35% of situations for work or educational trips and almost never replaces car trips (more than 90%);
Never or seldom replaces other modes in shopping trips;
Sometimes or always replaces walking and bus trips in 28% of situations for leisure purposes
Saves time when you are in hurry;
Fast
-Daily basis 0.0%
Several times per week 4.5%
Several times per month 27.3%
Less than once a month 44.5%
Tried it once 23.6%
-
Tuncer and Brown (2020)
[61]
Mostly not for commuting because of the lack of ability to planIf in a hurry: substitutes public transit;
First-mile and last-mile trips: substitutes walking;
New intermodal routes, substituting one slow PT to far but faster PT
Fun, feeling of freedom, continuous movement;
Ease of use, convenient;
Economical as compared with purchasing;
Lack of concern for maintenance;
Maneuverable and hybrid vehicle;
Not sweating;
Riding in style with office clothes;
Saving time
Low charge and functional problems of the vehicle;
Unavailability;
Inaccuracy in map locations;
Inability to find the e-scooter because of bad location or parking;
Unreliability
Mostly opportunistic;
When you see one, you may use it
-
Bieliński and Ważna (2020)
[62]
Fun * 51.8%
Social meetings 33.9%
To (or from) PT stops 30.4%
Eating out 21.4%
Recreational 21.4%
Work, school, or university 17.9%
Shopping 12.5%
-FunHigh fees (31.8% users, 17.7% non-users)
Safety concerns (10.9% users, 16.0% non-users)
No scooter nearby (17.6% users, 11.6% non-users)
Not enough scooters (10.4% users, 4.8% non-users)
Functionality problems (6.8% users, 3.4% non-users)
Daily basis 0.3%
Few times a month 1.3%
Few times a year 7.3%
-
Sanders et al. (2020)
[63]
Fun or leisure * 42%;
Transportation to/from activities 33%;
Transportation to/from work 30%;
Meeting friends or socializing 16%;
Shopping 6%;
Transportation to/from school 6%;
Other 9%
Fun trips: 50% walking, 30% driving, 8% biking
Transportation to/from activities: 51% walking, 35% driving, 10% biking
Transportation to/from work: 62% walking, 19% driving, 10% biking;
Meeting friends or socializing: 45% walking, 41% driving, 6% biking;
Shopping: 42% walking, 42% driving, 15% biking;
Transportation to/from school: 67% walking, 29% driving, 0% biking;
Total: 57% walking, 25% driving, 8% biking
Faster than walking
Convenient
Replacing car trips
For having fun and relaxing
Good option in hot weather
Inexpensive as compared with purchasing;
Environmentally friendly;
Mostly for women, safer from crime and traffic
Worried about hitting someone or being hit, feeling unsteady
Not enough safe place to ride
Cannot carry much
Impractical for longer distances;
Unavailability issues;
Functional errors and uncharged batteries
Non riders, 68%
never ridden an e-scooter
Past riders, 12%
ridden an e-scooter, but not in the last month;
Occasional riders, 16% less than one ride time per week in the last month;
Regular riders, 5%
at least one ride per week in the last month
Participants with young children are mostly concerned about safety
76% of past and current riders and 23% of non-riders are willing to ride e-scooter somewhat or very likely in the future;
56% of those aged 18–34 would like to ride e-scooter next year as compared with 41% of 35–44 years old and 25% of upper 45 years old;
40% of walkers, cyclists and drivers would like to ride e-scooter next year as compared with 51% of PT users
Degele et al. (2018)
[13]
Leisure trips;
Weekday activities such as commuting
-Just to try it out-4.41% Often user (every 4.6 days)
23.63% Monthly user (every 25 days)
58.34% Sometime user (every 19.5 days)
13.72% One-time user
Gender hardly has any influence on usage or e-scooter ride length
Rayaprolu and Venigalla (2020)
[64]
Social purposes 44.8%
First-mile and last-mile trips 29.6%
Work or school 12.8%
Running errands and chores 12.8%
-59% Fun
51% TIME saving
39% Easy to use and hassle free
23% Economical
7% Healthy
4% Safe
Not interested or not viable 34%
Unsafe 23%
Expensive 18%
Traffic or pollution 7%
Time consuming 2%
Uncertainty in the dockless vehicle availability
CaBi members prefer more to use e-scooters occasionally than regularlyE-scooters are popular for 5–15 min trips (low significant);
E-scooter is the least preferred micromobility mode between four options in Washington, DC, USA;
Young people prefer an e-scooter over CaBi and e-bikeshare;
Female and medium-income households prefer CaBi over an e-scooter
James et al. (2019)
[20]
-39%, 52% Uber, Lyft, or a taxi
33%, 28% walked
12%, 44% Personal or shared bike
7% Bus
7%, 35% Drive ***
-As a pedestrian, feeling unsafe around e-scooter (76% very unsafe and unsafe);
As a e-scooter rider, feeling unsafe around e-scooter (24% very unsafe and unsafe);
Pedestrians find e-scooters blocking the sidewalks (75% always and often);
E-scooter users find e-scooters blocking the sidewalks (24% always and often)
--
* Respondents could choose more than one trip purpose; ** trip purpose was not analyzed separately, however, it was classified by mode substitution in each trip purpose which is summarized in “Mode Substitution” column; *** the first number is the likelihood of choosing that mode for the last e-scooter trips and the second number is the travel mode change in general since the e-scooter emerged in the city (multiple choice is allowed for the second one).
Table 5. Travel behavior studies and their relevant data type and methodology.
Author(s), YearCity, CountryDate of Shared
E-Scooter
Deployment
Date of Survey or Data CollectionData Collection MethodData QuantityMethodology
Tuncer and Brown (2020) [61]Paris, France4 months before data collection
(approximately June 2018)
October 2018–January 2019Observation, interview20 Users and 10 informal shop ownersVideo-ethnographic
and interview text coding
Fitt and Curl (2020) [58] *Auckland, Hutt Valley, Christchurch, and Dunedin, New ZealandLate 2018 and early 2019February and March 2019Online survey491 Respondents (341 users and 150 non-users)Descriptive statistics, social practice
logistic regression [59]
Bieliński and Ważna (2020) [62]Tricity, PolandMay 201921 August 2019–
27 September 2019
Computer-assisted personal
interviewing technique (CAPI)
633 RespondentsDescriptive statistics
Laa and Leth (2020) [60]Vienna, Austria-13 August 2019–
7 December 2019
Online survey and field surveys at three cycle paths188 Respondents
(166 e-scooter users and 22 non-users)
Descriptive statistics
Sanders et al. (2020) [63]Tempe, AZ, USA-2 May 2019Online survey in Arizona State University (ASU)1256 University staff (not faculty)
(849 Non-riders and 405 e-scooter riders)
Descriptive statistics and statistical tests
Degele et al. (2018)
[13]
Germany-22 April 2017–
20 October 2017
GPS trip data53,000 Trip dataHierarchical clustering and descriptive statistics
Rayaprolu and Venigalla (2020) [64]Washington, DC, USA-July 2019Mixed-mode survey: paper-based and web-based questionnaire440 Responses (309 respondents who used micromobility at least once)Logistic regression, odds ratio analysis, descriptive statistics, and statistical tests
James et al. (2019) [20]Arlington, VA, USA20174–24 April 2019Online survey and observation181 Survey responses and 606 e-scooter observationsDescriptive statistics
and text analysis
* The results in [58] are as same as those of [59].
Table 6. Demographics of survey respondents in reviewed papers.
Author(s), Year, Sample ****Demography
GenderAgeEducation LevelIncomeOccupation StatusCitizen/TouristOther
Tuncer and Brown (2020) [61]
(e-scooter users)
90% Male
10% Female
5% <25 years
55%: 25–35 years
40% >35 years
---80% Residents
20% Tourists
-
Fitt and Curl (2020) [58] **
(respondents)
50% Male
50% Female
29% 18–24 year
24% 25–34 years
19% 35–44 years
15% 45–54 years
10% 55–64 years
5% 65 years and over
24% School level qualifications;
12% Postschool level qualifications;
27% Bachelor’s degree;
32% Postgraduate qualification
12% From $0 to 19 k
7% From $20 to 30 k
6% From $30 k to $50 k
11% From $50 k to $70 k
18% From $70 k to $100 k
45% From $100 k and over
53% Working full time *
28% Studying full time
-Ethnicity *
European 93%
Maori 7.5%
Other 6%
Car availability:
67% Available
32% Unavailable
Curl and Fitt (2020) [59] **
(e-scooter users)
57% Male
43% Female
30% 18–24 years
26% 25–34 years
19% 35–44 years
14% 45–54 years
8% 55–64 years
3% 65 years and over
25% School level qualifications;
13.4% Postschool level qualifications;
28% Bachelor’s degree;
33.6% Postgraduate qualification
10.5% From $0 to $20 k
5.6% From $20 k to $30 k
4% From $30 k to $50 k
10.5% From $50 k to $70 k
13% From $70 k to $100 k
39% From $100 k and over
17.4% Other or no answer
58% Working full time *
28% Studying full time
-Ethnicity *
European 84%
Maori 7.6%
Other 8.4%
Health Condition:
No health condition 93%
Health condition 7%
Car availability:
69% Available
31% Unavailable
Bieliński and Ważna (2020) [62]
(e-scooter users)
62.5% Male
37.5% Female
Mean 31 years-Median income
3205 PLN~700 €
82.1% Mostly employed
30.4% Student
--
Laa and Leth (2020) [60]
(e-scooter users)
74.2% Male
25.8% Female
(e-scooter users)
20.8% 16–25 years
46.2% 26–35 years
15.4% 36–45 years
17.6% 46 years and over
(respondents)
33.7% High school
64.2% University
-55.5: Employed full time 13.1% Employed part time
29.9% In school/university
1.9% Other
84.4% Residents15.6% Others-
Sanders et al. (2020) [63]
(respondents)
34% Male
62% Female
1% Other
3% No answer
5% 18–24 years
31% 25–34 years
25% 35–44 years
19% 45–54 years
20% 55 years and over
-5% From $0 to $35 k
15% From $35 k to $50 k
22% From $50 k to $75 k
14% From $75 k to $100 k
17% From $100 k to $150 k
10% From $150 k and over
16% No answer
--67% Non-Hispanic white alone;
10% Hispanic/Latino alone;
6% Two or more races;
5% Asian alone;
3% Black/African American alone;
8% Others or no answer;30% Household with young children (under 16 years)
(Degele et al. 2018) [13]
(e-scooter users)
77% Male
23% Female
Late 20s, ~17.5%
45–50 years, ~6.5%
-----
Rayaprolua and Venigalla (2020) [64]
(e-scooter users)
71% Male
28% Female
1% No answer or other
63% Young
33% Middle
3% Old
25% From $0 to $30 k
9% From $30 k to $50 k
14% From $50 k to $75 k
51% From $75 k and over
1% No answer
67% White
30% Person of color
James et al. (2019) [20] ***
(respondents)
56% Female
44% Male
70% 18–44 years-23% From $0 to $50 k
36% From $100 k and over
--69% White
31% Other
* Multiple choice is allowed; ** in [58] the numbers are for all respondents in the survey however, in [59], the numbers are only for e-scooter users; *** the data description has not been reported thoroughly in the paper; **** some papers have provided sociodemographic characteristics for only e-scooter users and others for the whole respondents which has been mentioned in this table.
Publisher’s Note: MDPI stays neutral with regard to jurisdictional claims in published maps and institutional affiliations.

