Article

The Role of Public Transport during the Second COVID-19 Wave in Italy

by
Armando Cartenì
1,*,
Luigi Di Francesco
1,
Ilaria Henke
2,
Teresa Valentina Marino
1 and
Antonella Falanga
1
1
Department of Engineering, University of Campania “Luigi Vanvitelli”, 81031 Caserta, Italy
2
Department of Civil, Architectural and Environmental Engineering, University of Naples “Federico II”, 80125 Napoli, Italy
*
Author to whom correspondence should be addressed.
Sustainability 2021, 13(21), 11905; https://doi.org/10.3390/su132111905
Submission received: 28 September 2021 / Revised: 17 October 2021 / Accepted: 19 October 2021 / Published: 28 October 2021

Abstract

:
Lockdown policies applied worldwide to limit the spread of COVID-19, and mainly based on health considerations, have negatively impacted on public transport (PT) usage, suspected as a means for the virus spreading due to difficulties ensuring social distancing. This resulted not only in a setback to sustainable mobility, but also impacting on equity and social exclusion issues. The paper aimed to cover this topic, investigating the conjecture that the spread of the coronavirus is directly correlated to PT usage. A correlation analysis among the daily number of certified coronavirus cases and the PT trips measured in the day in which the contagions occurred was performed within the second wave in Italy. The appropriateness of the case study is twofold because Italy was one of the main European countries with a high mass contagion and because the vaccination campaign had not yet started in Italy. Estimation results show a high correlation (up to 0.87) between COVID-19 contagion and PT trips performed 22 days before. This threshold indicates that quarantine measures, commonly set at two weeks and based only on incubation considerations, were inadequate as a containment strategy, and may have produced a possible slowdown in identifying new cases and hence, in adopting mitigation policies. A cause–effect test was also implemented, concluding that there is a strong causal link between COVID-19 and PT trips. The main issues discussed in this research cover the transportation and the health filed but also laid the groundwork for ethical considerations concerning the right to mobility and social equity. Obtained results could yield significant insights into the context variables that influence the spread of the virus, also helping appropriate definition of restrictive policies, thereby ensuring a sustainable recovery and development of urban areas in the post-pandemic era.

1. Introduction

In March 2020, the World Health Organization (WHO) declared a global pandemic after an unprecedented health crisis experienced worldwide due to SARS-CoV-2 (coronavirus or COVID-19 for short). Strict lockdown policies were applied worldwide to control the spread of the virus, such that contagion values reached a global minimum during the summer of 2020. After the lockdown, several EU countries lifted restrictive measures to assist summer tourism, allowing open travel in Europe [1]. However, once the first wave appeared to have run its course, starting from the end of August 2020, a second wave hit the world even harder.
Governments have been faced with a number of ethical issues, starting with the best policies to adopt to halt the spread of the virus. Within the general uncertainty regarding the different transmission pathways (e.g., [2,3]), three main ways of transmitting COVID-19 have been recognized: (i) via contact; (ii) via droplets; (iii) airborne transmission. Due to this uncertainty, several policies have been implemented, such as travel restrictions, lockdowns, smart working, and education, aimed at reducing the spread of the virus and lightening the burden on the health systems.
To date, the scientific community has mainly focused its research efforts on health issues. However, attempts have also been made to correlate coronavirus cases to major context variables such as climate, air quality and mobility measures. For example, several studies have noted an inverse correlation between average temperature and/or relative humidity with the spread of coronavirus (e.g., [4,5,6,7,8,9,10,11,12]). Other studies demonstrate a positive correlation between PM airborne concentrations and diffusion of coronavirus (e.g., [1,13,14,15]). Despite implementation of a large number of restrictions, some measures may be more effective than others, also in light of their level of acceptance by the population. Travel restrictions and smart working seem to be particularly useful in limiting the spread of the outbreak (e.g., [16,17]), reducing human mobility and hence, social interactions. As suggested by [1], “the possibility of continuously performing economic activities, even if remotely, provides a specific way to increase urban resilience, also in view of the economic performances”. Physical distancing policies therefore have a key role to play in reducing the spread of the virus (e.g., [18,19]), although such distancing is somewhat challenging in group situations such as those encountered in public transport, schools, and workplaces. Several studies have found a positive association between school closures and COVID-19 incidence, indicating that, despite all the restrictive measures, schools represent high risk places (e.g., [20,21,22]). Another high-risk area consists in PT services. Although measures were taken to reduce the maximum number of people on board vehicles, ensuring that social distancing was respected, and specific hygiene measures were implemented, it is still unclear whether or not the above was sufficient to reduce the risk of transmission [3]. However, although in the first wave, overall mobility (car, pedestrian, bus, metro) saw a considerable decline (exceeding 90%), in the second wave (September–December 2020), it was public transport which was most affected (e.g., [3,23]). Indeed, all the procedures in place to ensure safe public transport and physical distancing make running a COVID-free service particularly hard [24]. This has led to different responses by governments worldwide, such as the suspension of public transport services (e.g., in Wuhan), decreases in service frequency, reduction in vehicle capacity, fare suspension and/or rear-door boarding, and the introduction of mandatory hygiene measures. Such interventions have discouraged the use of public transport in many countries; for example, Budapest has experienced a decline of about 90% in public service use in comparison to pre-pandemic periods [25]. Similar effects have been noted in the Netherlands [26] and Santander (Spain) [27]; regions in Sweden showed a 40–60% decline in mass transit use in the first few months of the pandemic in comparison to the previous year [23]. Thus, in the medium–short term, public transport has faced two major issues: on the one hand, high demand leads to safety problems due to the risk of infection; on the other, low demand makes the service financially unsustainable with, in the worst scenario, a risk of bankruptcy for transport operators [28]. Although some cost reductions may be achieved through operation adjustments (e.g., lowering the service frequency), most operating costs are not demand-dependent (e.g., [28,29]). With lower demand, such costs may not be offset by revenues, making the service no longer financially viable [29].
Alongside financial and safety concerns, this period has posed a major challenge for equity and social inclusion issues. The COVID-19 pandemic has privileged those with higher incomes, who may have alternatives in both transport modes (e.g., availability of one or more private cars) and in reducing/modifying out-of-home activities (e.g., online shopping, smart working). This contrasts starkly with those, generally with lower incomes, who have no alternatives to public transport services and who still need to leave home for primary necessities (e.g., work, purchase of basic necessities) [3]. Indeed, public transport aims to guarantee accessibility to everyone, i.e., the right to mobility, helping those users who are unable or unwilling to walk, cycle or drive a car, who still have to perform necessary out-of-home activities [30,31,32]. Another problem arising from the decline in public transport usage is the threat to sustainable mobility. Indeed, discouraging public transport leads to a shift towards private vehicles [33] which has already been observed in comparison to pre-pandemic times [26]. The role of buses in reducing emissions can thus be questioned: if ridership drops by more than 40%, buses become as polluting as cars (or more so), conferring no environmental benefits [34].
Given the current worldwide emergency and concern about possible COVID-19 waves in the future, the development of advanced techniques to enhance causes and implications, identify risk/impact variables as well as their evaluation and prioritization, and determine appropriate actions/policies to minimize and monitor the impact of the pandemic impacts, becomes ever more crucial and strategic for technicians, researchers and governments (e.g., [35,36,37,38]). This issue is directly related to research topics in both the transportation sector and in health implications/prevention. Indeed, to support decision-making processes in the PT sector proper health and risk assessment and management is needed, also for enhancing the safety of citizens during their daily activities.
Starting from the above considerations, it would appear crucial to investigate whether public transport may have effectively increased the risk of infection during the spread of coronavirus. As stated above, the fear of closed places and the related failure to guarantee physical distancing and ambient sanitation currently discourage use of public transport (in favor of personal mobility, usually private cars), with serious consequences for both sustainable mobility and the livability of urban areas. The proposed research aimed to fill this gap, undertaking an analysis to verify the hypothesis according to which the daily number of certified cases of coronavirus is directly correlated with the quantity of public transport trips measured several days before. To be precise, the conjecture discussed in this paper is that the daily number of certified cases of COVID-19 during the second wave in Italy (from 15 October to 31 December 2020) is directly correlated to the number of public transport trips measured in the day in which the contagion occurred (i.e., several days before). To the authors’ knowledge, this issue has not been investigated elsewhere and could significantly contribute to clarifying the context variables that influence the spread of the virus, also helping to set up appropriate restrictive or mitigation measures for populations in urban areas within a transport and health perspective.
The proposed case study and the time period considered was appropriate for the aim of the research both because Italy was one of the main European countries to experience mass contagion in the second wave and because, within this time period, the vaccination campaign, which could have affected the results, had not yet started in Italy (it started only in January 2021). Furthermore, by the end of December 2020 the spread of the virus had significantly abated in Italy, and so it was therefore possible to analyze the huge quantities of detailed contagion data and the public transport trips monitored at a regional scale and for a significantly long time period, in addition to the effects of specific restrictive policies applied by the Italian government. To this end, a quantitative analysis was also performed through the estimation of both parametric (e.g., Pearson’s coefficient) and non-parametric (e.g., Spearman’s, and Somers’) correlation coefficients.
The paper is organized as follows: Section 2 reports the study area and the dataset; Section 3 describes the estimation methods performed; Section 4 reports the main results and discussion, and the conclusions are reported in Section 5.

2. Study Area and Dataset

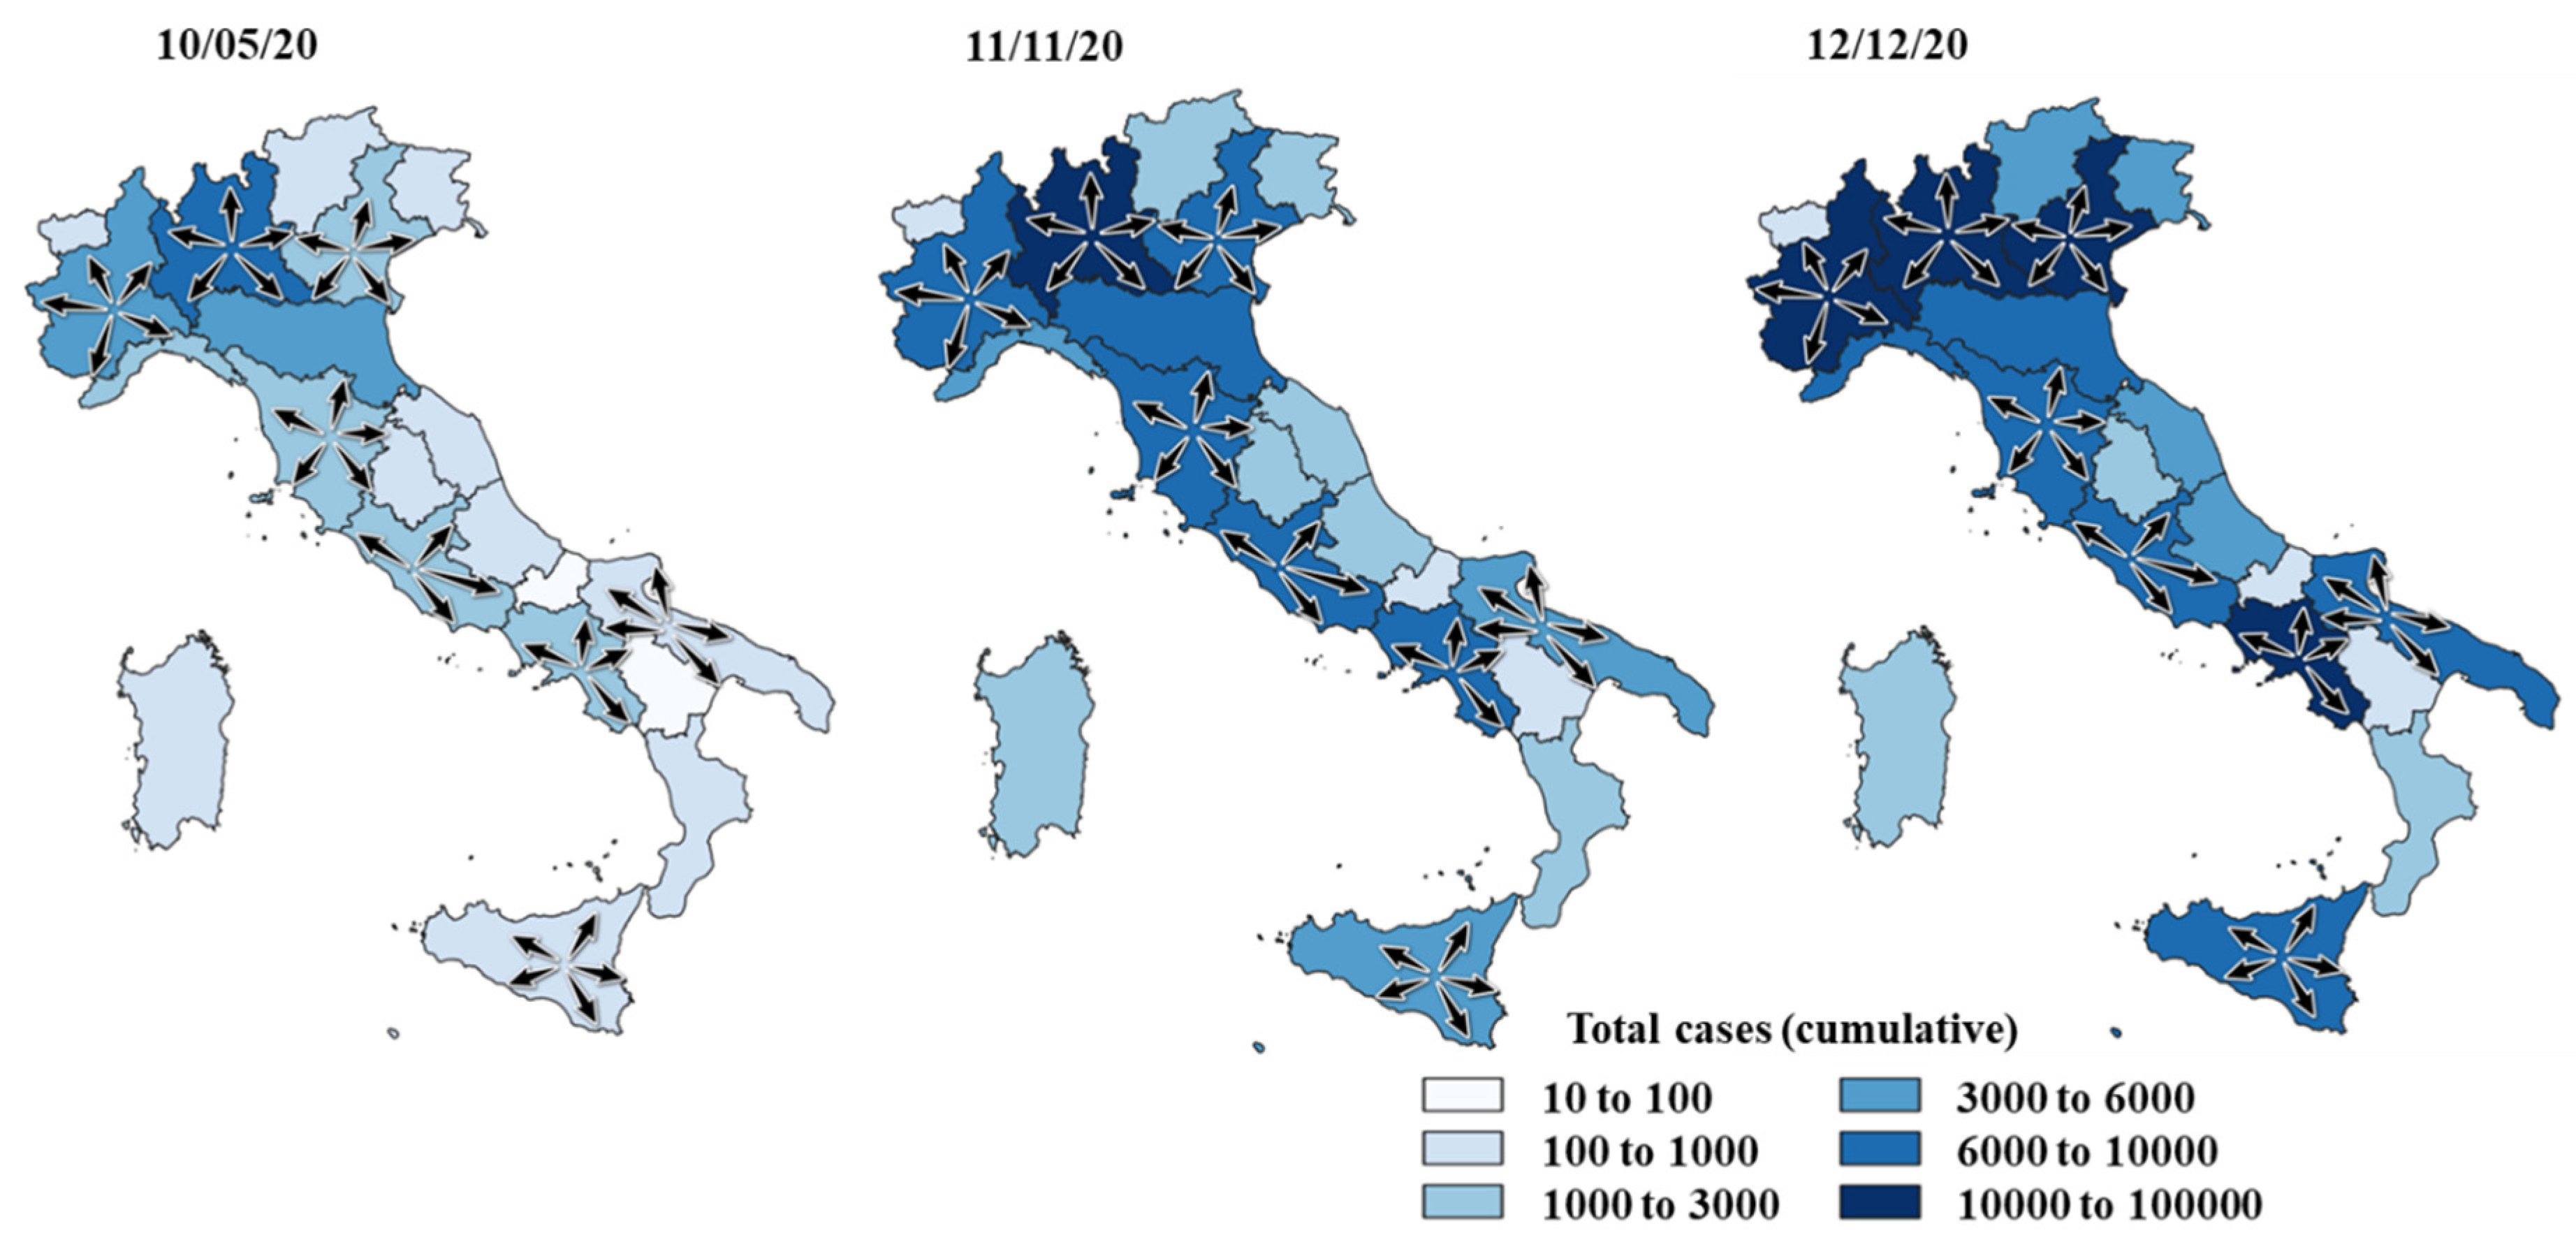
2.1. The Spread of COVID-19 in Italy

In Italy, the first outbreak of COVID-19 was in Codogno (Lombardy) on 18 February 2020 (see the left-hand map in Figure 1). Despite the rapid spread of the virus to the neighboring regions, mobility habits remained almost unchanged. Before the national lockdown on 9 March 2020 (see the central map in Figure 1), many of those living or working in northern Italy returned to their regions of origin, in central or southern Italy [39]. These north–south migrations, together with extra-regional commuting trips, produced a “long-distance longitudinal” spread of the virus within the whole country [40].
Thus, on 11 April 2020, an increase in positive cases is highlighted mostly in those regions most affected by the migrations in question (see the right-hand map in Figure 1). The lockdown ended on 18 May 2020 with a significant reduction in new positive cases.
Overall, considering the number of the daily new COVID-19 cases, the first wave could be identified by the period starting from 9 March and ending in summer 2020 (Figure 2), when fewer than 150 daily new cases of coronavirus were recorded.
Encouraged by the declining numbers of new cases, Italy and other EU countries partly lifted mobility restrictions to help boost the tourist sector in the summer of 2020. The virus seemed to have stopped spreading, recording in all 269,214 infected cases with 35,483 deaths (13% of the total) nationwide on 31 August 2020, marking an end to the first wave (see Table 1). Unfortunately, September saw a new increase in positive cases with a new phase in virus diffusion on 15 October 2020 (left-hand map in Figure 3), which is used to indicate the starting point of the “high second wave” phase (see Figure 2). The virus continued to spread, reaching its peak on 11 November 2020 (center, Figure 3). In the second observation period, from 31 August to 31 December, a total of 1,837,952 new infected cases with 38,676 new deaths (2% of the new infected cases) were registered in the whole country (see Table 1).
Overall, the second wave differed significantly from the first in terms of: (i) the average number of daily new cases (about 7 times higher than those of the first wave against a comparable number of total deaths); (ii) the geographical spread of the virus, showing a “within-region radial diffusion” against the long-distance longitudinal one observed during the first wave. This occurred also due to tighter legislation in Italy, which strictly limited mobility to only intra-regional trips (Figure 3).
However, the main way of the virus transmission occurs through person-to-person contacts (i.e., social interactions), especially in (indoor) crowded places, areas where activities are carried out (e.g., in the workplace, schools, shops, supermarkets, malls, and leisure areas) [40]. Such activities can be reached through public transport services, which may be considered as an indirect cause of the virus transmission. Furthermore, public transport is itself a place (closed and crowded) where there are many daily person-to-person contacts and can be considered also a direct cause of the contagion. For both these considerations, according to the authors, it was proper to investigate the correlation between the daily number of certified cases of coronavirus and the quantity of public transport trips.
With respect to the proposed case study, some differences occurred between the two waves in Italy: in the second wave, transmission was not caused by world and/or national mobility, but mainly by intra-regional mobility.
The main restrictive policies on mobility applied at the national scale during the second wave (the one analyzed in this research) were as follows:
-
DPCM (the acronym used in Italy for the decrees issued by the president of the council of ministers) of 3 November 2020 (known as the DPCM of the “red zones”), which introduced the division of the territory into zones with different levels of severity and risk, limiting mobility trips between regions;
-
DPCM of 3 December 2020, which confirmed and temporally extended the diversification of the regulations adopted by the previous decree;
-
various Ordinances of the Ministry of Health which, in implementing the measures provided for in the DPCM of November and December, classified the regions into red, orange, and yellow zones on the basis of data processed by the National Control Center after consulting the Scientific Technical Committee on the monitored data;
-
legislative Decree of 18 December 2020 no. 172, known as the “Christmas Decree”, which provided a package of urgent measures for the Christmas holidays and the beginning of the New Year.
Overall, three main measures were undertaken from 6 November to 31 December 2020 (DPCM 3 November 2020, DPCM 3 December 2020 and DL no. 172/2020), which divided Italy into three areas, each with a different gravity risk scenario:
-
yellow zones, in which the following measures were implemented: a strict travel ban from 10 p.m. to 5 a.m., with only working/necessity/safe activities allowed; closure of shopping malls on public holidays and the day preceding them, with only grocers, chemists, and stationers being permitted to open those days; restriction of bars and restaurants to opening only between 5 a.m. and 6 p.m., extended to 10 p.m. for takeaway services, with no limits for home deliveries; closure of museums, exhibitions, cinemas, games rooms, betting shops; the suspension of public and private competitions, except for those recruiting health system and civil protection teams; public transport vehicles allowed to run no more than half full, except for school buses; online lessons and lectures required for all schools and universities, starting from secondary level;
-
orange zones, with high risk and severity, in which the following additional measures were undertaken with respect to yellow zones: strict travel bans to regions or municipalities other than those of residence, except for those traveling for work, health, or safety reasons; restaurants and bars closed to the public except for takeaway services and home deliveries before 10 p.m.;
-
red zones, with the highest risk and severity, in which further additional measures were implemented: closure of all retail businesses except for grocers, chemists, and stationers; suspension of all group sport activities, with only individual sport activities being allowed in proximity to the home; online lessons and lectures required for all schools and universities, except for kindergartens, primary schools, and the first year of secondary schools; suspension of activities relating to personal care services, with the exception of laundries, dry cleaners, barbers, hairdressers, and funeral services; restricted access to public administration staff, and exclusively for necessary activities, promotion of the use of smart working for employees.
Pursuant to the so-called “Christmas Decree” between 24 December 2020 and 6 January 2021 the following measures were applied to the whole of Italy:
-
“red zones” at national scale on holidays and preceding days;
-
“orange zones” on weekdays;
Permission to travel to a single private home, located in the same region, once a day, in a time period between 5:00 and 22:00, and limited to two people per car, in addition to minors under the age of 14 over whom such persons exercise parental authority, as well as the disabled or non-self-sufficient living together.
An overview of the regional application of “colored zones” is reported in Table 2.

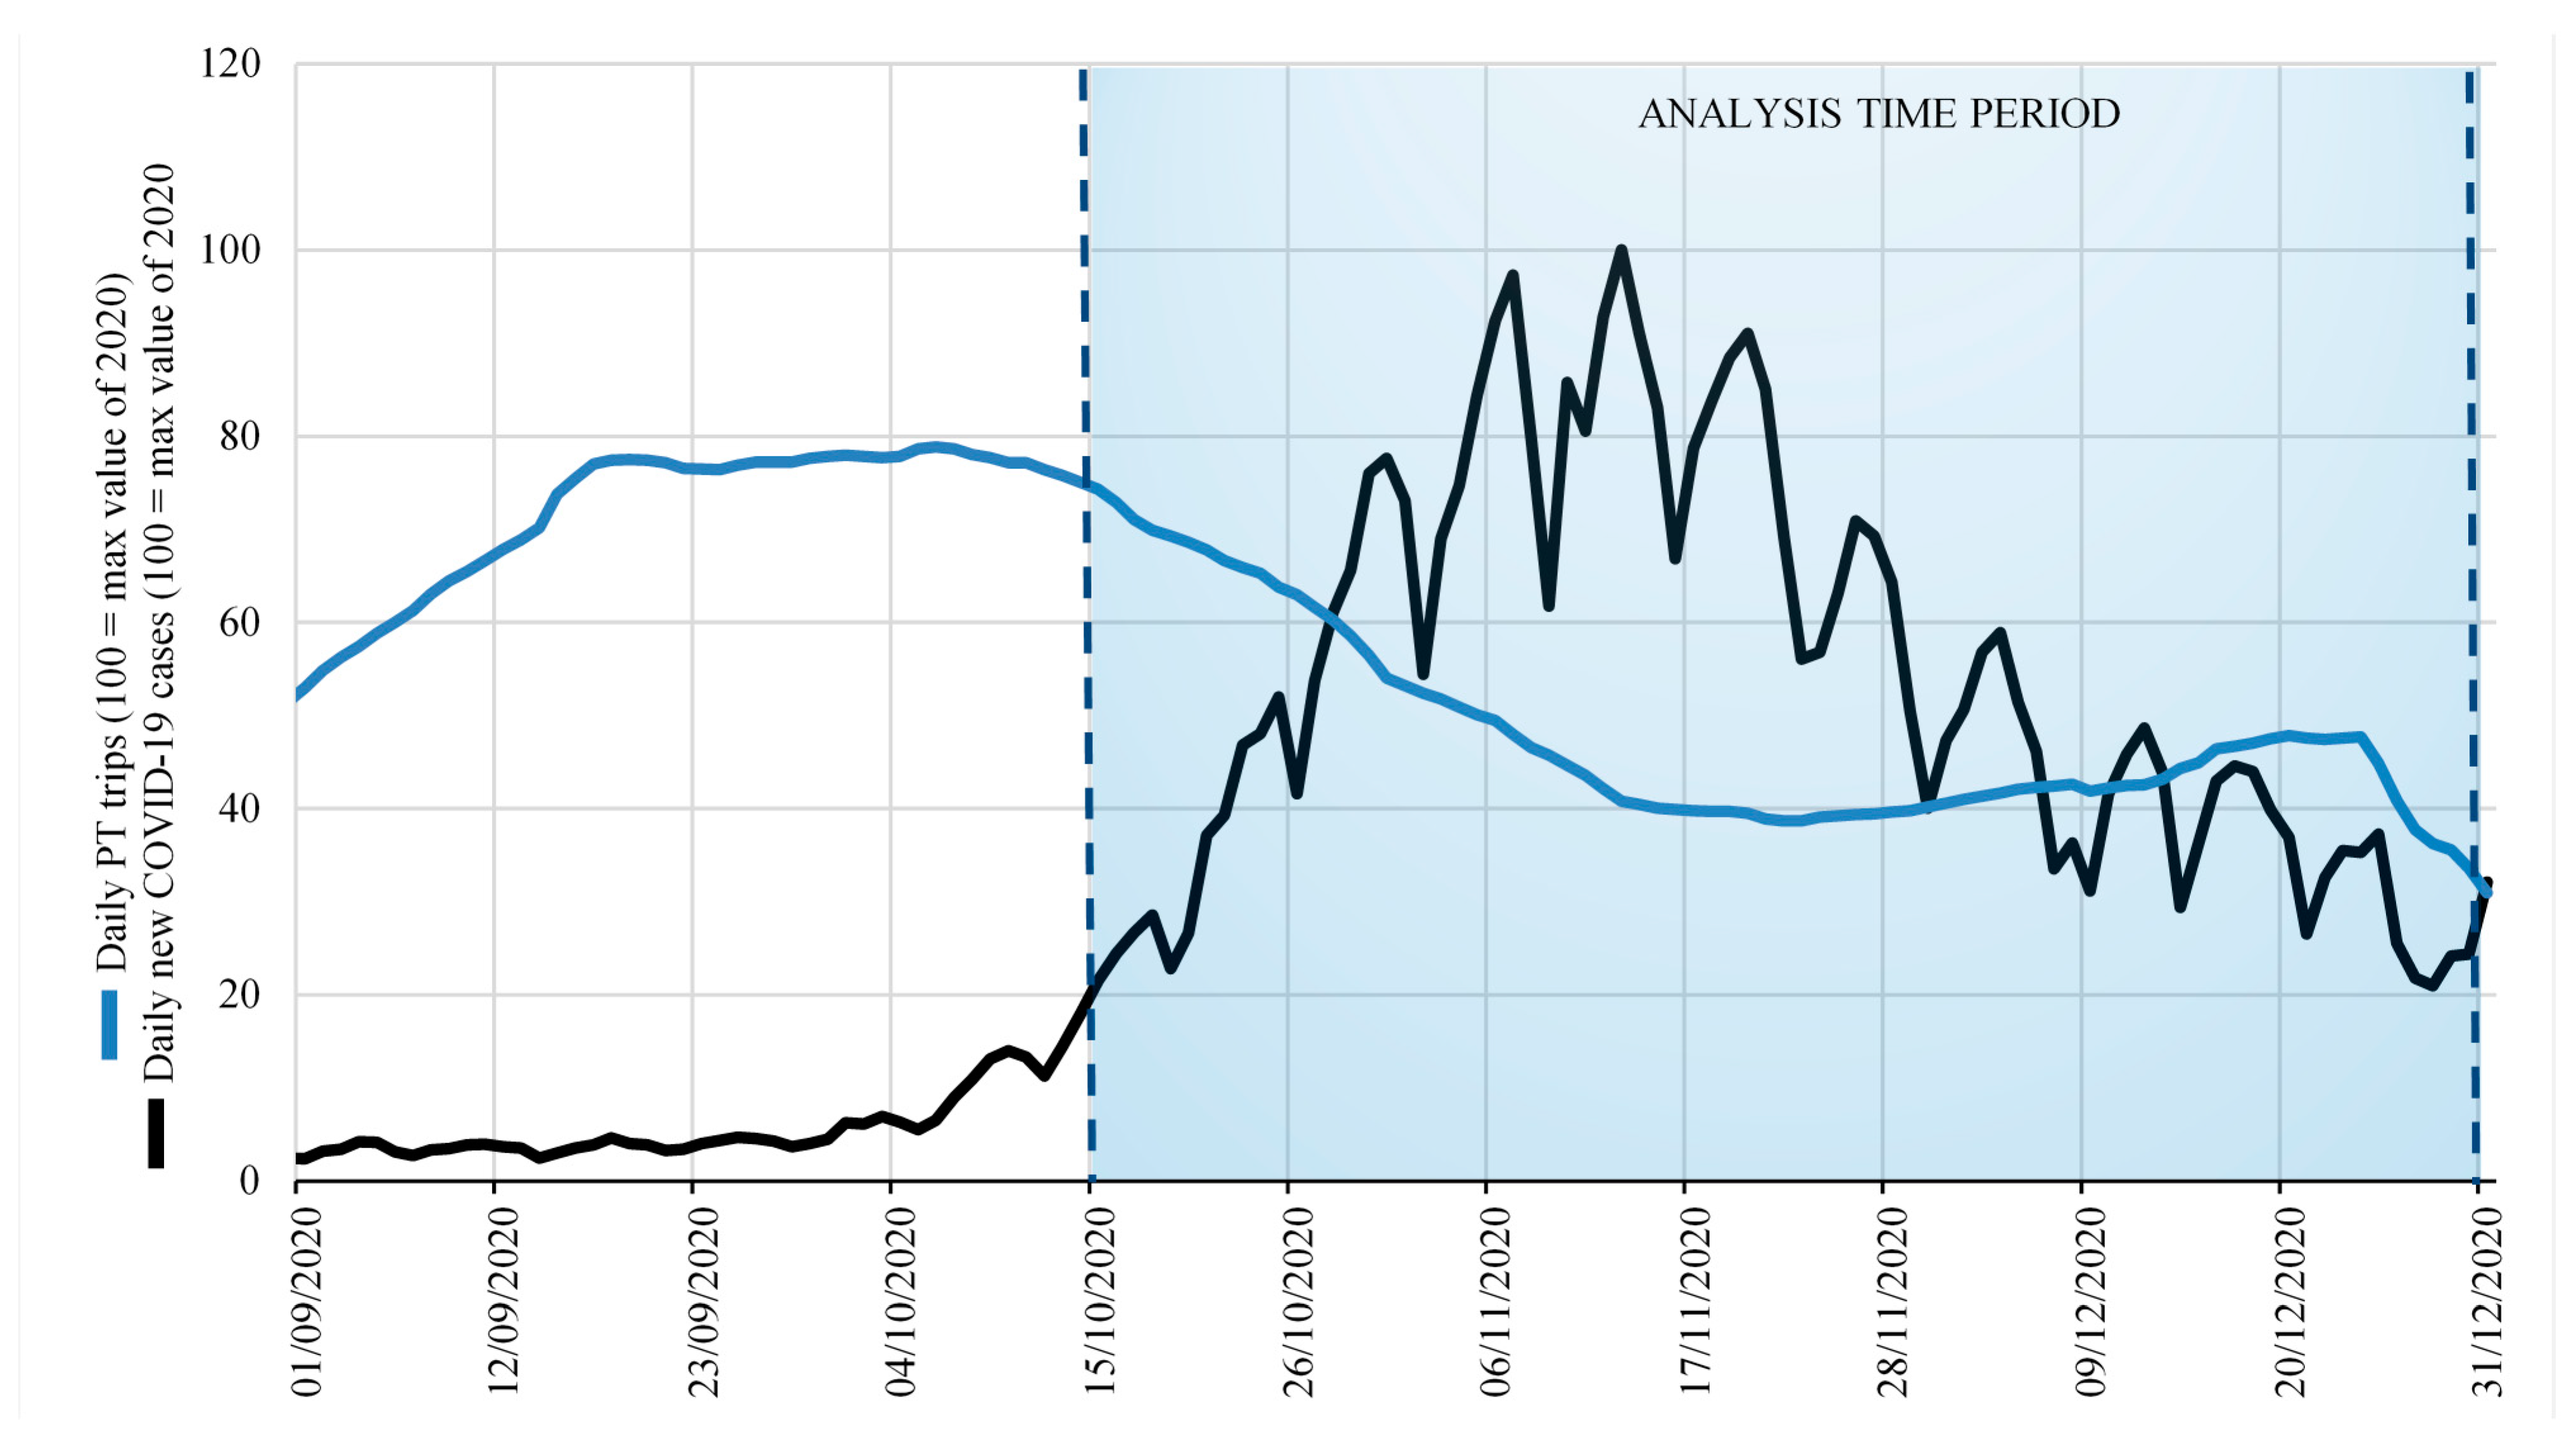
2.2. Data Collection

The data considered for the estimates were as follows:
the Italian national census data relative to the year 2019 [41], useful for geographical representation and socio-economic quantitative representation (e.g., population; area in km2);
the daily new COVID-19 cases, sourced from the Italian Ministry of Health (2020);
the COVID-19 mobility observatory of the Italian Ministry of Sustainable Infrastructure and Mobility (2020), collecting the number of daily public transport trips.
The territorial aggregation level considered for estimation was the regional scale. In all, Italy has 20 regions situated from north to south of the country (Figure 4), consistent with the classification of territorial units for EU statistics (NUTS) (2003). The most populous regions are Lombardia (with more than 10 million inhabitants), Lazio (with about 6 million inhabitants), and Campania (with about 6 million inhabitants), followed by Veneto, Sicilia, Piemonte and Emilia Romagna with an average population of 4–5 millions of inhabitants.
Average daily PT usage (in terms of passengers/day) reported in Figure 4 shows a high variability among regions, both due to the different number of inhabitants that perform mobility trips on a daily basis, and to the quality of the transport services provided (and therefore used). The region with the highest PT usage is Lombardia with 1.8 million PT trips/day followed by Lazio with about one million trips/day and Campania with about one million PT trips/day. The regions with the smallest populations are those with the lowest PT usage, namely Valle d’Aosta (14,000 PT trips/day), Molise (43,000), and Basilicata (76,000).
The considered trend of the daily new cases of COVID-19 and PT trips (Figure 5 and Figure 6) measured at national (regional) scale ranges between September 2020, when the new daily cases in Italy were very low, up to the end of December 2020 when ended the second wave (a longer period was not considered because the vaccination campaign began in January 2021, and this would have altered the results of the research). The two curves show a specular pattern; daily PT trips are on average higher from the beginning of September up to mid-October; this is followed by a sudden drop until the end of November, when a “bland” recovery is observed. By contrast, the daily COVID-19 cases follow the opposite trend: initially, there are few new daily cases until 15 October, when the second wave of coronavirus breaks out and the number of new cases grows dizzyingly (on a national and regional basis) up to mid-November and then gradually decreases until the end of December 2020. From Figure 5 and Figure 6, it emerges that the two curves do not overlap; by contrast, if they are shifted by about 3 weeks (one with respect to the other), the degree of overlapping greatly increases, suggesting a high correlation between the two variables (daily COVID-19 cases and PT trips). This is, as mentioned above, the thesis investigated and discussed in Section 4. In a nutshell, it is tantamount to saying that certified coronavirus cases in a day are the result of contagion occurring about three weeks earlier (through PT usage). To verify this thesis, an exploratory analysis of this conjecture was performed, comparing in a scatter plot the average daily new COVID-19 cases and average daily PT trips at regional scale, within the overall time period observed (from 15 October to 31 December 2020). The results in Figure 7 show that the data are located around the bisector line of the quadrant, indicating a probable high correlation between these two data sets. Obviously, this is only an exploratory analysis (not conclusive), since both variables (COVID-19 cases and PT trips) are directly proportional to the population living within the regions considered.

3. Estimation Method

For the purposes of the paper, a correlation analysis among PT trips and daily new COVID-19 cases was performed. A correlation coefficient measures the link between two variables and is characterized by a direction (positive or negative values) and an entity (values ranging between −1 and +1). The correlation measures could be grouped into both parametric and non-parametric coefficients. Pearson’s r index is one of the most commonly applied parametric correlation measures (see, amongst others, [44]), while rank-based indices (e.g., Spearman’s ρ, Kendall’s τ(b), Goodman and Kruskal’s γ, and Somers’ D) are well known among the non-parametric coefficients (e.g., [45]). Application of the parametric indices requires the satisfaction of some main hypotheses (e.g., [46]), namely: (i) quantitative and independent variables; (ii) linearity of the variables (e.g., test for linearity between two variables through a scatter-plot); (iii) absence of anomalous values in the sample; (iv) variables that follow a normal distribution (e.g., Shapiro–Wilk; Kolmogorov–Smirnov; q–q plot, a graphical representation for which there are no limits in sample size). If at least one of the previous hypotheses is not satisfied, non-parametric correlation coefficients, characterized by less restrictive assumptions, should be applied (e.g., the monotonicity of the relationship between the variables). Often there are differences in estimation results when applying both parametric and non-parametric indices to the same dataset. For example, Pearson’s correlation indices often produce values exceeding the non-parametric coefficients, just as Spearman’s indices are higher among non-parametric measures (e.g., [45]). Therefore, when multiple correlation indices are applied to the same sample, differences in estimation results must be expected in this sense.
The main limit of the correlation indices (whether parametric or non-parametric) is that these measures do not allow us to investigate the cause-effect association between two phenomena (variables). By contrast, there are other methods able to verify the cause-effect relation, often applied, for example, in health science to demonstrate the causality between pathogens and infectious diseases. Among the most common two-phenomena causation criteria, to be applied simultaneously, are the following:
temporality, that is, the necessity that the cause precedes the effect over time (e.g., first breathing polluted and infected air, then remaining infected);
biological/physical plausibility, that is, the possibility that the cause produces the effect (e.g., PT trips could be a vehicle of virus contagion);
strength, that is, the estimated index value (e.g., with as high a value as possible);
consistency, with other scientific studies and/or research (e.g., similar results obtained in other case studies).
Within these criteria, Somers’ D (the measure applied in this research) is one of the main non-parametric indices used to test the cause–effect relation of two phenomena. It is based on considering one sample (variable) as dependent (the effect) on the other (the cause), verifying its strength in terms of cause–effect relationship (values ranging between −1 and +1).

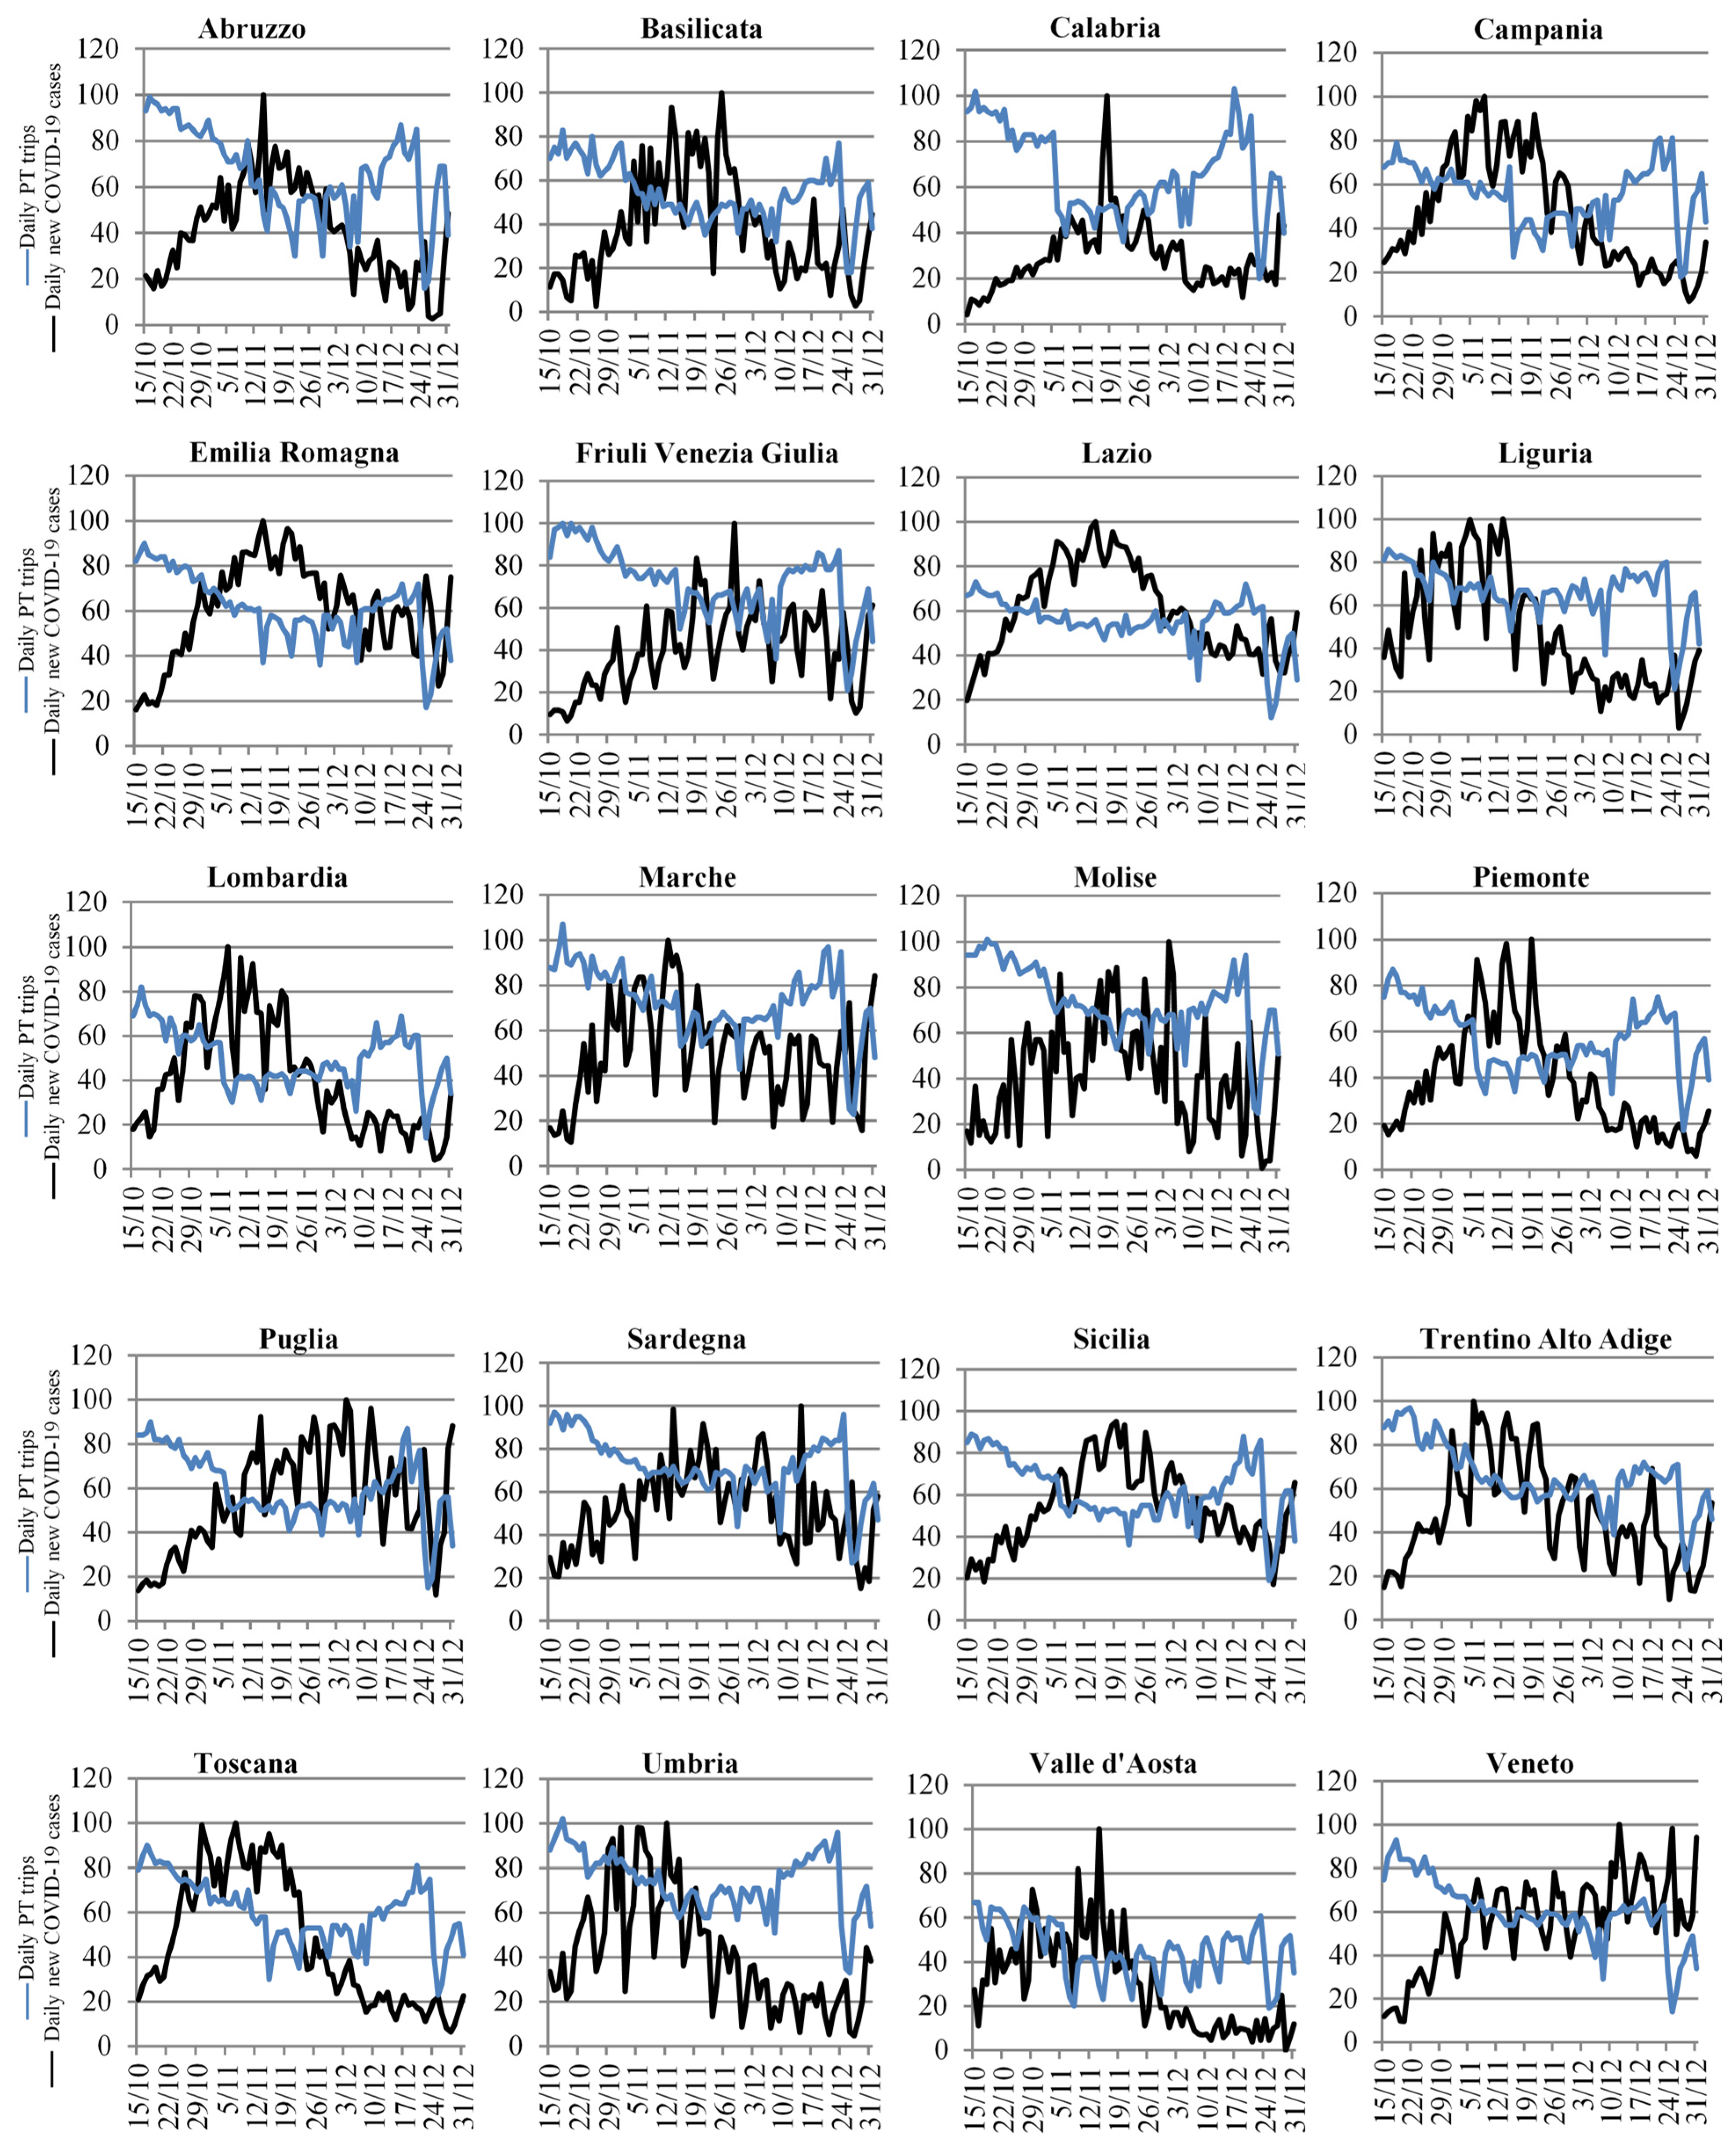
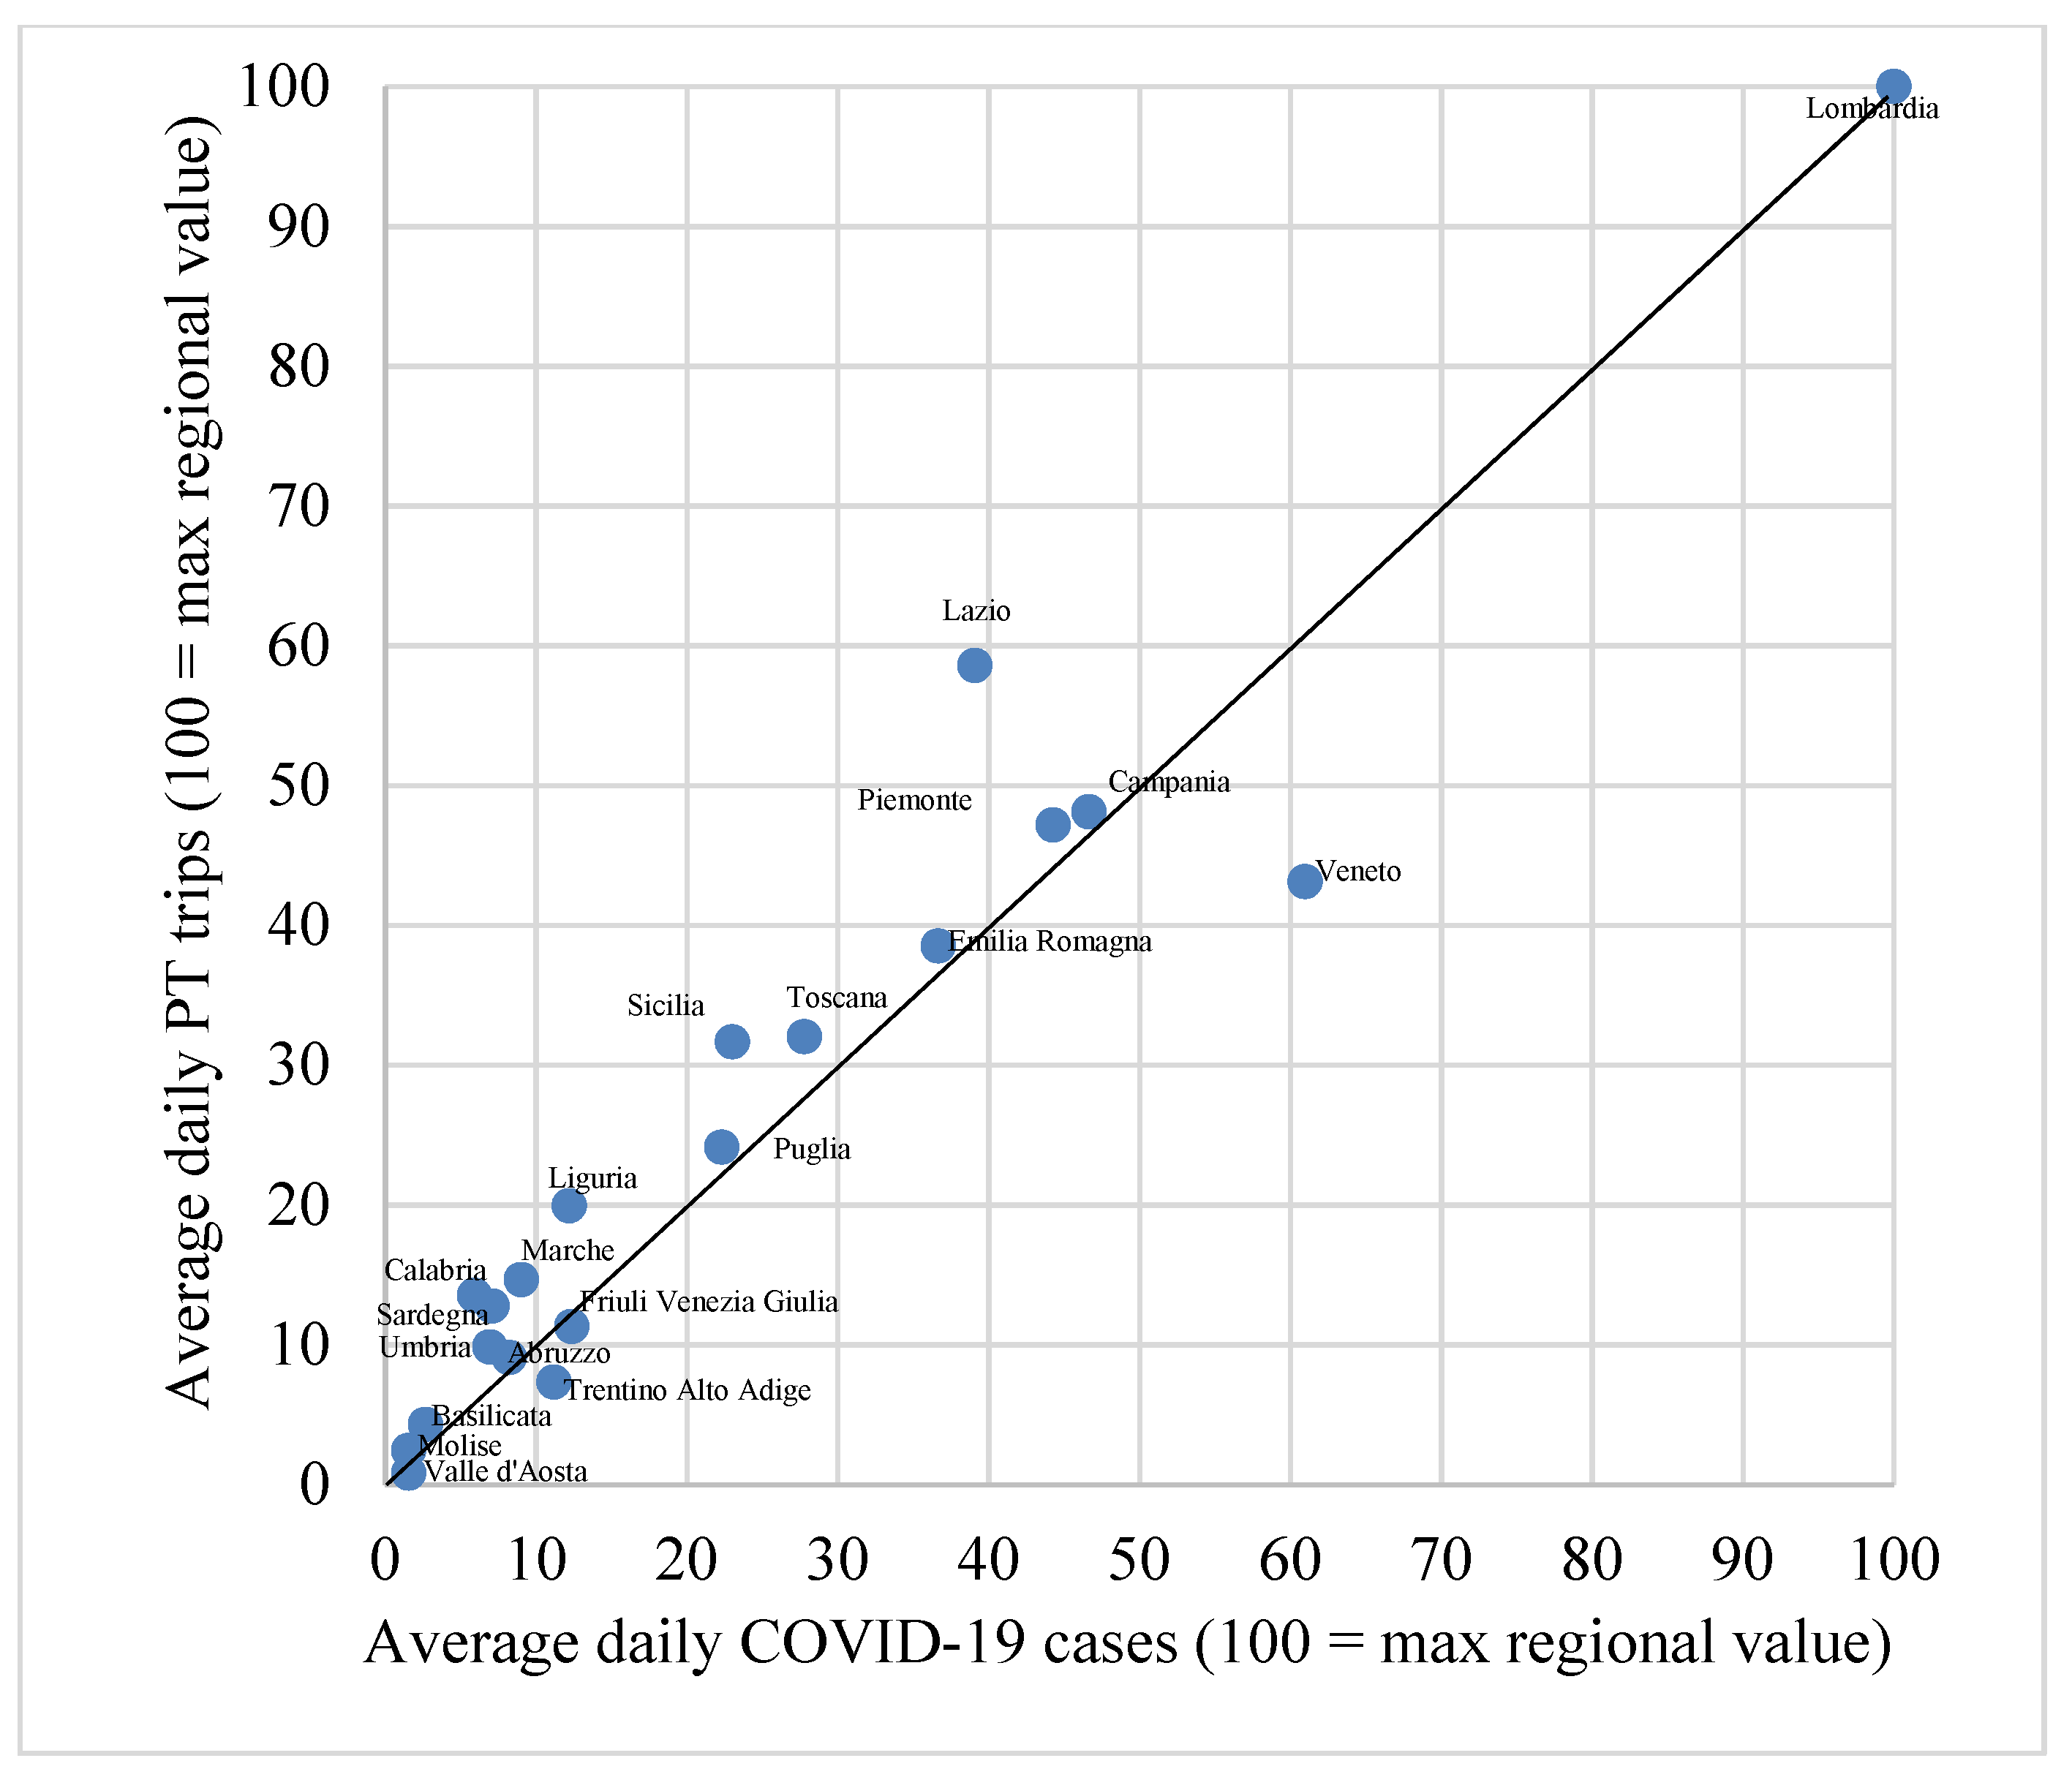
4. Results and Discussion

As stated above, the aim of the research was to perform a correlation analysis to verify the hypothesis according to which the daily new COVID-19 cases are directly related to the public transport (PT) trips observed several days before. To quantify the most representative number of days before that influence daily coronavirus cases, many thresholds (“shifted day”) were tested in terms of correlation values estimated. It resulted that PT trips observed on average 22 days before constituted the best time period to reproduce the data observed at national scale. Figure 8 reports the Spearman’s correlation coefficient estimation results for different daily PT trips shifted. As said, 22 is the value that produces on average the highest correlation value, even if also other thresholds close to 22 produce good results. This means that the new daily COVID-19 cases are directly correlated to the PT trips shifted forward within a time interval ranging between 17 and 26 days, where 22 is the value that provides the best correlation result. In fact, in this range there are comparable values of the correlation coefficients with differences lower 10% among each other.
This result is also qualitatively observable from Figure 9 through which it may be seen that the curve of daily PT trips (blue line in Figure 9) shifted 22 days forward (orange line in Figure 9) closely fits the observed trend of daily new COVID-19 cases (black line in Figure 9).
To verify the applicability of Pearson’s parametric correlation index, the occurrence of the basic assumptions described in Section 3 was tested for the data sets considered, concluding that linearity between the variables is always verified, while the hypothesis of the normal distribution of the phenomena, tested through the application of the q–q plot, was almost always verified. For this reason, to strengthen the validity of the research results, in addition to Pearson’s index, Spearman’s non-parametric test was also estimated, for which all the application’s basic assumptions were verified.
For the correlation analyses, the length of time period considered ranged from 15 October to 31 December 2020 which most closely corresponded to the “official” COVID-19 s wave in Italy (Figure 2). Furthermore, other time periods were also tested but not reported for brevity (up to the entire monitoring time period from September to December 2020) because they did not produce significant differences in estimation results.
Estimation results (Figure 10 and Table 3) show a positive correlation between daily new COVID-19 cases and PT trips shifted 22 days forward. As reported in Figure 10, the correlation values are higher for the regions with a high average PT usage (red and yellow dots in Figure 10), meaning that the most virtuous regions in terms of sustainable mobility, i.e., those where on average its citizens prefer public transport services to using private cars, were the most exposed to the spread of COVID-19. This result is more evident, for example, for Lombardia, Lazio, Campania and Piemonte which, with an average daily PT usage ranging between 0.83 to 1.73 million trips/day (the highest in the panel), have a positive correlation with daily new COVID-19 cases ranging between 0.86 (0.63) and 0.94 (0.81), according to Pearson’s (Spearman’s) estimates. By contrast, neither with respect to regional size (number of inhabitants) nor with respect to their PT usage was a significant difference in terms of ratio between daily PT trips standard deviation and corresponding mean observed within the time period in question. This means that the high/low variability of PT usage is related to other context factors not investigated in this research (e.g., the quantity and quality of modal alternatives to PT; availability of “physical” activities replaceable with “virtual” ones).
This observed correlation effect is consistent with the circumstance that public transport influences virus transmission both directly and indirectly. For example, a direct influence concerns the circumstance that within public transport vehicles the minimum social distance is not always (or hardly ever) guaranteed, thereby contributing to the spread of the contagion. Furthermore, PT also indirectly contributes to spreading contagion because, for example, the demand level (e.g., number of PT trips/day) is a measure of the activities performed in an area where social interactions occur. On such aspects, our results are consistent with those observed in other case studies: for example, worldwide, some authors have observed a strong and significant positive correlation between medium–long distance trips in the first wave of contagion and the number of COVID-19 infections (e.g., [16,17,40].
Finally, our estimation results (Table 3) show that Pearson’s correlation estimates are comparable (at times higher) with Spearman’s, consistent with the evidence from the literature (e.g., [45]).
One of the main limits of the correlation indices is their inability to investigate the cause–effect relation between two phenomena (variables). To overcome this limit and investigate the cause–effect relation between PT trips and daily new COVID-19 cases, the two-phenomena causation criteria discussed in Section 3 were applied. In precise terms, the “temporality” of the events was verified on observing that daily COVID-19 cases (the effect) always occur chronologically after the PT mobility trips performed (the cause). The “plausibility” was ascertained given that PT vehicles, as stated above, could be a vehicle of virus contagion, in addition to the circumstance that mobility trips favor social interaction and hence the spread of the infection. The “strength” was verified by applying Somers’ non-parametric index: estimation results (Table 3), showing an average Somers value of about 0.3–0.6 depending on the region (with an average national value of 0.55), allowing us to conclude that there is a good cause–effect relation between the two variables. This is an important result given the multitude of variables that influence the spread of COVID-19, of which mobility trips are not the main variable, if compared to both social interactions and the clinical/medical conditions of the potentially infectable population. Finally, the “consistency” of the results was verified by comparing the results obtained in this research with those from other case studies worldwide and discussed above. All these considerations suggest that there is a reasonable probability that PT trips were one of the causes in spreading COVID-19 for the case study considered.

5. Conclusions

The coronavirus pandemic has profoundly affected the public transport (PT) sector, with observed worldwide reductions in mobility trips of up to 90% during the lockdowns, without a full recovery even in countries that have experienced a significant reduction in contagion. Among the main causes of this PT crisis are fear and the reluctance of citizens to take such transport modes (e.g., bus, train), perceived as unsafe since they are unable to guarantee social distancing. This issue covers different research areas, including transportation, sustainability, and health management. To help technicians and policy makers manage and improve the public transport sector, what is required is proper health and risk assessment and management, with a view to enhancing safety during daily activities, providing significant improvements/suggestions in supporting the decision-making process, from identifying and quantifying the risk variable to defining policies and implementation.
The proposed research aimed to contribute to this topic, identifying in PT trips one of the main risk variables that has contributed to the spread of COVID-19. This aim was achieved through a correlation analysis to verify the hypothesis according to which the daily number of certified cases of coronavirus is directly correlated to the volume of public transport trips measured several days before (the day of the contagion). Estimates were made through both parametric and non-parametric correlation coefficients for the case study of Italy at a regional scale.
Our first original finding was the quantification of the “non-contemporaneity” between mobility habits and coronavirus contagion. The estimation results show that the COVID-19 cases certified by the Italian national health system in one day are directly related to the number of PT trips performed on average 22 days before, at the time when the infection probably occurred. This 22-day threshold indicates that quarantine of mobility restrictions (e.g., lockdown) commonly set at two weeks and based only on medical incubation considerations (the time that elapses from initial infection to manifestation of the symptoms) is underestimated as a containment strategy and may have—fatally—slowed down identification of the contagion and hence, the implementation of restrictive policies, resulting in more COVID-19 cases and deaths worldwide. This could be due to a possible delay between actual contagion and detection, for example, by the fraction of people who, albeit infected, are asymptomatic and/or initially show only mild symptoms, and therefore do not resort to healthcare, or to the significant percentage of tests that prove “false negative” to coronavirus.
The second major result is that COVID-19 and PT trips have a high correlation (stronger for the regions with a high usage of PT), with estimated values that reach 0.87 at national scale. Furthermore, a cause–effect test was also implemented between these two variables, concluding that there is a strong cause–effect relation between COVID-19 and PT trips. This result should be seen in the context of the many variables that influence the spread of the coronavirus (e.g., number of social interactions and/or medical conditions of the potentially infectable population), among which PT trips are not considered a major variable.
Third, this research has also laid the groundwork for ethical considerations concerning the right to mobility and social equity. The coronavirus pandemic has privileged the mobility of those with higher incomes, who may have alternatives in transport modes, against those with generally lower incomes who have no alternative to using public transport. The reluctance to use PT services also increased the usage of more polluting alternatives (e.g., private cars and motorcycles) while mandatory social distancing on board PT vehicles led to lower loading factors, thereby making mobility less sustainable and diminishing the overall welfare of urban areas. Furthermore, to better understand future implications on discouraging PT usage in the “new normal” post COVID-19 era, it will be necessary to invest heavily in “rehabilitating” the public transport sector through policies and strategies able to enhance, for example, the number and quality of PT vehicles and their sanitation, equipping them with ad-hoc devices (technologies) to guarantee social distancing and monitoring on-board passenger flows.
Several lessons were learnt from the research performed. One of the main ones was that public transport services contributes both indirectly and directly to the virus spread. As said, the main way of the virus transmission occurs through person-to-person contacts where activities are carried out and such can be reached through public transport services. Furthermore, public transport vehicles are itself a closed and crowded place where there are many daily person-to-person contacts causing a direct cause of the contagion. The obtained results are not limited to the Italian case study, as suggested by comparable findings obtained through different methodologies, for example, in Poland [40], Australia [47] and Sweden [23], and that suggest that this problem is common to all Western/EU countries. Furthermore, the general approach proposed and the results obtained could yield significant insights into the context variables that influence the spread of the virus, also helping appropriate evaluation methods (e.g., [48,49,50]) for the proper definition of restrictive/mitigation measures.
Some possible policies implication could be derived from this research, thereby ensuring a sustainable recovery and development of urban areas in the post-pandemic era, that include, for example: access to PT services only for passengers in possession of the “green pass” (i.e., vaccinated or who have taken a rapid test); definition of specific protocols for transport vehicles sanitation; subsidies and/or financing for increase in PT fleets in order to reduce the on-board crowding; subsidies/compensation for to bus/tram/metro drivers who are most exposed to the contagion; improving the overall public transport quality (e.g., [51,52]).

Author Contributions

Conceptualization, methodology, validation, formal analysis, supervision, project administration, writing—original draft preparation, writing—review and editing, A.C.; resources, data curation, writing—original draft preparation, writing—review and editing, L.D.F.; conceptualization, methodology, writing—original draft preparation, writing—review and editing, I.H.; validation, formal analysis, writing—original draft preparation, T.V.M.; validation, formal analysis, writing—original draft preparation, writing—review and editing, A.F. All authors have read and agreed to the published version of the manuscript.

Funding

This manuscript is the result of research work that did not receive any funds for the preparation of its research. The study received no external funding.

Institutional Review Board Statement

Not applicable.

Informed Consent Statement

Not applicable.

Data Availability Statement

Not applicable.

Acknowledgments

The research was carried out as part of the activities of the Transportation System Laboratory of the University of Campania “Luigi Vanvitelli”, Italy. The research was also carried out within the activities of funding program VALERE: VAnviteLli pEr la RicErca; SEND research project, University of Campania “Luigi Vanvitelli”, Italy.

Conflicts of Interest

The authors declare no conflict of interest.

References

  1. Bontempi, E. The Europe second wave of COVID-19 infection and the Italy “strange” situation. Environ. Res. 2021, 193, 110476. [Google Scholar] [CrossRef]
  2. Morawska, L.; Tang, J.W.; Bahnfleth, W.; Bluyssen, P.M.; Boerstra, A.; Buonanno, G.; Cao, J.; Dancer, S.; Floto, A.; Franchimon, F.; et al. How can airborne transmission of COVID-19 indoors be minimised? Environ. Int. 2020, 142, 105832. [Google Scholar] [CrossRef]
  3. Tirachini, A.; Cats, O. COVID-19 and public transportation: Current assessment, prospects, and research needs. J. Public Transp. 2020, 22, 1. [Google Scholar] [CrossRef]
  4. Bashir, M.F.; Ma, B.; Komal, B.; Bashir, M.A.; Tan, D.; Bashir, M. Correlation between climate indicators and COVID-19 pandemic in New York, USA. Sci. Total Environ. 2020, 728, 138835. [Google Scholar] [CrossRef]
  5. Lin, C.; Lau, A.K.; Fung, J.C.; Guo, C.; Chan, J.W.; Yeung, D.W.; Zhang, Y.; Bo, Y.; Hossain, M.S.; Zeng, Y. A mechanism-based parameterisation scheme to investigate the association between transmission rate of COVID-19 and meteorological factors on plains in China. Sci. Total Environ. 2020, 737, 140348. [Google Scholar] [CrossRef] [PubMed]
  6. Prata, D.N.; Rodrigues, W.; Bermejo, P.H. Temperature significantly changes COVID-19 transmission in (sub) tropical cities of Brazil. Sci. Total Environ. 2020, 729, 138862. [Google Scholar] [CrossRef] [PubMed]
  7. Qi, H.; Xiao, S.; Shi, R.; Ward, M.P.; Chen, Y.; Tu, W.; Su, Q.; Wang, W.; Wang, X.; Zhang, Z. COVID-19 transmission in Mainland China is associated with temperature and humidity: A time-series analysis. Sci. Total Environ. 2020, 728, 138778. [Google Scholar] [CrossRef]
  8. Rashed, E.A.; Kodera, S.; Gomez-Tames, J.; Hirata, A. Influence of absolute humidity, temperature and population density on COVID-19 spread and decay durations: Multi-prefecture study in Japan. Int. J. Environ. Res. Public. Health 2020, 17, 5354. [Google Scholar] [CrossRef]
  9. Shi, P.; Dong, Y.; Yan, H.; Zhao, C.; Li, X.; Liu, W.; He, M.; Tang, S.; Xi, S. Impact of temperature on the dynamics of the COVID-19 outbreak in China. Sci. Total Environ. 2020, 728, 138890. [Google Scholar] [CrossRef]
  10. Tosepu, R.; Gunawan, J.; Effendy, D.S.; Lestari, H.; Bahar, H.; Asfian, P. Correlation between weather and COVID-19 pandemic in Jakarta, Indonesia. Sci. Total Environ. 2020, 725, 138436. [Google Scholar] [CrossRef] [PubMed]
  11. Wu, Y.; Jing, W.; Liu, J.; Ma, Q.; Yuan, J.; Wang, Y.; Du, M.; Liu, M. Effects of temperature and humidity on the daily new cases and new deaths of COVID-19 in 166 countries. Sci. Total Environ. 2020, 729, 139051. [Google Scholar] [CrossRef] [PubMed]
  12. Zhu, Y.; Xie, J. Association between ambient temperature and COVID-19 infection in 122 cities from China. Sci. Total Environ. 2020, 724, 138201. [Google Scholar] [CrossRef] [PubMed]
  13. Carugno, M.; Dentali, F.; Mathieu, G.; Fontanella, A.; Mariani, J.; Bordini, L.; Milani, G.P.; Consonni, D.; Bonzini, M.; Bollati, V.; et al. PM10 exposure is associated with increased hospitalizations for respiratory syncytial virus bronchiolitis among infants in Lombardy, Italy. Environ. Res. 2018, 166, 452–457. [Google Scholar] [CrossRef]
  14. Setti, L.; Passarini, F.; De Gennaro, G.; Barbieri, P.; Perrone, M.G.; Borelli, M.; Palmisani, J.; Di Gilio, A.; Piscitelli, P.; Miani, A. Airborne transmission route of COVID-19: Why 2 meters/6 feet of inter-personal distance could not be enough. Multidisciplinary Digital Publishing Institute. Int. J. Environ. Res. Public Health 2020, 17, 2932. [Google Scholar] [CrossRef] [PubMed] [Green Version]
  15. Setti, L.; Passarini, F.; De Gennaro, G.; Di Gilio, A.; Palmisani, J.; Buono, P.; Fornari, G.; Perrone, M.G.; Piazzalunga, A.; Barbieri, P. Evaluation of the Potential Relationship between Particulate Matter (PM) Pollution and COVID-19 Infection Spread in Italy. Soc. Italy di Med. Ambient. 2020. Available online: https://www.aircentre.org/wp-content/uploads/2020/04/Setti_et_al_2020.pdf (accessed on 1 September 2021).
  16. Cartenì, A.; Di Francesco, L.; Martino, M. How mobility habits influenced the spread of the COVID-19 pandemic: Results from the Italian case study. Sci. Total Environ. 2020, 741, 140489. [Google Scholar] [CrossRef]
  17. Kraemer, M.U.; Yang, C.H.; Gutierrez, B.; Wu, C.H.; Klein, B.; Pigott, D.M.; Du Plessis, L.; Faria, N.R.; Li, R.; Hanage, W.P.; et al. The effect of human mobility and control measures on the COVID-19 epidemic in China. Science 2020, 368, 493–497. [Google Scholar] [CrossRef] [Green Version]
  18. Islam, N.; Sharp, S.J.; Chowell, G.; Shabnam, S.; Kawachi, I.; Lacey, B.; Massaro, J.M.; D’Agostino, R.B.; White, M. Physical distancing interventions and incidence of coronavirus disease 2019: Natural experiment in 149 countries. BMJ 2020, 370, m2743. [Google Scholar] [CrossRef]
  19. McGrail, D.J.; Dai, J.; McAndrews, K.M.; Kalluri, R. Enacting national social distancing policies corresponds with dramatic reduction in COVID19 infection rates. PLoS ONE 2020, 15, e0236619. [Google Scholar] [CrossRef]
  20. Auger, K.A.; Shah, S.S.; Richardson, T.; Hartley, D.; Hall, M.; Warniment, A.; Timmons, K.; Bosse, D.; Ferris, S.A.; Brady, P.W.; et al. Association Between Statewide School Closure and COVID-19 Incidence and Mortality in the US. JAMA 2020, 324, 859–870. [Google Scholar] [CrossRef]
  21. Im Kampe, E.O.; Lehfeld, A.S.; Buda, S.; Buchholz, U.; Haas, W. Surveillance of COVID-19 school outbreaks, Germany, March to August 2020. Eurosurveillance 2020, 25, 2001645. [Google Scholar] [CrossRef]
  22. Stein-Zamir, C.; Abramson, N.; Shoob, H.; Libal, E.; Bitan, M.; Cardash, T.; Cayam, R.; Miskin, I. A large COVID-19 outbreak in a high school 10 days after schools’ reopening, Israel, May 2020. Eurosurveillance 2020, 25, 2001352. [Google Scholar] [CrossRef]
  23. Jenelius, E.; Cebecauer, M. Impacts of COVID-19 on public transport ridership in Sweden: Analysis of ticket validations, sales and passenger counts. Transp. Res. Interdiscip. Perspect. 2020, 8, 100242. [Google Scholar] [PubMed]
  24. Vitrano, C. COVID-19 and Public Transport. A Review of the International Academic Literature; Media-Tryck: Lund, Sweden, 2021; Available online: https://www.k2centrum.se/sites/default/files/fields/field_uppladdad_rapport/covid-19_and_public_transport.pdf (accessed on 1 September 2021).
  25. Bucsky, P. Modal share changes due to COVID-19: The case of Budapest. Transp. Res. Interdiscip. Perspect. 2020, 8, 100141. [Google Scholar] [CrossRef]
  26. de Haas, M.; Faber, R.; Hamersma, M. How COVID-19 and the Dutch ‘intelligent lockdown’ change activities, work and travel behaviour: Evidence from longitudinal data in the Netherlands. Transp. Res. Interdiscip. Perspect. 2020, 6, 100150. [Google Scholar] [CrossRef]
  27. Aloi, A.; Alonso, B.; Benavente, J.; Cordera, R.; Echániz, E.; González, F.; Ladisa, C.; Lezama-Romanelli, R.; López-Parra, Á.; Mazzei, V.; et al. Effects of the COVID-19 lockdown on urban mobility: Empirical evidence from the city of Santander (Spain). Sustainability 2020, 12, 3870. [Google Scholar] [CrossRef]
  28. Hörcher, D.; Singh, R.; Graham, D.J. Social Distancing in Public Transport: Mobilising New Technologies for Demand Management under the COVID-19 Crisis. 2020. Available online: https://ssrn.com/abstract=3713518 (accessed on 1 September 2021). [CrossRef]
  29. de Lima, G.C.L.S.; de Carvalho, G.S.D.; Figueiredo, M.Z. Incomplete contracts for bus service during the COVID-19 pandemic. RAP Rev. Bras. Adm. Pública 2020, 54, 994–1009. [Google Scholar] [CrossRef]
  30. Budd, L.; Ison, S. Responsible Transport: A post-COVID agenda for transport policy and practice. Transp. Res. Interdiscip. Perspect. 2020, 6, 100151. [Google Scholar] [CrossRef]
  31. Pawar, D.S.; Yadav, A.K.; Akolekar, N.; Velaga, N.R. Impact of physical distancing due to novel coronavirus (SARS-CoV-2) on daily travel for work during transition to lockdown. Transp. Res. Interdiscip. Perspect. 2020, 7, 100203. [Google Scholar] [CrossRef] [PubMed]
  32. Smith, J.A.; Judd, J. COVID-19: Vulnerability and the power of privilege in a pandemic. Health Promot. J. Aust. 2020, 31, 158. [Google Scholar] [CrossRef] [Green Version]
  33. Gutiérrez, A.; Miravet, D.; Domènech, A. COVID-19 and urban public transport services: Emerging challenges and research agenda. Cities Health 2020, 1–4. [Google Scholar] [CrossRef]
  34. Sutherland, M.; McKenney, M.; Elkbuli, A. Vehicle related injury patterns during the COVID-19 pandemic: What has changed? Am. J. Emerg. Med. 2020, 38, 1710–1714. [Google Scholar] [CrossRef]
  35. Aven, T.; Kristensen, V. Perspectives on risk: Review and discussion of the basis for establishing a unified and holistic approach. Reliab. Eng. Syst. Saf. 2005, 90, 1–14. [Google Scholar] [CrossRef]
  36. Aven, T. Risk assessment and risk management: Review of recent advances on their foundation. Eur. J. Oper. Res. 2016, 253, 1–13. [Google Scholar] [CrossRef] [Green Version]
  37. Junior, J.A.G.; Busso, C.M.; Gobbo, S.C.O.; Carreão, H. Making the links among environmental protection, process safety, and industry 4.0. Process. Saf. Environ. Prot. 2018, 117, 372–382. [Google Scholar]
  38. Khan, F.; Rathnayaka, S.; Ahmed, S. Methods and models in process safety and risk management: Past, present and future. Process. Saf. Environ. Prot. 2015, 98, 116–147. [Google Scholar] [CrossRef]
  39. Pepe, E.; Bajardi, P.; Gauvin, L.; Privitera, F.; Lake, B.; Cattuto, C.; Tizzoni, M. COVID-19 outbreak response: A first assessment of mobility changes in Italy following national lockdown. medRxiv 2020. [Google Scholar] [CrossRef] [Green Version]
  40. Cartenì, A.; Di Francesco, L.; Martino, M. The role of transport accessibility within the spread of the Coronavirus pandemic in Italy. Saf. Sci. 2021, 133, 104999. [Google Scholar] [CrossRef] [PubMed]
  41. [Dataset] ISTAT. 2020. Available online: https://www.istat.it/it/archivio/222527 (accessed on 6 May 2020).
  42. [Dataset] Italian Ministry of Sustainable Infrastructure and Mobility. Strategic and Infrastructures Development Office: COVID-19 Mobility Observatory. 2020. Available online: http://www.mit.gov.it/ (accessed on 15 January 2021).
  43. [Dataset] Italian Ministry of Health. Daily Reports on COVID-19 Positive Cases. 2020. Available online: http://www.salute.gov.it/portale/home.html (accessed on 15 January 2021).
  44. Bookbinder, M.; Panosian, K.J. Using the coefficient of correlation in method-comparison studies. Clin. Chem. 1987, 33, 1170–1176. [Google Scholar] [CrossRef]
  45. Masyn, K.; Nathan, P.; Little, T. The Oxford Handbook of Quantitative Methods; Little, T.D., Ed.; Oxford University Press: Oxford, UK, 2013; Volume 2, pp. 551–611. [Google Scholar]
  46. Asuero, A.G.; Sayago, A.; Gonzalez, A.G. The Correlation Coefficient: An Overview. Crit. Rev. Anal. Chem. 2006, 36, 41–59. [Google Scholar] [CrossRef]
  47. Beck, M.J.; Hensher, D.A.; Nelson, J.D. Public transport trends in Australia during the COVID-19 pandemic: An investigation of the influence of bio-security concerns on trip behaviour. J. Transp. Geogr. 2021, 96, 103167. [Google Scholar] [CrossRef]
  48. Carteni’, A. A cost-benefit analysis based on the carbon footprint derived from plug-in hybrid electric buses for urban public transport services. WSEAS Trans. Environ. Dev. 2018, 14, 125–135, ISSN/E-ISSN 1790-5079/2224-3496. [Google Scholar]
  49. Carteni’, A.; Henke, I.; Molitierno, C. A cost-benefit analysis of the metro line 1 in Naples, Italy. WSEAS Trans. Bus. Econ. 2018, 15, 529–538, ISSN 1109-9526. [Google Scholar]
  50. Henke, I.; Carteni, A.; Molitierno, C.; Errico, A. Decision-Making in the transport sector: A sustainable evaluation method for road infrastructure. Sustainability 2020, 12, 764. [Google Scholar] [CrossRef] [Green Version]
  51. Cascetta, E.; Cartenì, A. A quality-based approach to public transportation planning: Theory and a case study. Int. J. Sustain. Transp. 2014, 8, 84–106. [Google Scholar] [CrossRef] [Green Version]
  52. Cascetta, E.; Cartenì, A.; Henke, I. Stations quality, aesthetics and attractiveness of rail transport: Empirical evidence and mathematical models (Qualità delle stazioni, estetica e attrattività del trasporto ferroviario: Evidenze empiriche e modelli matematici). Ing. Ferrov. 2014, 69, 307–324, ISSN 0020-0956. [Google Scholar]
Figure 1. Spread of the first wave of COVID-19 in Italy: total cumulative cases (source: processing starting from the Italian Ministry of Health, 2020).
Sustainability 13 11905 g001
Figure 2. Trend in daily new cases for the period from 24 February to 31 December (source: processing starting from the Italian Ministry of Health, 2020).
Sustainability 13 11905 g002
Figure 3. The second wave of COVID-19 diffusion in Italy—total cumulative cases due to radial accessibility (source: processing starting from the Italian Ministry of Health, 2020).
Sustainability 13 11905 g003
Figure 4. Regional aggregation level considered and territorial, demographic, and transportation key indicators (data source: processing starting from the [41,42]).
Sustainability 13 11905 g004
Figure 5. Daily new COVID-19 cases and measured PT trips at national scale (data source: processing starting from the [42,43]).
Sustainability 13 11905 g005
Figure 6. Number of PT trips and daily new COVID-19 cases at regional scale from 15 October to 31 December 2020 (data source: processing starting from the COVID-19 mobility observatory of the [42,43]).
Sustainability 13 11905 g006
Figure 7. Scatter plot of the average daily COVID-19 cases and the average daily PT trips at regional scale within the overall time period from 15 October to 31 December 2020 (data sourced from the COVID-19 mobility observatory of the [42,43]).
Sustainability 13 11905 g007
Figure 8. Estimation results at national scale: % variation of the Spearman’s correlation coefficient estimation results for different daily PT trips shifted with respect to the best estimation result (i.e., 22 days threshold).
Sustainability 13 11905 g008
Figure 9. Example of estimation results: daily new COVID-19 cases, measured PT trips and PT trips shifted 22 days forward at national scale.
Sustainability 13 11905 g009
Figure 10. Example of estimation results: Spearman’s correlation coefficient estimation results between daily new COVID-19 cases and daily PT trips shifted on average 22 days forward.
Sustainability 13 11905 g010
Table 1. Key numbers of the two COVID-19 waves in Italy.
IndicatorFirst Wave Period
(22 February–31 August)
Second Wave Period
(1 September–31 December)
Number of days191121
Number of total infected cases269,2141,837,952
Number of total deaths35,48338,676
Number of total tests performed8,644,85917,953,748
Table 2. Overview of Italian COVID-19 decrees.
RegionThe Italian DPCM “RED ZONE” Decree
DPCM 3 Nov. 2020DPCM 3 Dec. 2020DL no. 172 18 Dec. 2020
6 Nov.–10 Nov.11 Nov.–14 Nov.15 Nov.–21 Nov.22 Nov.–28 Nov.29 Nov.–05 Dec.6 Dec.–12 Dec.13 Dec.–19 Dec.20 Dec.–23 Dec.24 Dec.–27 Dec.28 Dec.–30 Dec.31 Dec.–3 Jan.
Liguria
Lombardia
Piemonte
Valle d’Aosta
Emilia-Romagna
Friuli Venezia Giulia
Trentino Alto Adige
Veneto
Lazio
Marche
Toscana
Umbria
Abruzzo
Basilicata
Calabria
Campania
Molise
Puglia
Sardegna
Sicilia
Table 3. Estimation results: correlation coefficient between daily new COVID-19 cases and daily PT trips shifted on average 22 days forward (p-values always <0.0001 except for estimates relative to Marche, Molise, Puglia, and Sardegna for which the estimated p-value is <0.05).
RegionPearsonSpearmanSomers
Abruzzo0.6780.7050.507
Basilicata0.5610.6020.444
Calabria0.4100.4670.325
Campania0.8630.8090.644
Emilia romagna0.7200.7490.565
Friuli venzia giulia0.5830.3220.193
Lazio0.8110.7470.601
Liguria0.8070.6210.468
Lombardia0.9350.7330.541
Marche0.3280.3770.278
Molise0.3180.3940.266
Piemonte0.8620.6290.455
Puglia0.3430.4100.236
Sardegna0.3630.4190.295
Sicilia0.3800.4980.358
Toscana0.9370.7590.603
Trentino alto adige0.5260.5040.362
Umbria0.4930.5040.373
Valle d’aosta0.5240.4510.303
Veneto0.7030.7050.253
Italy0.8660.7350.552
Publisher’s Note: MDPI stays neutral with regard to jurisdictional claims in published maps and institutional affiliations.

