Article

A Network Approach to Revealing Dynamic Succession Processes of Urban Land Use and User Experience

1
Department of Energy Science, Sungkyunkwan University, Suwon 16419, Korea
2
Jungdo UIT, Seoul 06222, Korea
3
Department of Urban Planning and Design, Hongik University, Seoul 04066, Korea
*
Author to whom correspondence should be addressed.
Sustainability 2021, 13(21), 11955; https://doi.org/10.3390/su132111955
Submission received: 15 September 2021 / Revised: 20 October 2021 / Accepted: 23 October 2021 / Published: 29 October 2021
(This article belongs to the Section Sustainable Urban and Rural Development)

Abstract

:
One significant challenge to understanding the mechanisms of urban retail areas’ transition is limited data to trace a dynamic perspective of influential actors’ experience in an extended urban area. We overcome this gap by employing text mining to collect big text data from online blogs and propose a methodology to explore the dynamic spatial transformations and interactions across multiple adjacent retail areas. We study five retail areas that currently function as a major commercial hub in Seoul—the Hongdae area and its neighboring districts. We create co-occurrence networks of the text data to capture representative place images and user experiences. Our blog-word networks systematically capture the “invasion-succession” process in land-use transition during the commercialization of Hongdae’s neighboring districts. The process mirrors the history of spatial change in the areas, which once formed a small-scale, bohemian hip neighborhood that incubated indie culture and has now fully commercialized as a global tourist attraction. The commercial transition triggered by Hongdae’s cultural capital peaked with consumer experiences of “food and eating” dominating the whole area. Finally, the text networks signal gentrification in each commercial district near Hongdae, contributing to the current discourse on commercial gentrification by adding consumers’ perspectives.

1. Introduction

Urban retail areas play essential roles in local economic activities. Since they are complex places that constantly change [1], studies have analyzed the evolution of retail areas [2,3], focusing on either their physical elements (size and location) or the types of goods and services traded [4,5]. Meanwhile, the recent development of the transportation system and information sharing between people broaden the spatial boundary of big retail spaces in global metropolises. These global metropolises such as New York, London, and Tokyo have emerged as economic hubs at a global level [6], which also stimulates the appearance of global mega-retail areas in these cities to accommodate global consumers [7]. As the transition of landscape in the global retail spaces is rapid, it becomes more meaningful to understand the dynamic process of the changing patterns. The Hongdae area in Seoul is an example of these mega-retail areas. It has expanded its boundary in recent decades and recently encompassed its neighboring “spin-off” retail districts: Sangsu, Hapjeong, Yeonnam, and Mangwon. During the retail spatial expansion, these areas, which were once neighborhoods with idiosyncratic identities as local neighborhoods, became similar commercial areas through Hongdae’s influence.
The transition of contemporary urban retail spaces has been understood by such diverse phenomena as commercial gentrification [8], oversaturation and franchising of businesses [9], and “boutiquing” [3]. Understanding the mechanisms of the transition of retail areas requires analysis of the experiences of influential actors in commercial areas, such as merchants, consumers, capitalists, and residents [2]. However, the lack of data has been a significant challenge in understanding the perspectives of these stakeholders; for instance, little has been studied on how consumers or producers recognize retail areas [5]. This challenge has also restricted the spatial and temporal scope of previous studies [10], which have attributed changes within a commercial area itself rather than empirical interactions between neighboring commercial districts over the long term.
However, the growing accessibility of “big data” and new methodologies has inaugurated a new era in understanding urban changes [11,12]. Recent studies have utilized online social network service (SNS) data to explore how people perceive and use urban areas [13,14,15,16]. SNS data accumulate over time through recursive interactions between stakeholders (suppliers and users of retail districts) and urban physical environments, thereby providing large-scale, long-term datasets about urban areas.
This study employs text mining to collect big text data from SNS (online blogs) and analyzes them to explore the dynamic spatial transformations and interactions across multiple adjacent retail areas. We trace the dynamic changes of five retail areas that currently function as part of a major commercial hub in Seoul—the Hongdae area (henceforth, Hongdae) and its neighboring retail districts: Sangsu, Hapjeong, Yeonnam, and Mangwon. Thus, in the context of our study, we use “retail areas” and “retail districts” interchangeably. We adopt a complex network analysis to create co-occurrence networks for the collected text data and systemically capture representative place images and user experiences in Hongdae and its neighbors.

2. Literature Review

2.1. Characterization and Transition of Retail Areas

The location, spatial organization, and interaction of urban retail areas have been studied for a long time. The “central place theory” [17] identifies the spatial arrangement and hierarchy of settlements and views urban centers as retail areas in which a variety of goods and services are traded to respond to the demand of surrounding markets. Burgess [18] described the structure of urban centers and adjacent urban areas and the process by which the land use of an existing area is replaced by another land use (the “concentric zone hypothesis”). The essential mechanism behind this urban transition is the Invasion-Succession (IS) process: the invasion of an existing residential area by a new commercial or industrial function that gradually dominates it. The IS mechanism was mainly used to understand urban change while focusing on neighborhood demographic transitions in terms of income or ethnic composition [19].
The wave of revitalization of urban centers and gentrification has significantly affected the socioeconomic landscape of retail areas [20]. Gentrifying neighborhoods often experience retail turnover [2,21]. Gentrification in retail areas generally refers to the so-called “upgrading” of local businesses targeting more affluent social strata (so-called “upward succession”), particularly (i) the expansion of service-sector businesses [22]; (ii) the emergence and increase of stylish (boutique) shops, bars, cafés, and restaurants; and (iii) the entrance of large chain stores replacing small, local stores [3].

2.2. Retail Areas from a Consumer Perspective

Consumer experiences and stakeholder behaviors characterize the physical shapes and business transitions of retail areas [23]. Consumers visiting a retail area experience unique feelings relating to a variety of consumer activities, the atmosphere of the area, and the composition of the traded products, which drive the rise and survival of culturally abundant retail areas [24]. One series of studies focuses on SNS users who capture and consume local attractions in retail areas while sharing their photos and experiences on SNSs [13,15,16]. The images shared by these SNS users become the main drivers of new visitors and capital, thus directly and indirectly affecting the quantity and quality of retail goods and services in the area.
The commercial gentrification literature focuses on the influence of middle-income and professional consumers in defining urban land uses and reinforcing gentrification [25,26]. Late gentrifiers are usually attracted to an area where early gentrifiers (often culturally affluent, bohemian-type artists) have already generated a certain aesthetic atmosphere. The new gentrifiers usually encourage the emergence of high-end shops and restaurants that meet their preferences. However, gentrified areas may lose customers and thus decline if the new atmospheres are not attractive enough. This phenomenon usually happens at the end of the gentrification process, when large chain stores replace local small shops and featured restaurants [3].

2.3. Expansion and Spatial Diffusion of Retail Areas

Changes in a retail area have spatial spillover effects on surrounding areas [27]. For example, SoHo in New York, where culturally affluent retail activities are abundant, has expanded its influence on surrounding neighborhoods, such as Chelsea, Brooklyn, and Dumbo. Regardless of whether an original, powerful retail area expands or declines over a series of spatial changes, a concomitant rise of retail functions in neighboring areas has been observed [28].
The dynamics between the original retail area and neighboring spin-off retail areas are quite complex, involving a series of socioeconomic conditions and factors, such as rent and property price [29], the prices of exchanged commodities and profit potential [30], and consumer and cultural shift [31]. Spatial homophily, a social network perspective, explains the spatial expansion and diffusion of retail activities toward neighboring areas [32]. Homophily, or assortative mixing, is a phenomenon in social networks in which people with similar characteristics are drawn to participate by peer influence and social selection [33]. In the context of how contemporary retail areas are consumed, friends share information and influence each other (mainly via online SNSs) on places to visit (i.e., spatial homophily) [32,34]. Rapid information diffusion via online blogs and SNSs between weakly tied people [35] can exert a rapid, significant influence on the expansion and diffusion of commercial activities in retail areas [36].

3. Materials and Methods

We utilized text mining and complex text-network analysis to understand temporal changes in the mega-retail area in Seoul that encompasses Hongdae and its neighboring districts. We traced consumer experiences by collecting SNS text data and analyzing the transformation of consumer experiences over time, which reveal the changes that urban areas have experienced based on people’s activities. In addition to text mining, complex network analyses with word co-occurrence networks have been widely used to derive clear images, messages, or topics inherent in text datasets [37]. These quantitatively identify important words and meaningful groups of words by exploring the relationships among words based on their usage patterns. Despite the strong potential of text-network analysis, the method has rarely been used to understand urban retail areas and their changes more systematically and quantitatively.

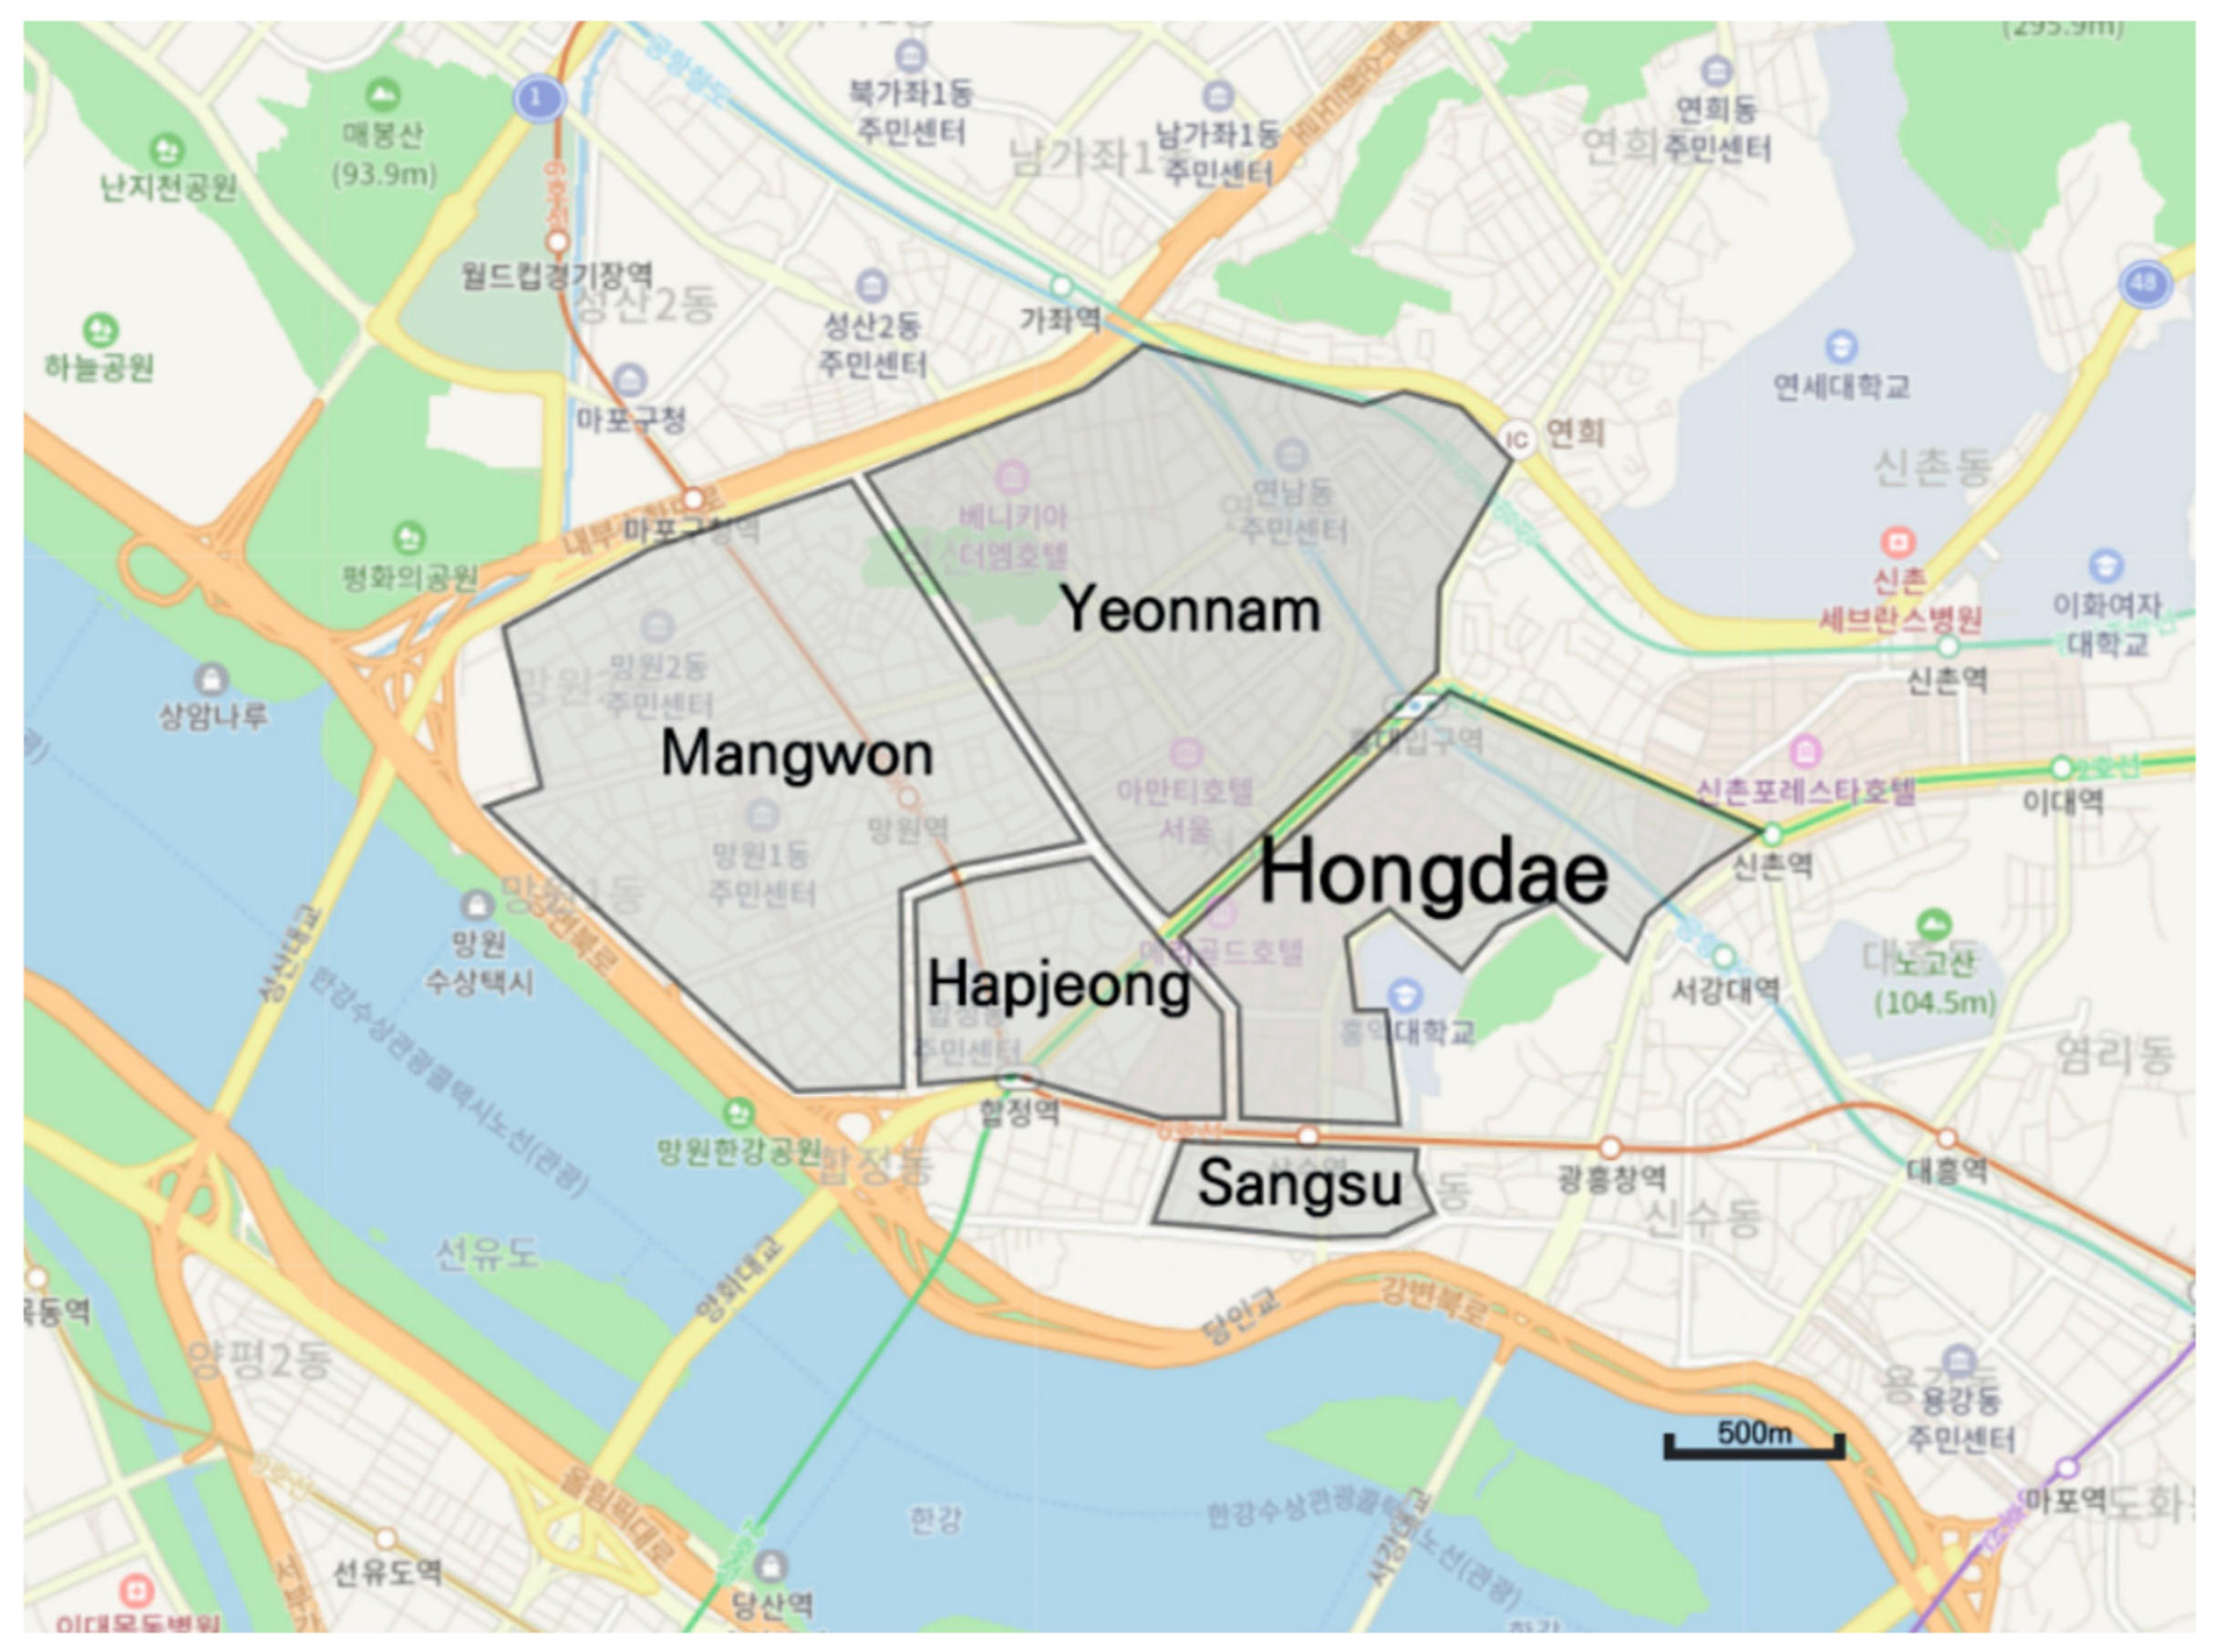
3.1. Study Area: A Brief History of Hongdae

Located in Seoul, Hongdae is one of South Korea’s major retail areas. It formed around the district in front of Hongik University (Figure 1). In the 1980s and 1990s, Hongdae was packed with private art academies and institutions related to Hongik University, which was famous for its art majors, art studios, and several live clubs that featured bands and music. With this rich cultural and artistic milieu, the unique identity of Hongdae emerged, attracting young people. In the 2000s, when Hongdae gained a reputation as a center of “Hallyu”, a wave of Korean pop music (K-pop), and a previously settled indie culture, the number of visitors increased and large-scale capital inflows emerged for new real estate development. As a result, Hongdae was rapidly commercialized and became a tourist hotspot. As the commercial value of the area increased, so did rents, which led to the relocation of existing merchants and artists who brought the unique culture and identity of Hongdae to other neighborhoods with lower rents. Earlier studies on Hongdae have interpreted this as a commercial gentrification phenomenon [38].
Not only did Hongdae’s perceived boundaries diffuse into its neighboring districts over time but also its commercial activities, which eventually led to the emergence of a mega-retail area [39]. Districts near Hongdae, such as Hapjeong, Sangsu, Yeonnam, and Mangwon, which were residential areas, started to commercialize between 2005 and 2010 and now have their own strong identities as commercial districts. The districts have become trendy places, highly sought-after by consumers. A brief introduction to each district follows.
  • Hapjeong. Hapjeong is a district on the western border of Hongdae. It is a center of traffic, with two subway lines passing through it and a bridge crossing the Han River. Many publishing companies located near the Hapjeong subway station shaped the area’s identity. The area was once busy with office workers and pedestrians catching local transportation. Around 2005, under the influence of Hongdae, cafés and live clubs gradually sprouted, and streets with cafés and small shops formed. Recently, the area has become more commercialized, with a series of large-scale real estate developments, such as a mall complex, luxury apartments, and large K-pop entertainment companies [40].
  • Sangsu. Sangsu is the district closest to Hongdae and is directly affected by its growth [38]. Many local stores, live clubs, and Hongik University buildings are located close to the Sangsu subway station. Sangsu has served as a residential district for artists, musicians, students, and merchants working in Hongdae. As Hongdae rapidly grew, many stores moved to Sangsu due to more affordable rents. The cafés and live bars that created Hongdae’s unique identity during its early days of commercialization migrated to Sangsu [38]. Various artistic and cultural activities take place there, but the area has also quickly become commercialized.
  • Yeonnam. Many Chinese immigrants used to run shops and restaurants in Yeonnam. Despite this concentration of shops, Yeonnam was a strong residential district that supported neighboring offices and universities, including Hongik and Yonsei universities. An unused railroad track there was developed into Yeontral Park in 2015 by the Seoul Metropolitan Government, which created a new public space and identity for Yeonnam. As many visitors visited the park, Yeonnam quickly commercialized [41]. Many small workshops, cafés, and restaurants have opened along Yeontral Park and in small alleys where existing residential buildings are located.
  • Mangwon. Mangwon was more residential than other districts, but since 2015, it has been rapidly commercializing. Several cafés and restaurants targeting young consumers are concentrated in this area. Rapid commercialization and gentrification have occurred in the district, starting with the area near Hongdae [40], and its accessibility to the Han River waterfront park attracts visitors.

3.2. Blog Sampling

For our analysis of Hongdae and its neighboring areas, we collected 11,615 blogs related to Hongdae, Hapjeong, Mangwon, Sungsu, and Yeonnam from the popular online Korean search portal Naver (pronounced “neighbor”). We collected text data every three years from 2004 to 2016 (2004, 2007, 2010, 2013, and 2016). Naver is the most powerful portal engine in South Korea, handling approximately 74.7% of all web searches [42] and operates various services including Naver Blog, which is one of the most popular social community platforms in Korea. On the Naver Blog platform, we searched for the district names and collected the top 1000 blogs from search results in each test year. Highly ranked blogs can be considered as representative and contain appropriate contents for the search words and have good reputations with readers. Naver has continuously updated their own algorithm based on C-rank and Deep Intent Analysis (DIA) and aimed to present the most relevant and most viewed search results in descending order [43,44] (See detailed explanation in Method S1 in Supplementary File).
Accordingly, the 1000 most highly ranked blogs were used to search the district names. Excluding blogs that were protected or non-parsable due to technical issues, around 500–700 valid blogs were found in total for each area and each year (Table 1). With the exception of Hongdae, most neighboring districts had low numbers of valid blogs in earlier years. Mangwon and Sangsu are excluded from the analysis for 2004 since each had less than ten valid blogs.

3.3. Data Analysis

The data processing and analysis were conducted as follows. See Method S2 and Method S3 in Supplementary File for detailed technical processes and mathematical definitions of indices.

3.3.1. Select Sample Words That Represent the Characteristics of Each District

We first filtered out all stop words and singled out nouns, verbs, or adjectives. We then identified the common words that represent the district. Specifically, we compared the frequency of a word i in blog j (Cij) and general blogs (the reference case) (Ci0), and we defined the relative frequency rank of each word by normalization: Cij/Ci0. We considered blogs with the search word “Seoul” as reference blogs and assumed that the Seoul-related blogs were benchmarks of general cases that contained diverse contents rather than local, specialized blogs. Through this process, we captured the words describing the characteristics and unique experiences of each district.
We finally choose the 100 most frequent words to construct a word co-occurrence network. The selected words can be categorized by their meanings. Prior to the network analysis, we conduct a simple semantic analysis by grouping the sample words into semantic categories and observing the temporal change of the categories’ proportions. Table 2 describes each semantic category and a brief explanation of the element words in each category.

3.3.2. Construct Word Co-Occurrence Networks and Identify the Backbone Network

The word co-occurrence networks show the relationships among the sample words. Word co-occurrence arises when several words appear together in a sentence, paragraph, or text unit; thus, it represents the semantic proximity of words in a linguistic sense and is often used to find word collocations [45,46]. Predicated on this concept, we constructed word co-occurrence networks by connecting all the words that occurred on the same blog in each year for each district. We also counted the number of blogs in which two words occurred together and used this as the edge weight to capture how strongly a pair of words were connected.
Since the initial networks generated were almost all-to-all networks with heterogeneous edge weights, the redundant intricacy was generated from the many connections in the networks, making it difficult to visualize or understand their structural features. Thus, we extracted a backbone network comprising only statistically important connections from the original network using the method suggested by Serrano et al. [47].

3.3.3. Measure Network Metrics and Find Community Structures in the Backbone Network

The network-analysis metrics provided a quantitative level of word structure as well as standards to identify important words and meaningful clusters of words. We recorded how collective perceptions evinced by blogs changed and identified latent topics in a large-volume blog dataset using the network metrics below. The detailed formulas and descriptions can be found in Method S4 in the Supplementary File.
The degree of a node, k, is the number of neighbors to which it connects. As a basic metric that identifies important nodes, nodes with large degrees (many neighbors) are generally understood as influential. In a co-occurrence network, the degree of a node reveals how many other words collocate with the node word.
The average clustering coefficient, c captures the degree to which the neighbors of a given node link to each other, simply showing how tightly nodes are bound to each other. For instance, highly clustered words are likely to describe a common topical issue in the blogs, so a high average clustering coefficient implies that most of a blog’s contents are related to a single common topic.
Assortative mixing, or assortativity, r, measures whether the important, higher-degree words are connected to each other (assortative case) or connected to lower-degree words (disassortative case). If words in a network show a mixed, assortative pattern, there is a stricter separation of words in a large topical group in which high-degree nodes are connected to each other and in a smaller topical group in which low-degree nodes are gathered.
The community detection method identifies optimized communities separated from the network topologies. We identified the communities by maximizing modularity. Since calculating modularity only uses connecting information (co-occurrence) between words, it is less limited to arbitrary interpretation. By investigating words comprising communities, we could analogize topics for each community and the main topics of the whole network.
Finally, our blog keyword analysis reveals trends from business establishment data in the sample areas (See Appendix S1 in Supplementary File). For example, when the word café appears more from the keyword search, the number and ratio of newly opened cafés increase. When the word appearance decreases, the number of new cafés established also decreases (Figure S1 in Supplementary File).

4. Results

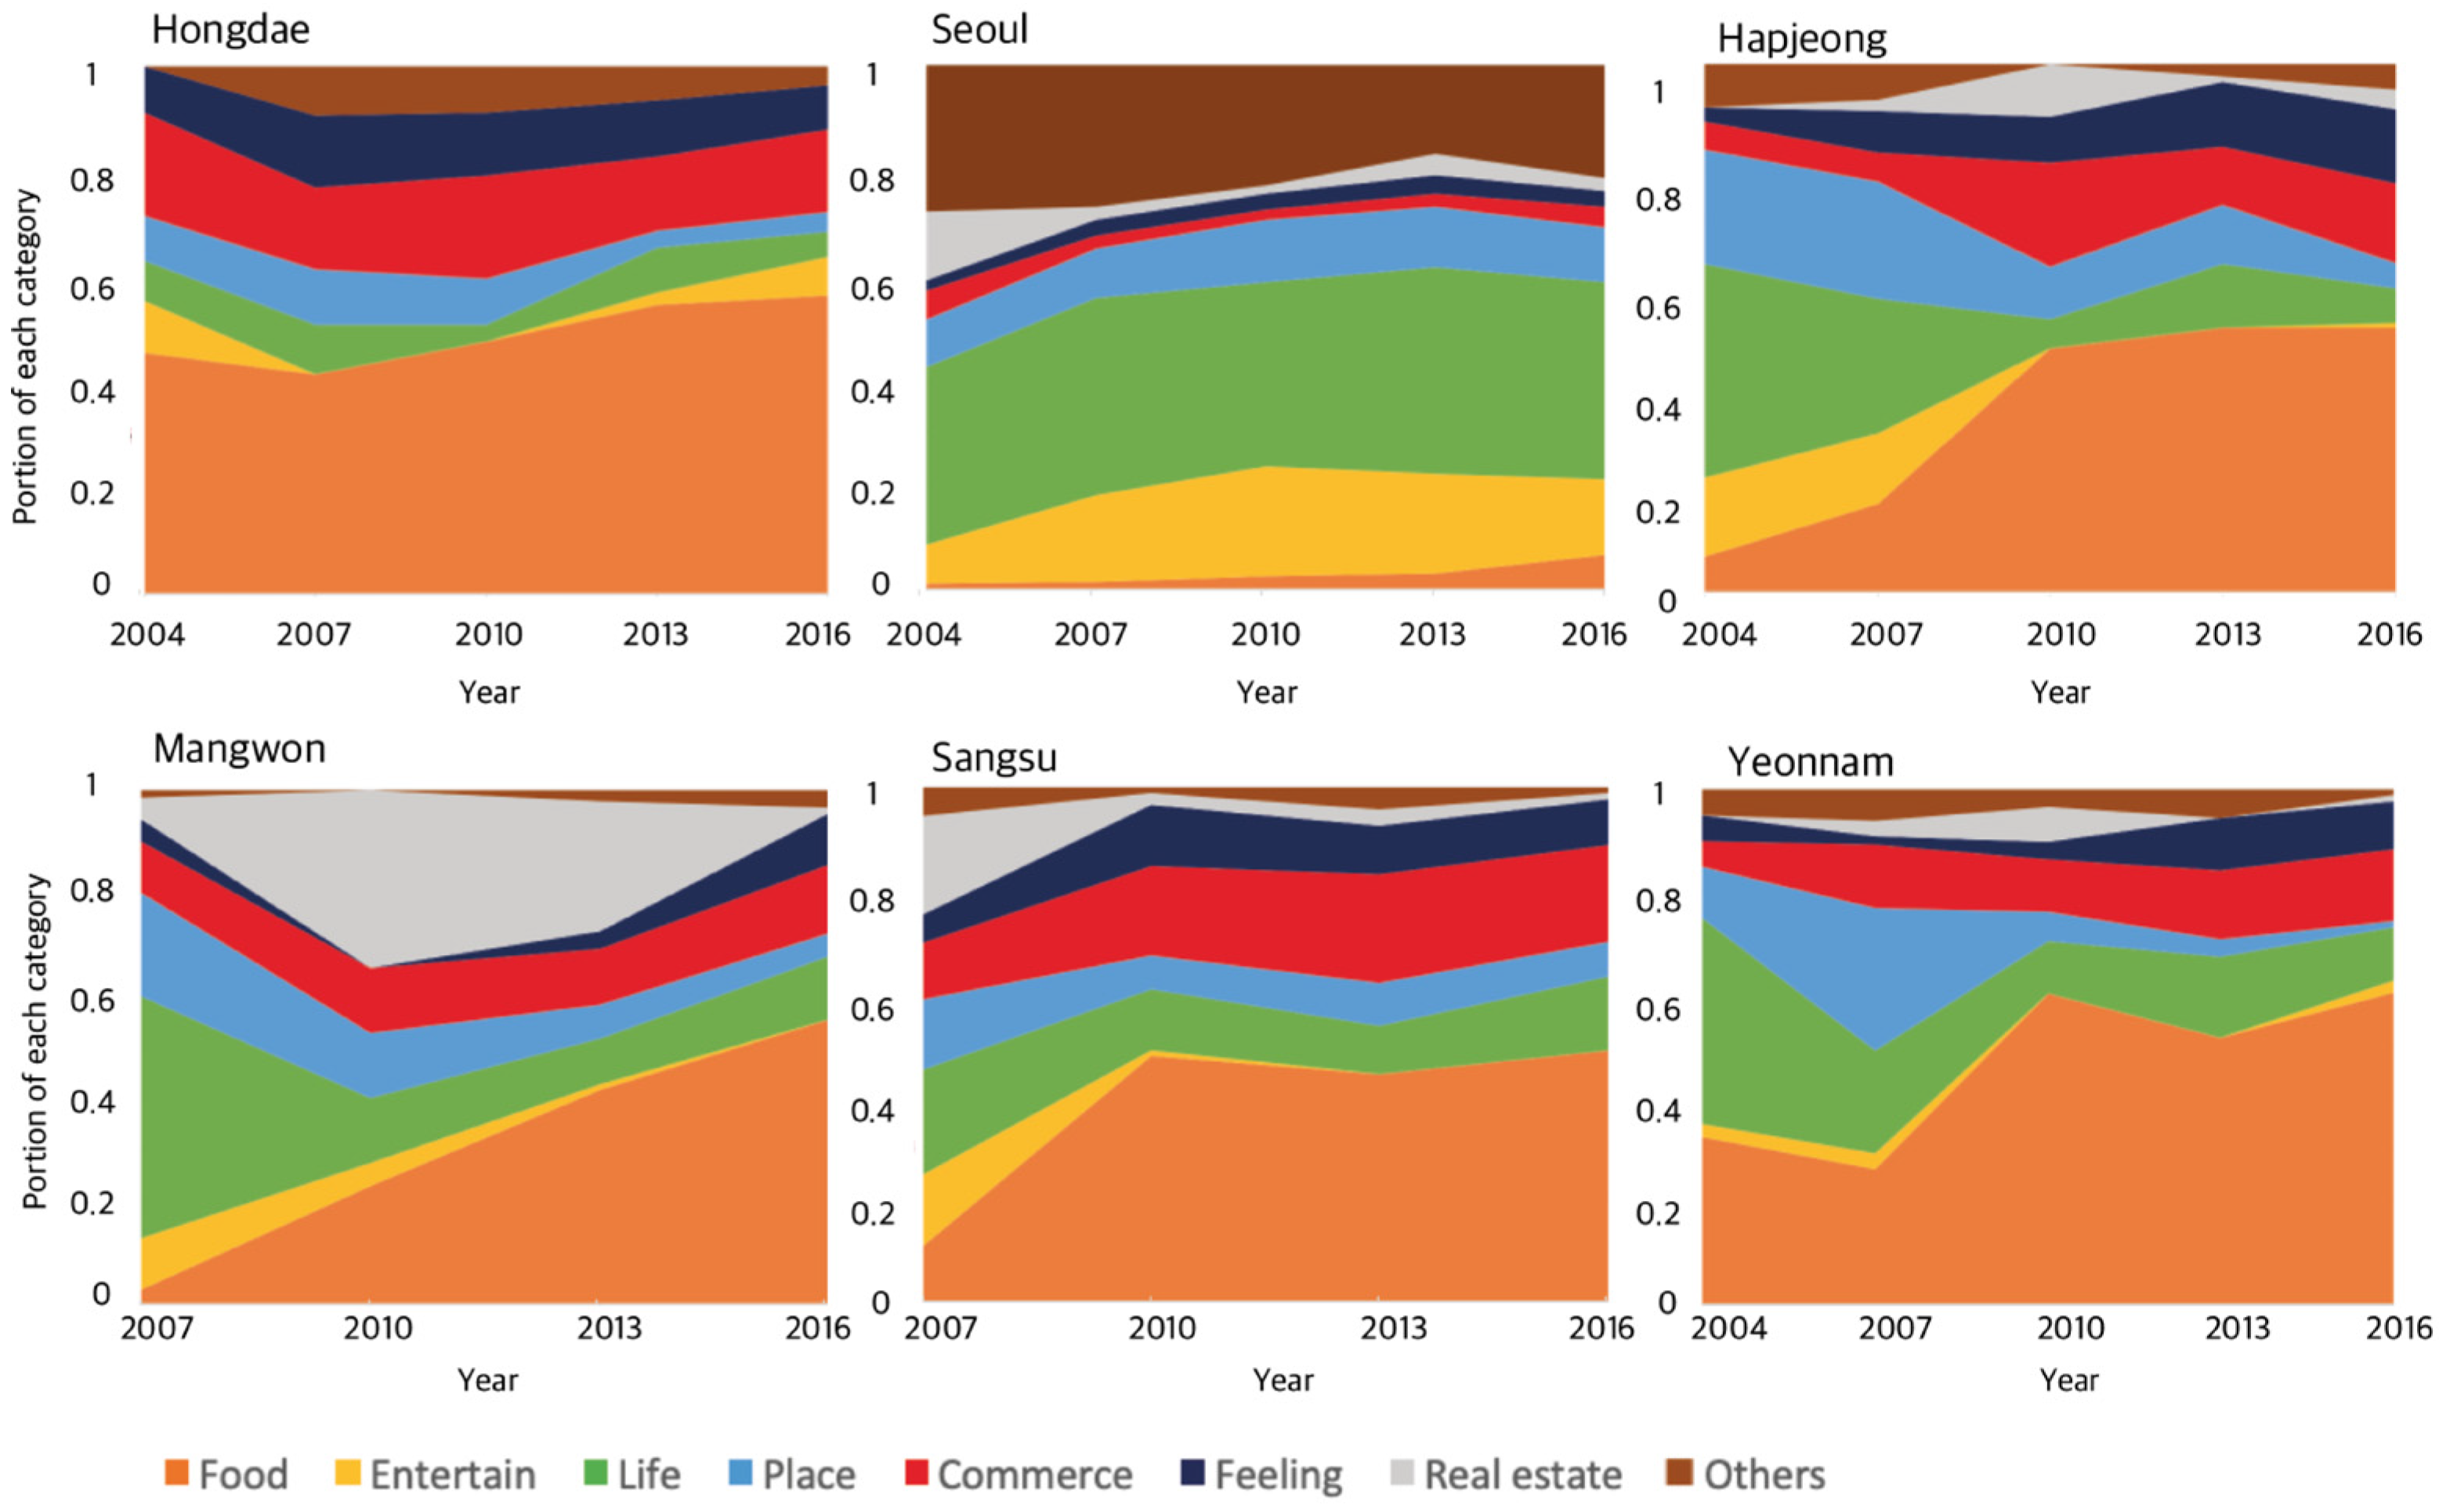
4.1. Transition of Spin-Off Districts into “Food”- and “Eat”-Dominated Commercial Areas

We identified a general pattern in which Hongdae’s neighboring districts gradually became popular commercial areas. Figure 2 presents the result of semantic analysis of sample words. For Hongdae, food-related words are continuously the largest fraction at around 40–50% over 12 years, followed by commerce-related and (daily-)life-related word categories. The ratio of each category does not change over time. Hongdae has been perceived as a commercial area specializing in restaurants and cafés since at least, or even before, 2004. The ratio in Hongdae differs from that of Seoul, where life-related words have the largest share (around 40%), suggesting that people have diverse experiences in Seoul and that no particular interest or experience represents it.
Hongdae’s neighboring districts show patterns like Seoul’s in the earlier years. Most of the frequently used words are life-related, whereas food-related words are rare in all the districts except Yeonnam. However, from 2007 or 2010, food-related topics appeared more often in the districts. Then, in 2016, the proportions of each category become like that of Hongdae. This evidence dovetails with the neighboring areas’ transformations from ordinary residential areas into commercial areas specializing in restaurants and food. The growing resemblance of all the districts is also evident in the word co-occurrence networks. The most notable change in all the networks is the way in which they become concentrated around certain high-degree nodes over time, showing hub-spoke structures in more recent years.
Table 3 displays the basic statistics of the networks for each district in each year. In the most recent year, the average weight—that is, the co-occurrence frequency of word pairs—increases in all districts. Although this is partly due to increasing blog samples over time, it is noteworthy that Hongdae, where the number of blogs does not increase much, also shows a growing weight pattern. The stronger connections are clear for the latest year (2016) than the earliest year (2004). (See Figure S2 in Supplementary File for the network visualization for 2016 compared to 2004 (Hongdae and Yeonnam)). Moreover, the more recent networks are more concentrated around several high-degree (high-strength) nodes, which are restaurant-related words. Figure 3 illustrates the distributed patterns of normalized degrees in keyword networks. The shapes of distribution curves change over time, and the curves of all the districts eventually merge into one curve in 2016, showing the growing resemblance between districts. Note that the curve of each district changes from a continuous, single power-law shape in the earlier years to a discontinuous shape divided into two parts—a high-degree regime (1) and a low-degree regime (2) in both 2013 and 2016—mostly be-cause of the rapidly increasing degrees of nodes corresponding to the first part (1). A few high-degree words in (1) are connected to almost all the nodes, and they appear in almost all the blogs in the word hub. Taken together, the evidence indicates that the blog topics have been dominated by a specific topic in recent years.
Table 4 shows the top ten high-degree nodes for each district over time to infer the main issues of each district in each year. In earlier years, the high-degree words differed by district. For instance, in 2004 and 2007, in contrast to Hongdae’s food-related words (“eat”, “café”, “price”, “menu”, “delicious”, etc.), highly ranked diverse topics represent the neighboring districts. Public transportation-related words are ranked as high-degree words in Hapjeong, reflecting its status as a popular transit hub in northwestern Seoul. The high-degree words in Mangwon include both life-related words, such as “thought”, “road”, and “person”, and specific local words, such as “Han River.” In Sangsu, the top ten words are also diverse (“time”, “Hongdae”, “university”, “café”, “Korea”, “space”, “Japan”, “journalist”, “atmosphere”, and “alley”). Yeonnam has specific food words with high degrees (“food”, “meat”, “China”, “dish”, “soup”, etc.). Specific food types (Chinese food) are mentioned, which indicates the unique status of Yeonnam as a small China town. From 2010, text networks for most districts have food- and restaurant-related words highly ranked. Of greater significance, in 2016, most high-degree words were the same in all districts. The common high-ranked words are “eat”, “menu”, “order”, “famous restaurant”, “delicious”, “sauce”, “atmosphere”, and “feeling” (underlined in Table 4). Hongdae and its neighboring areas begin to share more characteristics, weakening the original place identifiers of the neighboring districts. Overall, the concentration and hub-spoke pattern of the recent network structure are clear through quantitative network metrics: average clustering coefficient and assortativity (See Figure S3B,C and Appendix S2 in Supplementary File for the network metrics).

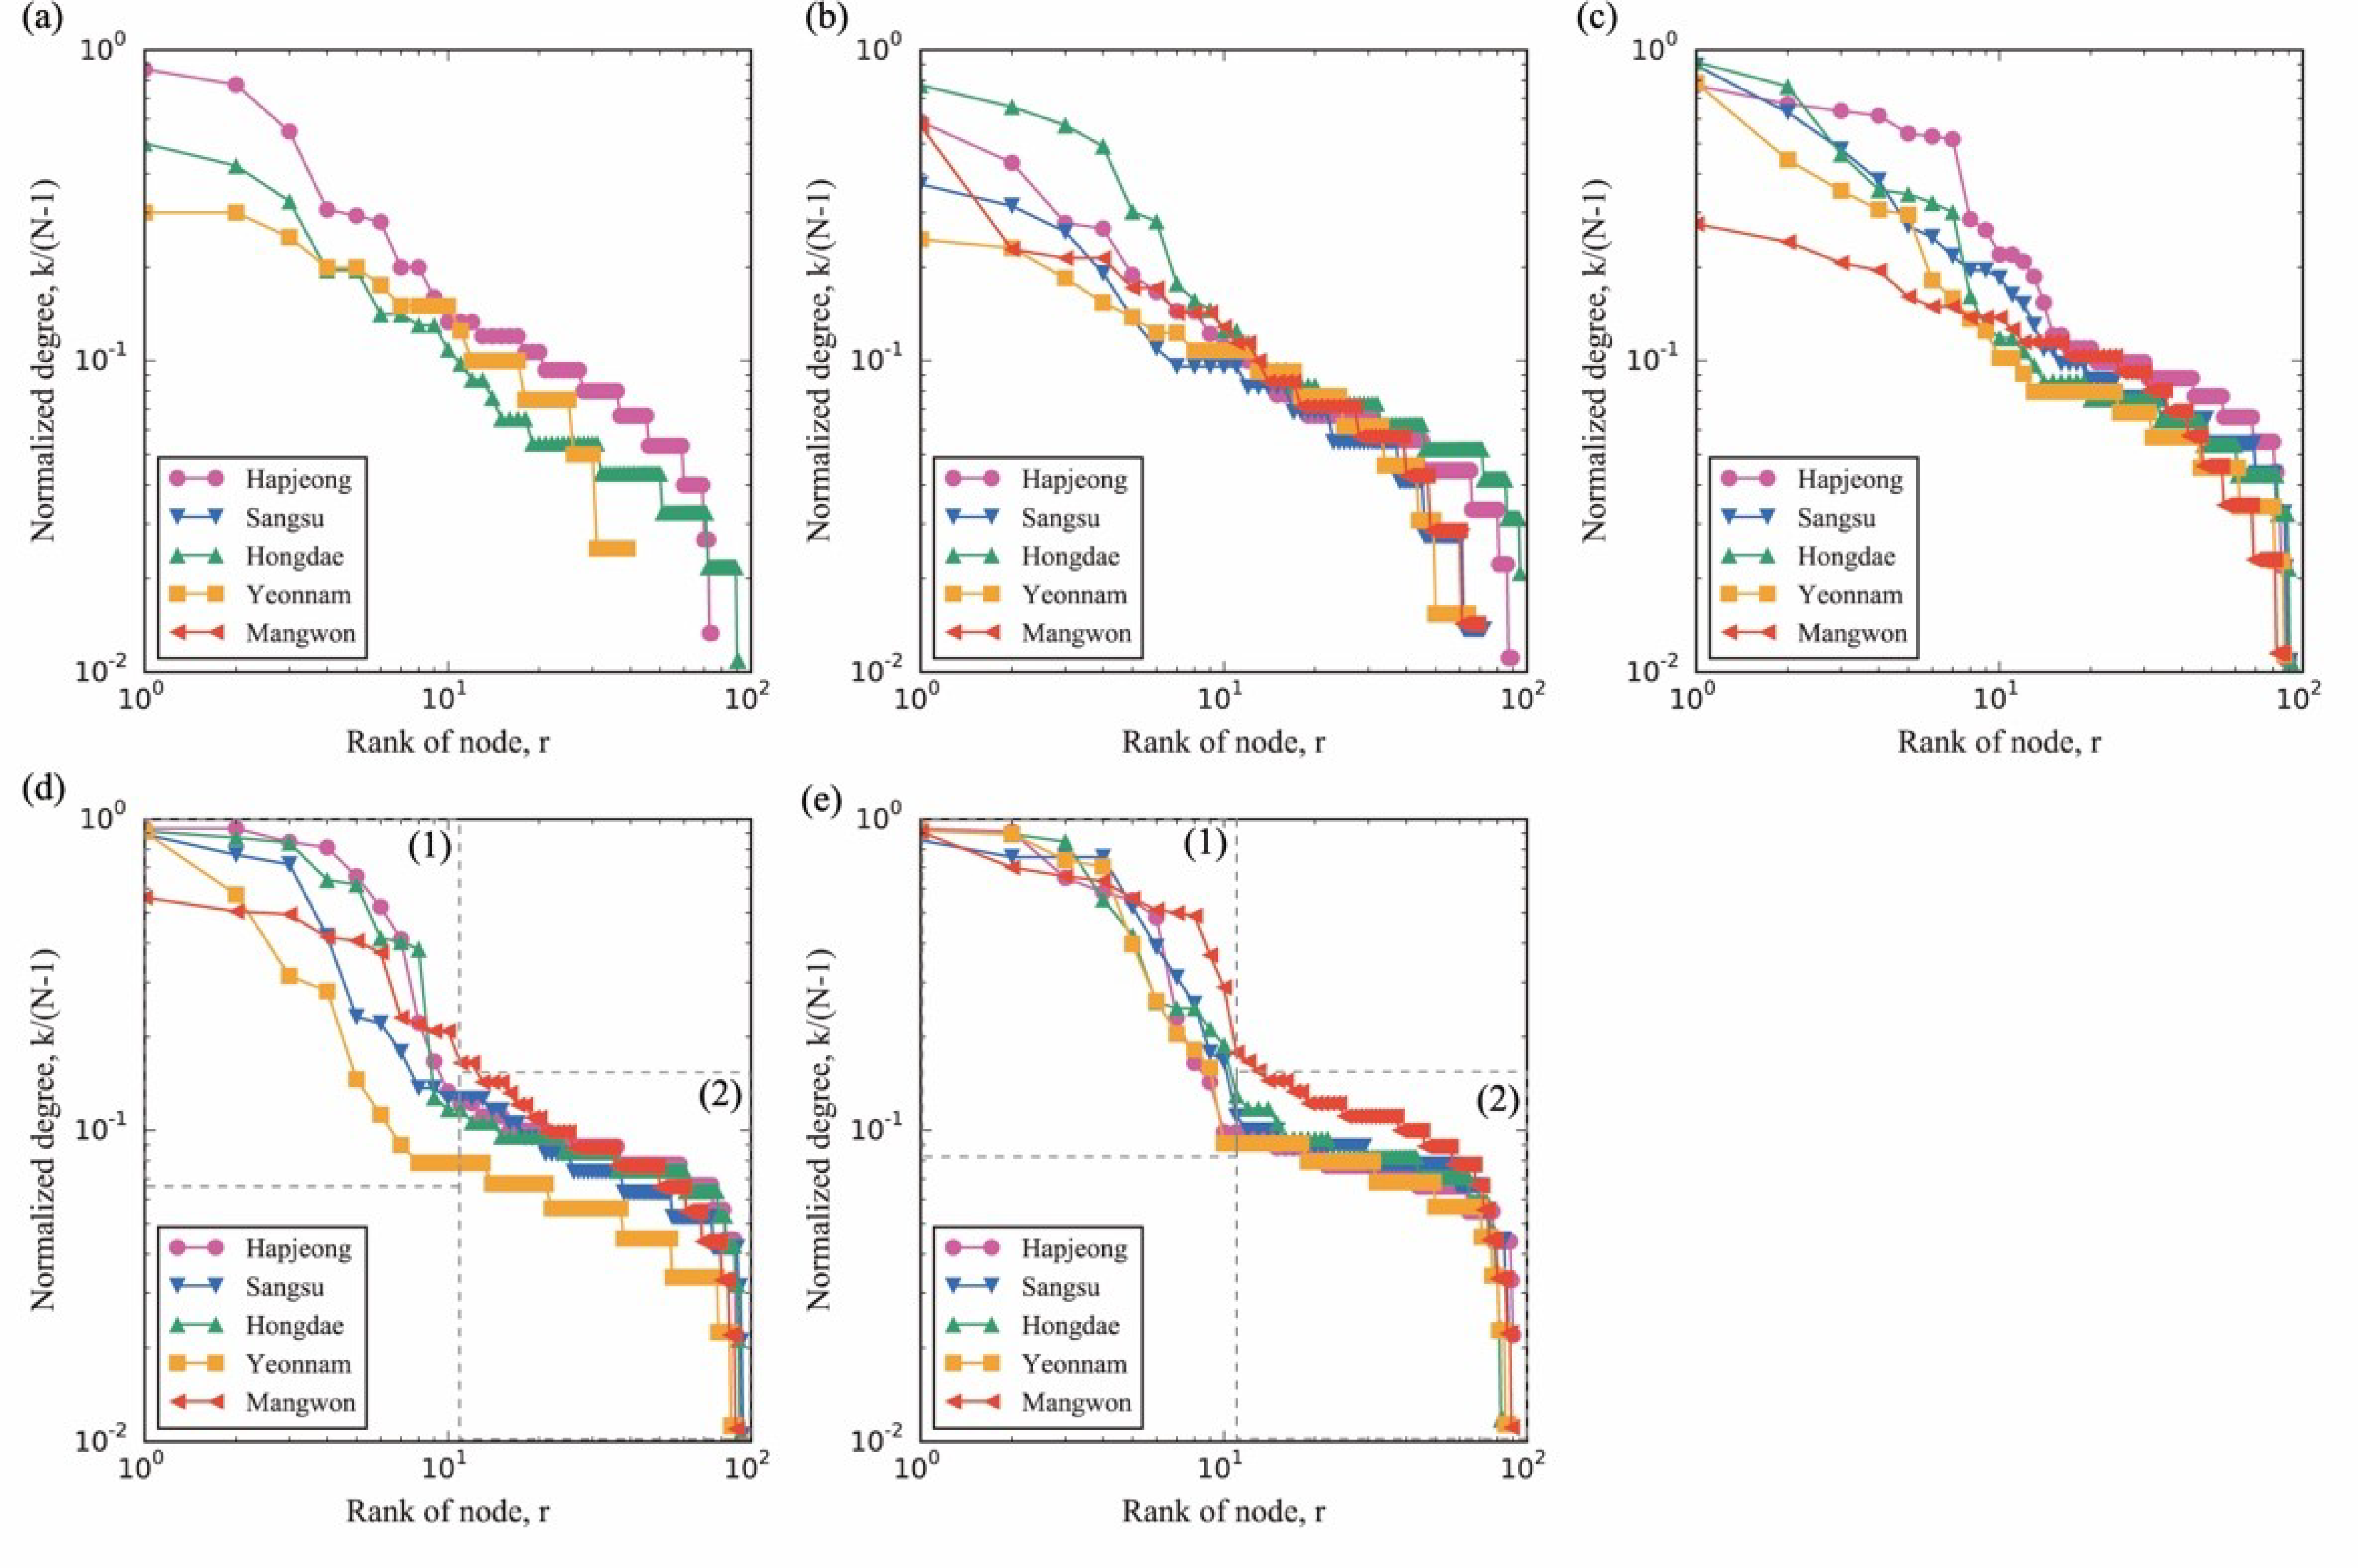
4.2. Invasion-Succession Process in the Transitions of Hongdae-Neighboring Areas

Figure 4 shows the networks with community separations of keywords for all the retail districts by using the modularity maximization method [48]. A series of networks throughout the 12 years shows the topic’s succession or transformation process over time. The common pattern in all the districts can be summarized as the weakening of the original identities of districts and the rise of the new “food, restaurant, and café” identity. In the earlier years, the network communities in all the districts show diverse topics, and communities are not clearly divided (differently colored communities of networks in Figure 4). Then, between 2007 and 2010 (varies by district), several separated communities appear, including food communities (red), and differentiation among communities becomes clearer. Around 2013 and 2016 (varies by district), the food communities eventually dominate the respective networks.
A detailed investigation of the communities supports the model of a spatial invasion and succession of food-related experiences from Hongdae into neighboring districts. First, the word “Hongdae” becomes a high-strength hub node in the food communities in most networks, especially when food communities start growing. This indicates that most food, restaurant, and café stories in the neighboring districts are mentioned in combination with the word “Hongdae”, and this tendency is stronger in the early stage of the invasion. Now “Hongdae” is mentioned less than other major food-related words. Second, the words comprising the food community in the Hongdae network are also used to describe the food communities in its neighboring districts. Lastly, the sequence of transformation among the districts is attributable to geographical proximity to Hongdae. It also shows that Hongdae’s influence has been spatially diffused. Sangsu, the closest district to Hongdae, is the first district to be transformed, while the last one is Mangwon, the farthest from Hongdae. Overall, the transformation patterns are analogous to what classical ecological land-use theory describes as a process of “invasion” and “succession” [18,49]: the food industry popular in Hongdae rapidly expands and spreads into neighboring districts (invasion) and finally transforms the whole area of Hongdae and its neighboring districts into homogenous retail areas full of consumer experiences (succession).
Under the common transformation patterns shown above, each district has experienced its own slightly different pathway. Hapjeong and Sangsu have had Hongdae-like food communities since 2010. Although Hongdae- and food-related words appear in 2007, the districts’ own identities remain strong. Hapjeong has a transportation community, while Sangsu has an art-education community. Although the food industry appears to invade and dominate around 2010, new topics coexist: Hapjeong has “real estate” (2013) and “beauty shop” (2016), and Sangsu has “beauty shop” (2013 and 2016). However, the new topic communities do not grow as much as the food communities and quickly shrink. It is also worth noting that while “Hapjeong Station” remains a hub node almost throughout, its meaning has changed to refer to a landmark that attracts people to a commercial area full of restaurants.
While Mangwon was the latecomer in becoming a restaurant district, it best fits the classical IS process. The food community appeared in its network in 2010 and dominated the network in 2016 (Figure 4). In 2010, the network was divided into two major communities: the food-related community and the real-estate-related community. The rise of the real estate community is a common phenomenon in originally residential areas (e.g., Mangwon, Hapjeong, and Yeonnam). Because Mangwon was a residential town supporting nearby areas, people from Hongdae moved to it and small, parcel-based real estate development was carried out. However, in recent years, its residential function has weakened with the explosive growth of food communities.
Since Yeonnam was famous as an old Chinese restaurant town, the earlier food communities included the words “China” and “Jajangmyeon” (a Koreanized Chinese-style noodle) in 2004. Its identity as a Chinese food community continues into 2007 and rapidly grows up to 2016. Yeonnam shows a clear community division in 2007, when the food-related community expanded, separating from the original life-related community. The influence of Hongdae is not obvious before 2013, because most words in the communities are related to Chinese food. Around 2010 and 2013, however, the food community almost dominates the entire network, and the words associated with Chinese food were eclipsed by the Western food and bakery names used in Hongdae.
Finally, the modularity network metric shows the IS process quantitatively (Figure S3A and Appendix S2 in Supplementary File). For Hongdae’s neighboring districts, the year with the maximum peak corresponds to the appearance of food communities as separate entities. The modularity decreases as strongly connected food communities dominate each network and become nearly homogenous in 2016.

4.3. Diffusion of Cultural Capital and Gentrification

Our word-by-word qualitative analysis shows evidence of the diffusion of cultural capital and commercial gentrification in Hongdae’s neighboring districts. Affluent cultural capital may become a catalyst of commercial gentrification in the area [31,38]. For example, in earlier years, the Sangsu and Hapjeong networks showed words related to indie music culture. The districts share the unique cultural image of Hongdae from its early years. While the food community expands in all the districts, some environment- and emotion-related words are in important positions, implying that the atmosphere and aesthetics that establishments create are essential points in describing the food topic. The word “alley”, for example, is common in all districts when the food communities became established, showing that people appreciate the unique atmosphere of the area’s narrow alleys and backstreets.
In addition, the emergence of stylish restaurants, cafés, and stores is a visible sign of commercial gentrification [3,22,50]. Particularly in well-known commercially gentrified areas, pioneering upscaling stores and boutiques successfully settle into signature stores, which ignites commercial gentrification, leading to an increase in similar businesses. Our blog text analysis captures the signs of gentrification dynamics. Several newly established or local signature restaurants are frequently mentioned when food communities begin to form in neighboring districts. Following “Reggae chicken” in Sangsu in 2010, “Sangsu-dong Itaeri” (“Italy” in Korean) and “Sangsu-dong French style bakery” are in the top 100 words in 2013 and “Mumalloi” in 2016. In Hapjeong, the Chinese restaurant “Mimibongwan” appeared in 2010, and the large shopping mall “Mecenapolis” was on the list in 2013. The cafés “Dongkyung”, “Hoshijeol”, “Miwanseong”, and “Tokyo Bingsu” and the restaurants “Taeyang” and “Bali in Mangwon” are listed among the top 100 words in Mangwon in 2016. Notably, such signature restaurants cannot be found in Hongdae from 2004 to 2016 because it was already a mature commercial district before 2004.
Finally, there is a noticeable transition of food types as the food community dominates the networks and gentrification expands [3,22]. The word “café” acquires a high degree of centrality (top 10 high-degree words in Table 4). Café-related words, such as “coffee” and “dessert”, are more frequently mentioned as well. Western food types also appear (pasta, steak, salad, etc.) alongside Asian food (Japanese ramen, sushi, pho, Thai food, etc.), while ordinary Korean foods (kimchi, pork belly, etc.) gradually disappear as hip restaurants and cafés target visitors rather than locals.

5. Discussion

Our long-term temporal analysis of the keyword networks illustrates the dynamic patterns of consumer experiences in Hongdae and its neighboring districts [51,52]. Our network approach effectively reveals the classical IS process of land use and user experience that has occurred throughout multiple districts in a long period of time: In specific, food-related experience has expanded the spatial boundary of Hongdae into neighboring districts. As a result, these districts, which initially had unique place characteristics of their own, have been simplified into similar kinds of retail neighborhoods, dominated by restaurants and cafés. This penetration has been followed by succession and domination, which is consistent with the IS process [18].
In addition, our results contribute to the recent commercial gentrification literature by empirically showing the diffusion of cultural capital from Hongdae which led to commercial gentrification in its neighboring districts. Our SNS data captures the retail turnover and upward succession in the neighboring districts and it is in line with the observations from the previous producer-oriented or survey-based gentrification literature [2,21,22]. The phenomenon implies that, behind the links between mobilization of cultural capital and commercial gentrification, massive information sharing through various SNSs in contemporary cities fuels cultural consumption, cultivating cultural districts. Online social networks connect people who have never met in person and encourage them to share information. The expansion of the Hongdae cultural district is partly attributable to spatial homophily, the phenomenon of people with similar characteristics being likely to gather in the same place due to social selection and peer pressure [32].
The flourishing of SNSs has led weakly-connected individuals [35] to reproduce unprecedentedly vast amounts of information, which makes peer pressure even stronger [37], possibly due to an isomorphic mechanism (imitation) [53]. Without SNSs, these newly opened small shops and cultural facilities are not likely to be well exposed. The current environment of massive information flow broadens and accelerates spatial transformations, although traditional factors (e.g., public and private investment) continue to play crucial roles in this transformation process. However, although it is undeniable that SNS and spatial changes in retail space influence each other, little has been studied for the detail mechanism of the interactions. While a development of retail spaces could be strengthened by activities on SNSs, it is also possible that negative reactions from SNS could trigger a decline in retail areas. We expect future studies investigating the dynamics between SNS and the spatial change will enrich our understanding on spatial transformation occurring in contemporary urban spaces.
Nonetheless, the transition dominated by the saturation of “eating” experience raises significant challenges for urban retail areas [8,9,54]. Expanding choices and diversity and securing business opportunities and long-term economic vitality may be conflicting values inter-linked with each other. The paradox is that an area may boom as people pursue similar experiences but could also lose vitality and decline quickly [9]. Contemporary volatile urban environments with rapid information flows require strategies to sustain long-term diversity, attractiveness, and affordability.

Supplementary Materials

The following are available online at https://www.mdpi.com/article/10.3390/su132111955/s1, Method S1. The ranking algorithms of Naver, Method S2. Identification of district-representative words, Method S3. Extraction of network backbone, Method S4. Network analysis (centrality and modularity), Appendix S1. Comparative pattern of the number of “cafe” words and the number of cafe stores, Appendix S2. Network metrics for Hongdae and its neighboring districts between 2004 and 2016, Figure S1. Temporal patterns of ratio of newly opened cafes among all stores, Figure S2. The visualizations of networks with the search word “Hongdae”, Figure S3. Network properties.

Author Contributions

Conceptualization, S.C.; methodology, S.C., M.L. and H.K.; software, M.L. and H.K.; validation, S.C. and M.L.; formal analysis, S.C., M.L. and H.K.; investigation, S.C. and M.L.; resources, S.C.; data curation, M.L. and H.K.; writing—original draft preparation, S.C., M.L. and H.K.; writing—review and editing, S.C. and M.L.; visualization, S.C., M.L. and H.K.; supervision, S.C.; project administration, S.C. and M.L.; funding acquisition, S.C. All authors contributed equally to this work and are entitled to the first authors. All authors have read and agreed to the published version of the manuscript.

Funding

This work was supported by the National Research Foundation of Korea (NRF) grants funded by the Korea government. (MSIT) (No. 2020R1A2C2008443, No. 2016R1A2B4013843).

Data Availability Statement

Not applicable.

Acknowledgments

This work was supported by 2021 Hongik University Research Fund and supports from the university during the sabbatical year (2020/21). The authors are grateful to the 2017 fall conference of Korea Planning Association participants (Korea), and the KPS 2020 Fall meeting, Korea Physics Society conference participants (Korea) for their constructive comments on the earlier versions of this paper.

Conflicts of Interest

The authors declare no conflict of interest.

References

  1. Dolega, L.; Reynolds, J.; Singleton, A.; Pavlis, M. Beyond retail: New ways of classifying UK shopping and consumption spaces. Environ. Plan. B: Urban Anal. City Sci. 2019, 2399808319840666. [Google Scholar] [CrossRef] [Green Version]
  2. Meltzer, R.; Capperis, S. Neighbourhood differences in retail turnover: Evidence from New York City. Urban Stud. 2017, 54, 3022–3057. [Google Scholar] [CrossRef] [Green Version]
  3. Zukin, S.; Trujillo, V.; Frase, P.; Jackson, D.; Recuber, T.; Walker, A. New retail capital and neighborhood change: Boutiques and gentrification in New York City. City Community 2009, 8, 47–64. [Google Scholar] [CrossRef]
  4. Guy, C. The Retail Development Process: Location, Property, and Planning; Routledge: London, UK, 1994. [Google Scholar]
  5. Guy, C. Classifications of retail stores and shopping centres: Some methodological issues. GeoJournal 1998, 45, 255–264. [Google Scholar] [CrossRef]
  6. Sassen, S. The Global City: New York, London, Tokyo; Princeton University Press: Princeton, NJ, USA, 1991. [Google Scholar]
  7. Zukin, S.; Kasinitz, P.; Chen, X. Global Cities, Local Streets: Everyday Diversity from New York to Shanghai; Routledge: New York, NY, USA, 2016. [Google Scholar]
  8. Kosta, E.B. Commercial Gentrification Indexes: Using Business Directories to Map Urban Change at the Street Level. City Community 2019, 18, 1101–1122. [Google Scholar] [CrossRef]
  9. Gebeloff, R.; Abrams, R. Thanks to Wall St. There May Be Too Many Restaurants. New York Times, 31 October 2017. [Google Scholar]
  10. Chen, S.; Tao, H.; Li, X.; Zhuo, L. Detecting urban commercial patterns using a latent semantic information model: A case study of spatial-temporal evolution in Guangzhou, China. PLoS ONE 2018, 13, e0202162. [Google Scholar] [CrossRef] [PubMed]
  11. Alessandro Araldi, G.F. Retail Fabric Assessment: Describing retail patterns within urban space. Cities 2019, 85, 11. [Google Scholar]
  12. Martí, P.; Serrano-Estrada, L.; Nolasco-Cirugeda, A. Social media data: Challenges, opportunities and limitations in urban studies. Comput. Environ. Urban Syst. 2019, 74, 161–174. [Google Scholar] [CrossRef]
  13. Boy, J.D.; Uitermark, J. Reassembling the city through Instagram. Trans. Inst. Br. Geogr. 2017, 42, 612–624. [Google Scholar] [CrossRef]
  14. Carpio-Pinedo, J.; Gutiérrez, J. Consumption and symbolic capital in the metropolitan space: Integrating ‘old’retail data sources with social big data. Cities 2020, 106, 102859. [Google Scholar] [CrossRef]
  15. Gibbons, J.; Nara, A.; Appleyard, B. Exploring the imprint of social media networks on neighborhood community through the lens of gentrification. Environ. Plan. B Urban Anal. City Sci. 2018, 45, 470–488. [Google Scholar] [CrossRef] [Green Version]
  16. Zukin, S.; Lindeman, S.; Hurson, L. The omnivore’s neighborhood? Online restaurant reviews, race, and gentrification. J. Consum. Cult. 2017, 17, 459–479. [Google Scholar] [CrossRef]
  17. Christaller, W. Die Zentralen Orte in Suddeutschland; Gustav Fischer: Jena, Germany, 1933; English Translation: Baskin, C.W. Central Places in Southern Germany; Prentice-Hall: Hoboken, NJ, USA, 1966. [Google Scholar]
  18. Burgess, E. The Growth of the City: An Introduction to a Research Project, in «The Trend of Population». Publ. Am. Sociol. Soc. 1925, XVIII, 85–97. [Google Scholar]
  19. Wei, F.; Knox, P.L. Spatial transformation of metropolitan cities. Environ. Plan. A Econ. Space 2015, 47, 50–68. [Google Scholar] [CrossRef]
  20. Schwirian, K.P. Models of neighborhood change. Annu. Rev. Sociol. 1983, 9, 83–102. [Google Scholar] [CrossRef]
  21. Pastak, I.; Kindsiko, E.; Tammaru, T.; Kleinhans, R.; Van Ham, M. Commercial Gentrification in Post-Industrial Neighbourhoods: A Dynamic View From an Entrepreneur’s Perspective. Tijdschr. Voor Econ. Soc. Geogr. 2019, 110, 588–604. [Google Scholar] [CrossRef] [Green Version]
  22. Wang, S.W.-H. Commercial gentrification and entrepreneurial governance in Shanghai: A case study of Taikang Road Creative Cluster. Urban Policy Res. 2011, 29, 363–380. [Google Scholar] [CrossRef]
  23. Mumford, C.; Parker, C.; Ntounis, N.; Dargan, E. Footfall signitures and volumes: Towards a classification of UK centres. Environ. Plan. B Urban Anal. City Sci. 2011, 48, 1495–1510. [Google Scholar] [CrossRef] [Green Version]
  24. Zukin, S. Gentrification: Culture and capital in the urban core. Annu. Rev. Sociol. 1987, 13, 129–147. [Google Scholar] [CrossRef]
  25. Ley, D. Liberal ideology and the postindustrial city. Ann. Assoc. Am. Geogr. 1980, 70, 238–258. [Google Scholar] [CrossRef]
  26. Mathews, V. Aestheticizing space: Art, gentrification and the city. Geogr. Compass 2010, 4, 660–675. [Google Scholar] [CrossRef]
  27. Allaway, A.W.; Black, W.C.; Richard, M.D.; Mason, J.B. Evolution of a retail market area: An event-history model of spatial diffusion. Econ. Geogr. 1994, 70, 23–40. [Google Scholar] [CrossRef]
  28. Hackworth, J. Postrecession gentrification in New York city. Urban Aff. Rev. 2002, 37, 815–843. [Google Scholar] [CrossRef]
  29. Smith, N. The New Urban Frontier: Gentrification and the Revanchist City; Psychology Press: London, UK, 1996. [Google Scholar]
  30. Molotch, H.; Treskon, M. Changing art: SoHo, Chelsea and the dynamic geography of galleries in New York City. Int. J. Urban Reg. Res. 2009, 33, 517–541. [Google Scholar] [CrossRef]
  31. Bridge, G. Perspectives on cultural capital and the neighbourhood. Urban Stud. 2006, 43, 719–730. [Google Scholar] [CrossRef]
  32. Zhang, K.; Pelechrinis, K. Understanding Spatial Homophily: The Case of Peer Influence and Social Selection. In Proceedings of the 23rd International Conference on World Wide Web, Seoul, Korea, 7–11 April 2014; pp. 271–282. [Google Scholar]
  33. McPherson, M.; Smith-Lovin, L.; Cook, J.M. Birds of a feather: Homophily in social networks. Annu. Rev. Sociol. 2001, 27, 415–444. [Google Scholar] [CrossRef] [Green Version]
  34. Cho, E.; Myers, S.A.; Leskovec, J. Friendship and mobility: User movement in location-based social networks. In Proceedings of the 17th ACM SIGKDD International Conference on Knowledge Discovery and Data Mining, San Diego, CA, USA, 21–24 August 2011; pp. 1082–1090. [Google Scholar]
  35. Granovetter, M.S. The strength of weak ties. Am. J. Sociol. 1973, 78, 1360–1380. [Google Scholar] [CrossRef] [Green Version]
  36. Van Dijck, J. The Culture of Connectivity: A Critical History of Social Media; Oxford University Press: Oxford, UK, 2013. [Google Scholar]
  37. Diesner, J.; Frantz, T.L.; Carley, K.M. Communication networks from the Enron email corpus “It’s always about the people. Enron is no different”. Comput. Math. Organ. Theory 2005, 11, 201–228. [Google Scholar] [CrossRef]
  38. Lee, K. Gentrification Effects: The flow of cultural refugees and making alternative places in the vicinities of Hongdae. Korean J. Urban Hist. 2015, 14, 43–85. [Google Scholar] [CrossRef]
  39. Lee, H.; Kwon, Y. Commercial Use Expansion patterns in the Cultural Quarter near Hongik University—With special emphasis on a residential district near the Cultural Quarter consisting mainly of detached, low-rise houses. J. Urban Des. Inst. Korea 2016, 17, 101–117. [Google Scholar]
  40. Cho, S. Hongik University’s Retail District is Expanding, beyond Hapjeong and Yeonnam-dong to Mangwon and Seongsan-dong. Hankyung 18 November 2014. Available online: https://www.hankyung.com/realestate/article/2014111879901/ (accessed on 25 September 2020).
  41. Yoon, H. The Fragmented New Urban Middle Class and Their Taste for Gentrified Neighborhoods: The Case of New Retail Entrepreneurs in Yeonnam-dong, Seoul. Korean J. Cult. Sociol. 2016, 22, 227–281. [Google Scholar]
  42. Choi, H.-J. Despite Controversy, Naver Posted Record Figures Last Year. Korea JoongAng Daily. 25 January 2018. Available online: https://koreajoongangdaily.joins.com/news/article/article.aspx?aid=3043805/ (accessed on 25 September 2020).
  43. Naver Search & Tech. C-Rank Algorithms That Reflect the Reliability and Popularity of Subject-Specific Sources. Available online: https://blog.naver.com/naver_search/220774795442/ (accessed on 25 September 2020).
  44. Naver Search & Tech. Introducing the Newly Applied D.I.A. Ranking for Naver Search. Available online: https://blog.naver.com/naver_search/221297090120/ (accessed on 25 September 2020).
  45. Radhakrishnan, S.; Erbis, S.; Isaacs, J.A.; Kamarthi, S. Novel keyword co-occurrence network-based methods to foster systematic reviews of scientific literature. PLoS ONE 2017, 12, e0172778. [Google Scholar]
  46. Silva, F.N.; Amancio, D.R.; Bardosova, M.; Costa, L.D.F.; Oliveira, O.N., Jr. Using network science and text analytics to produce surveys in a scientific topic. J. Informetr. 2016, 10, 487–502. [Google Scholar] [CrossRef] [Green Version]
  47. Serrano, M.Á.; Boguná, M.; Vespignani, A. Extracting the multiscale backbone of complex weighted networks. Proc. Natl. Acad. Sci. USA 2009, 106, 6483–6488. [Google Scholar] [CrossRef] [PubMed] [Green Version]
  48. Newman, M.E. Modularity and community structure in networks. Proc. Natl. Acad. Sci. USA 2006, 103, 8577–8582. [Google Scholar] [CrossRef] [Green Version]
  49. Park, R. Human Communities: The City and Human Ecology; Free Press: New York, NY, USA, 1952. [Google Scholar]
  50. Chapple, K.; Loukaitou-Sideris, A. Transit-Oriented Development & Commercial Gentrification: Exploring the Linkages; Technical Report; UCB Center for Community Innovation: Berkeley, CA, USA; UCLA Lewis Center: Los Angeles, CA, USA, 2017. [Google Scholar]
  51. Kim, H.; Cheon, S.H. Blog text analysis about consumers’ experience in Hongdae and neighboring districts. Presented at 2017 Fall conference of Korea Planning Association, Daegu, Korea, 28 October 2017. [Google Scholar]
  52. Lee, M.; Kim, H.; Cheon, S.H. The spatial transition of urban retail areas in Hongdae revealed through online SNS data. In Proceedings of the Complex Network, KPS 2020 Fall Meeting, Virtual Conference. 5 November 2020. [Google Scholar]
  53. DiMaggio, P.J.; Powell, W.W. The iron cage revisited: Institutional isomorphism and collective rationality in organizational fields. Am. Sociol. Rev. 1983, 48, 147–160. [Google Scholar] [CrossRef] [Green Version]
  54. Lee, D.H.; Lee, J.K.; Cheon, S.H. Comparison of survival rate in food service industry between growing commercial districts and declining commercial districts of Seoul. Korea Spat. Plan. Rev. 2020, 105, 65–84. [Google Scholar]
Figure 1. Map of Hongdae and neighboring districts.
Sustainability 13 11955 g001
Figure 2. Temporal semantic categories of Hongdae, Seoul, and Hongdae-neighboring areas.
Sustainability 13 11955 g002
Figure 3. Rank distribution with normalized degrees for five districts and five years. To compare the trends of networks of different sizes, the degree was normalized with the total number of nodes in a network. The normalized degree was k ˜ = k / N 1 , where N was the number of nodes. Each graph shows networks of different years (A) year 2004, (B) year 2007, (C) year 2010, (D) year 2013, (E) year 2016. In (d) and (e), (1) and (2) boxes highlight the high-degree regime and low-degree regime respectively.
Sustainability 13 11955 g003
Figure 4. Network visualization of community separation for Hongdae (a), Sangsu (b), Hapjeong (c), Yeonnam (d), and Mangwon (e). Each community is shown in different colors, and high-degree nodes are labeled so that we can infer the key topic of each community. We use similar colors in communities where many words are the same over time to visualize them more easily. For instance, food-related communities, which have been the major communities in recent years, are shown in red colors, while the communities of other topics are blue or green. Words in a group tend to co-occur more often than words in different groups.
Sustainability 13 11955 g004
Table 1. Number of blogs, total unique words, and district-representative words for each year and each district.
DistrictYearNumber of Collected BlogsNumber of Total Unique WordsNumber of District-Representative Words
Hongdae200462692533987
200763887485196
201054984235131
201361786806293
201676789345982
Hapjeong200415477875311
200726784005407
201047673373749
201369483345389
201670085955801
Mangwon2004NoneNoneNone
200715777006680
201053210,0074911
201366087445063
201675286905404
Sangsu2004NoneNoneNone
200713072335596
201045191795571
201367189826080
201676890595692
Yeonnam20043136983211
200714976496266
201048995015948
201357087755935
201676788175684
Table 2. Description of the semantic categories.
LegendDescription
FoodFood-related verbs (Eat, Drink, Cook, etc.), adjectives (Delicious, Sweet, Spicy, Salty, etc.), food names (Pizza, Chicken, Pork belly, Sushi, Wine, Shrimp, etc.), food-related places (restaurant, pub, café, etc.)
EntertainEntertainment-related verbs (Play, Travel, Date, Hike, etc.), nouns (Bicycle, Music, Movie, Art, etc.), entertainment-related places (Club, Han River, Park, etc.)
LifeTime-related words (Today, Recent, Dawn, Weekend, Afternoon, etc.), people-related words (Human, Friends, Man, Family, Child, Mother, Missionary, etc.), daily life–related words (Take a photo, Find, Workplace, Prepare, Start, Go down, Hospital, etc.)
Transport and PlaceTransport-related words (Bus, Subway, Parking lot, Hapjeong Station, Road, Yanghwa Bridge, etc.), area names including district and building names (Seokyo-dong, Shinchon, Mesenatpolis, etc.), other place words (Nearby, Alley, Exit, Entrance, etc.)
CommerceCommerce-related words except for explicit food industry–related ones (Price, Beauty shop, Store, Cheap, Expensive, Owner, Open, Sell, Customer, Seat, Table, etc.)
FeelingEmotional adjectives (Happy, Bad, Tired), descriptive adjectives (Pretty, Warm, Neat, Famous, Various, Cute, Big, Young, Unique, etc.), emotion-related nouns (Mood, Atmosphere, Mind, Feeling, etc.)
Real estateReal estate business–related words (Apartment, Multiplex house, development, Construction, Deposit, Newly built, Trade, Living room, Rent, Floor plan, etc.)
OthersOther nouns, verbs, and adjectives
Table 3. Basic network statistics for all networks. N: number of nodes; m: number of edges; ρ : network density; s : average strength; k : average degree; w : average edge weight.
DistrictYearNm ρ s k w
Hongdae2004922940.07133.336.3920.86
2007964580.10469.929.5449.25
2010934440.10525.429.5555.03
2013945730.13807.8112.1966.26
2016854720.13933.9111.1184.09
Hapjeong2004753390.12135.659.0415.01
2007903280.08123.827.2916.99
2010915560.14362.0912.2229.63
2013905680.14870.4412.6268.96
2016925020.121230.5911.03111.54
Mangwon2007702000.0851.865.719.07
2010872890.08123.036.6418.52
2013914560.11364.7010.0236.39
2016906070.15943.6713.4969.96
Sangsu2007731790.0740.364.908.23
2010924470.11262.919.7227.06
2013954770.11556.5510.0455.42
2016905150.13932.1611.4481.45
Yeonnam200440880.1129.004.406.59
2007651490.0750.314.5810.97
2010883400.09246.937.7331.96
2013893140.08590.277.0683.65
2016884490.12957.4310.2093.82
Table 4. Top 10 high-degree nodes for the five districts and five years.
YearDistrictWords (in Order of Degree Rank)
2004Hapjeongtime, Hapjeong Stn., person, subway, line 2, street, park, Han River, use, bus
Hongdaeeat, menu, price, atmosphere, Alley, Food, Meat, music, Hongdae gate, Sauce
Yeonnamperson, eat, food, restaurant, kids, time, thought, dish, customer, by oneself
2007HapjeongHapjeong Stn., time, Hongdae, exit, seat, bus, Han River, park, price, entrance
Sangsutime, Hongdae, university, café, Korea, space, Japan, atmosphere, journalist, alley
Hongdaeeat, menu, delicious, café, price, coffee, alley, atmosphere, seat, store
Yeonnamstreet, food, meat, China, district, dish, mind, soup, dumpling, Yeonhee-dong
Mangwonthought, person, Han River, district, road, first time, kids, mind, wind, seat
2010HapjeongHapjeong Stn., eat, café, menu, exit, Hongdae, alley, price, table, feeling
SangsuHongdae, eat, menu, café, seat, price, alley, order, delicious, atmosphere
Hongdaeeat, menu, order, alley, price, café, seat, delicious, feeling, coffee
Yeonnameat, menu, price, food, Hongdae, meat, seat, restaurant, China, sauce
Mangwoneat, price, won, menu, Han River, delicious, recently, lease, private use, food
2013Hapjeongeat, Seokyo-dong, menu, delicious, famous restaurant, price, atmosphere, friend, order, café
SangsuHongdae, eat, delicious, menu, order, atmosphere, feeling, Sangsu Stn., food, female
Hongdaeeat, menu, order, Seokyo-dong, thought, delicious, feeling, price, famous restaurant, atmosphere
Yeonnameat, menu, order, Hongdae, food, delicious, meat, store, recommendation, snack for drink
Mangwoneat, price, delicious, menu, famous restaurant, today, order, meat, new building, walking distance
2016Hapjeongeat, menu, order, Hapjeong Stn., famous restaurant, atmosphere, delicious, feeling, sauce, meat
Sangsueat, menu, order, manual, famous restaurant, Hongdae, delicious, feeling, sauce, food
Hongdaeeat, menu, order, famous restaurant, delicious, atmosphere, sauce, friend, feeling, price
Yeonnamorder, menu, famous restaurant, atmosphere, feeling, sauce, price, food, meat, table
Mangwonmenu, order, feeling, famous restaurant, table, café, store, seat, atmosphere, price
Note: The highlighted and underlined words appear in all districts in 2016.
Publisher’s Note: MDPI stays neutral with regard to jurisdictional claims in published maps and institutional affiliations.

