Article

Propagation of Mouth-Generated Aerosols in a Modularly Constructed Hospital Room

1
Department of Civil Engineering, Lakehead University, Thunder Bay, ON P7B 5E1, Canada
2
Department of Internal Medicine (COVID Unit), Northern Ontario School of Medicine, Thunder Bay, ON P7B 6V4, Canada
*
Authors to whom correspondence should be addressed.
Sustainability 2021, 13(21), 11968; https://doi.org/10.3390/su132111968
Submission received: 23 September 2021 / Revised: 21 October 2021 / Accepted: 25 October 2021 / Published: 29 October 2021

Abstract

:
Modular construction methods have been widely used in the civil engineering industry due to ease of assembly, the convenience of design, and allowing for flexibility in placement while making the construction more sustainable. With the increasing number of COVID-19 cases, the capacity of the hospital is decreasing as more intensive care units (ICU) are allocated to COVID-19 cases. This limited capacity can be addressed by using modular construction to provide field hospitals. This paper adopts transient Lagrangian computational fluid dynamics simulations to investigate the importance of having an appropriate ventilation system in place to ensure sustainable infection control against airborne viruses and pathogens within a modular room. The performance of having a ventilation system using 10, 20, and 40 air changes per hour (ACH) was examined. In addition, different room configurations were also compared to provide useful guidelines for air conditioning units placement. It was determined that as the ACH rate increases while maintaining a direct flow field between the inlet and outlet, the rate of aerosol removal increases. Furthermore, the flowfield in which can be controlled by the placement of the inlet and outlet can impact the removal of aerosols, as it dictates how far the droplets travel before being removed from the enclosure.

1. Introduction

In late 2019 and early 2020 an identified coronavirus, COVID-19, has caused a pandemic globally. Coronaviruses are a family of viruses that are considered contagious and cause respiratory illnesses [1]. As of April 2021, the total number of COVID-19 cases in Canada has exceeded a million [2]. This can be attributed to the vigorous spread of virus particles through the patients’ mouth-generated aerosols (i.e., coughing and sneezing) and then be inhaled by another person. Pathogens and viruses are carried by airborne aerosols generated from sneezing or coughing. While the symptoms of coronavirus disease may appear up to 14 days after exposure, which is referred to as the incubation period, symptoms such as cough, fever, or shortness of breath may appear after the incubation period. Thus, it is important to be able to provide the medical care required to provide those in need [1], which highlights the importance of having a strong and ready healthcare system in place to combat this crisis. As the number of cases keeps on rising, the government of Canada has been working endlessly to limit the spread of the virus by implementing new laws and rules such as face mask requirements in public places and social distancing, while the hospitals are facing the challenge of the shortage in care beds, which in turn increasing the number of mortalities, especially for people who suffer from other health conditions [3]. Since the virus can be transmitted within indoor enclosures, it is vital to be able to track mouth-generated aerosols in an air-conditioned indoor environment such as hospital wards since they do not experience any increased temperatures that can lead to the evaporation of the medium carrying the pathogens which is water. Therefore, accumulation of viral loads can occur on surfaces, and the drying out process will slow. To assess the performance of the ventilation system in place, different approaches can be adopted to achieve appropriate results. Methods such as: (i) full-scale measurement, (ii) wind-tunnel testing, and (iii) numerical modelling (e.g., computational fluid dynamics (CFD)). The full-scale approach relies on a real situation where the complexity of the problem is taken into an account, although it provides less control over boundary conditions, and a finite number of measuring points, and can also be challenged by the limitations of the equipment used (i.e., use of image processing to track particles), which can be very challenging if not conducted properly. As for the wind-tunnel approach, it provides control over the boundary conditions, although it can be costly to conduct, and the limitation lies in the number of points to be monitored. On the other hand, CFD provides full-scale numerical simulations while providing comprehensive flow-field data of the investigated parameters, while having the ability to alter the design without having to construct a physical model. With the increasing number of applications, CFD has gained a lot of popularity in atmospheric and environmental processes, as the design methods advanced. CFD has been utilized in various wind engineering-related applications, including simulation of flowfield around structures [4,5], pedestrian level wind [6,7], pollution dispersion [8], and assessing the viral contamination and air quality [9,10], which is the focus of the current study. These latter applications rely on a Lagrangian approach, where a continuous phase (i.e., in this air) interacts with a discrete phase (i.e., water). The interaction does not include a reaction between the materials, but how they interact with each other in space. While in many cases, CFD can be used to understand certain behaviours and interactions between two phases (i.e., particles evaporation, break-up behaviour, and fluid film formation). This paper utilizes CFD to understand the effect of the air ventilation rate on particles destination, and the placement of the ventilation system to achieve an appropriate understanding of the mouth-generated aerosols propagation within a modular room. Many studies have adopted this approach to examine the effect of the surroundings on the mouth-generated aerosols. For instance, Blocken et al. [11] conducted a study about the effect of mouth-generated aerosols while running outdoors with the social distancing of 1.5 m, and how the pattern of running and the distance between the leading person and tailing one can impact the exposure. It was found that as the distance between the leading and tailing person decreases, the exposure increases, which leads to the recommendation of running in a segregated side by side arrangement or keeping a larger distance to avoid the exposure.
The rate at which the volume of air being exchanged which is known as air changes per hour (ACH) can impact the final position of aerosols in the ward [12]. In general, the health care system can be branched into three different components: (i) equipment, (ii) personnel, and (iii) space. As for the COVID-19 pandemic, the required equipment may include ventilators, which have been a major challenge to secure during the surge of this pandemic. Accordingly, there was a race in purchasing and producing more ventilator units to respond to this critical need [13]. As for personnel, retired doctors and nurses were asked to provide their service in addition to recruiting doctors from other specialties to cover for COVID-19 wards [14]. While for the space challenge, modular buildings can be the solution as it has the advantage of being able to be quickly transported and rapidly deployed at targeted regions. However, they need an appropriate assessment of their performance in terms of room layout and achieving proper infection control by altering the ventilation rate (i.e., ACH) of the room, and the placement of the system inlet and outlet [15]. When it comes to construction, the structural performance, sustainability, economic and social costs are important factors that aid decision-makers to proceed with a design and compare it with the conventional equivalent. Building construction relies on the extensive consumption of natural resources, which can lead to increased emissions to the environment [16]. Modular construction is an efficient building technique that utilizes pre-engineered building modules mainly volumetric units that represent structural elements of a building (typically produced off-site) that are assembled on-site to form different types of structures as shown in Figure 1a, including houses, tall buildings, and bridges. This enables the use of a wider range of materials (e.g., timber, steel, concrete, and composites) and design techniques while maintaining higher quality control on the produced structures [15]. Since components are produced off-site in factories and transported to the site destination for assembly, that helps improve the reduction in waste material, improve safety, and minimize the building time [17,18]. Moreover, using hybrid cold-formed steel modular structures can aid in increasing sustainability and structural performance while reducing cost [15]. The global market size of modular construction in 2018 was valued at 112.3 billion USD [18,19]. Modular construction (MC) provides flexibility in design and the ability to comply with different design requirements. MC can be characterized by three principles: standardization, dimensional coordination, and prefabrication. This enables construction to move from craft base to manufacturing base [17,18]. MC structures can be categorized into three main types: (i) componentized which allows for the greatest degree of design modification, however, the increasing number of components on a construction site can lead to added complexity in the design, as they require more joints, connections which increase the chance of misalignment, thus reducing the quality of the structure. (ii) Panelized (two-dimensional) which offers the capability of using a panel’s cavity for the distribution of services such as plumbing, and electrical. They also offer a better-finished product than componentized as they are less likely to have visible marking where the joints are located. (iii) Modularized (three-dimensional) 95% of the work is completed in the factory, in the case of shipping three-dimensional volumetric units that can be joined on-site, since the assembly is mostly done at the manufacturing facility [17]. While MC can be used to form structures for different purposes and uses (i.e., residential, schools, hospitals); it also provides the capability of forming a high-rise structure, such as the building of Clement Canopy in Singapore, which sets an example for one of the tallest buildings that adopted the concept of MC. The building was made using prefabricated pre-finished volumetric construction (PPVC) system. Walls, floors, ceilings are prefabricated and erected on-site, while the majority of the construction was done off-site. The structure consists of 1866 modules, assembled as two 40 story towers [20]. Bradford Royal Infirmary hospital is another example of a healthcare facility that utilized MC as the main construction method in one of its buildings. The energy efficiency and summertime overheating of the MC building have been investigated by Fifield et al. to determine the energy demand, internal temperatures, and ventilation performance. The building was airtight, unshaded, lightweight, and well-insulated. It was found that MC provides an energy-efficient and convenient solution to the increasing demand in the healthcare systems while improving the performance of the building; better design of the architectural form and mechanical systems is needed to provide a safe and comfortable summertime environment for patients and clinical staff [21]. MC methods have been numerously used after the COVID-19 outbreak. A remarkable example of that is Huoshenshan Hospital in Wuhan, which was aimed to provide 1000 hospital beds with an area of 34,000 m2. The design and construction were completed in only 10 days and were done using rapid construction and MC [14]. Container units were assembled on-site or shipped as volumetric units. The structural build-up is shown in Figure 1b.
To further maximize the use of MC for sustainable healthcare applications, an efficient assessment and prediction tool is required to be developed for simulating the airflow and tracking the respiratory droplet transfer inside a modularly designed room. This can be enabled using high-fidelity computational fluid dynamics (CFD)-based modelling, which enables the assessment of the infection control abilities in the developed system. As discussed earlier, assessment of particle transmission within a health care facility is crucial for ensuring the safety of patients. Accordingly, the current study aims at designing a modular solution for expanding the capacity of available hospitals by providing pre-engineered units that can be deployed promptly while ensuring adequate infection control within the designed facilities. The study examines the effect of changing the ventilation system efficiency by examining different levels of ACH. In addition, different locations for the ventilation units (i.e., inlets and outlets) are assessed to improve the flow circulation within the designed room. The paper is divided into five sections. Section 1 (this section) provides a review of COVID-19 and its impact on the healthcare system while providing a comprehensive literature review about MC. Section 2 focuses on the numerical model details and provides the method of assessment used in this study. Details about the validation of the adopted numerical model are provided in Section 3, while Section 4 focuses on a case study that involves the assessment of a modular room using multiphase Lagrangian CFD modelling. Finally, Section 5 concludes the results of this paper.

2. Numerical Model Details

To perform the study of aerosol transport and propagation in an air-conditioned space, a three-dimensional, transient, turbulent multiphase CFD model was developed. The numerical simulations were conducted using Simcenter STAR-CCM+ 2020.2 (15.04.008-R8), which was provided by Siemens. The simulations were performed on SHARCNET, which provides supercomputers that are efficient in performing different numerical simulations. The adopted numerical characteristics followed the study by Zhang et al. [12]. To numerically model the injection of saliva particles, a Lagrangian model was used to model the flow of liquid droplets within the air flowfield, which lasted for 1.0 s (i.e., cough duration). A discrete phase model was used to inject saliva into the domain, while the enclosure of the room was modelled using the continuous air continuum. The gas continuum consisted of air with a density of 1.18 kg/m3 at a static temperature of 18 °C, while the discrete phase of the droplets consisted of a liquid with a density of 1028.89 kg/m3 at a static temperature of 37 °C (i.e., typical human core temperature). The saliva consists of water, glycerin, and sodium with mass ratios of 1000:76:12, respectively. Since the particles generated from the mouth are typical of two main sizes (i.e., coarse and fine), two circular injectors with an area of 500 mm2 are placed in front of the mouth boundary condition. These two injectors will eliminate the uncertainty added from the break-up behavior, or having particles collide with each other upon injection if one injector was used. One injector is used to produce fine particles with a constant diameter of 5.0 μm, while the other is used to inject coarse particles following Rosin-Rammler distribution [22] with an average diameter of 170 µm, a minimum diameter of 77 µm and a maximum diameter of 737 µm. Both injectors are set to be at 37 °C (i.e., typical human core temperature) with a flow rate of 5 mg/s. Since the gravity model is enabled, particle size will impact the destination of the particles. To model human breath, a function simulating tidal breathing was used and is represented as shown in Equation (1).
v ( m / s ) = 2.9 s i n ( 1.28 t ) ,
This function is time-dependent to account for inhaling and exhaling. While during the cough, the mouth velocity becomes 10 m/s for one second. The room inlet and outlet boundary conditions vary across the studied simulations depending on the ACH rate, the room geometry, and the vent sizes of the system. The simulation duration is 80 s, where the first 20 s are discretized into 0.1 s since the cough has not been introduced to the computational domain. After this, the remaining 60 s utilize a time-step of 0.005 s to satisfy the Courant-Friederichs-Lewy (CFL) number below 1.0 [23] to ensure the convergence of the solution.

3. Validation Model

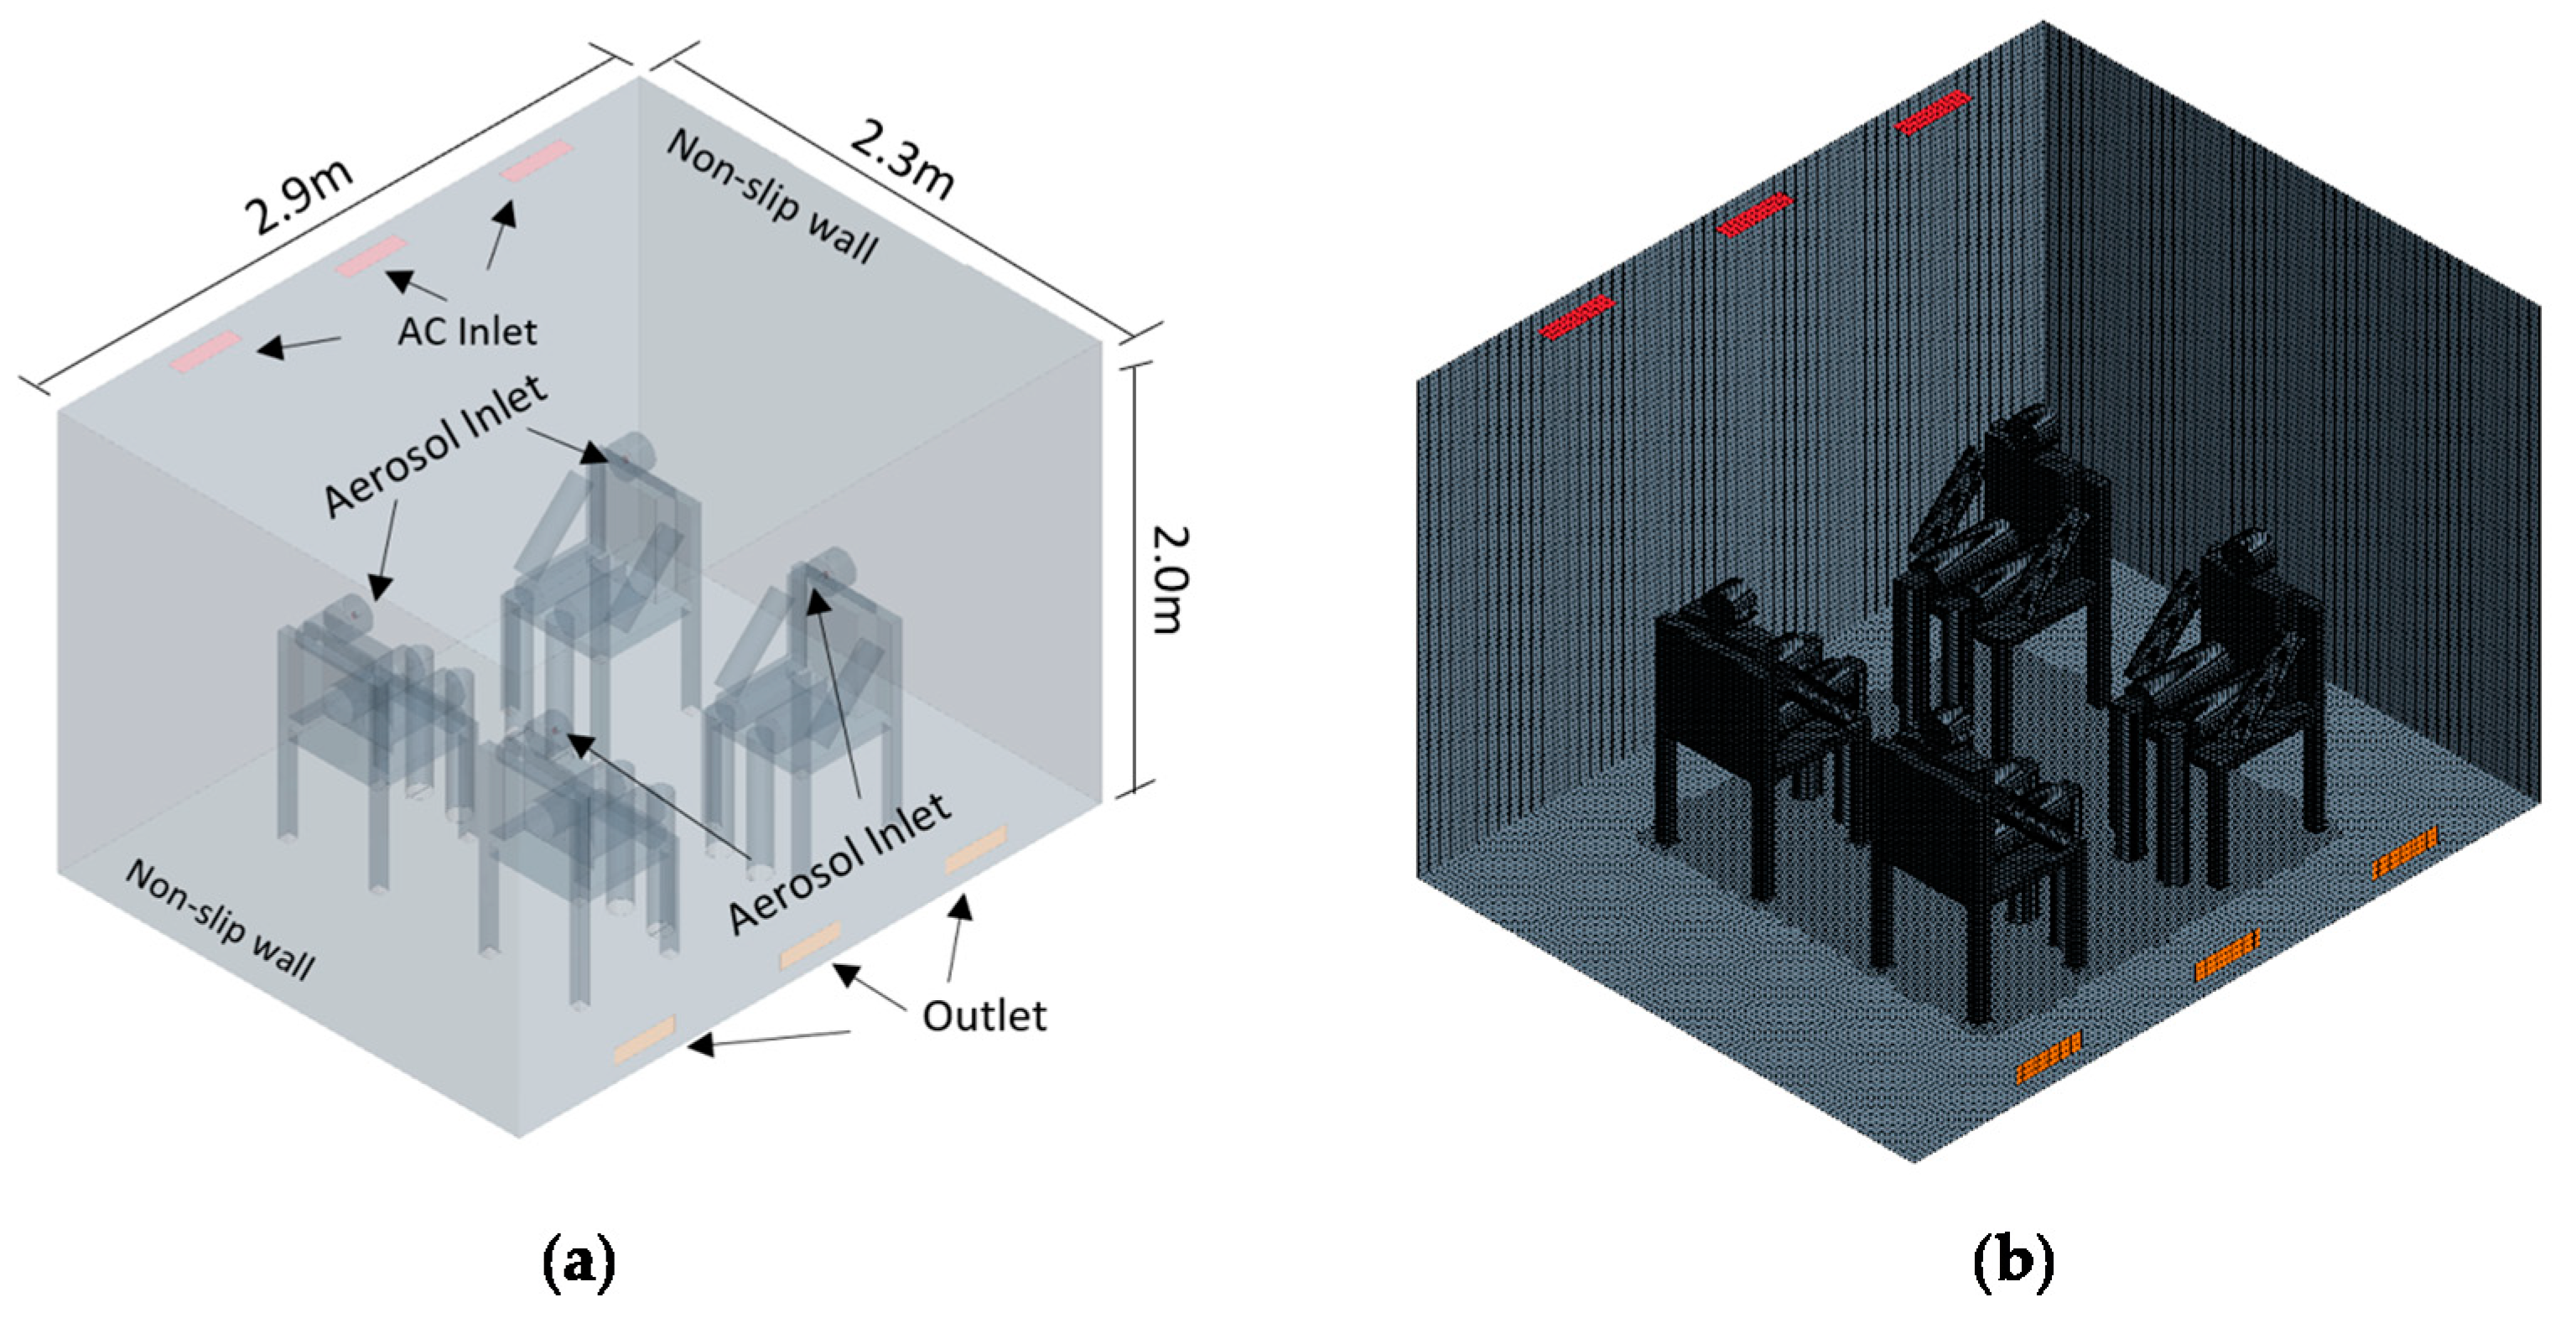
To validate the numerical models used to simulate the propagation of mouth-generated aerosol in a modular room, a study conducted by Zhang et al. [12] involving a comprehensive comparison between a full-scale experimental system and CFD simulation of an air-conditioned chamber, was used to assess the transport and the trajectory of cough-induced aerosol. The chamber geometry is 2.9 m long, 2.3 m wide and 2.0 m high, which includes four manikins sitting on chairs to simulate a gathering, as shown in Figure 2.
Following Zhang et al. [12], The study was conducted under different ACH rates (i.e., 10, 20 and 40), which reflects the quality of air ventilation of the room. The simulation included two scenarios where mouth-generated aerosols were assumed to be initiated by either manikin 1 or manikin 3 under the same ACH rates. This has been designed to examine the impact of the boundary conditions on aerosol propagation and how being near the inlet or the outlet changes the destination of the aerosols. Six models were constructed using CFD, three models involving manikin 1 coughing under different ACH rates, while the other three models involved manikin 3 coughing under different ACH rates. It was determined as the ACH increases, the stronger air movement would prevent direct aerosol inhalation under various coughing conditions. It was apparent that the mouth-generated aerosols from manikin 1 caused more aerosols inhalation under 10, 20, and 40 ACH as it is located near the inlet, with percentages inhaled of 1.96%, 0.36%, and 0.2%, respectively. While the mouth-generated aerosols from manikin 3 caused aerosols inhalation of 0.86%, 0.76%, and 0.69%, respectively. It was also observed that as the ACH rate increases, more aerosols get carried back into the recirculation system. For instance, mouth-generated aerosols from manikin 1 caused fewer aerosols to be carried out of the outlet back into the ventilation system recirculation with percentages of 4.5%, 5.8%, and 22.9%. While mouth-generated aerosols from manikin 3 were significantly more at 8.5%, 10.3%, and 32.7%, respectively, due to it being closer to the outlet. Figure 3 demonstrates the differences between aerosol percentages at different rates for both mouth-generated aerosols from manikin 1 and 3.
Based on these results, a similar room configuration was modelled, and boundary conditions were set as shown in Figure 4, using the flow characteristics described in Section 2 to validate the adopted numerical simulation using the reported experimental values.
In the validation model the mesh adopted was based on mesh sensitivity analysis conducted by Zhang et al. (2020), which was based on four different mesh densities of 1 M, 1.5 M, 2 M, and 2.7 M. It was observed that for cell number of 2 M, the solution field tends to stay stable. Thus, the computational domain was spatially discretized into hexahedral meshes of 25 mm and was further refined at the area near the aerosol injection to meshes of 10 mm, which yielded a total number of 2.5 M cells. Figure 5 shows the aerosol destination percentages calculated as the ratio between the mass of the particles passing through a boundary to the summation of the mass of the particles going through all other boundaries. While Figure 6 shows a visual propagation of the mouth-generated aerosol with time. After running the validation models, it was observed that as the ACH rate increases, a similar trend was observed as fewer particles are being inhaled, due to the influence of AC. Under 10, 20, and 40 ACH, the percent inhaled for the mouth-generated aerosols from manikin 1 was 3.13%, 2.01%, and 1.9%, respectively, while the cough from manikin 3 was 2.84%, 2.9%, and 2.34%, respectively. This variation in following a similar trend is attributed to the ability of the numerical model to monitor smaller particle sizes compared to the experimental setup, which physically measures the collected particles at the receiver’s end, in addition to the potential difference in the adopted geometry between the experimental and the numerical results. It is also worth mentioning that the quantity of aerosol collected at the outlet was observed to increase with the increase in the ACH for both the aerosol injection from Manikin 1 and 3. However, it is noted that the increase in exiting aerosols in the case of Manikin 1 compared to Manikin 3 is attributed to being nearer to the inlet of the ventilation system, which can be noticed from Figure 5.
To further understand the validation process, error quantification was done based on twelve different boundary conditions and configurations adopted in the validation. The overall average error calculated based on the percentage of aerosols was found to be 2.66%. Figure 7 shows the difference between the validation obtained in this paper compared to Zhang et al. [12] for different ACH rates and cough injecting Manican.
While the validation model yielded similar trends to the case study done by Zhang et al. [12]. It is important to note that this variation can be due to different factors (i.e., Manikin model used, humidity in the room). Since the focus of this paper is on the distribution of mouth-generated aerosols within a modular room, the humidity was not considered, as it can increase the coagulation, thus increasing the size of aerosols, which can lead aerosols to land on near surfaces.

4. Case Study and Discussion

4.1. Effect of Changing the Ventilation Rate

The geometry of a health care room is a governing aspect when assessing infection control as it dictates the required ventilation system parameters (i.e., inlet and outlet geometries and their flow characteristics). After designing the MC room, the dimensions were set to be 6.1 m long by 2.5 m wide, and 3.0 m high. The room represents the computational domain in the simulation, as the droplet transfer takes place inside the room. Figure 8 describes the room dimensions and the boundary conditions of the computational domain.
Based on the validation model and the adopted mesh sensitivity analysis, the computational domain was discretized into 3 zones according to the mesh sizes, as shown in Figure 9. Since Zone 1 is the closest to the injecting mouth, it adopted a mesh size of 10 mm, which has maintained a similar refinement to that of the validation model. While Zone 2 and 3 have adopted courser mesh sizes of 30 mm and 75 mm, respectively since they have less influence on the flow while maintaining the satisfaction of Courant number [23] below unity.
A mesh independent analysis was conducted to ensure the appropriate use of mesh sizes adopted in the simulations. Two simulations of the typical room were used with an ACH rate of 40 to conduct the mesh sensitivity analysis. The first simulation was representing coarse mesh with a base size of 75 mm, as for the fine zone, only one zone was adopted near the subject to ensure an appropriate mouth opening consistent with the original simulation. This yielded a total number of 460,000 cells. As for the finer mesh adopted, the base size used was 60 mm with two finer zones of 20 mm and 10 mm near the subject. This yielded a total of 3,860,000 cells. After processing the results, it was apparent that the mesh size adopted in the original simulation was adequate as shown in Figure 10 below. Boundary conditions across the simulation remained consistent, except for walls, ground, and outlet, this can be attributed to the mesh size being too fine or too coarse, which could cause the particles to cell skip as that violates the Courant-Friederichs-Lewy value, which ultimately alters their final position. Since the time-step remained the same across the simulation. The method of quantifying the particles near the boundary conditions depends on a surface integral function that is also linked directly to the time-step to track particles on boundary conditions. Mesh 1 represents the mesh utilized in this study, Mesh 2 represents the coarser mesh, while Mesh 3 represents the finer mesh.
There are three governing boundary conditions of concern in this simulation, which are: the mouth, the system inlet, and the system outlet. The remaining boundary conditions are set to non-slip wall conditions, as demonstrated in Figure 8. The ventilation system inlet is located at the roof of the room with two openings with dimensions of 1000 mm × 64 mm located 80 mm away from the left wall and 610 mm away from the back wall. Openings are placed 1000 mm apart from edge to edge. The velocity of the system inlet was calculated based on the ACH rate. In this case, 10, 20, and 40 ACH required velocities of 1.02 m/s, 2.04 m/s, and 4.08 m/s, respectively. The inlet was adjusted to be inclined downward at an angle of 30° from the horizontal plane. The ventilation system outlet is located on the right wall with dimensions of 2000 mm × 64 mm and placed 80 mm away from the floor and 190 mm away from the back wall. The outlet boundary condition was set as a pressure outlet with negative pressure calculated using the inlet velocity and the air density of the room to maintain constant air mass within the room. The suction pressure at the outlets was set to −0.62 Pa, −2.47 Pa, and −9.88 Pa for 10, 20, and 40 ACH, respectively. Figure 11 illustrates the distribution of the particles and their propagation over time for the ventilation case of 40 ACH.
Figure 12 illustrates the impact of the ACH rate on the destination of aerosols within the computational domain. It was apparent that more particle count is exiting the outlet with higher ACH rates. The rate at which particles were exiting through the outlet increased by 41% by increasing the ACH from 10 to 20. While increasing the rate to 40 ACH yielded a 137% increase in particles leaving the outlet compared to 10 ACH. On the other hand, particles landing on equipment decreased by 19% by increasing the ACH rate from 10 to 20, while it decreased by 25% when the rate was increased from 10 to 40 ACH.

4.2. Effect of Changing the Location of Ventilation Units

To determine the impact of changing the inlet location in the modular room, two cases of the same outlet position are to be investigated while changing the inlet position. Two ACH rates are used (i.e., 20, and 40 ACH) to enable the assessment of the performance of the placement of the vents. As recommended by the Centers for Disease Control and Prevention [24], the airflow within the room should be directed from the cleaner area towards the more contaminated area. It also recommended that the minimum required ACH rate for ICU to be 12. Since the facility is meant to be occupied by patients who are diagnosed with COVID-19, the focus of the study is to identify the room configuration that provides higher efficiency in contaminants removal by altering the flowfield. Accordingly, an ideal ventilation system for a hospital room is having an inlet near the front of the room. This is done to reduce the chances of having contaminants leaving the room. In the current parametric study, two configurations are demonstrated as shown in Figure 13, where the first case examines the inlet to be located at the bottom of the front wall, while the second case examines an inlet located at the ceiling.
In the first case (a), the inlet is located at the roof of the modular room at 80 mm away from the front wall and shaped as a rectangular vent of dimensions 2000 mm × 64 mm. While the outlet is of the same dimension and is 80 mm away from the back wall. In the other case (Case b), the inlet is located at the front wall and consists of 2000 mm × 64 mm and 80 mm above the floor, while the outlet remains at the same position. Both cases involve the study of the effect of ACH rate on contaminants removal.
After running the models, the model with the inlet at the ceiling performed the worst due to having less impact on the particles as less than 1% of particles ended at the outlet in both the 20 and 40 ACH cases. 5.7% fewer particles landed on the ground when the ACH rate changed from 20 to 40, due to the increasing suction. And since particles are required to travel further in this orientation, fewer particles were removed from the system. While the case of having the inlet at the front wall yielded the removal of at least 11% in both 20 and 40 ACH, and 22.8% reduction in particles landing on the ground when the ACH rate increased from 20 to 40 as demonstrated in Figure 14, and this can be attributed to the location of the inlet, as it can directly impact the aerosols lifting them away from the ground towards the outlet. As for the overall performance of the different configurations studied, the typical room performed the best in terms of particles exiting the domain with the removal of 11.8%, and 16.7% of aerosols through the outlet in the cases of 20 and 40 ACH, respectively. As for particles landing on the walls, the typical room observed to have decreased from 40% to 34% in the cases of 20 and 40 ACH, respectively, unlike the other configurations, where increasing the ACH rate yielded increased aerosols on walls. This can be due to having aerosols travel further in the domain, which increases the chance of particles landing on other surfaces between the inlet and the outlet.

5. Conclusions

The current study examines the effect of different ventilation levels (i.e., 10, 20 and 40 ACH) in a modularly constructed hospital room by tracking the mouth-generated aerosol. It was found that as ACH increases from 20 to 40 ACH, the ability of the ventilation system to eliminate more suspended aerosol increases, where a typical room design yielded the removal of 11.8% compared to 16.7% under 40 ACH, which results in less viral load inhaled by other patients and health workers. It was also found that most of the aerosol accumulates over wall and ground surfaces, which emphasizes the importance of continuous disinfection of these surfaces. While altering the inlet and outlet positions also impacts the aerosol destination, when having the inlet on the ceiling, the outlet performed less than 1% removal, therefore deeming the placement as ineffective. On the other hand, having the inlet at the front wall yielded as good of a performance as the typical room configuration discussed earlier, while that is true in the case of the 20 ACH rate, it is not when it comes to 40 ACH rate, as particles have to travel less in the domain in the typical room design, therefore more particles will be exiting, as the typical room at 40 ACH achieved the removal of at least 16% of the total particles that landed on surfaces. The overall recommendation is that a typical design would be sufficient in terms of the particle’s removal, there needs to be continuous disinfection. While having the inlet at the front wall yielded 16% of particles landing on the ground, which is significantly higher than other configurations. Since altering the inlet position can impact the destination of the aerosols in the domain, it is recommended to have a flowfield that has a shorter path, so particles can travel less, and also an appropriate ACH rate to achieve the desired contaminants removal. Higher ACH can yield better performance in general, although it strongly depends on inlet and outlet placement as the results suggest.

Author Contributions

Conceptualization, A.E., M.B. (Muntasir Billah) and M.B. (Mohammed Bassuony); methodology, A.E. and M.S.; software, M.S. and A.E.; validation, M.S.; formal analysis, M.S., A.E. and M.B. (Mohammed Billah); investigation, M.S. and A.E.; writing—original draft preparation, M.S. and A.E.; writing—review and editing, M.S., M.B. (Muntasir Billah) and M.B. (Mohammed Bassuony); visualization, M.S.; supervision, A.E., M.B. (Muntasir Billah) and M.B. (Mohammed Bassuony); project administration, A.E. and M.B. (Muntasir Billah); funding acquisition, A.E., M.B. (Muntasir Billah) and M.B. (Mohammed Bassuony). All authors have read and agreed to the published version of the manuscript.

Funding

This research was funded by the National Science and Engineering Research Center (NSERC)—Alliance (Grant ALLRP-2020-554557).

Acknowledgments

The authors would like to acknowledge the financial support from the National Science and Engineering Research Center (NSERC). The authors would also like to thank Siemens, SHARCNET and their excellent technical staff for facilitating access to the numerical simulation software and high-performance computing platform.

Conflicts of Interest

The authors declare no conflict of interest.

References

  1. WHO. Coronavirus. 2020. Available online: https://www.who.int/health-topics/coronavirus (accessed on 3 February 2020).
  2. Canada, P.H. COVID-19 Daily Epidemiology Update. 2021. Available online: https://health-infobase.canada.ca/covid-19/epidemiological-summary-covid-19-cases.html?stat=rate&measure=total_last7&map=pt (accessed on 28 May 2021).
  3. Shoukat, A.; Wells, C.R.; Langley, J.M.; Singer, B.H.; Galvani, A.P.; Moghadas, S.M. Projecting demand for critical care beds during COVID-19 outbreaks in Canada. Can. Med. Assoc. J. 2020, 192, E489–E496. [Google Scholar] [CrossRef] [PubMed] [Green Version]
  4. Elshaer, A.; Aboshosha, H.; Bitsuamlak, G.; El Damatty, A.; Dagnew, A. LES evaluation of wind-induced responses for an isolated and a surrounded tall building. Eng. Struct. 2016, 115, 179–195. [Google Scholar] [CrossRef]
  5. Tamura, T. Towards practical use of LES in wind engineering. J. Wind Eng. Ind. Aerodyn. 2008, 96, 1451–1471. Available online: https://citeseerx.ist.psu.edu/viewdoc/download?doi=10.1.1.1067.9754&rep=rep1&type=pdf (accessed on 3 February 2020). [CrossRef]
  6. Franke, J. Recommendations of the COST Action C14 on the Use of CFD in Predicting Pedestrian wind Environment. 2006. Available online: https://citeseerx.ist.psu.edu/viewdoc/download?doi=10.1.1.461.3813&rep=rep1&type=pdf (accessed on 3 February 2020).
  7. Adamek, K.; Vasan, N.; Elshaer, A.; English, E.; Bitsuamlak, G. Pedestrian level wind assessment through city development: A study of the financial district in Toronto. Sustain. Cities Soc. 2017, 35, 178–190. [Google Scholar] [CrossRef]
  8. Tominaga, Y.; Stathopoulos, T. CFD simulation of near-field pollutant dispersion in the urban environment: A review of current modeling techniques. Atmos. Environ. 2013, 79, 716–730. [Google Scholar] [CrossRef] [Green Version]
  9. Bhattacharyya, S.; Dey, K.; Paul, A.R.; Biswas, R. A novel CFD analysis to minimize the spread of COVID-19 virus in hospital isolation room. Chaos Solitons Fractals 2020, 139, 110294. [Google Scholar] [CrossRef] [PubMed]
  10. Szczepanik-Scislo, N.; Schnotale, J. An Air Terminal Device with a Changing Geometry to Improve Indoor Air Quality for VAV Ventilation Systems. Energies 2020, 13, 4947. [Google Scholar] [CrossRef]
  11. Blocken, B.; Malizia, F.; Van Druenen, T.; Marchal, T. Towards Aerodynamically Equivalent COVID19 1.5 m Social Distancing for Walking and Running. 2020. Available online: http://www.urbanphysics.net/Social%20Distancing%20v20_White_Paper.pdf (accessed on 3 October 2021).
  12. Zhang, B.; Guo, G.; Zhu, C.; Ji, Z.; Lin, C.-H. Transport and trajectory of cough-induced bimodal aerosol in an air-conditioned space. Indoor Built Environ. 2020. [Google Scholar] [CrossRef]
  13. Center for Devices and Radiological Health. (10 June 2021). Medical Device Shortages during the COVID-19 Public Health Emergency. 2021. Available online: https://www.fda.gov/medical-devices/coronavirus-covid-19-and-medical-devices/medical-device-shortages-during-covid-19-public-health-emergency (accessed on 23 October 2021).
  14. Zhou, M.; Chen, Y.; Su, X.; An, L. Rapid construction and advanced technology for a COVID-19 field hospital in Wuhan, China. Proc. Inst. Civ. Eng.-Civ. Eng. 2021, 174, 29–34. [Google Scholar] [CrossRef]
  15. Smith, R.E.; Off-Site and Modular Construction Explained. National Institute of Building Sciences. 2016. Available online: https://www.wbdg.org/resources/site-and-modular-construction-explained (accessed on 23 October 2021).
  16. Apuzzo, M.; Kirkpatrick, D. COVID-19 Changed How the World Does Science, Together. 2020. Available online: https://www.nytimes.com (accessed on 23 October 2021).
  17. Usefi, N.; Sharafi, P.; Mortazavi, M.; Ronagh, H.; Samali, B. Structural performance and sustainability assessment of hybrid-cold formed modular steel frame. J. Build. Eng. 2020, 34, 101895. [Google Scholar] [CrossRef]
  18. Innella, F.; Arashpour, M.; Bai, Y. Lean Methodologies and Techniques for Modular Construction: Chronological and Critical Review. J. Constr. Eng. Manag. 2019, 145, 04019076. [Google Scholar] [CrossRef]
  19. Modular 2019 Permanent Modular Construction Report. 2019. Available online: https://www.modulargenius.com/wp-content/uploads/company-info/Architect-Web-Page-Resources/2019-Permanent-Modular-Construction-Report.pdf (accessed on 23 October 2021).
  20. Zerndt, Z. The Clement Canopy, Singapore. 2017. Available online: https://www.concreteconstruction.net/ (accessed on 23 October 2021).
  21. Fifield, L.; Lomas, K.; Giridharan, R.; Allinson, D. Hospital wards and modular construction: Summertime overheating and energy efficiency. Build. Environ. 2018, 141, 28–44. [Google Scholar] [CrossRef]
  22. Rosin, P.; Rammler, E. The Laws of Governing the Fineness of Powdered Coal. 1993. Available online: https://ci.nii.ac.jp/naid/10006950361/en/ (accessed on 23 October 2021).
  23. Courant, R.; Friedrichs, K.; Lewy, H. Über die partiellen Differenzengleichungen der mathematischen Physik. Math. Ann. 1928, 100, 32–74. [Google Scholar] [CrossRef]
  24. Centers for Disease Control and Prevention. Interim Clinical Guidance for Management of Patients with Confirmed Coronavirus Disease (COVID-19). 2020. Available online: https://stacks.cdc.gov/view/cdc/89980 (accessed on 23 October 2021).
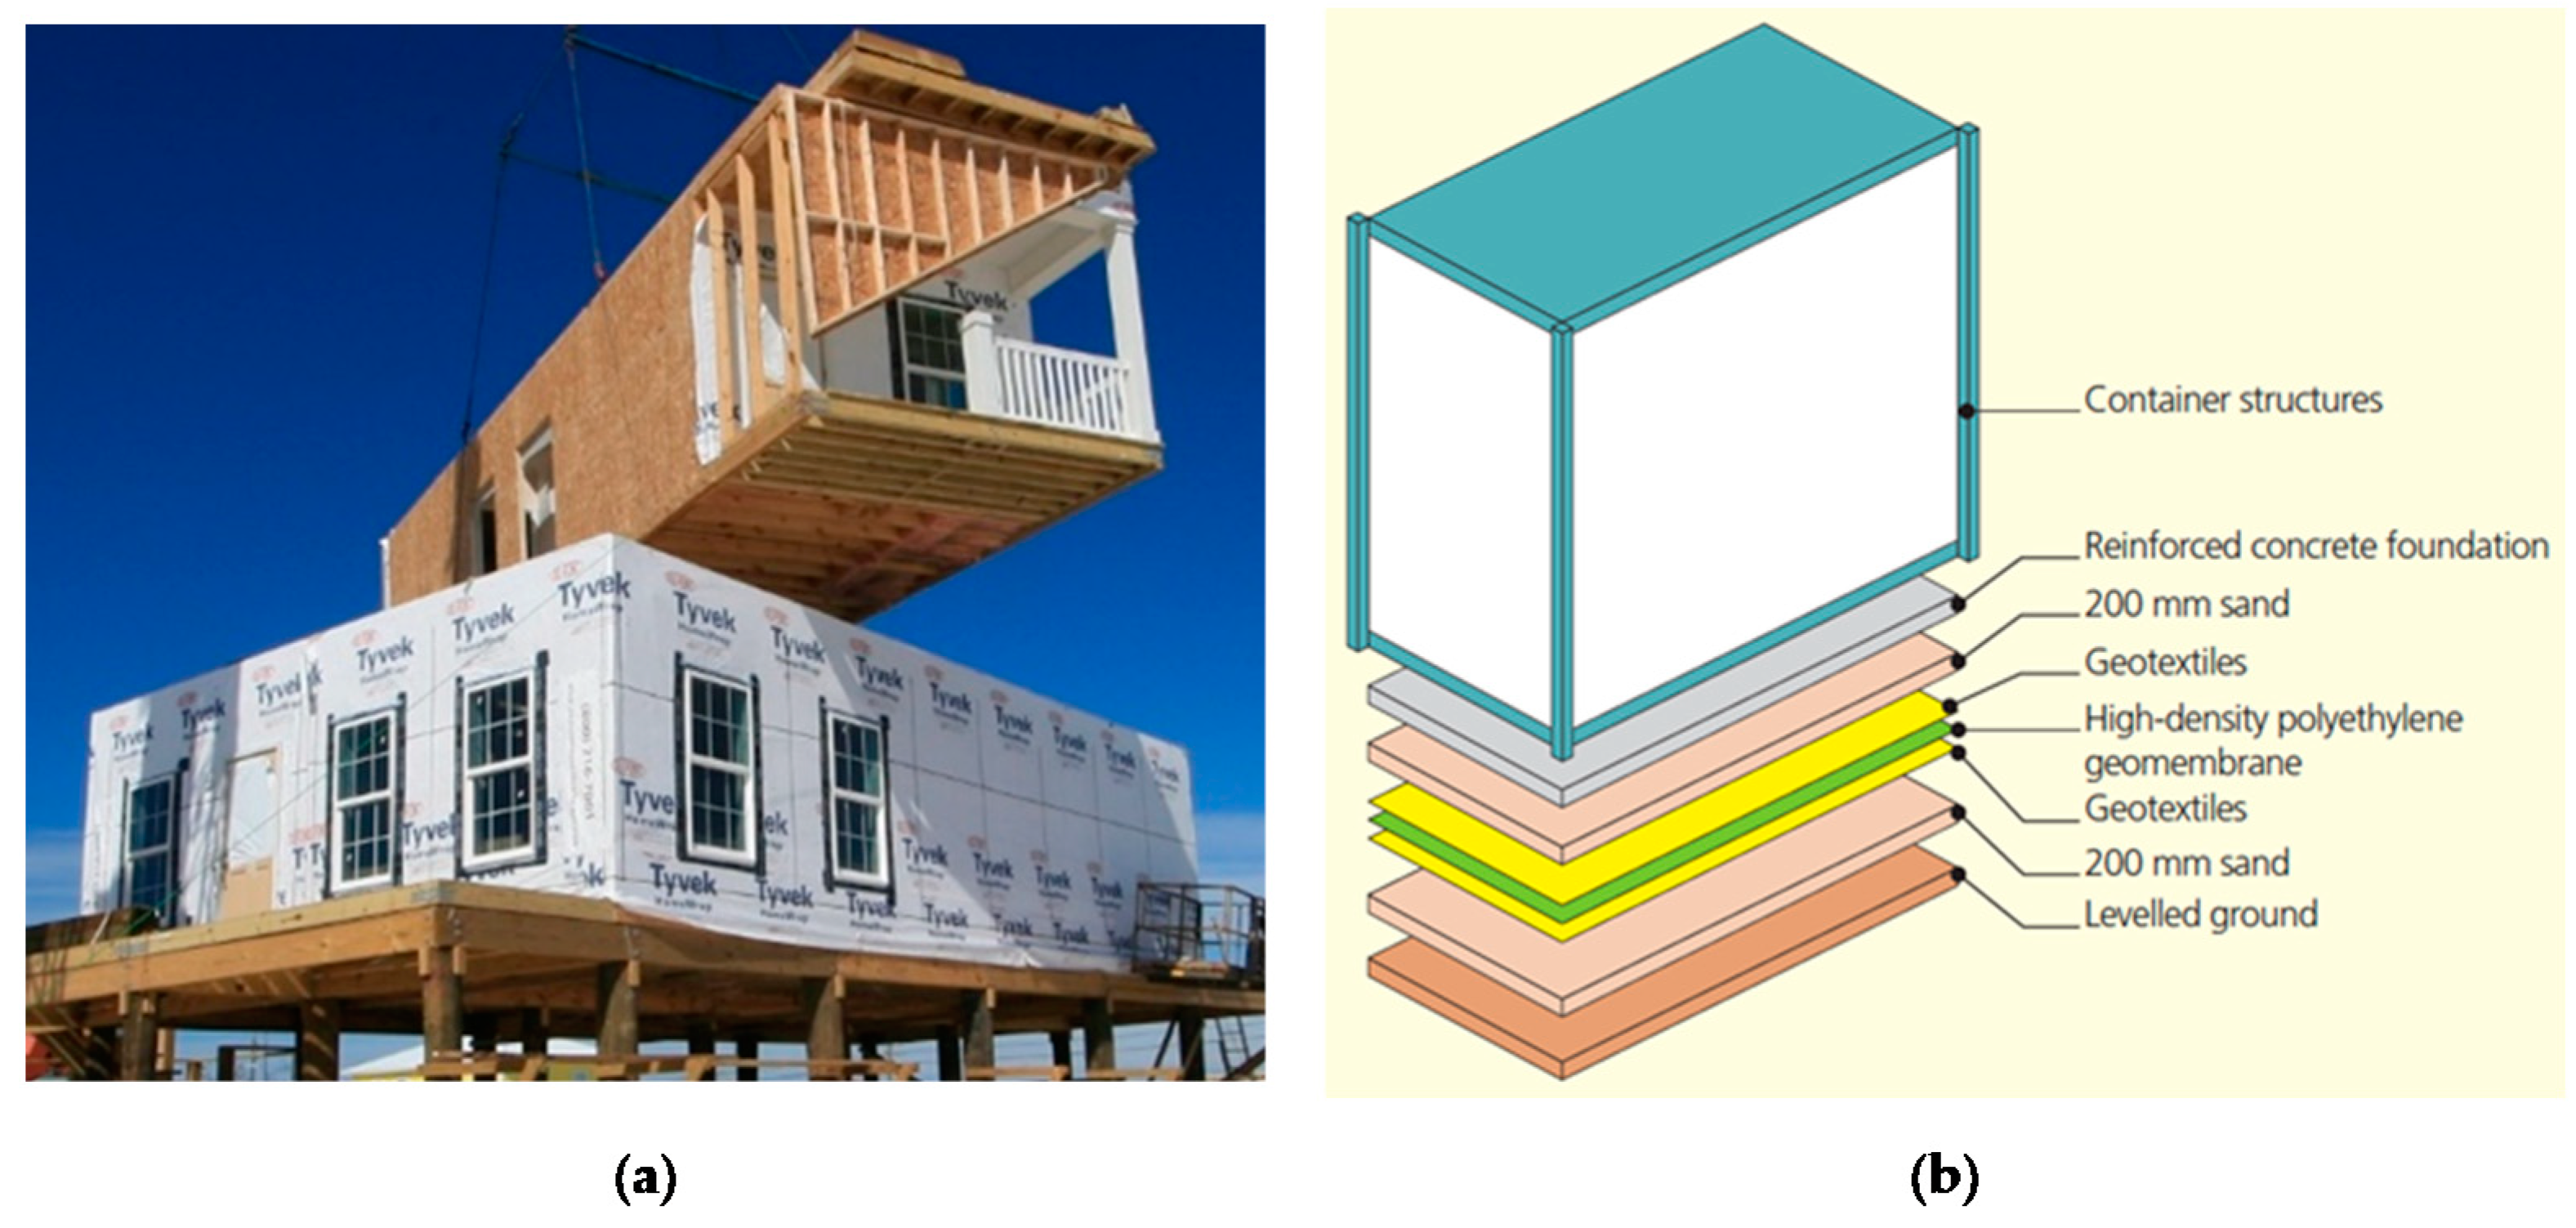
Figure 1. (a) Modular timber residential building (adopted from Modular Home Builders Association, 2021) and (b) A typical structural build-up (adopted from Zhou et al., 2021).
Sustainability 13 11968 g001
Figure 2. Geometric details of the validation model (adopted from Zhang et al. 2020).
Sustainability 13 11968 g002
Figure 3. Summary of aerosol destination of (a) manikin 1 and (b) manikin 3 (adopted from Zhang et al. 2020).
Sustainability 13 11968 g003
Figure 4. (a) Boundary conditions and (b) grid resolution used in the validation model.
Sustainability 13 11968 g004
Figure 5. Summary of aerosol destination percentage of (a) Manikin 1 and (b) Manikin 3.
Sustainability 13 11968 g005
Figure 6. Propagation of aerosol particles in the validation model with time.
Sustainability 13 11968 g006
Figure 7. (a) Manikin 1 under 10 ACH (b) Manikin 3 under 10 ACH (c) Manikin 1 under 20 ACH (d) Manikin 3 under 20 ACH (e) Manikin 1 under 40 ACH (f) Manikin 3 under 40 ACH.
Sustainability 13 11968 g007
Figure 8. Layout for the modular construction room and its boundary numerical conditions.
Sustainability 13 11968 g008
Figure 9. A volumetric representation of the finer mesh details (a) a representation of 30 mm mesh zone (b) a representation of 10 mm mesh zone.
Sustainability 13 11968 g009
Figure 10. Mesh sensitivity analysis results.
Sustainability 13 11968 g010
Figure 11. Propagation of aerosol particles in the modular room with time (10 ACH).
Sustainability 13 11968 g011
Figure 12. Aerosol distribution across the hospital room.
Sustainability 13 11968 g012
Figure 13. Boundary conditions of the parametric study where (a) represent the front wall inlet, and (b) represents the roof inlet.
Sustainability 13 11968 g013
Figure 14. Aerosol distribution within the modular room under different ACH rates and different inlet locations.
Sustainability 13 11968 g014
Publisher’s Note: MDPI stays neutral with regard to jurisdictional claims in published maps and institutional affiliations.