Article

An Agile System to Enhance Productivity through a Modified Value Stream Mapping Approach in Industry 4.0: A Novel Approach

1
Department of Mechanical Engineering, Accurate Institute of Management & Technology, Greater Noida 201306, India
2
Department of Mechanical Engineering, Indian Institute of Technology (ISM), Dhanbad 826004, India
3
Department of Materials Science and Engineering, Indian Institute of Technology, Kanpur 208016, India
4
Department of Mechanical Engineering, Main Campus, IK Gujral Punjab Technical University, Kapurthala 144603, India
5
School of Mechanical and Automotive Engineering, Qingdao University of Technology, Qingdao 266520, China
6
Department of Automated Mechanical Engineering, South Ural State University, 454080 Chelyabinsk, Russia
7
School of Mechanical and Design Engineering, University of Portsmouth, Portsmouth PO1 3DJ, UK
8
Department of Mechanical Engineering, National University of Singapore, Singapore 119077, Singapore
9
Department of Mechanical Engineering, Chandigarh University, Chandigarh, Punjab 140413, India
10
Department of Mechanical Engineering, Mangalmay Institute of Engineering & Technology, Greater Noida 201310, India
*
Authors to whom correspondence should be addressed.
Sustainability 2021, 13(21), 11997; https://doi.org/10.3390/su132111997
Submission received: 3 September 2021 / Revised: 14 October 2021 / Accepted: 25 October 2021 / Published: 29 October 2021

Abstract

:
Worldwide, industries are emphasizing the development of an agile system to sustain higher productivity, which can be applied to ensure improvements in all production conditions in industry 4.0. In the present scenario, several methods are used for improvements in production, such as value stream mapping, kaizen, just in time, Kanban, and total productive maintenance, etc., The objective of the present research article is to produce an agile system to sustain improvements in productivity through a methodology coupled with value stream mapping in industry 4.0. Value stream mapping is a lean-based method and is used for the maximization of productivity by the elimination of non-value-added activities. The proposed methodology has been validated by productivity enhancements achieved in a case study of the earthmoving machinery manufacturing sector. The study establishes that the proposed methodology would encourage industry personnel during decision-making processes, which would lead to improvements in production in industry 4.0.

1. Introduction

Industry 4.0 production is highly affected by problems and challenges encountered on the shop floor. The problems may present themselves in several forms, including lack of resources, inefficient manpower, a poor working environment, outsourcing, machinery malfunction, and lack of production planning [1,2]. To dispense with these problems, various process optimization approaches have been implemented on the shop floors of many worldwide industries [3,4]. In recent years, lean manufacturing, kaizen, six sigma, total quality management, and lean six sigma have all been implemented as process optimization approaches for improving operational performance on the shop floor [4,5]. The process optimization approaches are implemented as production non-value-added activity (NVAA) eliminators, which arise along with the decline in the level of productivity [6,7]. A process optimization approach not only eliminates NVAA but also increases productivity levels [8]. These approaches have utilized various techniques in previous research works. Figure 1 shows the various approaches used for production improvement on the shop floor.
Though all of these techniques have shown their usefulness in the improvement of productivity, value stream mapping (VSM) has proven its suitability for more complex production systems [9,10,11]. The VSM technique is highly preferred over all other process optimization techniques because other production management techniques can only be applied to eliminate certain types of NVAA [12,13], whereas VSM can be implemented to improve any type of production condition [14]. Production condition here denotes a type of problem that is responsible for lower productivity levels, which can include higher production times, lower quality, an excess of defective products, higher inventory level, mismanagement of types of equipment, and inefficient manpower [15,16,17,18]. All such problems can be eliminated simultaneously by using VSM, which is not possible by the implementation of other techniques. VSM is based on the principle of lean manufacturing, which focuses on the maximization of production by the effective utilization of available resources [19,20]. VSM also improves production and work planning; therefore, it reduces production time and focuses on sustaining product quality and diversity at a competitive cost [21].
In a detailed literature survey, it has been revealed that various researchers have proposed several methodologies for VSM-based improvements on the shop floor. They considered several working environment complexities, including bottleneck processes, work in process, worker skills, product variety, non-standardization working, and lack of resources. Singh and Singh [22] enhanced overall production by identifying the idle activities through analysis of workflow conditions on an auto-parts manufacturing unit. They observed that the identified idle activities included different processes of manufacturing, such as cutting, forging, and CNC boring, and these idle activities result in an increment in lead time (LT), cycle time (CT), and waiting time, and can result in an inventory with lower quality. They revealed that VSM can result in a remarkable reduction in the LT, CT, and work in process (WIP) inventory on the shop floor.
Kumar et al. [23] discussed the implementation of the lean-kaizen principle using VSM in a spindle kick-starter manufacturing business. In the study, two kaizen events were developed in which the poka-yoke tool was used in the first kaizen event and a brainstorming tool was used in the second kaizen event. The poka-yoke tool helps to eliminate defects by avoiding human errors, and brainstorming was used to find a solution to problems by gathering ideas. The result of the study revealed that improvements were achieved in value-added time (VAT), manpower requirements, and production LT of 75.25%, 40%, and 69.47%, respectively.
Seth et al. [24] discussed the implementation of the lean and Taguchi method in a production environment by making some modifications to the VSM. In this study, to improve the manufacturing of power transformers, a workplan map was prepared using Gemba walks and systematic questioning techniques. The result of the study revealed that overall cycle time, NVAA, and VAA were reduced by 17.3%, 29.78%, and 8.48%, respectively. Vinodh et al. [25] discussed a case study on the development of VSM for a bearing spacer manufacturing process. They prepared the current state map after making necessary observations of the shop floor. Thereafter, they identified various NVAAs in the manufacturing processes, such as cutting, plane turning, and face-to-face grinding, and improved NVAA in future state maps. The results showed that LT, TCT, WIP inventory, and defects were reduced by 376 min, 10 min, 50 units, and 156 ppm, respectively. Solding et al. [26] presented a concept for creating dynamic VSM of a system using simulation. In the study, the authors used an alterable spreadsheet to carry out the simulation, which is not possible by traditional VSM. They observed that developed simulation can be used simultaneously for more than one product. Andrade et al. [27] applied the concept of VSM to an auto parts company in Sao Paulo. In this study, waste presented in an assembly line of clutch discs was identified by mapping the current state with a reduction of 60.5 to 4.14 days in LT by the proposed state mapping. The results of the study showed that VSM with simulation is a good decision-making approach to incorporate changes in the production process. Coppini et al. [28] used software for the analysis of a gearbox production process using VSM. The result of the study revealed that a 60% reduction in LT, a 20% decrease in IT, a 56.7% improvement in productivity, and an improvement in overall equipment usage were achieved. Dotoli et al. [29] implemented a strategy integrating VSM, the Unified Modeling Language, and discrete event simulation in a forklift truck manufacturing business. The strategy was implemented for the identification and elimination of NVAA in production. In the study, large travel distances between stations, a disorganized production plan, and insufficient resources were identified as NVAAs. The result revealed that the combination of VSM, the Unified Modeling Language, and discrete event simulation allows the detection and assessment of the criticalities of the manufacturing system processes, leading to the achievement of the desired improvements. Sahoo et al. [30] addressed the implementation of lean philosophy on the shop floor of the forging industry. In this research, they suggested a systematic approach for the implementation of lean principle and pursued Taguchi’s method. The results of this study showed that they achieved a reduction in lead time of 325 min, NVAA 72 min.
Cheng et al. [31] presented the integration of the lean concept and radiofrequency identification technique to improve the efficiency of warehouse management. They used VSM to illustrate the flow of material, information, and time. The results revealed that the lean concept reduced processing time by up to 79%, and integration reduced total operation time by 87%. Das et al. [32] implemented the lean manufacturing system (LMS) to improve the productivity of air conditioning coil manufacturing. The results showed a productivity improvement in coil manufacturing by the lean manufacturing system and an improvement in setup time by the LMS tools.
So far, a methodology has been made in all the works concerned with VSM, and through this, the VSM is implemented on the shop floor. All the activities involved in these methodologies are decided before the start of production planning so that production can be thoroughly controlled. This demonstrates that VSM can be easily implemented on the shop floor by these steps, but it takes longer to prepare the methodology; additionally, it may not be applicable in the production conditions of industry 4.0. If this methodology is implemented in any other production condition, this makes it less likely that the desired results are achieved. In the detailed literature survey, it has been observed that there is a lack of a sustainable methodology that is suitable for improvements in all types of production systems in industry 4.0. The proposed methodologies have only been suitable for the limited working environment of the shop floor.
The objective of the present research article is to make an agile system to sustain enhancement in production through a methodology coupled with value stream mapping in industry 4.0. Therefore, in this article, a methodology has been developed to make an agile system to improve productivity levels in industry 4.0. Keeping all these facts in mind, in this study, the authors have proposed a modified VSM framework by developing an agile system and implemented it in an earthmoving equipment manufacturing business. To achieve the target, initially, the values of all production parameters by traditional methodology are calculated. Thereafter, the proposed methodology has been applied for the same outputs. The robustness and sustainability of the proposed methodology are analyzed based on improvements acquired by the comparison between the traditional and the proposed methodologies. The results obtained by the proposed methodology are much better than those obtained by the traditional methodology.
The developed methodology is highly beneficial for researchers and industry individuals to obtain sustainable organizational systems with minimum waste in respective shop floors for the purpose of achieving the goals of industry 4.0. The proposed methodology helps management team members to enhance operational excellence using limited resources by providing a sustainable guideline for shop floor management. This statement has been validated by implementing the proposed methodology in an actual production shop floor for the organizations who follows the concept of Industry 4.0 technologies. It has been concluded in the results that the proposed methodology can ameliorate productivity within available resources and, thus, minimizes waste, and it is further suitable for better improvement in any other type of shop floor management condition, including industry 4.0. The authors of the present research article strongly believe that the developed methodology would provide an agile system to enhance VSM performance in industry 4.0. Figure 2 illustrates the proposed methodology with applications in industry 4.0.

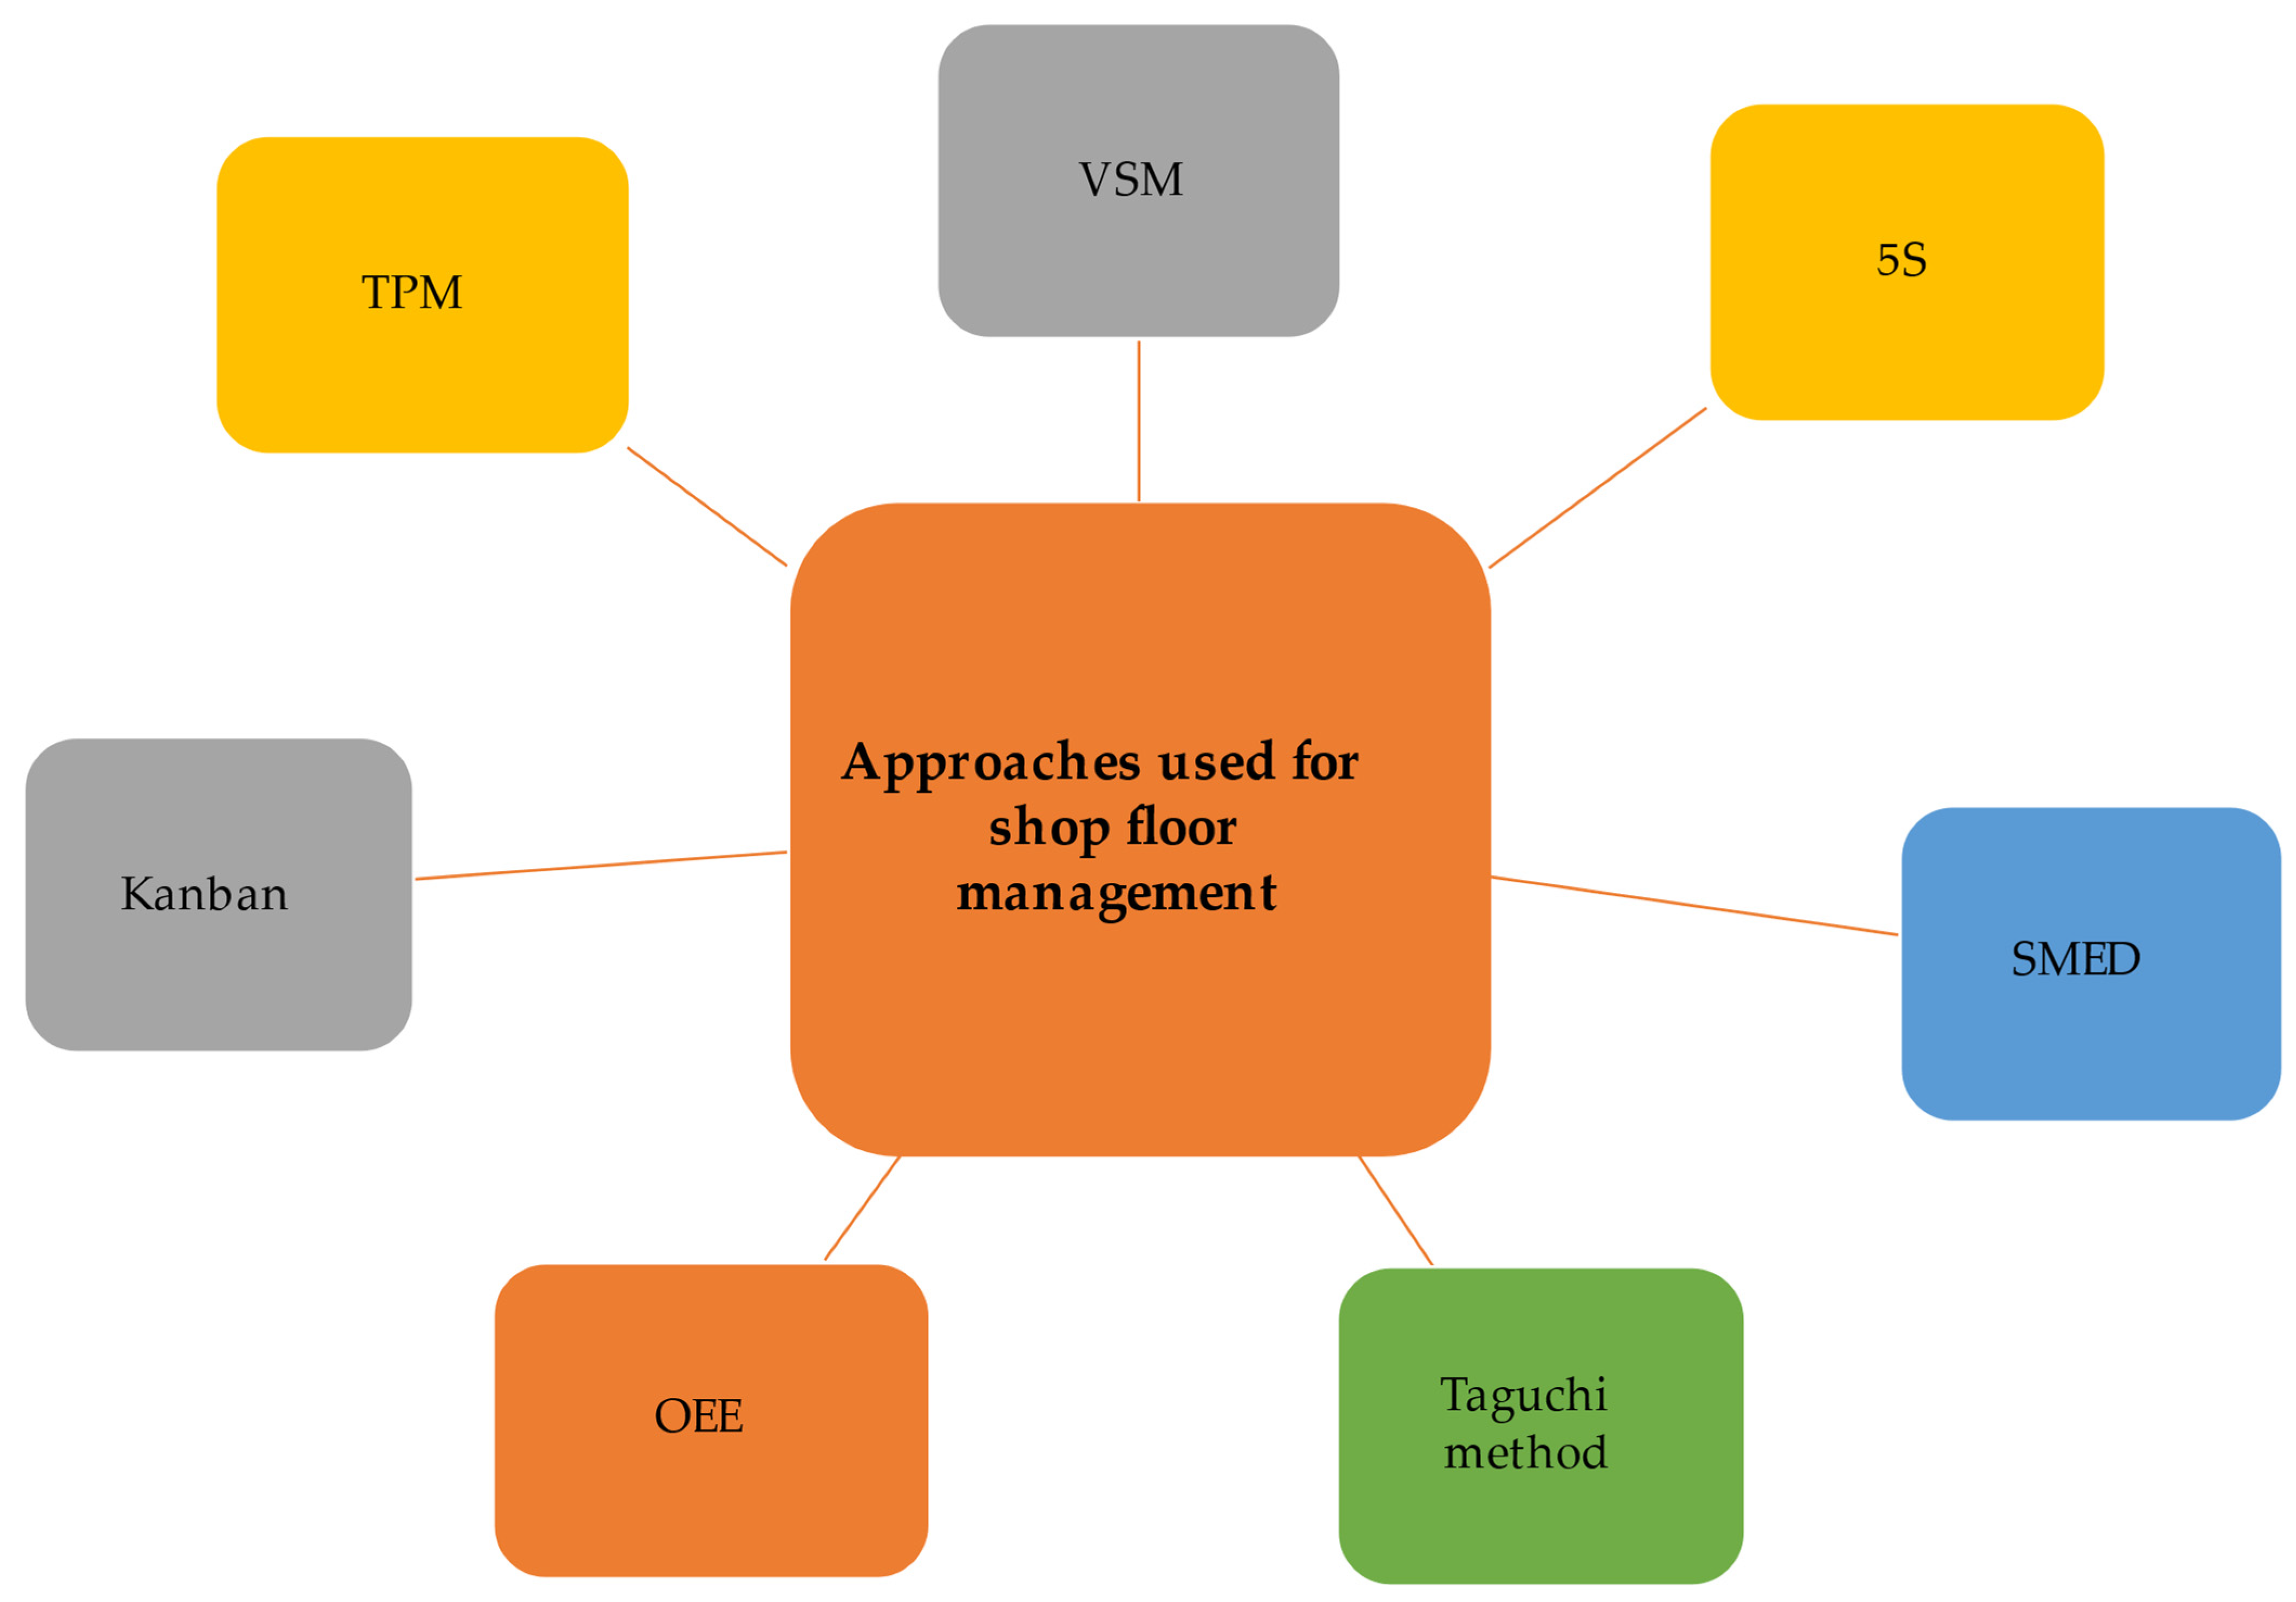
2. Development of the Implementation of the Lean Concept in Industry 4.0

The present competitive industrial environment has emphasized developing a sustainable system for operation management that could be implemented in all types of shop floor conditions in industry 4.0. To accomplish this, various systems and methodologies have been developed in previous research works. It has been observed that the proposed systems with the lean concept have proven to be excellent in obtaining productivity enhancements within industrial constraints in industry 4.0. The lean implementation in industry 4.0 helps to improve the contribution of employees within constraints [31]. The implementation of the lean concept in industry 4.0 can provide a new opportunity and guidelines to industry personals to enhance their operation management throughput, particularly planning strategy and shop floor conditions [32].
Tortorella et al. [33] investigated the relationship between lean production and implementation of industry 4.0 through a survey of 110 Brazilian manufacturing companies. The result showed that lean production has been associated with the techniques of Industry 4.0 and was found to be efficient in providing higher performance improvements. Leong et al. [34] presented an adaptive model for implementing the lean and green strategy to overcome dynamic industry problems with industry 4.0. The model has been implemented in a case study of heat and power plants. The result of the study showed an improvement in the lean green index by 18.25% and also improved the sustainability of the facility with industry 4.0 with minimum investment cost. Florescu et al. [35] highlighted the challenges and opportunities of the lean and green concept in the context of sustainable development. The results of the study revealed that the performance can be enhanced by integrating two dimensions and developing a sustainable company. Brozzi et al. [36] discussed manufacturing companies who implemented industry 4.0 as an advantage contribution for social and environmental sustainability. The data were collected by a survey conducted at 65 companies located in Italy. The results showed that the impact on environmental sustainability through the association of industry 4.0 was low across companies. Kamble et al. [37] discussed the direct effect of industry 4.0 technologies on sustainable organizational performance with lean practices. The finding was obtained by a survey carried out at 115 manufacturing firms with 205 managers. The result of the study revealed that industry 4.0 technologies support lean practices, leading to enhanced sustainable organizational performance. Florescu et al. [38] analyzed the performance and behavior of a flexible manufacturing system. In the study, a simulation tool was used for the evaluation of the flexible manufacturing system. The result of the study showed that the operational performance had been enhanced by implementing the developed model with a reduction in production time. Chiarini et al. [39] investigated the integration of principles and tools of lean six sigma with Industry 4.0 technologies for enhanced operational excellence. The data was collected by direct observation and by interviewing Italian manufacturing managers. The results of the study encouraged industry individuals to better integrate MRP, manufacturing execution systems, and other MRP modules. Cioffi et al. [40] reviewed previous research works to identifying technologies that can promote novel circular business models. The result of the study showed that industries focused on improving efficiency and performance by the establishment of smart manufacturing (SM) systems using new technologies, includes artificial intelligence, the internet of things, and machine learning. The authors appreciated new methodologies and strategies for shop floor management and observed that the previous research works focused on the enhancement of productivity with higher profitability. The present work provides an agile system to enhance productivity by improvements in various parameters and factors. The presented model has been developed by an exhaustive analysis and extensive discussion with employees and supervisors. The present model would be efficient for industry individuals, and this statement has been validated by implementing it under real shop floor conditions. The results showed that the present model has the capability to enhance productivity by improving the parameters and factors of the shop floor. Figure 3 describes the advantages of the present model in comparison to previous research findings, according to standardized parameters and factors.
Various research works have been discussed previously on the relationship between lean and industry 4.0 implementation in the management of the shop floor. It was concluded that:
a.
Industry personnel have found the lean concept to be efficient for sustainable shop floor management because the lean concept can be implemented under any type of production condition.
b.
It has been observed that the adaptability of the lean concept can be enhanced by an agile system to obtain sustainable operational performance.
c.
The results showed that the implementation of lean concepts in industry 4.0 can enhance the performance of resources by providing an effective working environment and robust shop floor management.
d.
Industry personnel believed that the lean concept would be proved efficient in productivity enhancement by an agile system and the establishment of sustainable shop floor management in industry 4.0.

3. Research Objective

The present study has been carried out in an earthmoving machinery assembly unit in India. This is a leading earthmoving machinery manufacturing industry that manufactures world-class products using cutting-edge technology. It has a wide range of products, including different types of skid steer loaders and excavators and their various attachments, for various applications. The skid steer loader is an engineering miracle in the earthmoving equipment industry due to its compactness and versatility. This earthmoving equipment is built on the foundation of providing operator safety, reliability, easy maintenance, and a low total cost of ownership. When it comes to a test of strength, endurance, and surviving the tough Indian conditions, it has proven its suitability over other earthmoving equipment. During the analysis, it was observed that this type of industry is facing issues regarding higher production cost due to higher production time on the shop floor. This is a very serious issue in terms of meeting the customer’s demand for the product on time. Some of the problems have also been observed in the fabrication, assembly, and painting lines, such as the large distance between workstations, random locations for equipment, painting large parts from another plant, an improper sequence of operations, inexperienced workers, a low number of workers (NR), and unsuitable clamping to handle the product between workstations, etc., all of which are equally responsible for the increased production time. These factors significantly affect the financial revenue of the industry. Therefore, it is important to overcome these issues regarding shop floor production. Thereby, in the present work, a modified VSM approach has been used as a process optimization tool and implemented on the shop floor to eliminate the non-productive activities.

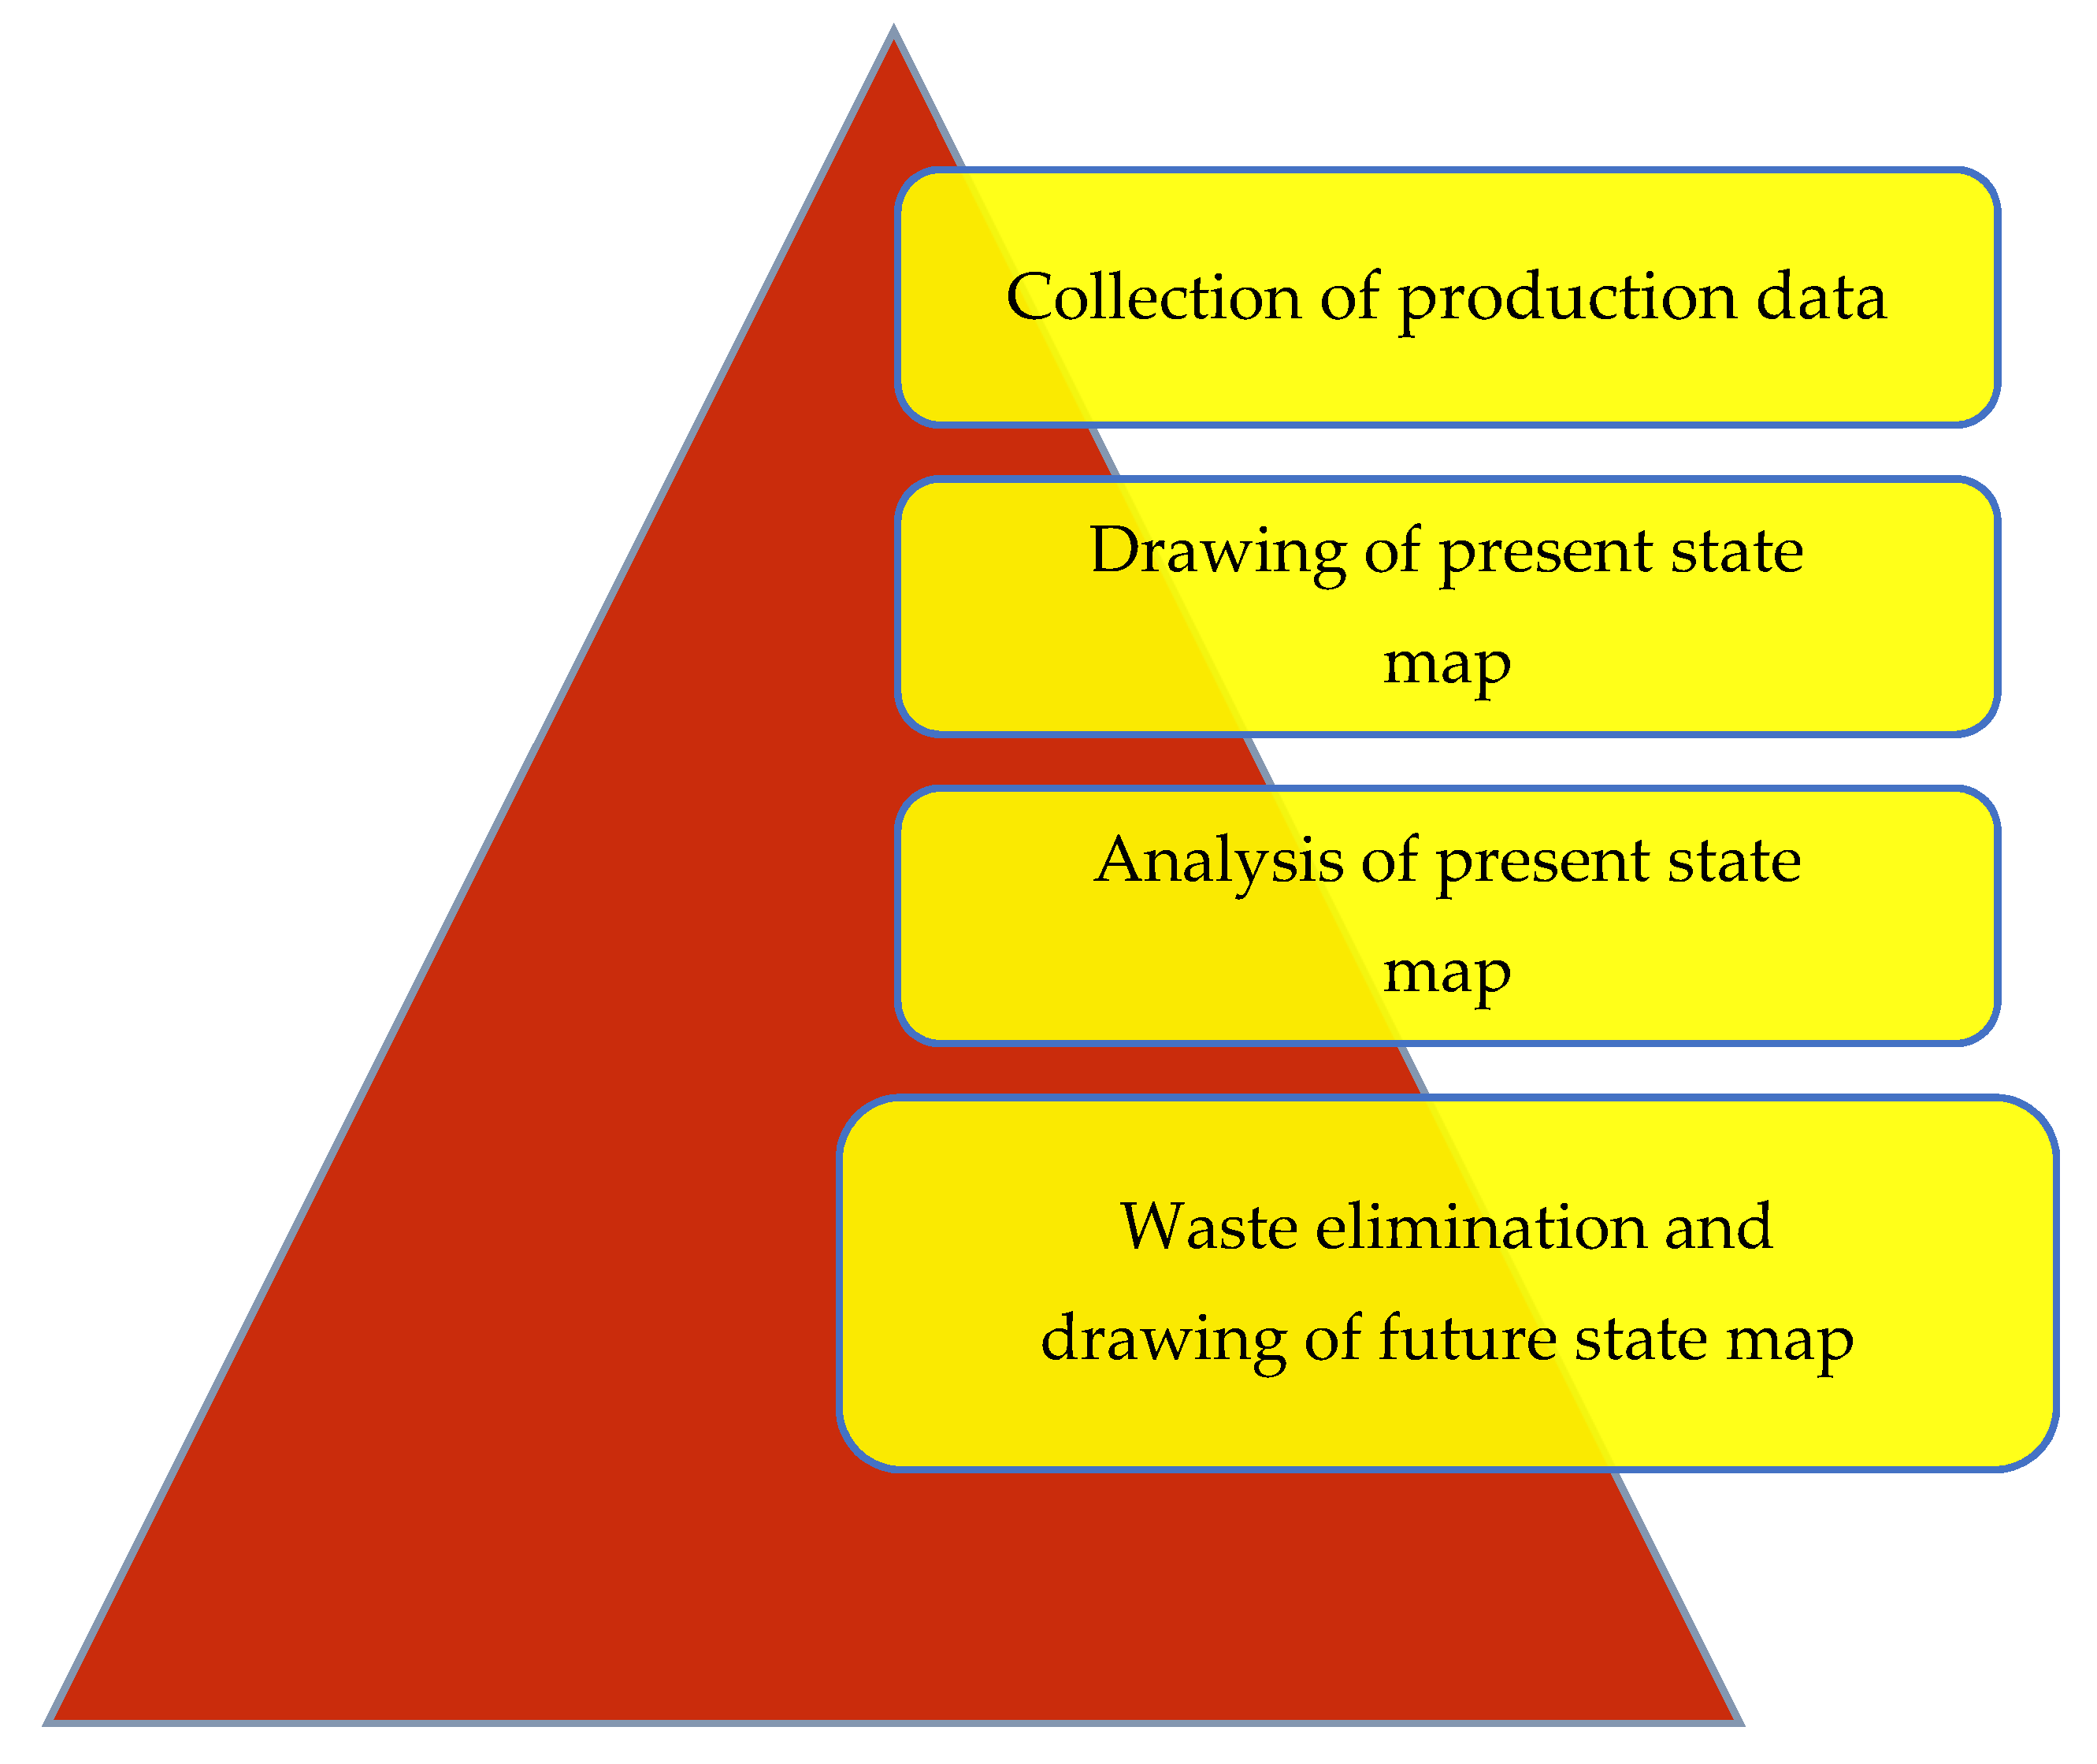
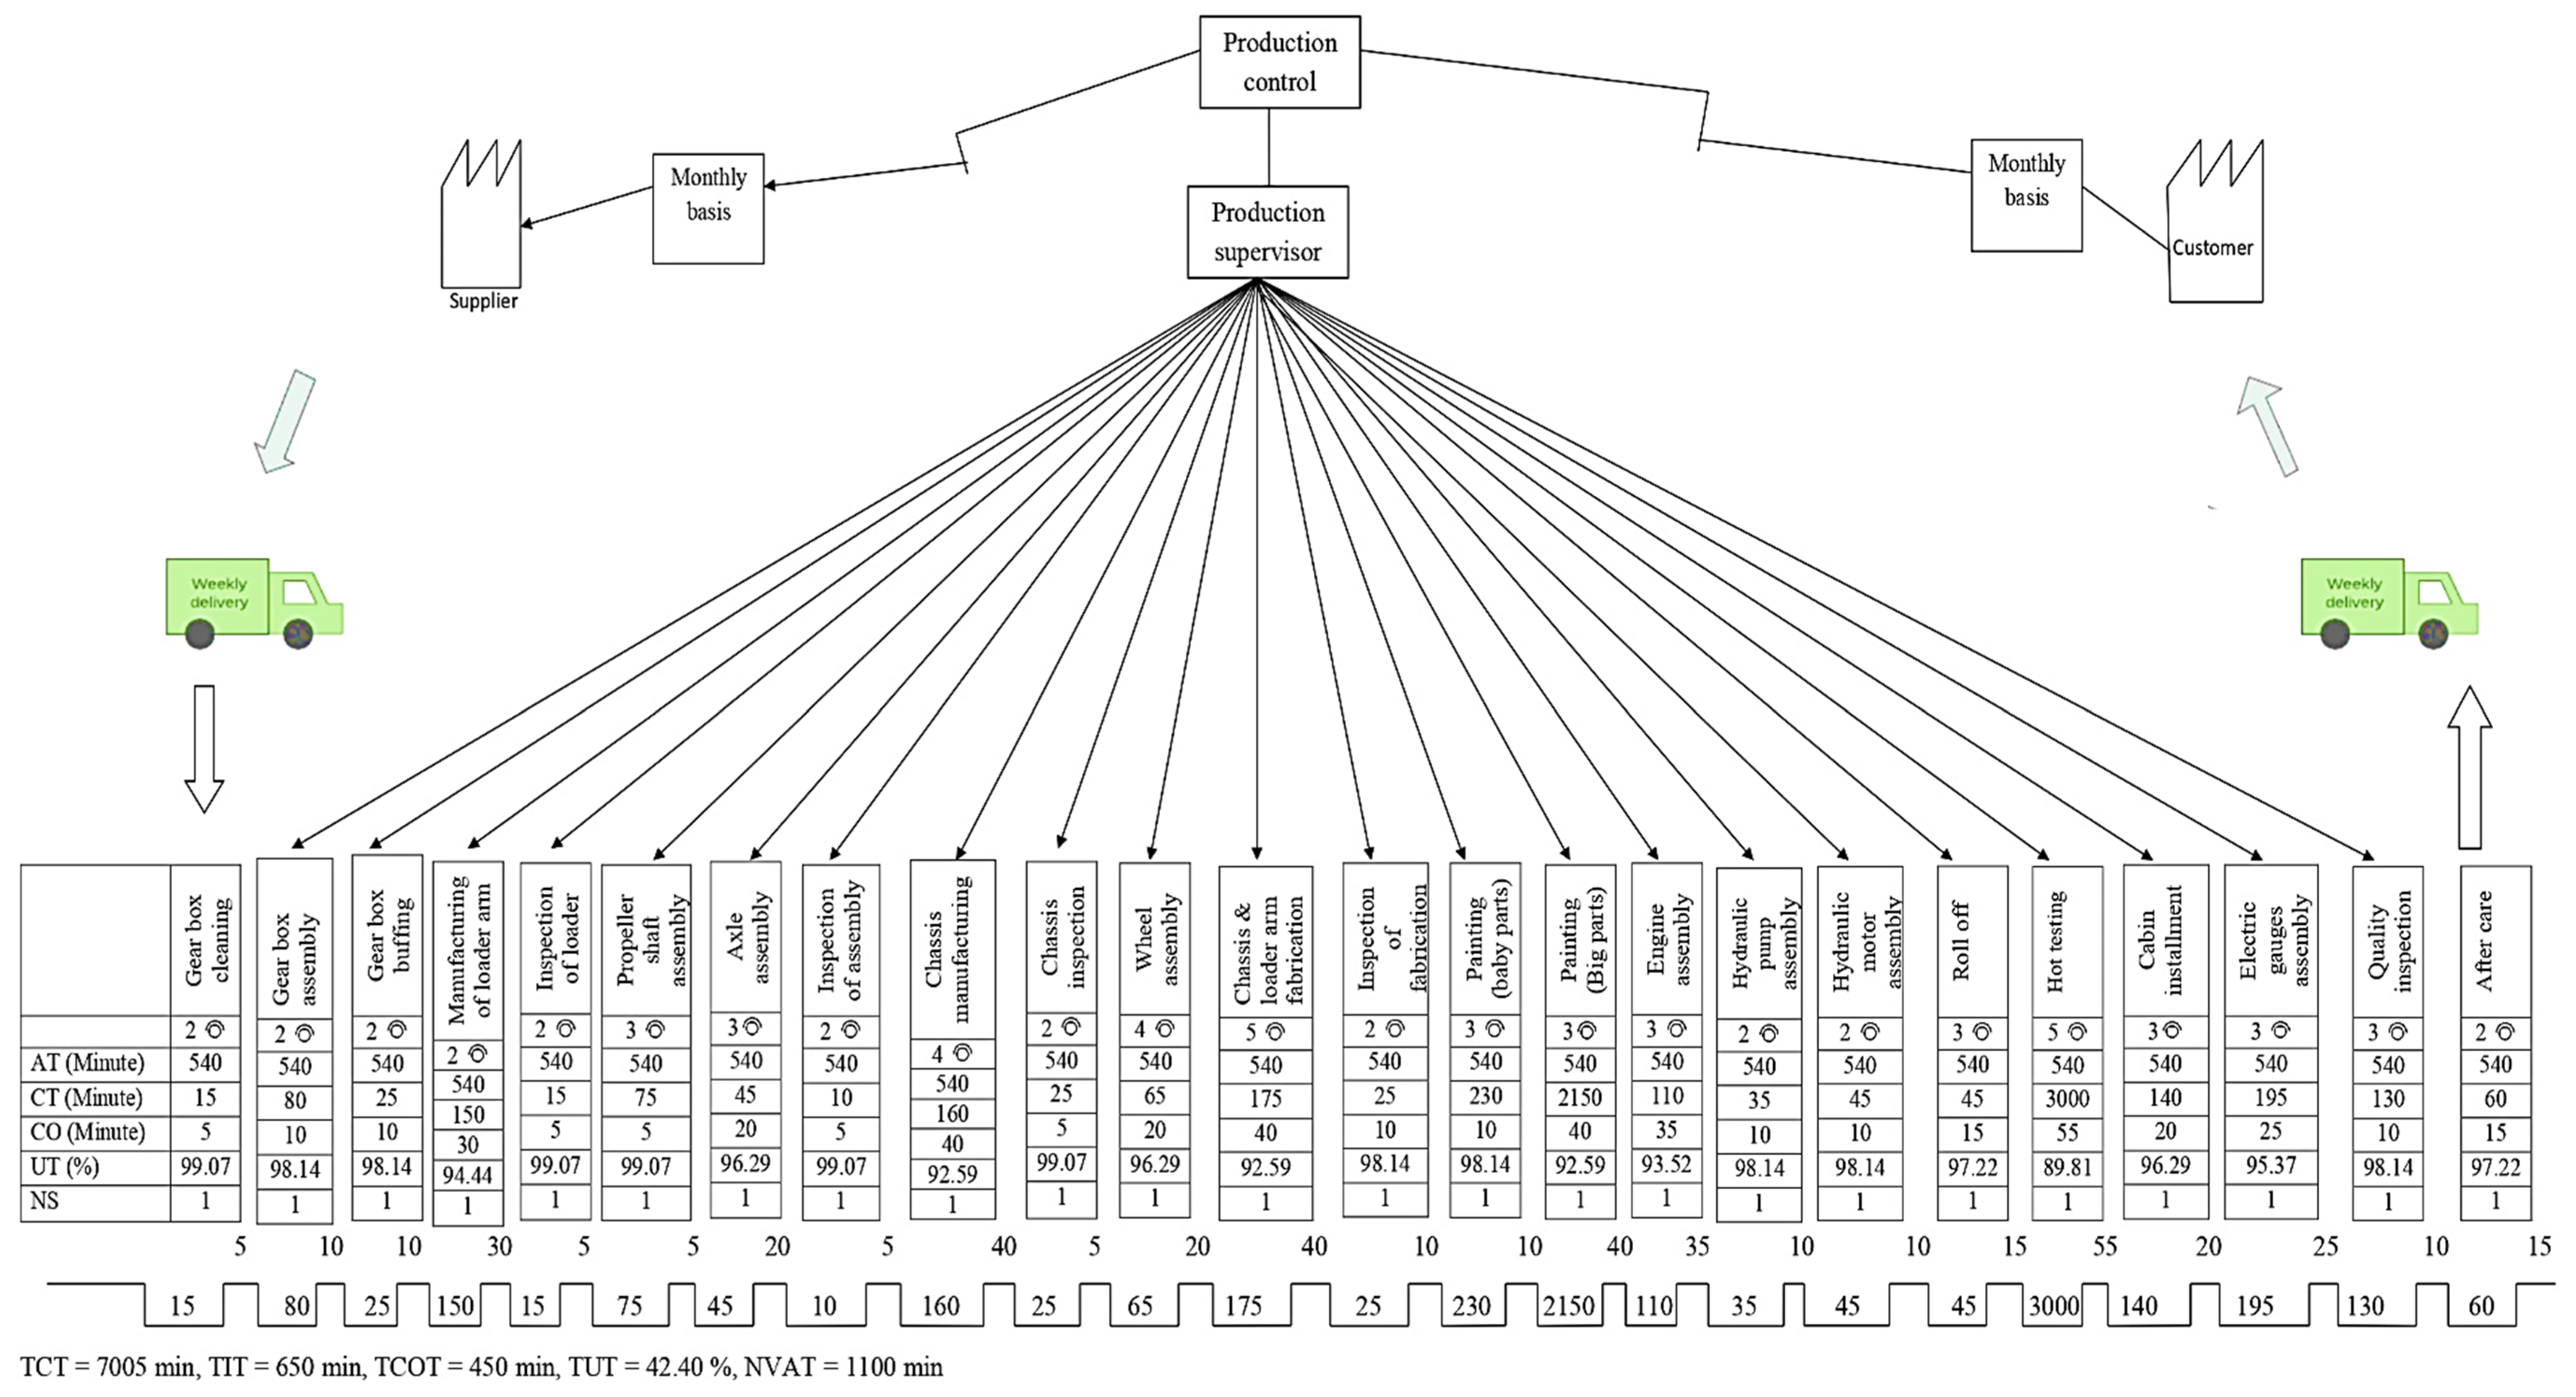
4. Traditional Methodology of VSM

Value stream mapping is one of the prevalent process optimization approaches in the present scenario as it is an effective way to improve operational performance. VSM is used to enhance productivity by improvements in operational performance through the elimination of the NVAAs founds in shop floor management. Various parameters are used to analyze production conditions in VSM, which mainly include total cycle time, total uptime, working time, available time, downtime, number of workers, production per day, number of shifts, total change over time, total idle time, and NVAT.
In previous research works, it has been found that the total uptime has been measured by computing the sum of the uptime of each operation, the total idle time has been measured by computing the sum of the cycle times of each operation, and the total turnaround time has been measured by computing the sum of the change times of the individual operations. The time has been measured by computing the sum of the WIP times between the total idle processes. These parameters are used to address actual operational performance on the shop floor.
Previous researchers have used various methodologies in shop floor management to enhance production. Vinodh et al. [41] studied VSM in a camshaft manufacturing business in India. It was concluded that VSM could assists the management of the organization to identify the wastes that occurred in the system, and thus eliminate their future possibilities. The result of the study revealed a reduction of 211 min in idle time (IT), 14 min in total cycle time (TCT), 50 units in work-in-progress inventory, and 4% in defects. Jasti et al. [42] discussed the idea that improvements on the shop floor were possible via the implementation of the VSM technique in a pre-decided manner. The implemented methodology consists of the selection of products, followed by the drawing of a working state map, analysis of non-productive activities, a modified map, and an implementation plan. Using this approach, they obtained a significant improvement in the factors of the shop floor, such as LT, production time (PT), takt time (TT), number of workers (NR), and process inventory level. Ramani et al. [43] implemented VSM in a gas-insulated switchgear design industry. The present map was prepared with the help of observation by the design departments. NVAAs were identified in areas where there were transfers of information across several departments such as electrical engineering, supplier, and civil engineering. The result of the study revealed that a 30% reduction in man hours and a 30% improvement in productivity were achieved. Sutharsan et al. [44] discussed the implementation of VSM in a monoblock pump manufacturing business. In the study, a workflow diagram was used to show the present state map, and it helped to identify NVAA in operations such as assembly, painting, die casting, shaft machining, and winding. The results of the study revealed that a 1.4 day reduction in production LT, a 12.8 min reduction in TCT, and a 2% reduction in defect rate were achieved.
The modern approaches in industry 4.0 are transforming traditional shop floor management systems towards digital shop floor management systems. Modern technologies at the present time influence production systems and digital tools, including asset tracking systems, sensors, RFID, and automation [45,46]. Digitalization of production systems using the VSM approach can enhance productivity by establishing a more efficient, sustainable, and flexible production system [45]. Therefore, it is necessary to maintain operational excellence within the available resources to help the management teams sustain competition in the current scenario. Modern technologies have impacted positively on operational excellence in industry 4.0 [46]. These technologies could enhance financial profitability by successfully eliminating waste on the shop floor. It is vital for shop floor management team members to implement new technologies in order to maintain higher operational performance within available resources inbuild with advanced tools. However, industry individuals and researchers still need to develop new methodologies and agile systems in terms of sustainable implementation on the shop floor.
In the present section, VSM has been implemented in the existing production methodology on the shop floor. In the literature, it has been found that various techniques related to the VSM are implemented on the shop floor. In all these studies, it has been observed that all the activities involved in the methodologies are decided before the start of production, such as observation, analysis, and the obtained improvement of all the factors associated with production. Figure 4 depicts the various attributes of the present methodology for the deployment of VSM on the shop floor. The primary production data of the shop floor has been collected in the initial stage. Table 1 consists of the important collected production information of the shop floor, which is required for the next step, i.e., the drawing of the present state map of the present methodology.
In the next step, the present state map of the industry is drawn to determine the flow of production on the shop floor, as shown in Figure 5. The production processes such as NR, CT, CO, AT, and UT are located in the data box. The total production time (TPT) and total idle time (TIT) is noted on the present state map, and PT is calculated with the addition of both productive and non-productive activities.
After drawing, the present state map has been analyzed to know the actual condition of the present shop floor. For the purpose of analysis, some important production data has been taken into account, such as total working time (TWT) = 9.5 h, working time (WT) per day = 9.5 × 60 = 570 min, number of shifts (NS) = 1, number of products (ND), downtime (DT) = 30 min, available time (AT) per day = 570 − 30 = 540 min, and AT = 540 min. During the analysis, it has been observed that, in the present production state, the shop floor has six workstations: fabrication, assembly, hot testing, quality, profile cutting, and painting. Equations (1)–(3) are used to calculate the uptime (UT), total uptime (TUT), and takt time (TT) [25,41].
UT = (ATCO/AT) × 100
where UT is the uptime for each activity and AT and change over time (CO) represent the available time and change over time, respectively.
TUT = sum of the uptime time of individual operations.
T U T = U T 1 × U T 2 × U T 3 × U T 4 × U T 5 × U T 6 × U T 7 × U T 8 × U T 9 × U T 10 × U T 11 × U T 12 × U T 13 × U T 14 × U T 15 × U T 16 × U T 17 × U T 18 × U T 19 × U T 20 × U T 21 × U T 22 × U T 23 × U T 24  
where, UT1, …, UT24 are the uptime for each activity, and TUT represents the total uptime of the shop floor.
TT = AT/ND
= 540/4
= 135 min
By using Equations (1)–(3), the calculated values of TUT and TT are found to be 42.40% and 135 min, respectively.
From the present state analysis, it has been revealed that the processes related to the painting and fabrication shop are highly responsible for the high production time. In the painting shop, the painting of large parts from another plant are performed, and in the fabrication shop, the equipment involved in production has not been arranged appropriately. Both activities are responsible for high product costs and high idle time with a low production rate. To overcome these activities, the idle time has been reduced by the suggestion of appropriate action by the members of the management team. Figure 6a represents the variation of the total idle time (TIT) in the present state map. Based on these results, Figure 6b represents the variation of TIT for the future state map and a comparison between the present state map and future state map according to changes in the parameters of the shop floor.
After this, amendment of the present state map is performed via the elimination of waste (WS), and with this amendment, a future state map is drawn. This future state map is used as an action plan to improve production time. It has been observed that this future state map is highly beneficial for the management to identify the places that need modifications. The proposed map has been developed by the elimination of the NVAAs identified on the shop floor. The improvement in production conditions in the proposed state has been achieved by an action plan. Figure 7 shows the proposed future state map of the shop floor.
Equations (4)–(6) are used to calculate the TUT, TCOT, and TCT for the proposed future state map of the shop floor [25,41].
T U T = U T 1 × U T 2 × U T 3 × U T 4 × U T 5 × U T 6 × U T 7 × U T 8 × U T 9 × U T 10 × U T 11 × U T 12 × U T 13 × U T 14 × U T 15 × U T 16 × U T 17 × U T 18 × U T 19 × U T 20
T C O T = C O 1 + C O 2 + C O 3 + C O 4 + C O 5 + C O 6 + C O 7 + C O 8 + C O 9 + C O 10 + C O 11 + C O 12 + C O 13 + C O 14 + C O 15 + C O 16 + C O 17 + C O 18 + C O 19 + C O 20
T C T = C T 1 + C T 2 + C T 3 + C T 4 + C T 5 + C T 6 + C T 7 + C T 8 + C T 9 + C T 10 + C T 11 + C T 12 + C T 13 + C T 14 + C T 15 + C T 16 + C T 17 + C T 18 + C T 19 + C T 20
The calculated values in the future map of TUT, TCOT, and TCT are 45.71%, 400 min, and 6860 min, respectively. The improvements in shop floor parameters have been obtained by the elimination of NVAAs by an efficient production action plan. It has been found that the CO and CT of each operation have been effectively reduced in the future state map. Based on the results, Figure 8 represents a comparison between the present state map and the future state map according to changes in the parameters of the shop floor. Moreover, Figure 9 and Figure 10 represent the comparison graphs of CT and CO for the present and future state of traditional methodology on the shop floor.

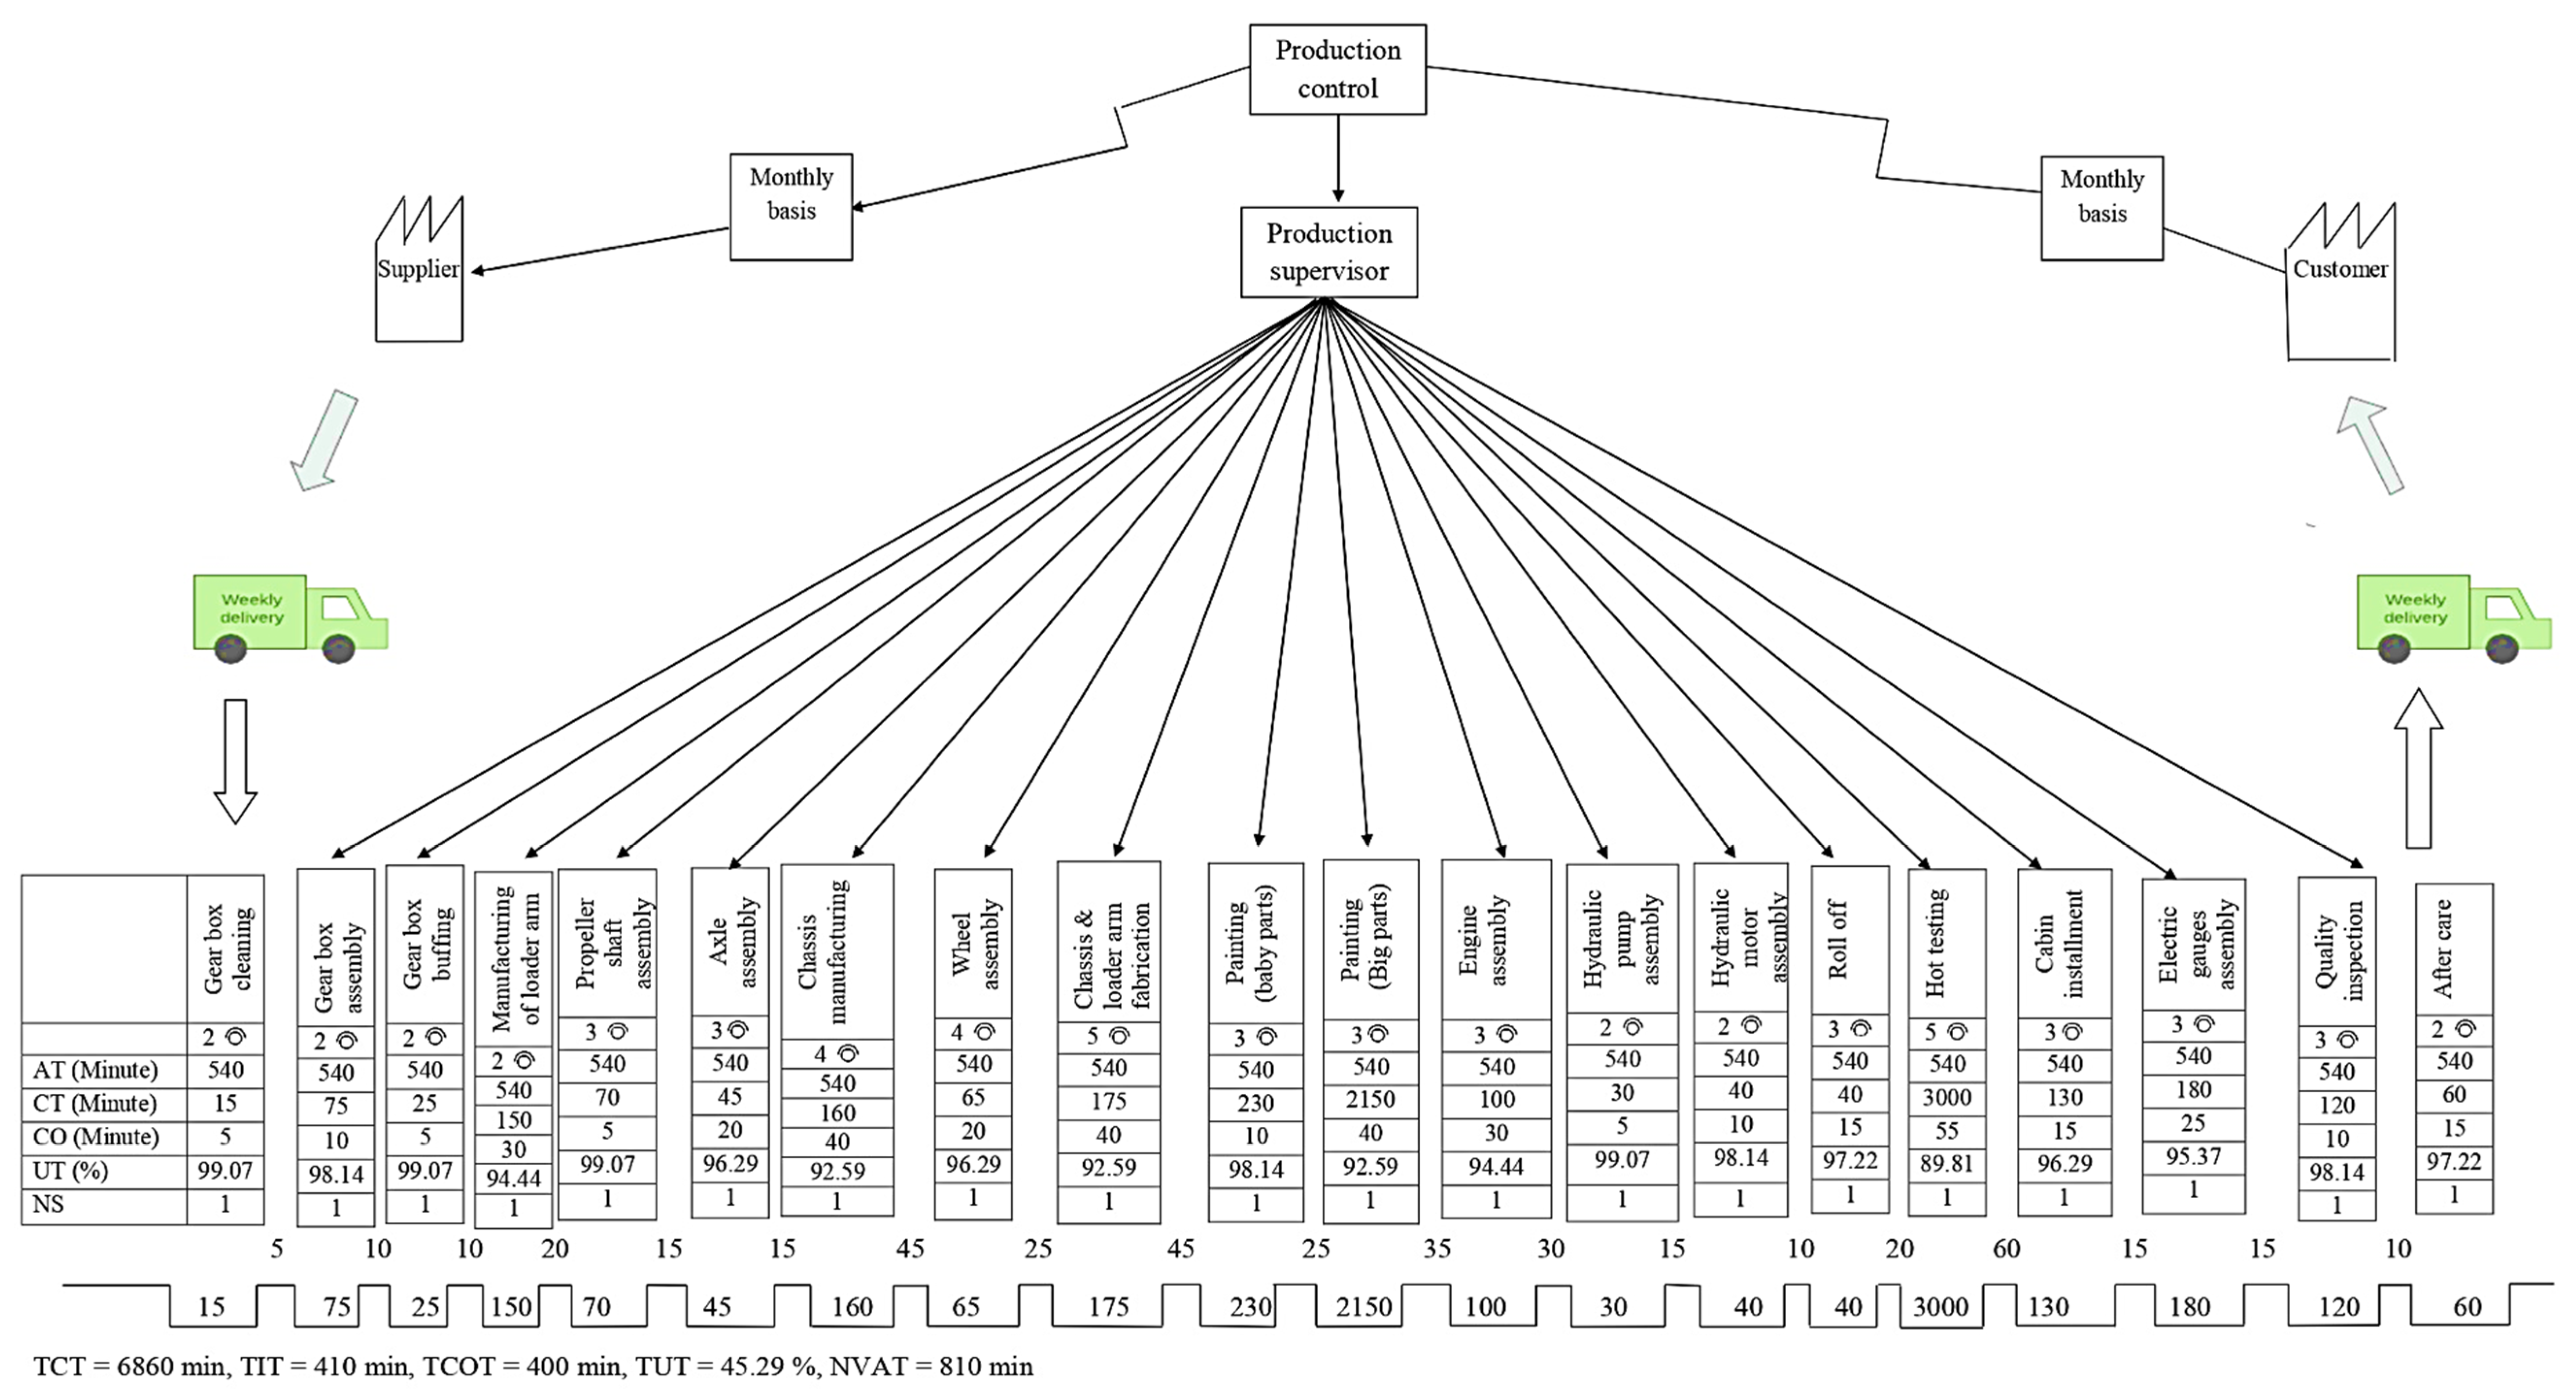
5. Proposed Methodology Coupled with VSM

Initially, for the implementation of VSM in the proposed methodology on the shop floor, the overall production processes and activities are shown by mapping. Thereafter, the sections or workstations that are responsible for lower productivity are identified. In the previous section, it has been found that the fabrication, assembly, and painting stations are the root reasons for slower production levels. In particular, gearbox assembly, fabrication of loader arm, fabrication of loader arm with chassis, painting of large parts, cabin installment, electric gauge assembly, and the frequent inspection of each process are identified as the main problematic processes on the shop floor. Moreover, improper workflow arrangement, an excess of NP, a large gap between processes, improper handling, lack of skill, and irregular location of equipment are some other reasons for the same. Thereby, a proposed methodology is designed and shown as a workflow chart in Figure 11.
There are seven phases in the proposed methodology of this novel work. The first phase focuses on identifying the problems and uses various sources to identify them, including the analysis of past production records, discussions with workers, and meeting customer expectations. Whereas, in the second stage, the management team members make decisions regarding the purpose of the present shop floor by analyzing various factors and parameters. In the third stage, the management team members review the production processes and activities by direct observation and analysis of workspaces on the shop floor. In the fourth step, the production level of the present shop floor management is demonstrated by analyzing various parameters to enhance control in the production system. These parameters include resource allocation, working time, sensor availability, available time, automation, machinery efficiency, power supply, and financial position. In the fifth phase, the overall production system and process performance are calculated by suitable methods and approaches to understand the actual condition on the shop floor. The sixth phase suggests improvements and solutions to enhance operational performance by the implementation of modified workflow. Finally, in the seventh phase, all the shop floor activities are improved according to the previous phase, and then the proposed map can be applied on the shop floor for efficient production. The result shows the efficacy of the proposed methodology by the improvements achieved in operational excellence using limited resources.
This case study was carried out at an earthmoving machinery assembly unit in India. All the information related to the product was collected from market surveys, discussions with workers, industry records, and customers. Table 2 includes the major information associated with the product information collected from the above sources. In order to produce the desired product with the required specifications of the customer, it is necessary to decide the objective before starting the production processes on the shop floor. This is a very crucial phase of the production process because it decides the overall activities or processes required for fulfilling the needs of the customer. Attaining the desired specifications, achieving standard quality, production using limited resources, production within time, and production within limited budget are the major objectives of the production process, which all help to obtain the desired outcome.
Thereafter, the analysis phase helps in the production system to recognize the actual conditions of the shop floor, where production processes will be performed. In this phase, previous production records, resource availability, identifying the TWS, lack of production, and DT are some vital factors that are responsible for the production and also help in the improvement of production levels. Table 3 shows the analysis of the present shop floor, which are based on the collected information.
In the analysis phase, Equations (7)–(10) are used to calculate the AT, CT, CO, UT, NR, and the processes of the present shop floor. The calculated values of different parameters of the present shop floor are listed in Table 4 [25,41].
WT = 9.5 h = 570 min
NS = 1
AT = WT × NS
= (570 × 1)
= 570 min
DT = 30 min
TPT = AT − DT
= 570 − 30 = 54 min
TT = TPT/ND
= 540/4
= 135 min
UT = (TPT − CO)/AT
Based on the parametric values in Table 4, the values of TCOT, TIT, NVAT, and TCT are calculated using Equations (11)–(14), respectively [25,41]. the calculated values of TCOT, TIT, NVAT, and TCT are 450 min, 650 min, 1100 min, and 7005 min, respectively.
T C O T = C O 1 + C O 2 + C O 3 + C O 4 + C O 5 + C O 6 + C O 7 + C O 8 + C O 9 + C O 10 + C O 11 + C O 12 + C O 13 + C O 14 + C O 15 + C O 16 + C O 17 + C O 18 + C O 19 + C O 20 + C O 21 + C O 22 + C O 23 + C O 24
T I T = I T 1 + I T 2 + I T 3 + I T 4 + I T 5 + I T 6 + I T 7 + I T 8 + I T 9 + I T 10 + I T 11 + I T 12 + I T 13 + I T 14 + I T 15 + I T 16 + I T 17 + I T 18 + I T 19 + I T 20 + I T 21 + I T 22 + I T 23 + I T 24
NVAT = TIT + TCOT
T C T = C T 1 + C T 2 + C T 3 + C T 4 + C T 5 + C T 6 + C T 7 + C T 8 + C T 9 + C T 10 + C T 11 + C T 12 + C T 13 + C T 14 + C T 15 + C T 16 + C T 17 + C T 18 + C T 19 + C T 20 + C T 21 + C T 22 + C T 23 + C T 24
After the analysis phase, a decision-making phase takes place, which involves the planning of production. This activity is required to achieve the desired productivity. Table 5 shows the discussed factors.
After examining and understanding all the production-related conditions, all types of waste on the shop floor are eliminated. This helps to propose a new workflow for future production on the shop floor. Figure 12 shows the workflow that is proposed for production on the shop floor. In analyzing the proposed workflow, parameters are calculated from the analysis of the proposed activities. Table 6 consists of the values of AT, CT, CO, UT, NR, and the other processes of the proposed shop floor.
On the basis of Table 6, updated values of TCT, TUT, TCOT, TT, TIT, and NVAT are calculated. For the new values of these parameters, 16 processes are taken into consideration. The new values of TCT, TUT, TCOT, TT, TIT, and NVAT are 6350 min, 58.37%, 275 min, 105 min, 250 min, and 525 min, respectively. The production parameters in the future state map have been effectively reduced by improving the production action plan. Figure 13 and Figure 14 show the comparison graph of CO and CT between the present and future state of the proposed methodology on the shop floor. The overall improvement in production shop floor management has been analyzed by comparing the parameters of the present and future status of the proposed methodology, and it was found that the parameters have achieved improvement efficiently. Figure 15 shows a comparison graph between the present state map and the future state map of the proposed methodology according to the changes in parameters of the shop floor.

6. Validation of Proposed Methodology

In this section, validation of the proposed methodology has been performed. For this, the present state methodology has been compared with the results of the proposed methodology for the same line of action. During validation, it has been observed that VSM implementation with the proposed methodology on the shop floor provides an effective decision with a higher improvement rate in the production compared with the traditional methodology. Different phases are used in the proposed methodology, which helps in identifying the accurate requirements of production on the shop floor. This requirement is fulfilled by information collected from several sources for the product and its production according to the conditions of the shop floor. The analysis of shop floor activities has been performed by the calculation of various vital parameters, viz., CT, TT, CO, CT, UT, AT, IT, DT, VAT, and NVAT.
The data required for the present study was collected over two months. At the start of the study, some issues have been identified for higher production, such as unplanned production planning, random sequence of processes, long distance between stations, and fewer workers, etc. The production conditions were evaluated by the calculation of different parameters in both conditions according to the processes. Analysis has shown that the operational performance has been enhanced by the proposed agile system, and the results obtained on the shop floor have proven that the proposed methodology can enhance productivity. Figure 16 shows the comparison of AT, NVAT, TLT, TCOT, TT, TIT, and TCT of the traditional methodology and proposed methodology. Figure 17 and Figure 18 provide the comparison of CO and CT of the traditional methodology and proposed methodology.

7. Results and Discussions

After analysis of the proposed methodology coupled with VSM, the results show that TCT, TIT, TT, TCOT, and TLT are improved by 655 min, 400 min, 30 min, 175 min, and 1230 min, as shown in Figure 19. In the presented analysis, it was found that the developed agile system is capable of improving the production parameters, and this is reflected by the growth achieved by the proposed methodology. The production parameters have been drastically improved by the developed agile system, and this has been proven by the enhancement achieved in the parameters. Table 7 shows the improvements in the other parameters of the shop floor using the proposed methodology.
By inspecting the production on the shop floor and analyzing the information gathered from many sources, it was found that some of the activities and processes involved in production are the cause of high PT, which need to be eliminated [47,48,49,50,51]. Table 8 shows the actions taken to improve the shop floor, while Table 9 shows the list of requirements for the different processes of the shop floor.

Scientific Novelty and Applications of the Proposed Methodology in Shop Floor Management

Industries face a plethora of problems in operational control when attempting to enhance productivity using limited resources. These problems are found in various forms, including outsourcing, inefficient workforce, machinery failure, lack of contribution, and poor working conditions. Industry individuals need to develop a methodology to alleviate these problems and improve shop floor management [4,13,15,17,30,33,39]. It has been concluded that the previous model was not sufficiently productive for implementation on the shop floor. Various approaches can be used to control operational performance in the present scenario, including VSM, kaizen, SMED, SM, and TPM. These approaches are used to enhance productivity by improvements in operational performance on the shop floor.
In reviewing previous research work, the approaches that were used for shop floor management were found to be inefficient for controlling operational performance in industry 4.0 within limited constraints [4,13,15,17,25,30,33,39,41]. The proposed methodology has been developed by brainstorming an analysis of the problems encountered in shop floor management with management team members of the respective industries. This analysis helps industry individuals to establish a guideline at the beginning of the production processes. The developed methodology has been validated by the achievement of production enhancements within limited constraints in an actual production condition of industry 4.0. The methodology provided a robust production system by reducing production time by 42% and increasing financial profitability, operational performance, machinery performance, and worker contribution 36%, 25%, 28%, and 18%, respectively [25,41]. The developed methodology would be preferable by industry individuals because it proved to be an efficient approach to enhancing productivity and, further, to controlling operational performance in comparison with the existing previous literature methodologies.
The objective of the present research work was to construct an agile system to sustain enhancement in production through a methodology coupled with value stream mapping in industry 4.0. Therefore, in this article, a methodology has been developed to make an agile system to improve productivity level in industry 4.0.
The developed methodology can improve performance on any shop floor with available resources in all production industries, such as for automobiles, mining-machinery, mining, aeronautical, defense, and so on. The authors of the present work strongly believe that the proposed methodology would help industry personnel and management members to control operating conditions on the shop floor by eliminating the difficulties encountered in the production system.

8. Enhancement of Lean Performance for Industry 4.0 Using the Proposed VSM Methodology

Industry individuals have focused on enhancing operational performance through the appropriate approaches. Various approaches have been used to improve operational performance. Nowadays, the lean concept is used to improve operational excellence by eliminating waste. The lean concept is used to enhance productivity by removing waste found on the shop floor. However, the extensive literature review has observed that the lean concept could not control operational performance in industry 4.0. In the present research work, a methodology has been developed to enhance lean performance in industry 4.0. The developed methodology has been coupled with VSM. VSM is a lean-based approach to improve operational excellence by eliminating waste. The developed methodology could enhance operational performance by eliminating waste in all types of production conditions and help management team members establish a sustainable production system using limited resources.

8.1. Sustainable Operational Performance and Industry 4.0

The implementation of a suitable process optimization approach plays a significant role in sustaining operational excellence. The process optimization approach facilitates the achievement of production enhancements using limited resources. In industry 4.0, advanced technologies strongly contribute to production flexibility, value development, financial benefits, and adaptability by enhancing the performance of the process optimization approach. Advanced technologies include digitalization and automation; this helps to reduce time, reduce the production cost, improve quality, and enhance the adaptability of the approach. It has been observed that operational excellence can be enhanced by minimizing waste, and by collecting data and information by management team members. The collected data helps to understand the real conditions on the shop floor and can be used to suggest a number of solutions to enhance operational excellence by utilizing workforce, machinery, energy, and shop floor area. Modern technologies used in industry 4.0 can improve the sustainability of the production system by eliminating waste more efficiently by establishing a safe environment with minimum cost and higher profitability.

8.2. Lean Performance and Industry 4.0 Technologies

The present research developed a methodology to enhance the sustainability of the production system by eliminating waste using VSM in industry 4.0. The developed methodology can improve operational performance by the minimization of waste with the maximum utilization of resources. The objective of the lean concept is to enhance the workflow of the production process with the depreciation of waste. Waste is an unnecessary activity that can never add any value to the product, so management teams focus on eliminating waste found in the production system. The technologies used in industry 4.0 help to enhance the effectiveness of lean-based approaches by implementing a corrective action-based system. This has been achieved by analyzing the data received by various sources, including radiofrequency identification systems, digitization, sensors, and embedded systems. The condition-based monitoring system has been used to improve operation management by eliminating waste, and it provides a sustainable system to control the production processes in real shop floor conditions.

8.3. Bridge Work—The Connection between Industry 4.0 and Clean Lean Manufacturing

The lean concept can positively impact operational excellence, and technologies used in industry 4.0 provide a strategy for improvement in production systems using limited resources. The developed methodology can enhance operational excellence by eliminating waste and help the management teams to establish a sustainable system by improving several parameters, including production time, worker contribution, overall equipment effectiveness, environmental condition, and financial conditions. The present research validates that industry 4.0 supports the developed system by overcoming the limitations of the lean concept. The developed methodology is efficient in preparing a production plan by eliminating each type of waste and NVAA. As a result, the production plan can enhance productivity and financial conditions with limited energy consumption. The lean concept focused on enhancing operational performance by reducing waste, while industry 4.0 uses modern technologies and enhanced production by improving operating conditions. In the present scenario, the management team members focus on establishing sustainable production using available resources by encouraging the upgrading of the system for the minimum utilization of energy. This could be a positive endeavor to provide financial profitability with the fulfillment of consumer demands.

8.4. Potential Contribution and Managerially Impacts in Manufacturing Organizations

The proposed methodology has been developed based on just-in-time and flexible manufacturing system approaches to control variations in operating conditions using limited resources while reducing energy consumption and increasing productivity and financial profitability. VSM provides a strategic approach to identify waste, and it provides improvement suggestions by monitoring production processes. VSM is considered to be beneficial for enhancing the effectiveness of the shop floor management systems by using modern technologies in industry 4.0. The management team members can control activities by real-time monitoring, and it helps in the decision-making phase to enhance operational performance using limited resources. Thus, it has been concluded that clean lean manufacturing and industry 4.0 technologies with VSM make VSM quick, easy, and more flexible, and it can lead to production with minimum waste.

9. Conclusions

In the present research article, the authors performed a case study to enhance the production of an earthmoving machinery manufacturing industry by using a modified VSM framework. The following conclusions can be drawn from the present study:
i.
It has been observed that the proposed methodology can be used to construct an agile system for improvements in productivity level in industry 4.0.
ii.
The proposed methodology proved superior when compared to the traditional methodology with VSM on the shop floor.
iii.
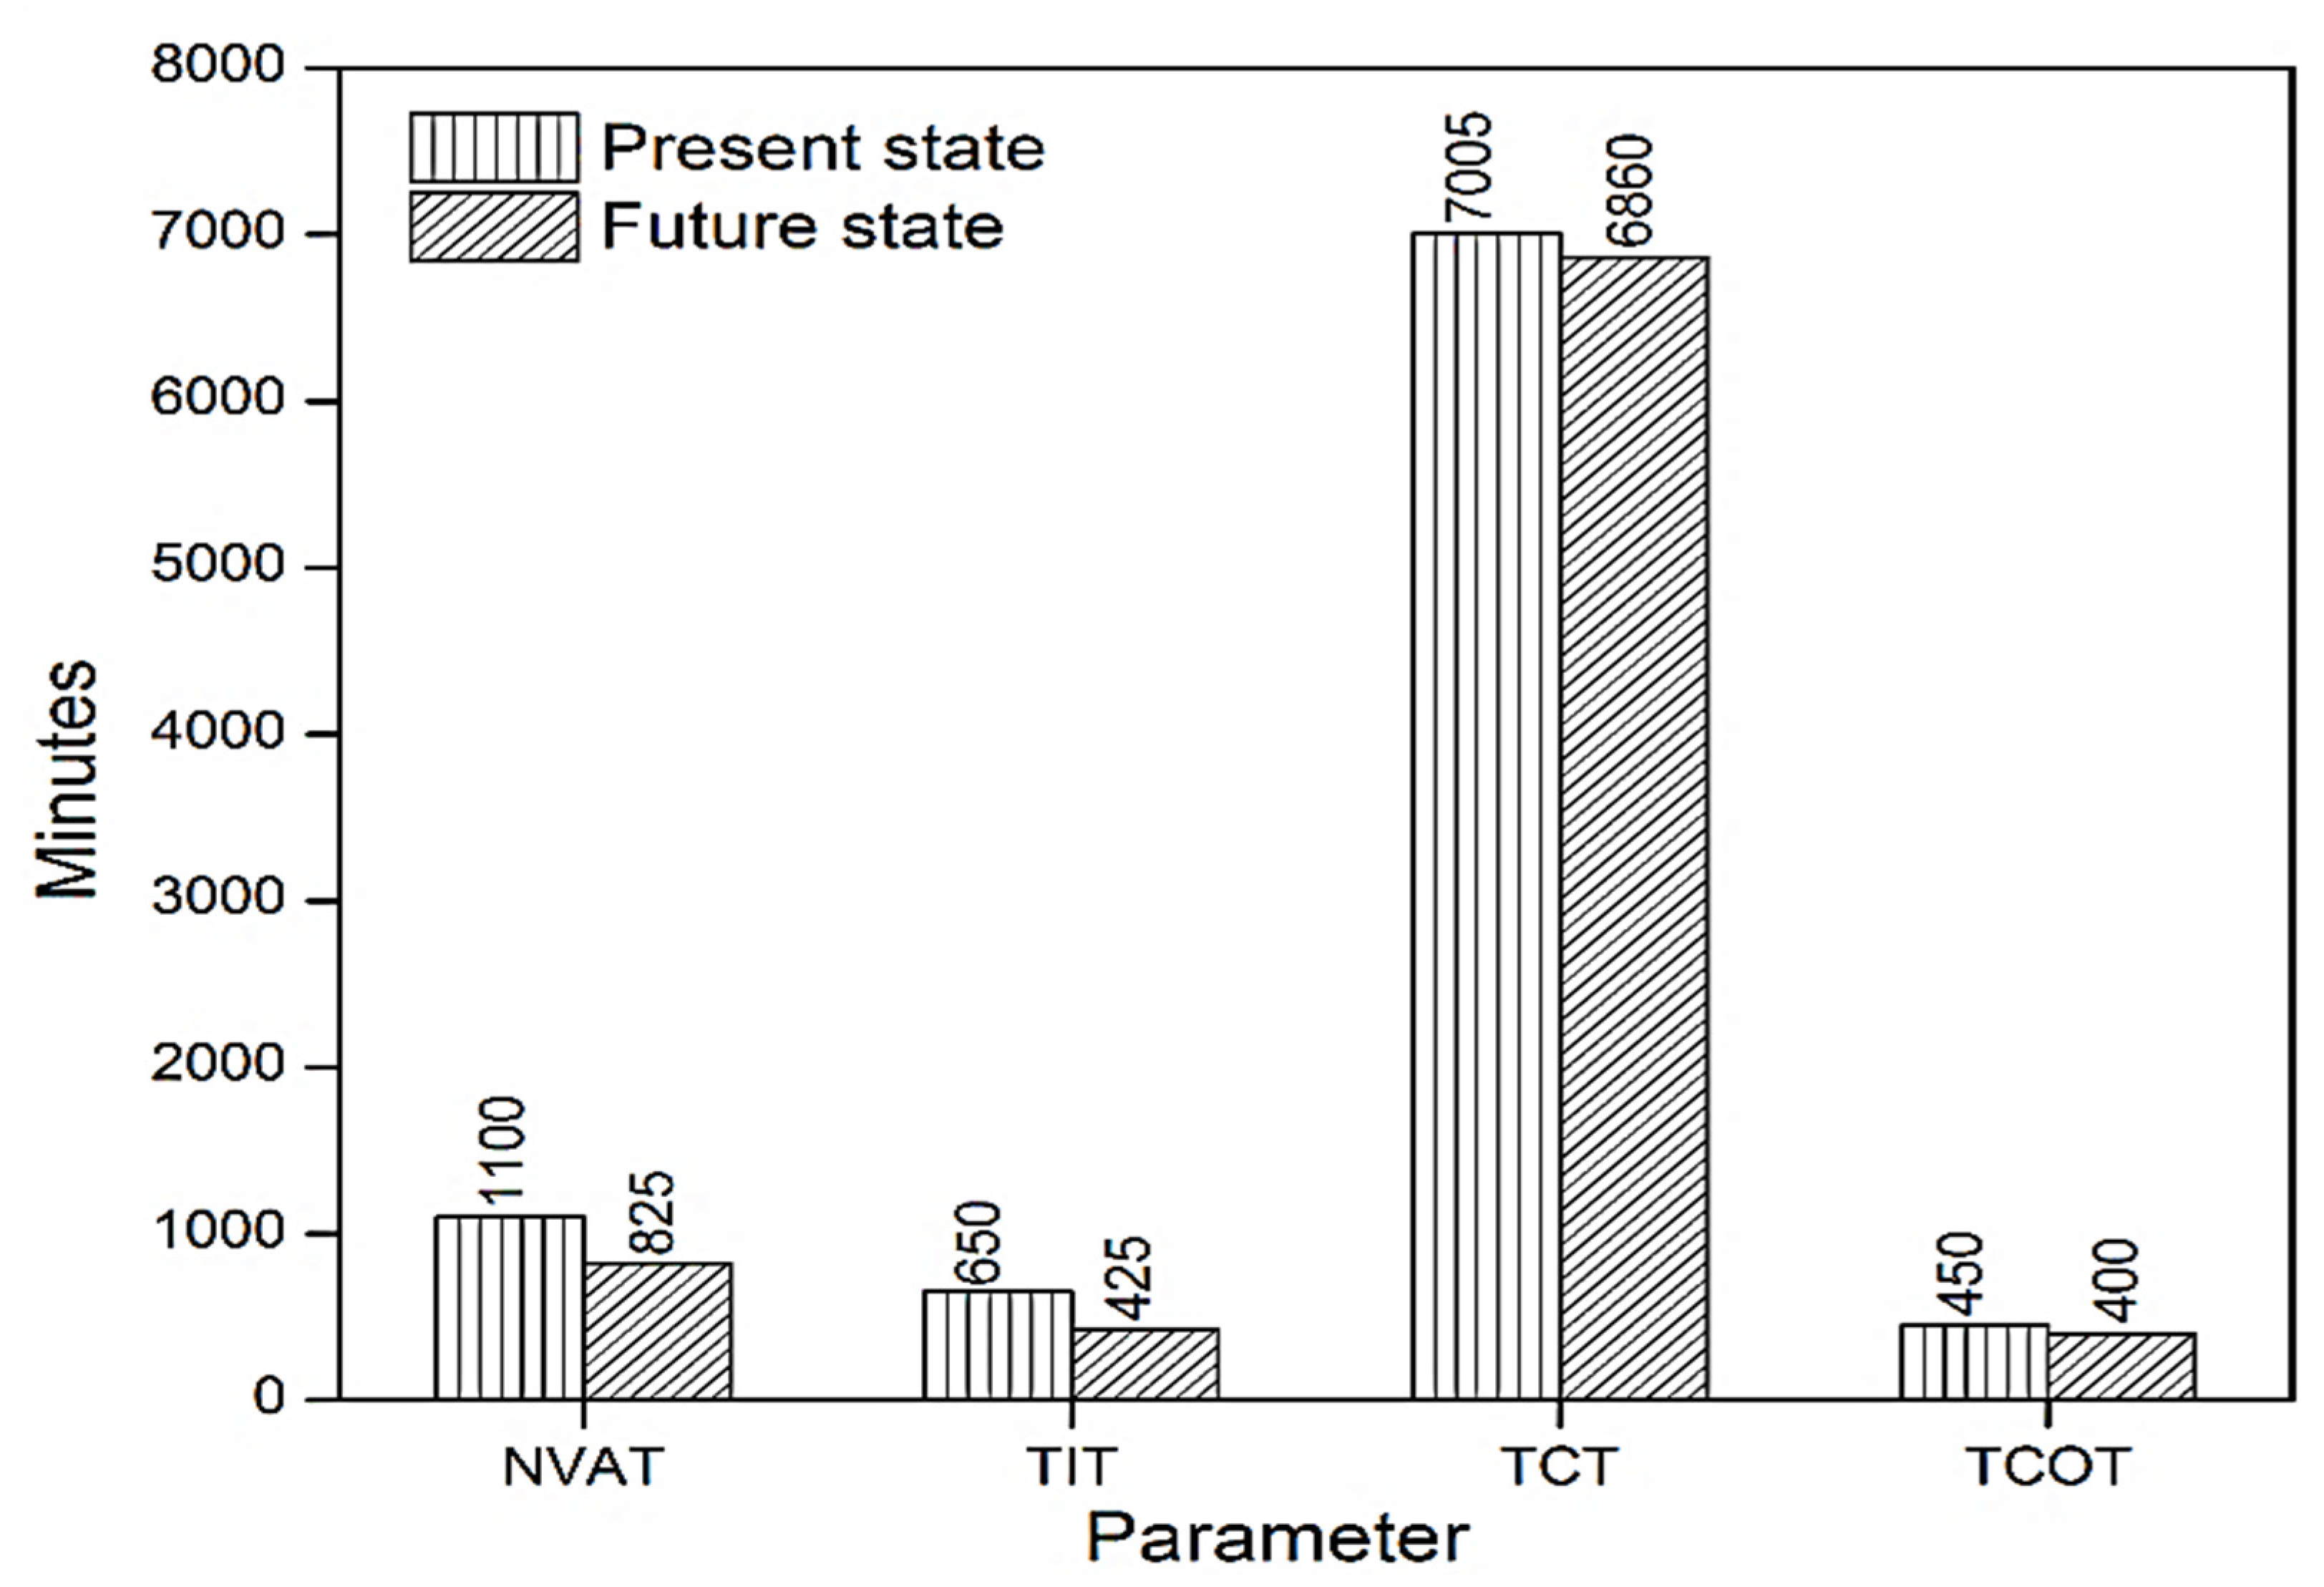
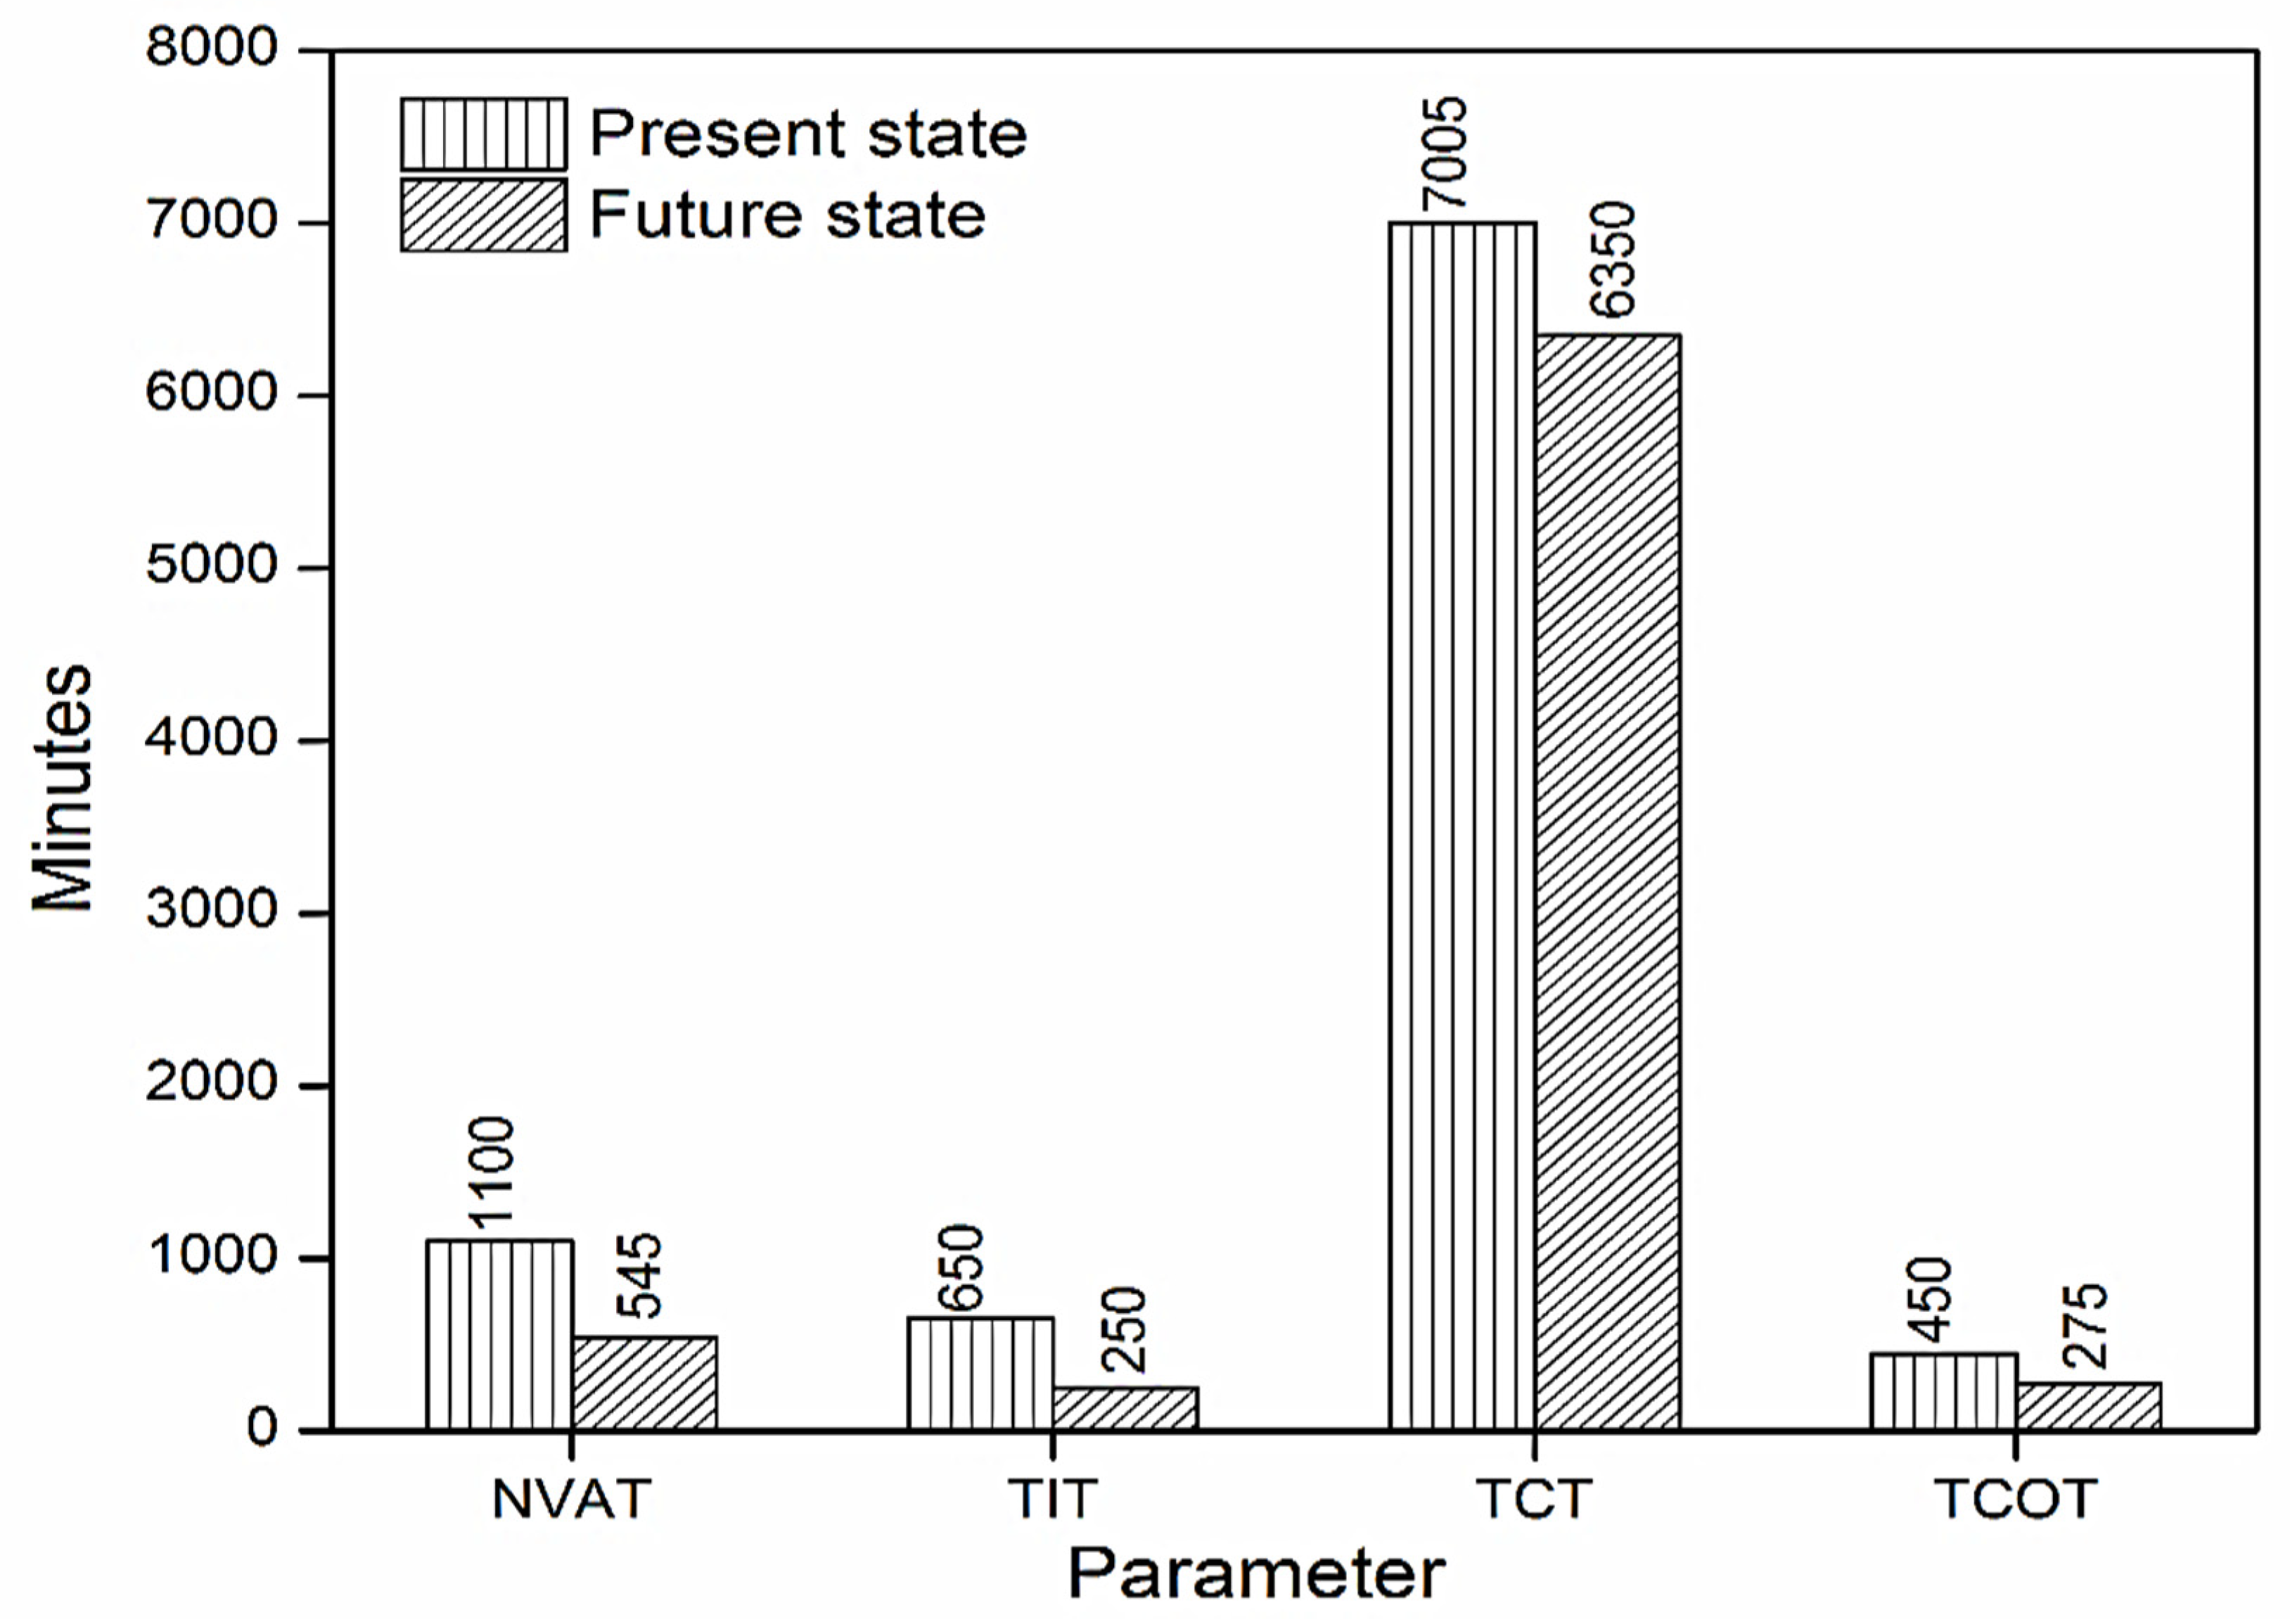
It has been observed that the proposed approach significantly reduced TCT by 655 min, TIT by 400 min, TT by 30 min, TCOT by 175 min, and NVAT by 555 min compared to the traditional methodology, which reduced TCT by 155 min, TIT by 225 min, TT by 10 min, TCOT by 50 min, and NVAT by 275 min.
iv.
It has also been observed that the proposed methodology remarkably reduced the implementation time from 540 min to 525 min, which increases the physical and mental comfort of the workers. This information is based on general discussions with workers.
v.
It is observed that VSM has become inefficient in today’s Industry 4.0, hence the proposed methodology can be implemented to increase the stability and adaptability of VSM in Industry 4.0.
vi.
The proposed methodology helps management team members to enhance operational excellence using limited resources by providing a sustainable guideline for shop floor management.
vii.
The developed methodology is highly beneficial for industry individuals and allows them to obtain sustainable organizational systems with minimum waste on the respective shop floors for the purposes of achieving the goal of industry 4.0
viii.
The authors of the present study strongly believe that the proposed methodology is able to provide a robust guideline to management teams involved in decision-making, and it is applicable to all types of shop floor management, including Industry 4.0.

10. Future Scope

In the present scenario, shop floor management teams emphasized the importance of controlling operational performance using a sustainable system [3,13,21,32,35,38]. An agile system has to be developed to accomplish this need; the present study develops an agile system to enhance productivity using available resources. The developed system has been implemented in a real shop situation of Industry 4.0 to prove its suitability under current production conditions. The result showed that the developed system was efficient in enhancing productivity by eliminating non-value-added activities within industrial barriers. In the future, the applicability of the proposed system could be increased by improving the different shop floor conditions of Industry 4.0. The proposed system can also be improved by integrating the developed system with other improvement approaches.

Author Contributions

Conceptualization, V.T., S.C., A.B. and S.S. (Shubham Sharma); methodology, V.T., S.C., A.B. and S.S. (Shubham Sharma); formal analysis, V.T. and S.S. (Shubham Sharma); investigation, V.T., S.C., A.B. and S.S. (Shubham Sharma); resources, V.T., S.S. (Shubham Sharma), S.S. (Sunpreet Singh), D.Y.P. and K.G.; writing—original draft preparation, V.T. and S.S. (Shubham Sharma); writing—review and editing, V.T., S.C., A.B., S.S. (Shubham Sharma), C.L., D.Y.P., K.G., S.S. (Sunpreet Singh) and G.D.G.; supervision, S.C. and S.S. (Shubham Sharma); funding acquisition, S.S. (Shubham Sharma), D.Y.P. and KG. All authors have read and agreed to the published version of the manuscript.

Funding

This work received no external funding.

Institutional Review Board Statement

Not applicable.

Informed Consent Statement

Not applicable.

Data Availability Statement

The data presented in this study are available on request from the corresponding author.

Conflicts of Interest

The authors declare no conflict of interest.

Abbreviations

Available timeAT
Cycle timeCT
Changeover timeCO
DowntimeDT
Ideal timeIT
Lead timeLT
Non-value-added timeNVAT
Non-value-added activitiesNVA
Value added activitiesVAA
Non-productive timeNPT
Number of workers/operatorsNR
Number of processesNP
Number of productsND
Number of shiftsNS
Number of shopsNH
Production per dayPP
Planned downtimePD
Productive timePT
Takt timeTT
Total ideal timeTIT
Total planned downtimeTPD
Total cycle timeTCT
Total working timeTWT
Total production timeTPT
Total change over timeTCOT
Total ideal timeTIT
Total lead timeTLT
Type of layoutTY
Type of productionTP
Total up timeTUT
Types of wastesTWS
Up timeUT
Unwanted processUP
Value added timeVAT
Value stream mappingVSM
Overall equipment effectivenessOEE
Total productive maintenanceTPM
Single-minute exchange of diesSMED
WastesWS
Work in processWIP
Working timeWT

References

  1. Ramadan, M.; Salah, B.; Othman, M.; Ayubali, A.A. Industry 4.0-Based Real-Time Scheduling and Dispatching in Lean Manufacturing Systems. Sustainability 2020, 12, 2272. [Google Scholar] [CrossRef] [Green Version]
  2. Almoslehy, S.A.M.; Alkahtani, M.S. Key Approaches, Risks, and Product Performance in Managing the Development Process of Complex Products Sustainably. Sustainability 2021, 13, 4727. [Google Scholar] [CrossRef]
  3. Tripathi, V.; Chattopadhyaya, S.; Mukhopadhyay, A.K.; Sharma, S.; Singh, J.; Pimenov, D.Y.; Giasin, K. An Innovative Agile Model of Smart Lean–Green Approach for Sustainability Enhancement in Industry 4.0. J. Open Innov. Technol. Mark. Complex. 2021, 7, 215. [Google Scholar] [CrossRef]
  4. Tripathi, V.; Saraswat, S.; Gautam, G.D. A Study on Implementation of Various Approaches for Shop Floor Management; Springer International Publishing: Singapore, 2021; Volume 766, pp. 371–387. [Google Scholar] [CrossRef]
  5. Saabye, H.; Kristensen, T.B.; Wæhrens, B.V. Real-Time Data Utilization Barriers to Improving Production Performance: An In-depth Case Study Linking Lean Management and Industry 4.0 from a Learning Organization Perspective. Sustainability 2020, 12, 8757. [Google Scholar] [CrossRef]
  6. Tripathi, V.; Saraswat, S.; Gautam, G.D. Development of a Systematic Framework to Optimize the Production Process in Shop Floor Management; Springer International Publishing: Singapore, 2022; pp. 57–66. [Google Scholar] [CrossRef]
  7. Schoeman, Y.; Oberholster, P.; Somerset, V. Value Stream Mapping as a Supporting Management Tool to Identify the Flow of Industrial Waste: A Case Study. Sustainability 2021, 13, 91. [Google Scholar] [CrossRef]
  8. Lacerda, A.P.; Xambre, A.R.; Alvelos, H. Applying Value Stream Mapping to eliminate waste: A case study of an original equipment manufacturer for the automotive industry. Int. J. Prod. Res. 2016, 54, 1708–1720. [Google Scholar] [CrossRef]
  9. Dadashnejad, A.A.; Valmohammadi, C. Investigating the effect of value stream mapping on overall equipment effectiveness: A case study. Total. Qual. Manag. Bus. Excell. 2019, 30, 466–482. [Google Scholar] [CrossRef]
  10. Garza-Reyes, J.A.; Kumar, V.; Chaikittisilp, S.; Tan, K.H. The effect of lean methods and tools on the environmental per-formance of manufacturing organisations. Int. J. Prod. Econ. 2018, 200, 170–180. [Google Scholar] [CrossRef]
  11. Tripathi, V.; Saraswat, S. Lean manufacturing for shop floor of automotive industries: A study. J. Exp. Appl. Mech. 2018, 9, 258–265. [Google Scholar]
  12. Tripathi, V.; Saraswat, S.; Gautam, G.; Singh, D. Shop Floor Productivity Enhancement Using a Modified Lean Manufacturing Approach. In Recent Trends in Industrial and Production Engineering; Lecture Notes in Mechanical Engineering Springer: Singapore, 2021. [Google Scholar] [CrossRef]
  13. Shou, W.; Wang, J.; Wu, P.; Wang, X. Lean management framework for improving maintenance operation: Development and application in the oil and gas industry. Prod. Plan. Control 2021, 32, 585–602. [Google Scholar] [CrossRef]
  14. Byrne, B.; McDermott, O.; Noonan, J. Applying Lean Six Sigma Methodology to a Pharmaceutical Manufacturing Facility: A Case Study. Processes 2021, 9, 550. [Google Scholar] [CrossRef]
  15. Cannas, V.G.; Pero, M.; Pozzi, R.; Rossi, T. Complexity reduction and kaizen events to balance manual assembly lines: An application in the field. Int. J. Prod. Res. 2018, 56, 3914–3931. [Google Scholar] [CrossRef]
  16. Varela, L.; Araújo, A.; Ávila, P.; Castro, H.; Putnik, G. Evaluation of the Relation between Lean Manufacturing, Industry 4.0, and Sustainability. Sustainability 2019, 11, 1439. [Google Scholar] [CrossRef] [Green Version]
  17. Tyagi, S.; Choudhary, A.; Cai, X.; Yang, K. Value stream mapping to reduce the lead-time of a product development process. Int. J. Prod. Econ. 2015, 160, 202–212. [Google Scholar] [CrossRef] [Green Version]
  18. Ben Ruben, R.; Vinodh, S.; Asokan, P. Implementation of Lean Six Sigma framework with environmental considerations in an Indian automotive component manufacturing firm: A case study. Prod. Plan. Control 2017, 28, 1193–1211. [Google Scholar] [CrossRef]
  19. Thomas, A.J.; Francis, M.; Fisher, R.; Byard, P. Implementing Lean Six Sigma to overcome the production challenges in an aerospace company. Prod. Plan. Control 2016, 27, 591–603. [Google Scholar] [CrossRef]
  20. Méndez, J.D.M.; Rodriguez, R.S. Total productive maintenance (TPM) as a tool for improving productivity: A case study of application in the bottleneck of an auto-parts machining line. Int. J. Adv. Manuf. Technol. 2017, 92, 1013–1026. [Google Scholar] [CrossRef]
  21. Gupta, V. Application of value stream mapping for lean operations and cycle time reduction: An Indian case study. Prod. Plan. Control 2005, 16, 44–59. [Google Scholar] [CrossRef]
  22. Singh, H.; Singh, A. Application of lean manufacturing using value stream mapping in an auto-parts manufacturing unit. J. Adv. Manag. Res. 2013, 10, 72–84. [Google Scholar] [CrossRef]
  23. Kumar, S.; Dhingra, A.K.; Singh, B. Process improvement through Lean-Kaizen using value stream map: A case study in India. Int. J. Adv. Manuf. Technol. 2018, 96, 2687–2698. [Google Scholar] [CrossRef]
  24. Seth, D.; Seth, N.; Dhariwal, P. Application of value stream mapping (VSM) for lean and cycle time reduction in complex production environments: A case study. Prod Plan. Control 2017, 28, 398–419. [Google Scholar] [CrossRef]
  25. Vinodh, S.; Somanaathan, M.; Arvind, K.R. Development of value stream map for achieving leanness in a manufacturing or-ganization. J. Eng. Des. Technol. 2013, 11, 129–141. [Google Scholar]
  26. Solding, P.; Gullander, P. Concepts for simulation based Value Stream Mapping. In Proceedings of the 2009 Winter Simulation Conference (WSC), Austin, TX, USA, 13–16 December 2009; pp. 2231–2237. [Google Scholar]
  27. Andrade, P.F.; Pereira, V.G.; Del Conte, E.G. Value stream mapping and lean simulation: A case study in automotive company. Int. J. Adv. Manuf. Technol. 2016, 85, 547–555. [Google Scholar] [CrossRef]
  28. Coppini, N.L.; Bekesas, L.C.; Baptista, E.A.; Junior, M.V.; Lucato, W.C. Value stream mapping simula-tion using ProModel® software. In Proceedings of the 2011 IEEE International Conference on Industrial Engineering and Engineering Management, Singapore, 6–9 December 2011; pp. 575–579. [Google Scholar]
  29. Dotoli, M.; Fanti, M.P.; Iacobellis, G.; Rotunno, G. A lean manufacturing strategy using Value Stream Mapping, the Unified Modeling Language, and discrete event simulation. In Proceedings of the 2012 IEEE International Conference on Automation Science and Engineering (CASE), Seoul, Korea, 20–24 August 2012; pp. 668–673. [Google Scholar] [CrossRef]
  30. Sahoo, A.K.; Singh, N.K.; Shankar, R.; Tiwari, M.K. Lean philosophy: Implementation in a forging company. Int. J. Adv. Manuf. Technol. 2008, 36, 451–462. [Google Scholar] [CrossRef]
  31. Chen, J.C.; Cheng, C.-H.; Huang, P.B.; Wang, K.-J.; Huang, C.-J.; Ting, T.-C. Warehouse management with lean and RFID application: A case study. Int. J. Adv. Manuf. Technol. 2013, 69, 531–542. [Google Scholar] [CrossRef]
  32. Das, B.; Venkatadri, U.; Pandey, P. Applying lean manufacturing system to improving productivity of air-conditioning coil manufacturing. Int. J. Adv. Manuf. Technol. 2014, 71, 307–323. [Google Scholar] [CrossRef]
  33. Tortorella, G.L.; Fettermann, D.C. Implementation of Industry 4.0 and lean production in Brazilian manufacturing companies. Int. J. Prod. Res. 2018, 56, 2975–2987. [Google Scholar] [CrossRef]
  34. Leong, W.D.; Teng, S.Y.; How, B.S.; Ngan, S.L.; Rahman, A.A.; Tan, C.P.; Ponnambalam, S.; Lam, H.L. Enhancing the adaptability: Lean and green strategy towards the Industry Revolution 4.0. J. Clean. Prod. 2020, 273, 122870. [Google Scholar] [CrossRef]
  35. Florescu, A.; Barabaş, B. Integrating the Lean concept in sustainable manufacturing development. In Proceedings of the IOP Conference Series: Materials Science and Engineering, Kuala Lumpur, Malaysia, 13–14 August 2018; IOP Publishing: Bristol, UK, 2018; Volume 399, p. 012018. [Google Scholar]
  36. Brozzi, R.; Forti, D.; Rauch, E.; Matt, D.T. The Advantages of Industry 4.0 Applications for Sustainability: Results from a Sample of Manufacturing Companies. Sustainability 2020, 12, 3647. [Google Scholar] [CrossRef]
  37. Kamble, S.; Gunasekaran, A.; Dhone, N.C. Industry 4.0 and lean manufacturing practices for sustainable organisational per-formance in Indian manufacturing companies. Int. J. Prod. Res. 2020, 58, 1319–1337. [Google Scholar] [CrossRef]
  38. Florescu, A.; Barabas, S.A. Simulation tool for assessing the performance of Flexible Manufacturing Systems. In IOP Conference Series: Materials Science and Engineering, Proceedings of the 2nd International Conference on Manufacturing Technologies (ICMT 2018), Orlando, FL, USA, 19–21 January 2018; IOP Publishing: Bristol, UK, 2018; Volume 398, p. 012023. [Google Scholar]
  39. Chiarini, A.; Kumar, M. Lean Six Sigma and Industry 4.0 integration for Operational Excellence: Evidence from Italian manufacturing companies. Prod. Plan. Control 2020, 32, 1–18. [Google Scholar] [CrossRef]
  40. Cioffi, R.; Travaglioni, M.; Piscitelli, G.; Petrillo, A.; Parmentola, A. Smart Manufacturing Systems and Applied Industrial Technologies for a Sustainable Industry: A Systematic Literature Review. Appl. Sci. 2020, 10, 2897. [Google Scholar] [CrossRef] [Green Version]
  41. Vinodh, S.; Arvind, K.R.; Somanaathan, M. Application of value stream mapping in an Indian camshaft manufacturing organisation. J. Manuf. Technol. Manag. 2010, 21, 888–900. [Google Scholar] [CrossRef]
  42. Jasti, N.; Sharma, A. Lean manufacturing implementation using value stream mapping as a tool: A case study from auto components industry. Int. J. Lean Six Sigma 2014, 5, 89–116. [Google Scholar] [CrossRef]
  43. Ramani, P.V.; Lingan, L.K. Developing a lean model to reduce the design process cost of gas insulated switchgear foundation using value stream mapping—A case study. Int. J. Constr. Manag. 2019, 1–9. [Google Scholar] [CrossRef]
  44. Sutharsan, S.; Prasad, M.M.; Vijay, S. Productivity enhancement and waste management through lean philosophy in Indian manufacturing industry. Mater. Today Proc. 2020, 33, 2981–2985. [Google Scholar] [CrossRef]
  45. Lugert, A.; Batz, A.; Winkler, H. Empirical assessment of the future adequacy of value stream mapping in manufacturing industries. J. Manuf. Technol. Manag. 2018, 29, 886–906. [Google Scholar] [CrossRef]
  46. Felsberger, A.; Reiner, G. Sustainable Industry 4.0 in Production and Operations Management: A Systematic Literature Review. Sustainability 2020, 12, 7982. [Google Scholar] [CrossRef]
  47. Syreyshchikova, N.V.; Pimenov, D.Y.; Mikolajczyk, T.; Moldovan, L. Automation of Production Activities of an Industrial Enterprise based on the ERP System. Procedia Manuf. 2020, 46, 525–532. [Google Scholar] [CrossRef]
  48. Syreyshchikova, N.V.; Pimenov, D.Y.; Kulygina, I.A.; Moldovan, L. Hybrid Model for Calculating Quality Costs. Russ. Eng. Res. 2021, 41, 382–386. [Google Scholar] [CrossRef]
  49. Syreyshchikova, N.; Pimenov, D.; Yaroslavova, E.; Gupta, M.; Aamir, M.; Giasin, K. Managing Risks in the Improved Model of Rolling Mill Loading: A Case Study. J. Risk Financ. Manag. 2021, 14, 359. [Google Scholar] [CrossRef]
  50. Syreyshchikova, N.V.; Pimenov, D.Y.; Markopoulos, A.P.; Moldovan, L. Value Stream Maps in Clock Production. Russ. Eng. Res. 2021, 41, 378–381. [Google Scholar] [CrossRef]
  51. Tayal, A.; Kalsi, N.S.; Gupta, M.K.; Pimenov, D.Y.; Sarikaya, M.; Pruncu, C.I. Effectiveness Improvement in Manufacturing Industry; Trilogy Study and Open Innovation Dynamics. J. Open Innov. Technol. Mark. Complex. 2021, 7, 7. [Google Scholar] [CrossRef]
Figure 1. Approaches implemented in previous research works.
Sustainability 13 11997 g001
Figure 2. Proposed methodology and its applications in industry 4.0.
Sustainability 13 11997 g002
Figure 3. Application of present research work.
Sustainability 13 11997 g003
Figure 4. Attributes of present methodology for implementation of VSM.
Sustainability 13 11997 g004
Figure 5. Present map of the shop floor.
Sustainability 13 11997 g005
Figure 6. (a) Variation of Total idle time (TIT) for the present state map of the shop floor, and (b) Variation of Total idle time (TIT) for the future state map of the shop floor.
Sustainability 13 11997 g006
Figure 7. Proposed map of the shop floor.
Sustainability 13 11997 g007
Figure 8. Comparison between parameters of the present and the future state map according to the traditional methodology.
Sustainability 13 11997 g008
Figure 9. Comparison of CT between the present and the future state of traditional methodology.
Sustainability 13 11997 g009
Figure 10. Comparison of CO between the present and the future state of traditional methodology.
Sustainability 13 11997 g010
Figure 11. Workflow chart for proposed methodology coupled with VSM.
Sustainability 13 11997 g011
Figure 12. Flow chart of production processes on the shop floor.
Sustainability 13 11997 g012
Figure 13. Comparison of CO between the present and the future state of the proposed methodology.
Sustainability 13 11997 g013
Figure 14. Comparison of CT between the present and the future state of the proposed methodology.
Sustainability 13 11997 g014
Figure 15. Comparison of parameters between the present and the future state according to the proposed methodology.
Sustainability 13 11997 g015
Figure 16. Comparison of calculated parameters between the present state and the future state of the proposed methodology.
Sustainability 13 11997 g016
Figure 17. Comparison of CO between the traditional and the future proposed methodology.
Sustainability 13 11997 g017
Figure 18. Comparison of CT between the traditional and the proposed methodology.
Sustainability 13 11997 g018
Figure 19. Improvement in parameters by the traditional methodology and the proposed methodology.
Sustainability 13 11997 g019
Table 1. Observed data from the present shop floor.
S.N.Observed DataQuantity
1Number of shifts1
2Working time570 min
3Downtime30 min
4Number of workers44
5Production per day4
6Available time540 min
7Number of processes24
Table 2. Sources and information regarding the product.
S.N.SourceInformation
1.Market surveyDrawbacks of present skid steer loader (product)
2.Discussion with workersResponsible reason for the production
3.Industry recordsReason for failure to obtain the desired product
4.CustomerExpectation for product
Table 3. Analysis of present shop floor based on the gathered information.
S.N.FactorData/Quantity
1.Previous production records4 skid steer loaders per day
2.Resources availabilityMetallic inert gas welding, arc welding, gas welding, 34 m × 75 m shop floor, 44 workers, profile cutting machine, hoist for material handling, forklift
3.Types of wastesTransportation, waiting, extra-processing, motion, and non-utilized talent
4.Lack/drawbacks on the shop floorMiscommunication, unplanned production, improper workflow, random location of equipment
5.Downtime30 min
Table 4. Values of different parameters of the present shop floor.
S.N.ProcessAT (Min)UT (%)NRCO (Min)CT (Min)
1.Gearbox cleaning54099.072515
2.Gearbox assembly54098.1421080
3.Gearbox buffing54098.1421025
4.Manufacturing of loader arm54094.44230150
5.Inspection of loader arm54099.072515
6.Propeller shaft assembly54099.073575
7.Axle assembly54096.2932045
8.Inspection of assembly54099.072510
9.Chassis manufacturing54092.59440160
10.Chassis inspection54099.072525
11.Wheel assembly54096.2942065
12.Chassis and loader arm fabrication54092.59540175
13.Inspection of fabrication54098.1411025
14.Painting (Baby parts)54098.14510230
15.Painting (Large parts)54092.592402150
16.Engine assembly54093.52335110
17.Hydraulic pump assembly54098.1421035
18.Hydraulic motor assembly54098.1421045
19.Roll off54097.2221545
20.Hot testing54089.815553000
21.Cabin installment54096.29320140
22.Electric gauge assembly54095.37325195
23.Quality inspection54098.14310130
24.Aftercare54097.2221560
Table 5. Values of the decision-making factors.
S.N.FactorData/Quantity
1.Number of shops7
2.Type of layoutProcess
3.Number of workers44
4.Type of production systemPull production
5.Number of processes16
6.Working time570 min
7.Downtime45 min
8.Available time525 min
Table 6. Parameter calculation of the proposed shop floor.
S.N.ProcessAT (Min)UT (%)NRCO (Min)CT (Min)
1.Gear box cleaning and assembly52599.052590
2.Gear box buffing52599.052515
3.Propeller shaft assembly52599.054560
4.Axle assembly52597.1431545
5.Chassis manufacturing52593.33435150
6.Wheel assembly52597.1441555
7.Manufacturing of loader arm52595.23325120
8.Chassis and loader arm fabrication52593.33535160
9.Painting (Baby parts and large parts)52599.05352150
10.Engine assembly52595.2432565
11.Hydraulic pump and motor assembly52598.0921060
12.Roll off52597.1431535
13.Hot testing52590.475502940
14.Cabin installment and electric gauge assembly52596.19320270
15.Quality inspection52599.053590
16.Aftercare52599.052545
Table 7. Improvements in the various parameters of the shop floor.
S.N.Parameters of Shop FloorTraditional MethodologyProposed MethodologyImprovement (Min)
1.TT125 min105 min20 min
2.TCT6860 min6350 min510 min
3.TCOT400 min275 min125 min
4.TLT7270 min6895 min375 min
5.NVAT825 min545 min280 min
6.TIT425 min250 min175 min
7.TUT45.71%58.37%12.66%
Table 8. The solutions implemented on the shop floor for the elimination of identified problems.
S.N.Production ProcessProblemActionIdentified WasteResult
1.Gearbox cleaning----
2.Gearbox assembly----
3.Gearbox buffingUnnecessary transportation of gearbox from one station to another stationAll types of processes related to gearbox are performed on a single stationTransportationImproved operation time with a reduction in CT, CO, and IT.
4.Manufacturing of loader armHigher setup time of operation due to less NR.Increase the NR.WaitingImproved CT and CO.
5.Inspection of the loader armUnnecessary transportation between the stations.Inspection is done on the previous workstation (fabrication of loader arm).TransportationManufacturing of loader arm and inspection of loader arm is performed at one station.
6.Propeller shaft assemblyLess NR and lack in the skill of workers.Increase the NR and provide proper training.Non-utilized talentImproved operation time with a reduction in CT and CO.
7.Axle assemblyBoth assembly and inspection are carried out at two stations, leading to unnecessary transportation time and consumes more time in the processes.Both assembly and inspection are performed at one station.TransportationImproved CT and CO.
8.Inspection of assembly
9.Chassis manufacturingIrregular setup and improper planning for chassis manufacturing.Proper planning and setup provided for chassis manufacturing.MotionReduced CT, CO, IT, and both processes are performed at one station.
10.Chassis inspectionRandom location for inspection and manual handling of chassis.Both processes are performed at one station.Motion
11.Wheel assemblyThe communication gap between workers, and the involvement of one worker from another shopsOrganized meetings between workers, replace other shop worker, and involve one other worker.WaitingImproved CT and CO.
12.Chassis and loader arm fabricationA longer distance between the loader arm manufacturing shop and the chassis and loader arm fabrication shop.The locations of both stations have been changed.TransportationImproved CT and CO.
13.Inspection of fabricationUnnecessary transportation between the stations.Inspection is done on the previous workstationTransportationReduced CT, CO, IT, and both processes are performed at one station.
14.Painting (Baby parts)There was no problem seenNo action was required.--
15.Painting (Big parts)Painting was being done from another plant and it resulted in more time.Painting (Baby parts) Painting (Big parts) are started at the same time.WaitingReduced CT, CO, and IT.
16.Engine assemblyClutter of devices and unbalanced hoist system.Repair hoist system and provide a proper arrangement of tools.DefectImproved PT and reduced CT and CO.
17.Hydraulic pump assemblyTransportation between the stations results in more time, while both tasks can be done at the same station.Both processes are performed at one station.TransportationReduced CT, CO, IT, and both processes are performed at one station.
18.Hydraulic motor assembly
19.Roll-offLess NR and lack of a fixed workstation to take action.Increase the NR and decide on a work location to perform the process.MotionImproved CT and CO.
20.Hot testingUnnecessary parking of skid steer loader at the ground after hot testing.Provide a time limit to start the next process after hot testing, which may vary according to the condition of the skid steer loader.MotionImproved CT and CO.
21.Cabin installmentAllotment of different workers on both workstations, lack of work knowledge and communication gap between workers.Organize meetings of concerned workers and both processes are performed at one station.Waiting, motion, non-utilized talentReduced CT, CO, and IT.
22.Electric gauge assembly
23.Quality inspectionInvolvement of unnecessary operations that have already been tested in previous processes.The inspections that are required for quality inspection are listed.MotionImproved CT and CO.
24.AftercareInvolvement of one worker from another shops more time for allotment of duty.Involve one other worker and pre-plan assignment of duty.Waiting and motionImproved CT and CO
Table 9. List of requirements for different processes of shop floor.
S.No.Requirement of Shop FloorProcesses
Gearbox CleaningGearbox AssemblyGearbox BuffingManufacturing of Loader ArmInspection of the Loader ArmPropeller Shaft AssemblyAxle AssemblyInspection of AssemblyChassis ManufacturingChassis InspectionWheel AssemblyChassis & Loader Arm FabricationInspection of FabricationPainting (Baby Parts)Painting (Big Parts)Engine AssemblyHydraulic Pump AssemblyHydraulic Motor AssemblyRoll-OffHot TestingCabin InstalmentElectric Gauge AssemblyQuality InspectionAfter Care
1.Elimination of non-productive activitiesNYYYYYYNYYYYYNYYYYYYYYYY
2.Resource’s availabilityNNNYNYNNNNYNNNYYNNYNYYNY
3.Improvement in machineryYNNNNNNNNNNYYYYYNNNNNNNN
4.Improvement in worker skillNNNNNYNNNNYNNNNNNNNNYYNN
5.Improvement in layoutNNNYYYYNYNYYYNNNNNYNNNNN
6.Improvement in production planningNYYYYYNYYNNYYNNNNYYYYYYY
Publisher’s Note: MDPI stays neutral with regard to jurisdictional claims in published maps and institutional affiliations.

