Abstract
Green residential buildings (GRBs) are an important part of the concept of green building. Although green buildings are well studied for geographic distribution and influencing factors, GRBs have not been fully explored or widely noted by parties involved in the building sectors. In this paper, we study the geographic distribution and influencing factors of 2134 GRBs that met the Green Building Evaluation Standard and obtained a green building logo in 2008–2016 in China. First, we analyze the geographic distribution and spatial correlation of GRBs with different star ratings at the provincial and municipal levels by natural break-point method and Moran’s index. Second, we study the aggregation degree of medium- and high-star GRBs in each province by development concentration index and define 42 leading cities with more favorable levels of GRB development. Third, we analyze the correlation between the GRBs’ number and 18 influencing factors covering the social economy and real estate market in the 42 leading cities. According to the analysis, this paper shows that (1) there are differences in the geographical distribution characteristics of different star green buildings in China. (2) The differences in geographical distribution and the spatial correlation of GRBs are more obvious in the study of municipal administrative division levels. (3) The local commercial residential building prices and the local residents’ economic and social statuses, education levels, and living standards are significantly positively correlated with the grade of GRBs.
1. Introduction
As an important industry of the national economy, construction plays an important role in protecting and improving people’s lives by providing architectural space. The industry also consumes a large amount of energy [1,2]. For instance, the construction industry contributed 6.9% to China’s GDP [3] but consumed 46.5% of Chinese energy and contributed 51.3% of the country’s carbon emissions in 2018 [4]. Based on the local climate characteristics and site conditions, green buildings have achieved good energy-saving effects by using natural ventilation, natural lighting, thermal insulation of enclosure structures, and efficient energy equipment. Kats [5] reviewed 60 green buildings with LEED rating in the United States, and clearly demonstrated that green buildings were on average 25% to 30% more energy efficient than conventional buildings. No and Won [6] comparatively analyzed energy consumption between a green building with Green Standard for Energy and Environmental Design certification and general buildings in Korea and showed that certified buildings used at least 35.5% to 48.9% less energy than non-certified buildings. The energy-saving research on China’s green residential buildings (GRBs) is mostly based on specific cases. For example, due to the use of autoclaved aerated concrete blocks, inorganic insulation mortar, and extruded polystyrene on the external walls and the use of hollow glass windows on the external windows, the relative energy-saving rate of the envelope structure of the three-star GRB Xiamen Haicang Ecological Garden had increased by 39.4% [7]. Hence, promoting the development of green buildings to reduce the building industry’s energy consumption and carbon emissions is undoubtedly one of the most feasible measures for achieving the goal of a carbon peak in 2030 and carbon neutrality in 2060.
Green buildings usually refer to high-quality buildings that can save resources, reduce pollution, protect the environment, and provide people with healthy, comfortable, and efficient spaces for the whole lifecycle [8,9]. Before the early 2000s, green buildings were limited to academic discussions and rarely put in practice [10]. The Ministry of Housing and Urban–Rural Development of China published the Green Building Evaluation Standard (GBES) in 2006, which clarified the technical criteria for green ratings based on the design and operation of buildings and divided green buildings into three levels. Nevertheless, due to imperfect implementation rules, GBES certification was not officially launched until 2008 [11]. The number of GBES certification projects has since been experiencing rapid growth in China [2,10,12,13,14]. A total of 4515 projects and 320 million square-meters obtained green building evaluation labels from 2008 to 2016 (as of the end of September).
It is noteworthy that the area of certified GRBs accounts for 61.19% of all green buildings in China, and that real-estate developers declared 85% of all extant green buildings in 2019 [15]. It can be seen that GRBs play a vital role in promoting the development of green buildings in China. Nevertheless, certain problems exist, and it is worthwhile to note the following: (1) The proportion of GRBs in terms of overall real-estate development is extremely small [16,17,18,19]. Real-estate developers opened 1,077,442 million square-meters of residential housing in 2008–2016, as estimated by the China Statistical Yearbook (2009–2017), and GRBs only accounted for 2.97%. (2) The existing GRBs’ certification grades are mainly of low and medium stars [18,20,21]. In 2008–2016, the proportions of one- and two-star certification projects are similar, at 44% and 43.06%, respectively; the proportion of three-star certification projects, meanwhile, is the lowest [22], at only 12.93%. (3) The geographic distribution of GRBs is uneven [11,14,23,24]. Real-estate development projects that received green-label certification are highly unevenly distributed among the Chinese cities [25], with economically developed cities having more GRBs [26]. (4) Different from public and industrial buildings, the motivation for real-estate developers to build GRBs mainly derives from the principle of a market economy based on consumer demand [27,28].
Based on the current situation of GRBs, this study aims to empirically examine the spatial distribution of GRBs with different star ratings at the provincial and municipal levels and ascertain their determinants from the perspective of the market economy in China. Section 2 provides a review of existing literature. Section 3 discusses data and methods used in this empirical study. In all, 2134 GRBs were collected as the case base. Section 4 analyzes the geographic distribution and spatial correlation of GRBs with different star ratings at the provincial and municipal levels by natural break-point method and Moran index and also analyzes the aggregation degree of medium- and high-star GRBs in each province by development concentration index and defines 42 leading cities with more favorable levels of GRBs development. Section 5 studies the correlation between the number of GRBs and 18 influencing factors covering the social economy and real-estate market in the leading cities by Spearman’s correlation coefficient. The final section of the paper includes a conclusion and suggestions for future research.
2. Literature Review
In recent decades, green buildings have attracted wide attention from both researchers and practitioners [29]. Much of academics [2,10,12,14,24,30] studied the spatial distribution characteristics and influencing factors of green buildings in China and pointed out that the geographical distribution of green buildings in China had regional differences and agglomeration characteristics, which were related to economic, social, and policy factors. However, as a kind of green building with a residential function, GRBs were rarely put forward as a separate concept in the current research results. In recent years, some scholars such as Liu and Gu [22] and Zhang [31] did some research, but their research rarely conducted comparative studies on the geographical distribution and influencing factors of GRBs from the perspectives of different evaluation levels and administrative divisions.
Many previous studies found strong evidence that the development of green buildings was uneven, with regional economic factors closely related to the adoption of green buildings [31,32]. Windapo [33] indicated that the key drivers of green building developments were economic factors in South Africa. Zhang [34] showed that green building real-estate projects were mostly concentrated in coastal cities in China with strong economic strength and were gradually transferring to inland cities. Qiu et al. [12] proposed that green buildings were spreading from areas with high economic or administrative energy levels to areas with low energy levels in China.
Researchers also found that a strong real-estate market led to an increasing number of green buildings [35]. Dong [16] asserted that only consumer demand for GRBs could effectively promote their development. Yip [30] suggested that differences in the geographic distribution of green buildings were caused by differences in the economies and real-estate markets of different cities. It was also found that the influences of macroeconomic and real-estate market factors vary among green buildings of different stars. Jia [32] indicated that based on the influence of economic and real-estate development levels, there were great spatial differences between two- and three-star green buildings’ development.
The development of social factors such as residents’ disposable income and education also led to the increased development of green buildings [13,36]. Hu et al. [37] pointed out that purchasers’ willingness to pay for GRBs was determined by their financial and social status. Song et al. [10] demonstrated that economically developed regions were more likely to attract highly educated and high-income residents, and Wu and Xu [38] determined that good-quality housing could hardly be afforded by households with low incomes, poor education level, and limited social capital. Zhang [31] stressed that the levels of economic development and residents’ education had a significant effect on the probability of the first GRBs being developed in an area. Wu and Xu and Wu et al. [38,39], meanwhile, asserted that market immaturity, technological deficiency, and lack of environmental awareness were the main negative influences on the development of GRBs.
3. Data Description and Research Methods
3.1. Data Description
This work collected 2134 GRBs that met the Green Building Evaluation Standard and obtained a green building logo in 2008–2016 in China, the data on which were published via the Chinese Green Building Evaluation Label (http://www.cngb.org.cn/, accessed on 20 July 2021). Base on the data that could be accessed, this study used the name of each project, star rating, and provincial information to determine the number of different-star GRBs in each province and city.
Based on the existing literature [8,16,24,30,40,41] and the current situation of China’s urban socioeconomic development, this paper groups 18 explanatory variables into 3 major categories that had been indicated to influence the adoption of GRBs: economic, social, and real-estate market factors (see Table 1).

Table 1.
Descriptive statistics and K-S values.
The first group of explanatory variables was related to economic development levels within cities. We included gross domestic product (GDP) and general public budget revenue (GPBR), which are measures of a city’s economy development levels and financial condition and play an important role in the development of green buildings [2,8,41].
The second group of explanatory variables focused on social factors associated with GRBs. Previous literature has shown that environmental awareness, demographic factors, people’s living standards, and education level had significant effects on the development of green buildings [8,24,30,40,41]. This paper used general public budget expenditure: energy conservation and environmental protection (GPBE:ECEP) and rate of good ambient air quality (RGAAQ) to represent local environmental factors, and year-end resident population (YRP), proportion of permanent population living in cities (PPPLC);, and proportion of permanent residents aged 15–59 (PPRA 15–59) to represent population factors; and urban households’ per capita disposable income of the residents (UHPCDIR) and urban households’ per capita floor space of houses (UHPCFSH) to measure people’s living standards; and number of general institutions of higher education (NGIHE) and proportion of permanent residents with education above university level (PPREU) to represent the level of education.
The third group of explanatory variables consisted of real-estate market-related variables. The enthusiasm of real-estate companies for developing GRBs relies heavily on the local real-estate market conditions, and the real-estate market indicators include market size, technical level of construction, commercial housing sales prices, etc. Existing literature showed that the size of the real-estate market was related to the quantity of green buildings [30]. Since developers may declare green building marks at any stage of residential construction, we created five indexes (IRED: RB, CRB: CNA, CRB: NCA, CRB: CMA, and CRB:SA) to represent the size of the urban real-estate market. The technical level of the construction industry is an important support for the development of green buildings, we selected the cross output value of the construction industry (COV) to represent the regional construction technology level [13]. Commercial residential building price (CRB: P) is the main influencing factor to promote the development of the GRB market [5,17,40], we collected CRB: P from the China Real-Estate Index system (CREIS).
Except for CRB: P, all data came from official sources such as the statistical yearbooks and bulletins of various cities. The few data that could not be sourced were supplemented by interpolation.
3.2. Research Methods
3.2.1. Spatial Correlation Analysis
1. To analyze whether GRBs are randomly distributed or have certain rules in space, this study used the Global Moran’s I to judge the global spatial correlation of different-star GRBs [12] and calculate the Z-score as a critical value for measuring the correlation degree. The Global Moran’s index can be described as follows:
here , n is number of regions, xi is the number of GRBs in region i, is the mean number of GRBs in all regions, and wij represents the spatial weight matrix, this case uses a queen adjacency matrix to study the spatial correlation of number of GRBs between adjacent areas. If two regional spaces are adjacent, then this element has the value 1, if not, the value is 0.
The value range of I is from −1 to 1. If I > 0, the distribution of GRBs has a positive correlation; if I = 0, the distribution of GRBs has no significant spatial correlation, that is, GRBs are randomly distributed; if I < 0, the distribution of GRBs has a negative correlation. When I > 0, Zi > 0, and p < 5%, this paper defines the geographic distribution of GRBs as having a positive spatial correlation and significant spatial aggregation.
2. This study uses the Local Moran’s I to further research the aggregation situation of GRBs in local regions, with the equation shown as follows:
where .
The Local Moran’s Index divides the results into four statuses: high–high cluster, low–low cluster, low–high outlier, and high–low outlier. The HH and LL clusters show that the difference in the number of GRBs between a region and the surrounding areas is small and there is a strong positive spatial correlation, that is, the number of GRBs is equivalent. The LH and HL outliers show that the number of GRBs in the region differs from those in the surrounding areas and there is a strong negative spatial correlation and heterogeneity.
3.2.2. Agglomeration Degree Analysis
This study used the development concentration index (CRn) as a supplementary measure for the aggregation of GRBs and, thus, defined the leading cities in each province. CRn is the ratio of the total number of GRBs in the first few cities with the most GRBs to the total number in the province, which is used to examine the agglomeration degree of GRBs [12]. CRn can be defined as follows:
where xi is the number of GRBs in city i, is the total number of GRBs in the first n cities, and is the total number of the province.
3.2.3. Influencing Factors Analysis
This study used Spearman’s correlation coefficient to measure the correlation between socioeconomic and real-estate market factors and the number of GRBs in the leading cities. The ρ value ranges from −1 to +1. If ρ ≥ 0, there is a positive correlation, and the higher the value, the stronger the correlation. The correlation value is expressed as follows:
where xi is the number of GRBs in city i, is mean number of GRBs per city, yi is the value of this influencing factor in city i, and is mean value of this influencing factor per city.
4. Geographic Distribution and Spatial Correlation of GRBs
The 2134 GRBs were distributed in 31 provinces and 208 cities (includes municipalities and county-level cities), and this section analyzes their geographic distribution and spatial correlation.
4.1. Geographic Distribution of GRBs
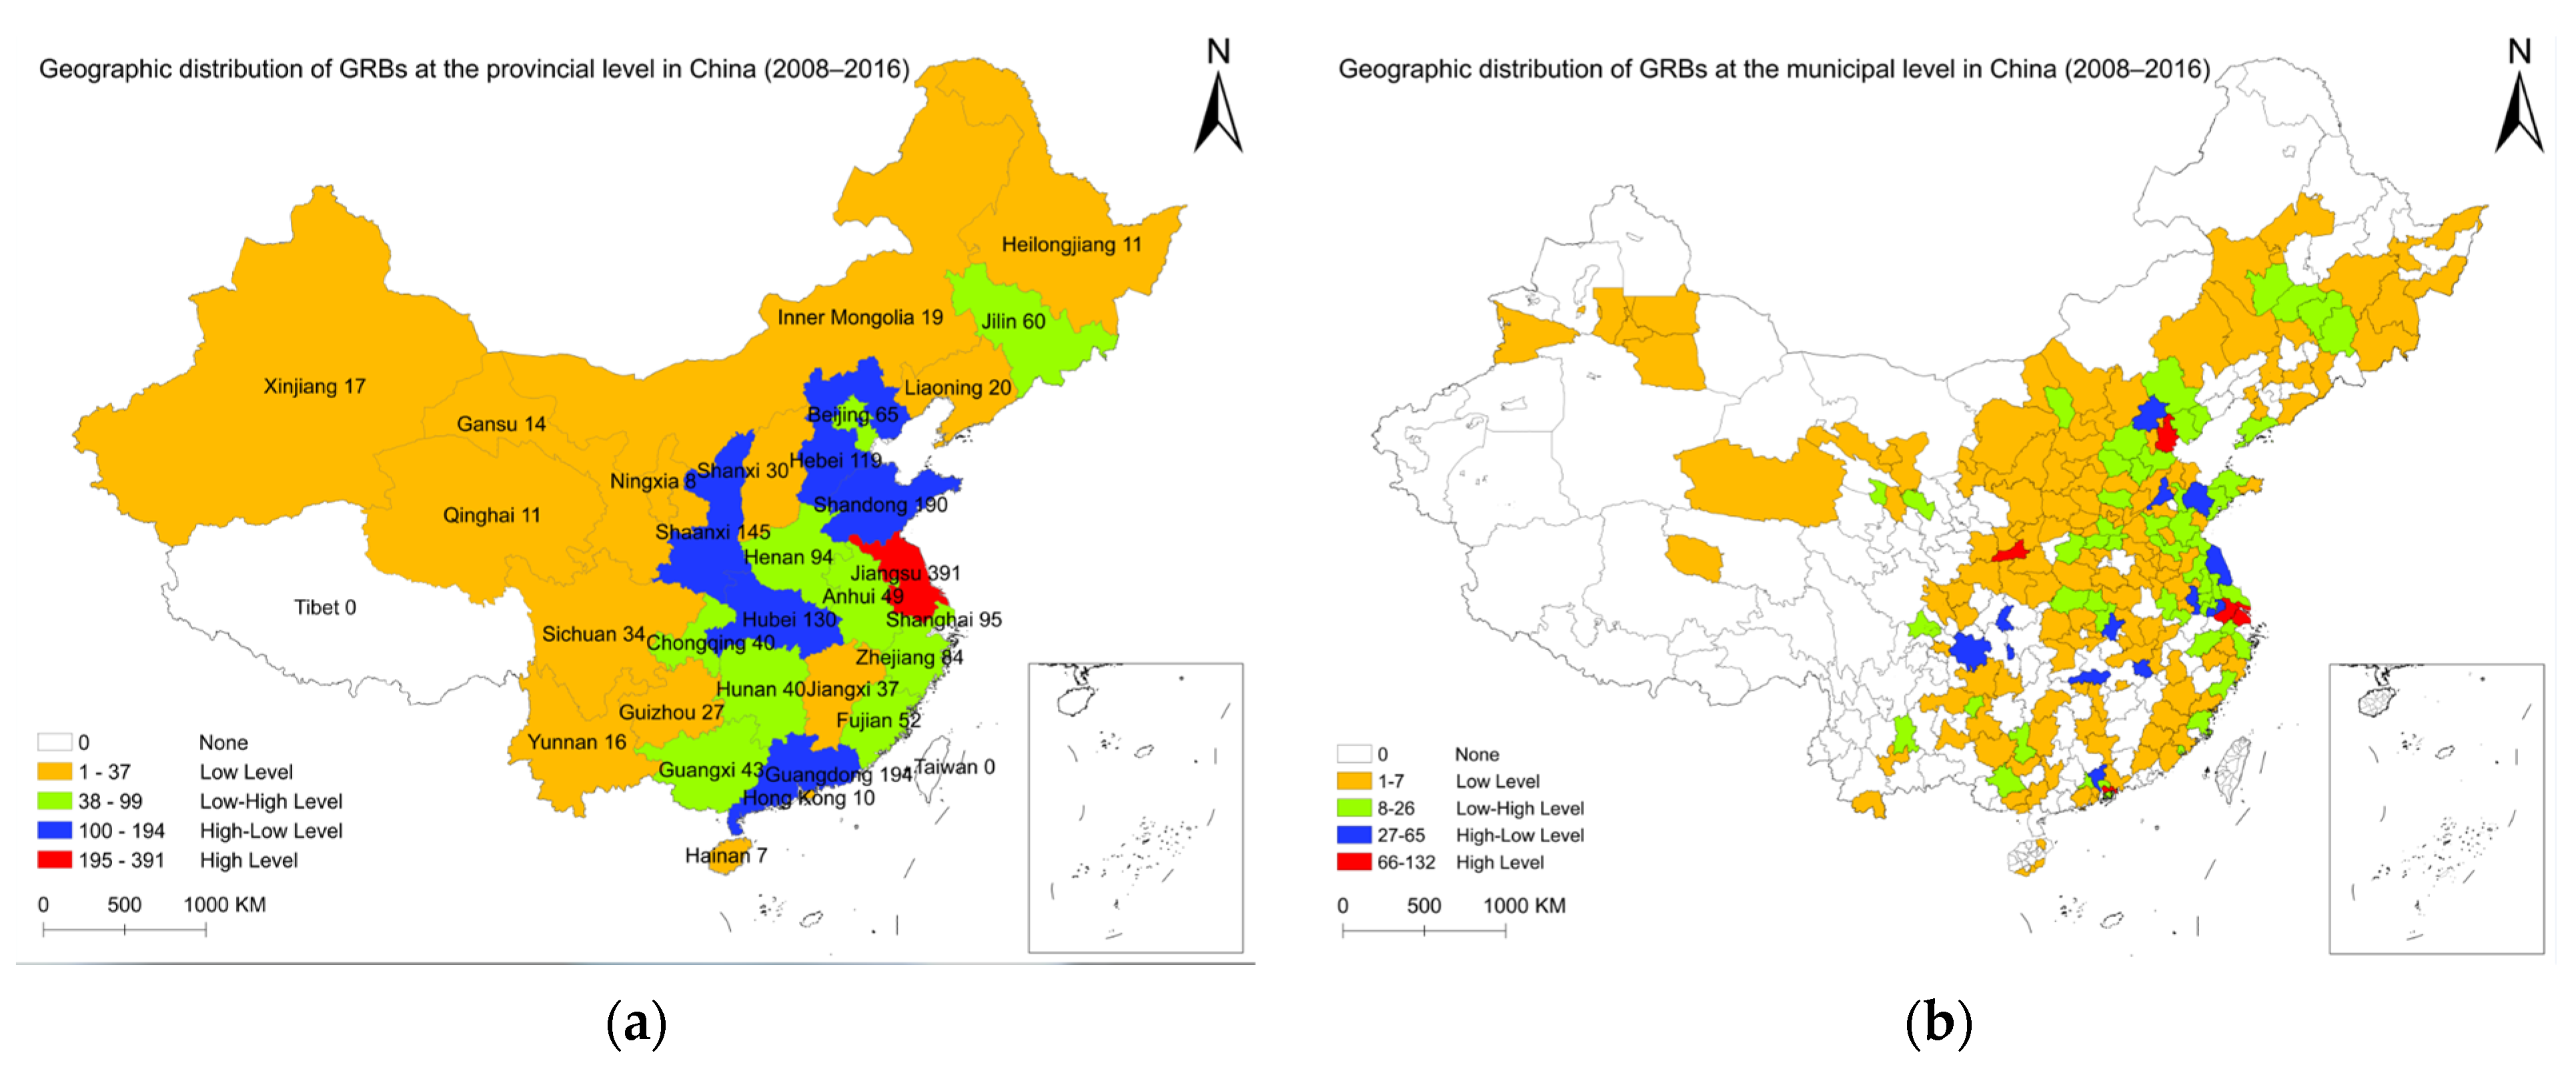
This study used the natural break-point method to divide the administrative regions into four levels according to the number of GRBs: high, high–low, low–high and low level. Figure 1 shows the existence of a regional imbalance with regard to the spatial distribution of GRBs in China. In the study period, most areas were at a low or low-high level of GRB development [24]. GRBs were mainly concentrated in the central and eastern regions of China, especially in coastal areas.
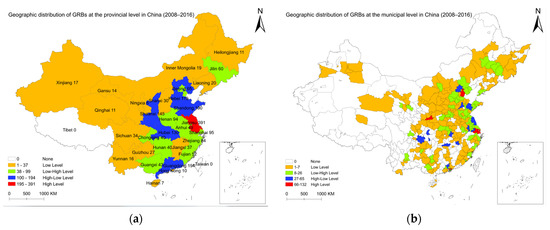
Figure 1.
(a) Geographic distribution of GRBs at the provincial level in China (2008–2016); (b) geographic distribution of GRBs at the municipal level in China (2008–2016).
The six provinces located in the high-level and high–low-level regions contained 1169 GRBs and accounted for 55% of the total. Jiangsu had 391 GRBs, which was 2.02 times that of Guangdong in second place. Meanwhile, two planar distributions had been formed: one was Hebei, Shandong, and Jiangsu, and the other was Shaanxi and Hubei. Most of the low–high-level regions were adjacent to the high–low-level regions, e.g., Hunan bordering Hubei. This suggested a trend in GRBs’ radiation from high-level to low-level regions, with the exception being Jiangxi, which was the only low-value province surrounded by high-value provinces.
Compared with the provincial level, the distribution of GRBs was more uneven at the municipal level. The numbers of municipal administrative regions at the high, high–low, low–high, and low levels were 5, 11, 52, and 140, respectively. About 92% of cities were located in the low–high-level and low-level regions. The 16 cities located in high-level and high–low-level regions had 1025 GRBs, accounting for 48% of the total. These cities presented a point-shaped distribution and had no significant geographic agglomeration. The top three cities (Shenzhen, Xi’an, and Suzhou) had more than 100 GRBs, respectively, but the number of GRBs in each city which was located in low-level regions was less than 7.
The GRBs covered all prefecture-level cities in the Jiangsu, Shandong, and Hebei provinces, but the coverage of GRBs in the western regions was obviously low. For instance, the only capital cities with GRBs were in Sichuan, Guizhou, Gansu, and Heilongjiang.
4.2. Spatial Correlation of GRBs’ Distribution
As described, the geographic distribution of GRBs had strong regional characteristics of agglomeration and imbalance. This section uses the Global Moran index to quantitatively research the spatial correlation of GRBs with different star rankings and draws the local indicators of spatial association (LISA) cluster maps. The LISA is presented as a map for those regions that pass the significance test at a 5% significance level. The results are shown in Table 2 and Figure 2, and they indicate the following:
Table 2.
Global Moran’s index of GRBs’ distribution in China.
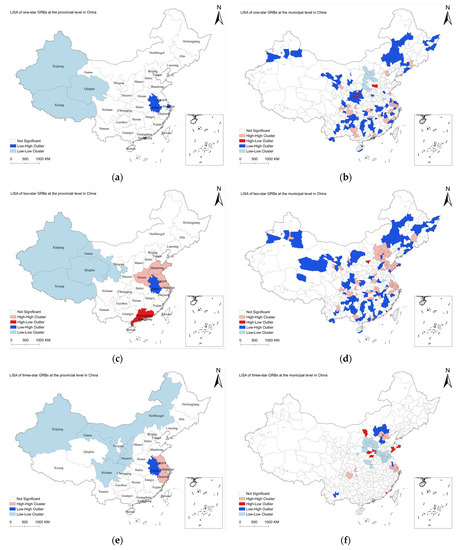
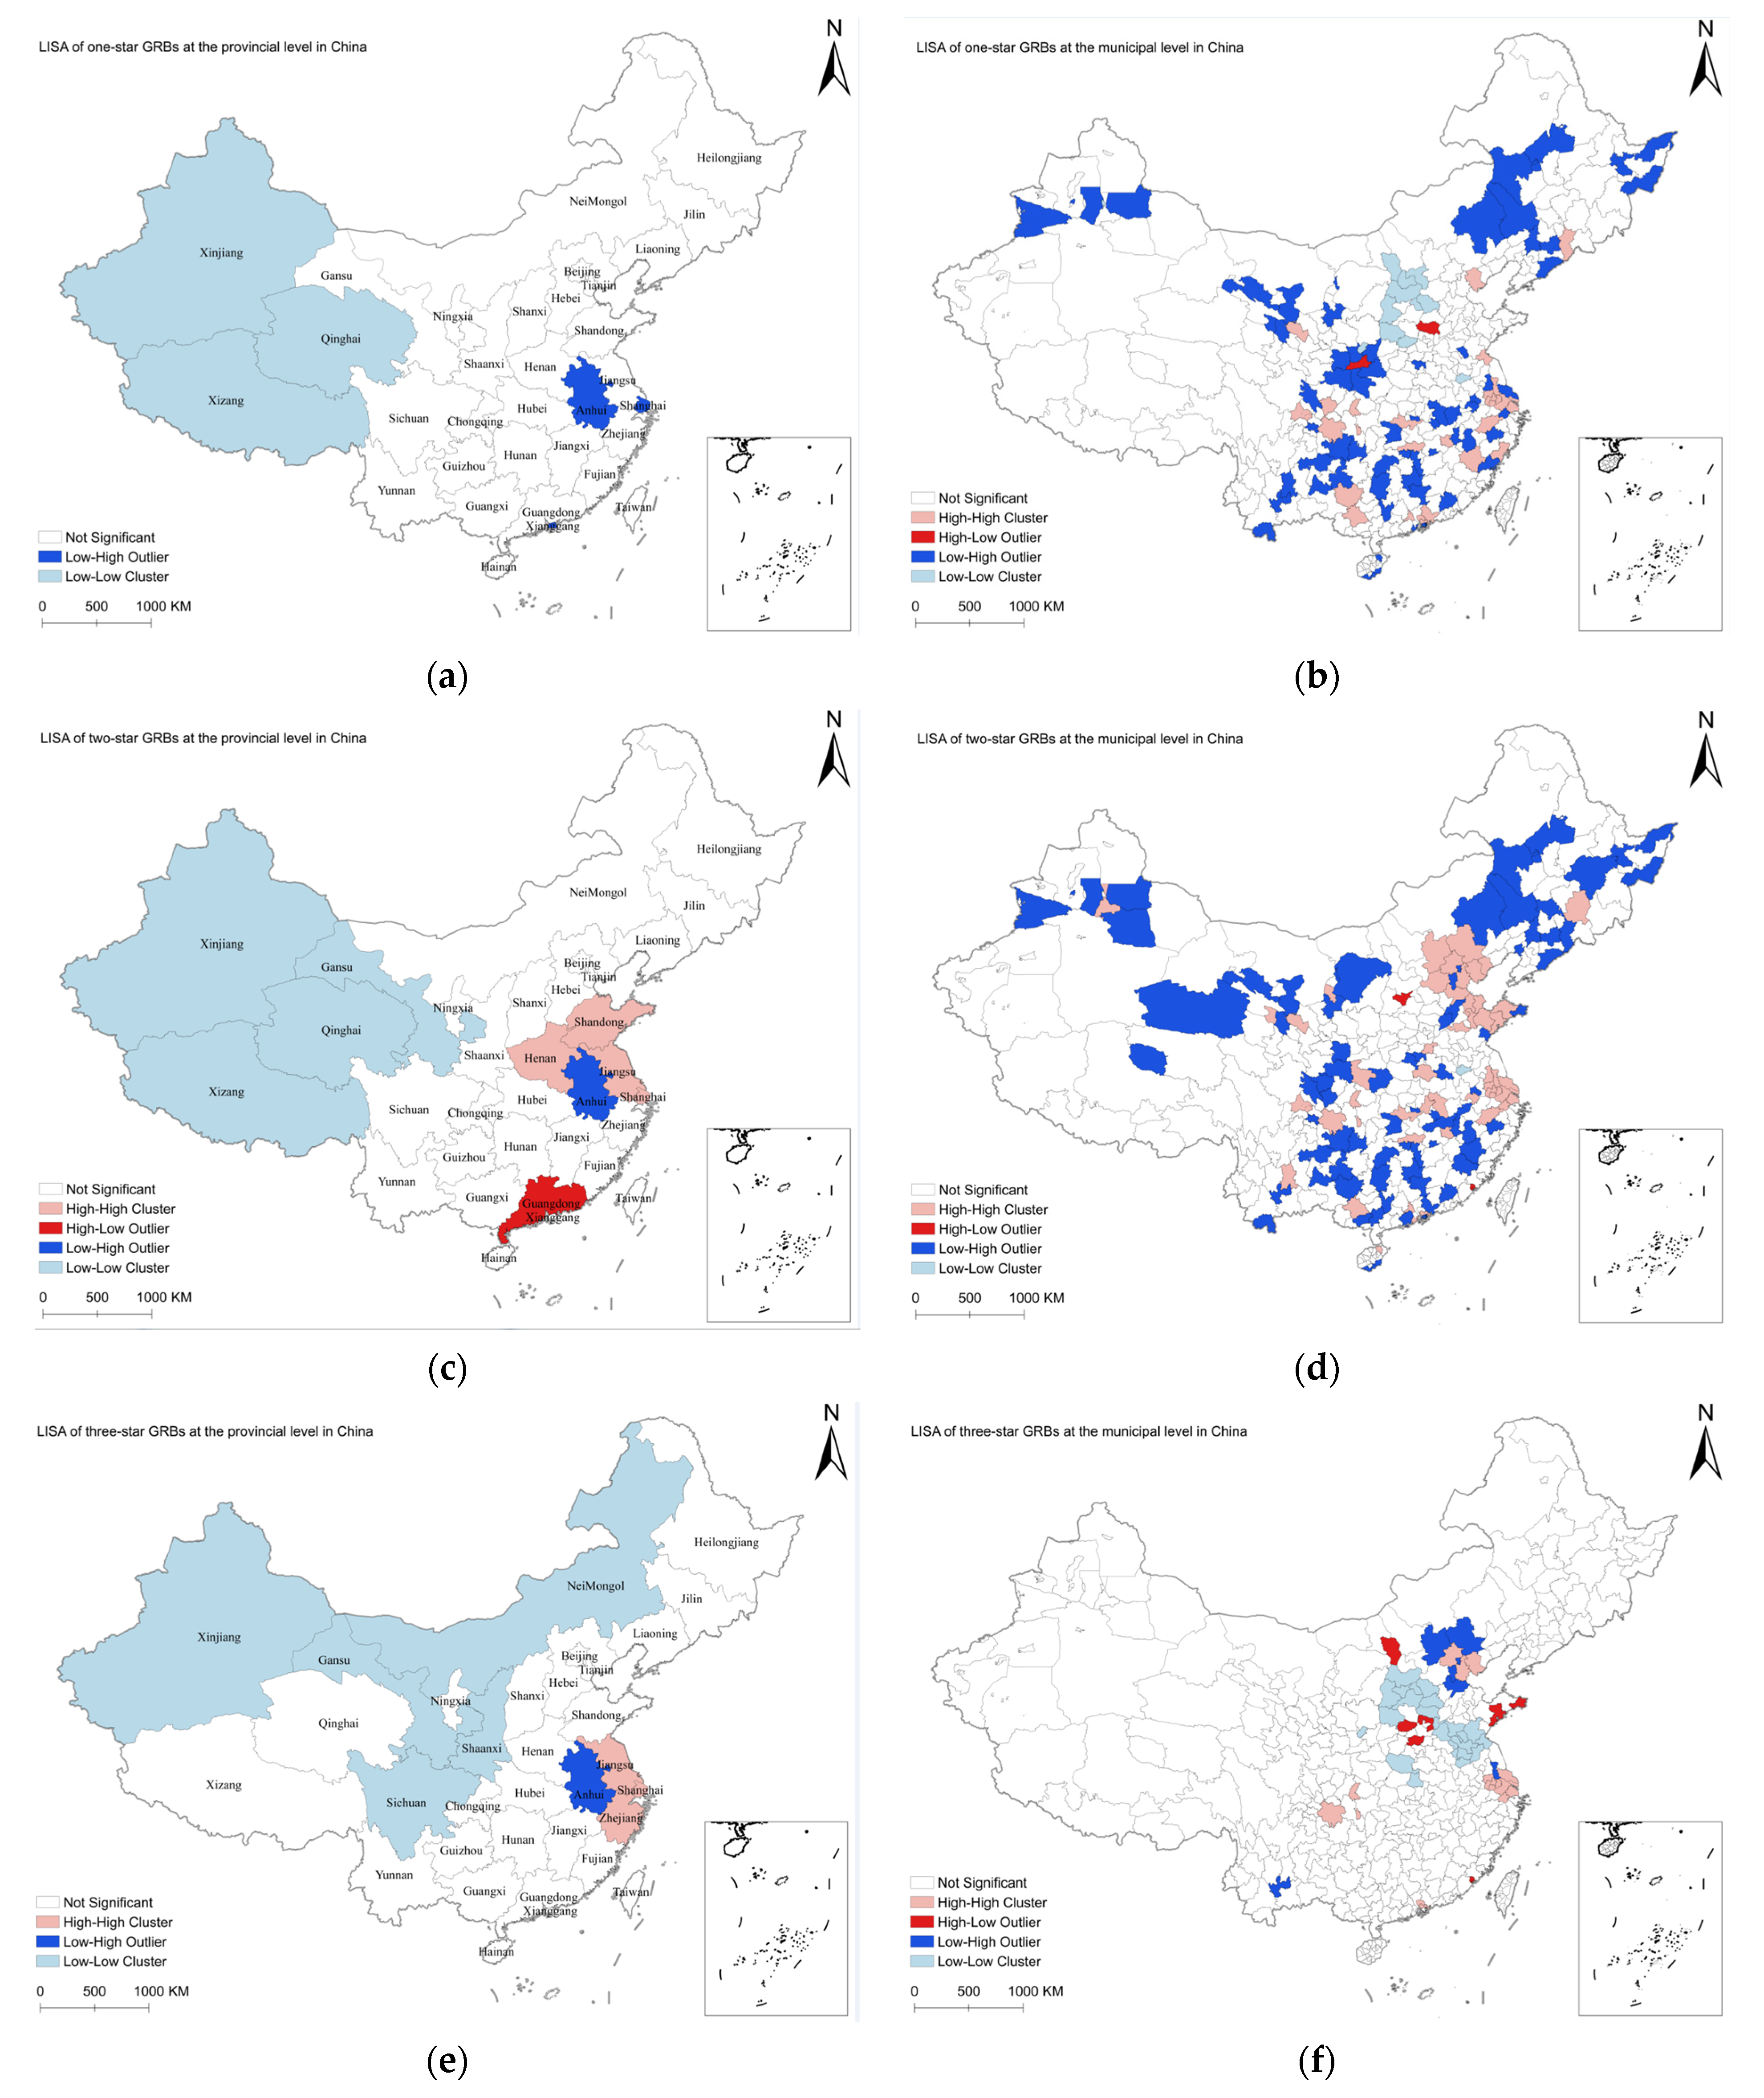
Figure 2.
Local indicators of spatial association (LISA) cluster diagram of at the provincial and municipal levels in China: (a,b) one-star GRBs; (c,d) two-star GRBs; (e,f) three-star GRBs.
1. Table 2 shows the spatial aggregation characteristics of GRBs in China. The Global Moran’s I of one-star GRBs at the provincial and municipal levels was less than 0 and the absolute value of the Z-score did not exceed a threshold of 1.65, indicating that one-star GRBs have a negative space spillover effect and the spatial distributions are random. All Global Moran’s I for two- and three-star GRBs were greater than 0, and the probabilities of random patterns were less than 5%, indicating that both two- and three-star GRBs’ spatial distribution have significant positive spatial correlation and spatial clustering.
2. By horizontal comparison of LISA maps (Figure 2a,c,e) of GRBs at provincial level, we found the following: (1) The provinces with a large number of one-stars GRBs were randomly distributed in space, and the spatial correlation with other provinces was not obvious. (2) The provinces with large number of two- and three-star GRBs had high-value aggregation characteristics in central and eastern China, especially in the eastern coastal areas, and thus indicated a good situation of regional coordinated development. (3) At all star levels, GRBs showed low-value aggregation characteristics in the western region of China, indicating that the overall number of GRBs in the western region of China was small, and the spatial differences between adjacent provinces were small. (4) Anhui was the only province that was always in the low-value area, indicating that the surrounding provinces had no radiation effect on it. On the contrary, the number of two-star GRBs in Guangdong was significantly higher than that in the surrounding provinces, and there was no radiation effect on the surrounding provinces. (5) The number of two- and three-star GRBs in Shanghai was significantly higher than that of one-star GRBs, which might be related to the relatively developed economy and society in Shanghai.
3. By horizontal comparison of LISA maps (Figure 2b,d,f) of GRBs at municipal level, we found the following: (1) The number of cities with one-, two-, and three-star GRBs in the HH cluster were 25, 47, and 13, respectively, indicating that the aggregation trend of two-star GRBs is obvious and has formed a coordinated development situation in Beijing–Tianjin–Hebei, Shandong Peninsula, and Yangtze River Delta. GRBs with other star ratings were mainly concentrated in the Yangtze River Delta and the aggregation distribution effect was less than that of two-star GRBs. (2) The number of cities with one-, two-, and three-star GRBs in HL outlier were 2, 2, and 7, respectively, indicating that the cities with large number of three-star GRBs had a dotted distribution. For example, in Xiamen and Qingdao, the numbers of three-star GRBs were significantly more than that in surrounding cities, respectively. (3) The number of cities with one-, two-, and three-star GRBs in the LH outlier were 63, 73, and 6, respectively. This further shows that there are regional differences in the development of GRBs in China.
4. By vertical comparison of LISA maps of different-star green buildings at provincial and municipal levels, we found that Local Moran analysis at the provincial level masked spatial correlations and outliers among some cities. For example, provinces with more one-star GRBs did not form clusters, but cities with more one-star GRBs formed spatial clusters in the Yangtze River Delta. Meanwhile, we found some outliers in which the number of GRBs in their cities were significantly higher than in their surrounding cities. Through further analysis, we discovered that most of these cities were provincial capital cities or sub-central cities with relatively developed economies and societies. This article defines these cities as leading cities.
4.3. Agglomeration Degree Analysis of GRBs
As the distribution of one-star GRBs was more balanced and there was no obvious spatial aggregation, this article uses CRn to quantitatively study the agglomeration degree of two- and three-star GRBs in each province and, thus, define the leading cities.
In addition to four municipalities and Hong Kong, a total of 26 provinces had two- and three-star GRBs as shown in Table 3. By analyzing the number of GRBs in each city, it was found that (1) 21 provincial capitals had the largest numbers of GRBs in their provinces; (2) 14 provinces had single-center aggregation, and the average development concentration CR1 was 68.36%; (3) 9 provinces had double-center aggregation, and the average development concentration CR2 was 58.32%. Consequently, each province presented a central aggregation model centered on provincial capitals or socioeconomically developed cities, but the cores were not necessarily the only ones. The cores may have been located at the administrative center and economic center, such as in Jiangsu, Guangdong, and so on.
Table 3.
Concentration of GRB development CRn in each province.
This study defined the leading cities as those with a total proportion of two- and three-star GRBs above 50% (except for in Hebei, Hainan, and Xinjiang as multiple cities had the same GRBs’ number in the three provinces, so the ‘leading cities’ had no obvious representativeness). This paper thus defined 42 leading cities (including four municipalities).
5. Influencing Factors of GRBs Development
As mentioned in Section 4.2, one-star GRBs were randomly distributed in space, and the spatial differences were relatively small. This is mainly due to government coercion [8,13,25,42] and the economic and technological requirements of one-star GRBs [26]. For instance, the Shanghai and Shandong began to enforce the one-star standard in 2014 [13,43]. Compared with traditional buildings, the incremental costs and premiums of one-star GRBs are very low, so it is easy for them to be accepted by the market [27].
This section attempts to explore the influencing factors affecting the development of two- and three-star GRBs at the municipal level, with a focus on socioeconomic features and real-estate market factors. Based on the existing literature mentioned above, this paper selected 18 urban features to study the influencing factors of GRBs in the 42 leading cities. Prior to 2010, GRBs were rarely built [7], and only four cities had GRBs, so the research data of influencing factors in this study were from 2010 to 2016.
This study used SPSS 26.0 software to conduct descriptive statistics, normal tests, and credibility and reliability tests of the sample data and to test the correlation between the number of GRBs and the influencing factors. The results of the descriptive statistics and the K-S value for 18 factors are shown in Table 1.
Cronbach’s alpha coefficient (α) was used to statistically test the 18 features’ credibility and reliability. Generally, the α value ranges from 0 to +1, and it is believed that an α value greater than 0.7 is acceptable [44]. In this paper, the value for the 18 features was 0.771, indicating good reliability of the data for further analyses.
In most correlation analyses, the data are assumed to be normally distributed. The Kolmogorov–Smirnov (K-S) test is used to judge the distribution types of these features. If the K-S value is significant, then the original hypothesis that the sample comes from a normally distributed population is rejected [45]. In this study, only the RGAAQ, PPPLC, UHPCFSH, NGIHE, and PPREU features fit a normal distribution (Table 1). Spearman’s correlation coefficient was adopted for correlation analysis in this study for most factors that did not obey a normal distribution [46,47]. The results of the correlation analysis are shown in Table 4, and a discussion is presented below.
Table 4.
Correlation analysis results for GRBs’ influencing factors.
1. It can be seen that the ρ-value range of the two economic factors ranged from 0.454 to 0.674 and p < 0.01. This shows that economic factors had a strong positive correlation with the number of GRBs in both stars and there were more GRBs in cities with economic strength [5]. The reason for this maybe that, compared with conventional projects, GRBs have a certain premium, and cities with economic strength have strong support for the premium.
2. The social factors’ ρ-value range was from −0.353 to 0.654, with different significance levels. We conclude that social factors had different impacts on the development of different star-rated GRBs. Frist, RGAAQ (−0.353) was the only negatively correlated factor at two-star rating, and it had no significant correlation at three-star rating (ρ = 0.105). Based on air quality as a key quantitative indicator of the urban environment, we conclude that the influence of urban environmental quality on the development of GRBs was relatively low. Second, factors including GPBE: ECEP (0.591, 0.54), YRP (0.585, 0.481), and UHPCDIR (0.373, 0.654) also had a strong positive correlation with the number of GRBs at both the star levels. This could be explained because, if the real-estate market competition is more intense, developers are more willing to improve the quality of housing to enhance their competitiveness in cities with large permanent populations, high per capita incomes, and large per capita housing areas. Additionally, the government’s emphasis on environmental protection is also the main driving force for the development of GRBs.
3. The ρ-value range of real-estate market factors except two-star’s CRB: P (0.142) was from 0.399 to 0.662 and p < 0.01. It indicates that the real-estate market factors had a strong positive correlation with the number of GRBs and were the main driving force for the development of GRBs. The development of GRBs mainly relied on market allocation. Development of GRBs was mainly affected by the size of the local real-estate market and the expected market value of the project [30]. It is generally believed that the larger the real-estate market, the higher the acceptance of high-quality housing buyers.
4. By vertically comparing the impact of various factors on the number of GRBs, we found that (1) at the two-star rating, the ρ-values of the five factors (PPPLC (0.077), PPRA 15–59 (0.091), CRB: P (0.142), NGIHE (0.215), and PPREU (0.046)) were relatively small, and there were no significant correlations with the number of GRBs. It shows that the number of two-star GRBs had no obvious relationships with the price of commercial residential buildings, the level of urbanization, the age of buyers, and the level of education. The three factors with the largest ρ-value were GPBE: ECEP (0.591), YRP (0.585), and GDP (0.52), indicating that two-star GRBs were mainly affected by the government’s environmental awareness, population, and local economic conditions. (2) At the three-star rating, RGAAQ (ρ = 0.105) and UHPCFSH (ρ = 0.0.028) had no significant correlation with the number of GRBs, and the five factors with the largest ρ-values were GPBR (0.674), UHPCDIR (0.654), CRB: P (0.662), GDP (0.639), and COV (0.619). It shows that the people who live in economically developed cities had a higher level of consumer awareness and were more likely to receive higher-star GRBs, while higher housing prices also supported higher-star development. In summary, the number of GRBs was significantly correlated with local economic level and real-estate market factors.
5. By horizontally comparing the ρ-values of the same factor between two- and three-star GRBs, we discovered that (1) the ρ-values of the real estate market scale factors were about 0.4, indicating that their impacts on the number of GRBs were relatively stable, but the impacts were less than that of the economic factors. (2) Relative to the two-star rating, YRP, GPBE: ECEP, and UHPCFSH significantly declined, while CRB: P, PPRA 15–59, PPPLC, PPREU, NGIHE, GPBR, and COV significantly rose at the three-star rating. In sum, the same influencing factors had different effects on GRBs with different star ratings. In particular, the local commercial residential building prices and the local residents’ economic and social statuses, education levels, and living standards were significantly positively correlated with the grade of GRBs.
6. Conclusions
This study proposes a new perspective for studying the geographic distribution and influencing factors of green buildings in China. Different from previous research, this paper studied 2134 GRBs that met the Green Building Evaluation Standard and obtained a green building logo in 2008–2016 in China. In this study, we used the natural break-point method to describe the geographical distribution of GRBs in China at the provincial and municipal levels, used Moran’s Index to study the spatial correlations of GRBs with different star ratings at the two administrative division levels, and used the development concentration index to analyze the aggregation degree of medium- and high-star GRBs in each province and defined 42 leading cities with more favorable levels of GRBs development. In order to efficiently promote the development of GRBs, we used Spearman’s correlation coefficient to study the correlation between the number of GRBs and 18 influencing factors covering the social economy and real-estate market in the 42 leading cities.
On the basis of previous studies, this case further confirms that there are significant differences in the geographical distribution and spatial aggregation of GRBs in China. There are more GRBs in the central and eastern regions with developed social economy and real-estate market, especially in the eastern coastal areas. At the same time, this study also found that (1) there are differences in the geographical distribution characteristics of different star green buildings in China. For example, one-star GRBs are randomly distributed in space, and the spatial differences are relatively small. However, medium- and high-star GRBs show significant agglomeration in space, and the spatial difference of three-star GRBs is greater than that of two-star GRBs. (2) The differences in geographical distribution and the spatial correlation of GRBs are more obvious in the study of municipal administrative division levels. For example, we find that the numbers of GRBs in provincial capital cities or sub-central cities with relatively developed economies and societies are significantly higher than in their surrounding cities in each province. (3) The local commercial residential building prices, the local residents’ economic and social statuses, education levels, and living standards are significantly positively correlated with the grade of GRBs.
This paper studies the geographical distribution and influencing factors of GRBs in China, which is helpful to further promote the marketization of GRBs. The results provide a reference for the government to formulate relevant policies. For example, the government can formulate differentiated development goals according to the economic, social, and real-estate development levels in different regions, give priority to the development of high-star GRBs in pilot cities, and finally achieve the balanced development of GRBs. At the same time, the results also provide important reference for the green strategic decision of real estate development enterprises. For example, the identification of the influencing factors of GRB development can help real-estate development enterprises to select cities for green investment.
In addition, the development of GRBs should be affected by more factors, for instance, many previous studies found strong evidence that government regulations and policies play an important role in promoting the adoption of green buildings [8,42]. The analysis of influencing factors of GRBs in this paper may be incomplete. It is recommended that subsequent studies be analyzed with more complete variable data.
Author Contributions
K.G., as the first author, proposed the idea and basic methods for this research, collected and analyzed the data, and drafted the work. Y.Y. supervised this research and helped revise the paper. All authors have read and agreed to the published version of the manuscript.
Funding
This research received no external funding.
Institutional Review Board Statement
Not applicable.
Informed Consent Statement
Not applicable.
Data Availability Statement
Not applicable.
Acknowledgments
Thanks Y. Wang for providing assistance with the conception of this study. The authors also wish to thank the paper’s editor and anonymous reviewers for their valuable comments and suggestions.
Conflicts of Interest
The authors declare no conflict of interest.
References
- Zhang, X. Green real estate development in China: State of art and prospect agenda—A review. Renew. Sustain. Energy Rev. 2015, 47, 1–13. [Google Scholar] [CrossRef]
- Zou, Y.; Zhao, W.; Zhong, R. The spatial distribution of green buildings in China: Regional imbalance, economic fundamentals, and policy incentives. Appl. Geogr. 2017, 88, 38–47. [Google Scholar] [CrossRef]
- A Statistic National Bureau of China Statistical Yearbook. 2019. Available online: http://www.stats.gov.cn/tjsj/ndsj/2019/indexch.htm (accessed on 19 June 2021).
- China Building Energy Consumption Research Report 2020 Released. Available online: https://cabee.org/site/content/24021.html (accessed on 3 February 2021).
- Kats, G. The Costs and Financial Benefits of Green Buildings: A Report to California’s Sustainable Building Task Force 2003. Available online: http://citeseerx.ist.psu.edu/viewdoc/download;jsessionid=EE14BBCE4C2EF6E6315B38857249245D?doi=10.1.1.174.2149&rep=rep1&type=pdf (accessed on 19 October 2021).
- No, S.; Won, C. Comparative Analysis of Energy Consumption between Green Building Certified and Non-Certified Buildings in Korea. Energies 2020, 13, 1049. [Google Scholar] [CrossRef] [Green Version]
- Look, Green Building So Energy-Saving. Available online: https://c.m.163.com/news/a/G8F4AB2V0518JG8L.html?spss=newsapp (accessed on 19 October 2021).
- Darko, A.; Zhang, C.; Chan, A.P. Drivers for green building: A review of empirical studies. Habitat Int. 2017, 60, 34–49. [Google Scholar] [CrossRef]
- Assessment Standard for Green Building (National Standard of the People’s Republic of China, GB/T 50378-2019). Available online: http://www.mohurd.gov.cn/wjfb/201905/t20190530_240717.html (accessed on 3 September 2021).
- Song, Y.; Li, C.; Zhou, L.; Chen, Y.; Zhang, H. Factors affecting green building development at the municipal level: A cross-sectional study in China. Energy Build. 2021, 231, 110560. [Google Scholar] [CrossRef]
- Teng, J.; Wu, X.; Liu, Y. Status and Suggestion for the Development of Green Certification Projects in China. J. Eng. Manag. 2017, 31, 29–33. [Google Scholar] [CrossRef]
- Qiu, B.; Li, D.; Wu, Z. Study on the Character of Chinese Green Building Spatial Evolution. Urban Stud. 2017, 24, 149. [Google Scholar]
- Hao, T.; Wang, J.; Zhang, Z. Study on Spatial Evolution of Chinese Green Building. In Proceedings of the 2018 14th International Green Building and Building Energy Conservation Conference & New Technology and Products Fair, Zhuhai, China, 2 April 2018; China City Press: Beijing, China, 2018; pp. 266–271. [Google Scholar]
- Li, D. Regional Differences among the Development Models of Green Buildings in China—Based on statistical data from 2006 to 2014. Hous. Sci. 2019, 29, 35–43. [Google Scholar] [CrossRef]
- Annual Report on Green Real Estate Development in China 2020. Available online: http://www.ugreen.cn/newsDetail/10106 (accessed on 3 February 2021).
- Dong, C. Discussion on the Problems and Countermeasures of Green Housing. Constr. Econ. 2013, 363, 87–90. [Google Scholar] [CrossRef]
- Zeng, H. Research on Influential Factors of Developing Green Buildings in Real Estate Enterprises. Master’s Thesis, Zhejiang University, Hangzhou, China, 2013. Available online: https://kns.cnki.net/KCMS/detail/detail.aspx?dbname=CMFD201401&filename=1013341007.nh (accessed on 6 June 2020).
- Wang, L. Study on the Development of Green House in the Perspective of Main Player. Master’s Thesis, Chang’an University, Xi’an, China, 2017. Available online: https://kns.cnki.net/KCMS/detail/detail.aspx?dbname=CMFD201801&filename=1017868740.nh (accessed on 2 March 2021).
- Liu, A. Empirical Research on the Influence of Information and Product Attributes on Consumers’ Green House Purchase Behavior. Master’s Thesis, Xi’an University of Architecture and Technology, Xi’an, China, 2017. [Google Scholar] [CrossRef]
- Geng, X. Study on the Development of Green Residence Based on Game Theory. Master’s Thesis, Qingdao University of Technology, Qingdao, China, 2015. [Google Scholar] [CrossRef]
- Wang, P. Study on Green Building Incentive Countermeasures Based on Evolutionary Game Theory. Master’s Thesis, East China Normal University, Shanghai, China, 2015. Available online: https://kns.cnki.net/KCMS/detail/detail.aspx?dbname=CMFD201502&filename=1015345607.nh (accessed on 2 March 2021).
- Liu, L.Z.; Gu, J. Review of Green Housing Development in China. Shanghai Real Estate 2019, 29–33. [Google Scholar] [CrossRef]
- Lian, S.; Liang, H. Comparative Study on Green Building Development between China and Foreign Countries. Constr. Sci. Technol. 2021, 7580. [Google Scholar] [CrossRef]
- Liu, X.; Li, P. Spatial and Temporal Evolution and Driving Mechanism of Green Building Area in China. Ecol. Econ. 2021, 37, 88–94. [Google Scholar]
- Zhang, L.; Wu, J.; Liu, H. Policies to enhance the drivers of green housing development in China. Energy Policy 2018, 121, 225–235. [Google Scholar] [CrossRef]
- Zhou, Y. State power and environmental initiatives in China: Analyzing China’s green building program through an ecological modernization perspective. Geoforum 2015, 61, 1–12. [Google Scholar] [CrossRef] [Green Version]
- Zhang, Y. Research on the Influencing Factors of Green Residential Certification Willingness of Real Estate Development Enterprises. Master’s Thesis, Xi’an University of Architecture and Technology, Xi’an, China, 2019. [Google Scholar] [CrossRef]
- Chau, C.K.; Tse, M.S.; Chung, K.Y. A choice experiment to estimate the effect of green experience on preferences and willingness-to-pay for green building attributes. Build. Environ. 2010, 45, 2553–2561. [Google Scholar] [CrossRef]
- Darko, A.; Chan, A.P.C. Critical analysis of green building research trend in construction journals. Habitat Int. 2016, 57, 53–63. [Google Scholar] [CrossRef]
- YIP, S.C.T. The Geography of Green Buildings in Chinese Cities. Mod. Urban Res. 2012, 27, 42–48. [Google Scholar]
- Zhang, L. Study on the Driving Mechanism of Green Housing Development in Chinese Cities. Ph.D. Thesis, Tsinghua University, Beijing, China, 2018. [Google Scholar] [CrossRef]
- Jia, Y. Space Difference Measure of Green Building Development in China Based on the Theil Index. Master’s Thesis, Xi’an University of Architecture and Technology, Xi’an, China, 2015. [Google Scholar] [CrossRef]
- Windapo, A.O. Examination of Green Building Drivers in the South African Construction Industry: Economics versus Ecology. Sustainability 2014, 6, 6088–6106. [Google Scholar] [CrossRef] [Green Version]
- Zhang, W. Research on Green Building Industrial Agglomeration Based on the Comparative Advantage of City. Master’s Thesis, Shanghai Normal University, Shanghai, China, 2013. [Google Scholar] [CrossRef]
- Kaza, N.; Lester, T.W.; Rodriguez, D.A. The spatio-temporal clustering of green buildings in the United States. Urban Stud. 2013, 50, 3262–3282. [Google Scholar] [CrossRef]
- Zhao, D.; He, B.; Johnson, C.; Mou, B. Social problems of green buildings: From the humanistic needs to social acceptance. Renew. Sustain. Energy Rev. 2015, 51, 1594–1609. [Google Scholar] [CrossRef]
- Hu, H.; Geertman, S.; Hooimeijer, P. The willingness to pay for green apartments: The case of Nanjing, China. Urban Stud. 2014, 51, 3459–3478. [Google Scholar] [CrossRef]
- Wu, Y.; Xu, R. Green building development in China-based on heat pump demonstration projects. Renew. Energy 2013, 53, 211–219. [Google Scholar] [CrossRef]
- Wu, Z.; Jiang, M.; Cai, Y.; Wang, H.; Li, S. What Hinders the Development of Green Building? An Investigation of China. Int. J. Environ. Res. Public Health 2019, 16, 3140. [Google Scholar] [CrossRef] [PubMed] [Green Version]
- Ma, J.; Cheng, J.C.P. Identification of the numerical patterns behind the leading counties in the U.S. local green building markets using data mining. J. Clean Prod. 2017, 151, 406–418. [Google Scholar] [CrossRef]
- Gao, Y.; Yang, G.; Xie, Q. Spatial-Temporal Evolution and Driving Factors of Green Building Development in China. Sustainability 2020, 12, 2773. [Google Scholar] [CrossRef] [Green Version]
- Qi, G.Y.; Shen, L.Y.; Zeng, S.X.; Jorge, O.J. The drivers for contractors’ green innovation: An industry perspective. J. Clean Prod. 2010, 18, 1358–1365. [Google Scholar] [CrossRef]
- Yang, M.; Hou, P.; Ye, Y. Influencing Factors and Regional Heterogeneity of the Price Premium of High-Star Grade Green Residential Buildings in China: An Empirical Research Based on the Hedonic Model. Huadong Shifan Daxue Xuebao (Humanit Soc. Ed.) 2020, 52, 181–192. [Google Scholar] [CrossRef]
- Darko, A.; Chan, A.P.; Manu, O.; Ameyaw, E.E. Drivers for implementing green building technologies: An international survey of experts. J. Clean Prod. 2017, 145, 386–394. [Google Scholar] [CrossRef] [Green Version]
- Mendes, M.; Pala, A. Type I Error Rate and Power of Three Normality Tests. Int. Technol. J. 2003, 2, 135–139. [Google Scholar] [CrossRef]
- Artusi, R.; Verderio, P.; Marubini, E. Bravais-Pearson and Spearman correlation coefficients: Meaning, Test of hypothesis and confidence interval. Int. J. Biol. Markers 2002, 17, 148–151. [Google Scholar] [CrossRef]
- Shong, N. Pearson’s Versus Spearman’s and Kendall’s Correlation Coefficients for Continuous Data. Master’s Thesis, University of Pittsburgh, Pittsburgh, PA, USA, 2010. Available online: http://d-scholarship.pitt.edu/8056/ (accessed on 17 August 2021).
Publisher’s Note: MDPI stays neutral with regard to jurisdictional claims in published maps and institutional affiliations. |
© 2021 by the authors. Licensee MDPI, Basel, Switzerland. This article is an open access article distributed under the terms and conditions of the Creative Commons Attribution (CC BY) license (https://creativecommons.org/licenses/by/4.0/).