Article

Combined Impacts of Climate and Land Use Changes on Long-Term Streamflow in the Upper Halda Basin, Bangladesh

by
Farzana Raihan
1,2,*,
Gabrijel Ondrasek
3,
Mohammad Shahidul Islam
4,
Joseph M. Maina
5 and
Linda J. Beaumont
2
1
Department of Forestry and Environmental Sciences, Shahjalal University of Science and Technology, Sylhet 3114, Bangladesh
2
Department of Biological Sciences, Macquarie University, North Ryde, NSW 2109, Australia
3
Faculty of Agriculture, University of Zagreb, 10000 Zagreb, Croatia
4
Department of Statistics, Shahjalal University of Science and Technology, Sylhet 3114, Bangladesh
5
Department of Earth and Environmental Sciences, Macquarie University, North Ryde, NSW 2109, Australia
*
Author to whom correspondence should be addressed.
Sustainability 2021, 13(21), 12067; https://doi.org/10.3390/su132112067
Submission received: 25 September 2021 / Revised: 15 October 2021 / Accepted: 28 October 2021 / Published: 1 November 2021

Abstract

:
In Bangladesh, rapid population growth and associated land-use changes are escalating water scarcity issues, which will be further exacerbated under ongoing climate change. As such, predicting the consequences of climate and land-use change on freshwater supplies is critical for the sustainable management of water resources. In this study, a Soil and Water Assessment Tool (SWAT) associated with a Land Cover Model (LCM) were used to simulate long-term stream flows in the Halda Basin, Bangladesh, under baseline and future climate and land-use change scenarios. In addition, the separate and combined impacts of both types of change on long-term streamflow projections were assessed. Results indicate that by the 2060s, the maximum temperature of the Halda Basin may rise by 1.6 °C in comparison to the baseline 1986–2005 period, while minimum temperature will also increase, albeit at a lower rate than maximum temperature. Precipitation during the dry season is expected to increase, although it may decline in the monsoon period. Simulations show that these changes in climate are likely to increase future streamflow in the Halda catchment, with monthly streamflow influenced mainly by the variability in precipitation. The LCM projected decreases in grassland along with cultivated land at the expense of artificial areas. Combined, future climate and land-use changes are projected to increase annual streamflow, with climate change likely to be a greater driver of altered streamflow than land-use changes. Our results should guide environmental management authorities in more sustainable and strategic water resource planning under global climate change.

1. Introduction

Water security is one of the most challenging environmental issues of the 21st century [1,2], with global warming resulting in an intensification of the hydrological cycle [3], altering the timing and allocation of freshwater resources [4]. Indeed, recent changes in the balance between precipitation, runoff and evapotranspiration have been attributed to anthropogenic climate change [5].
Developing countries are particularly vulnerable to the adverse effects of global climate change, due to their lower capacity for adaptation and mitigation, high population density and poverty [6]. This includes Bangladesh, one of the most densely populated countries in the world. This country’s rapid population growth and economic development have resulted in the excessive withdrawal of freshwater supplies, causing water scarcity issues [7]. This, in turn, has aggravated food shortages leading to adverse impacts on human and ecosystem health [8]. Additionally, Bangladesh experiences strong climate variability with alternate periods of floods or drought, which exacerbate water crises. As such, more effective monitoring of freshwater dynamics and quality is vital for managing river basins and reconciling water availability and demand (e.g., [9,10]).
Since hydrological conditions differ from place to place, the influence of climate change on local hydrological processes will be expected to vary between neighboring regions even under the same climate scenarios [5]. Hence, quantifying the impacts of climate change on water resources and understanding links to climate variability and anthropogenic pressure has emerged as a major area of research [11].
Water resource management and land-use changes are intrinsically linked. Water resources are dependent on vegetation state and function, which is affected by environmental change [12]. Approximately 40% of the earth’s land surface has been altered by anthropogenic activities, substantially reducing the world’s natural vegetation cover by clearing woody vegetation to expand cropland and pasture [13]. In addition, land-use activities (such as farming, grazing, logging, tree planting and urbanization) alter the hydrological process, exerting impacts on the hydrological cycle by transforming water flow pathways and, therefore, have the potential to affect water resource management [14,15]. Generally, runoff increases with the growth of built-up areas and decline of natural vegetation, whereas higher water demand and corresponding water withdrawal decrease runoff [16,17,18].
The integration of the Soil and Water Assessment Tool (SWAT) with land-use simulation models [19,20,21] provides an approach to assessing the impact of alternative land-use and land cover (LULC) scenarios on hydrology [22]. Furthermore, SWAT has demonstrated its capability in different parts of the world to assess the impacts of land-use changes (e.g., [23,24]), climate change (e.g., [25,26]), or both simultaneously (e.g., [27,28,29,30]). However, in Bangladesh, little work has been undertaken on using hydrological models to develop management plans for river basins. Spanning almost 570 km2, the Halda Basin (Figure 1) is one of the most important river basins in Chittagong, a major coastal hub in southeastern Bangladesh, and a key source of drinking water for the surrounding region. The basin is also an ecologically sensitive area that is the primary spawning ground for Indian major carps [31]. However, the Halda Basin has undergone rapid deterioration of water quality and aquatic life. During the last three decades, the southern region of this basin has experienced a significant increase in total precipitation, the total number of rain days, and maximum daily temperature [32]. Additionally, the catchment hydrology of this region is being impacted through different human interventions [33].
To date, no scientific study has been conducted to investigate the impact of global climate change and territorial land-use change on long-term streamflow oscillations in the Halda Basin, motivating us to perform this study. Thus, we applied the SWAT model to simulate streamflow in the Halda Basin under land-use and climate change scenarios, and assessed their separate and combined impacts on projections of future streamflow. The results presented provide a useful platform for regional and national stakeholders involved in water management to undertake sustainable planning for the use of freshwater resources in this region.

2. Materials and Methods

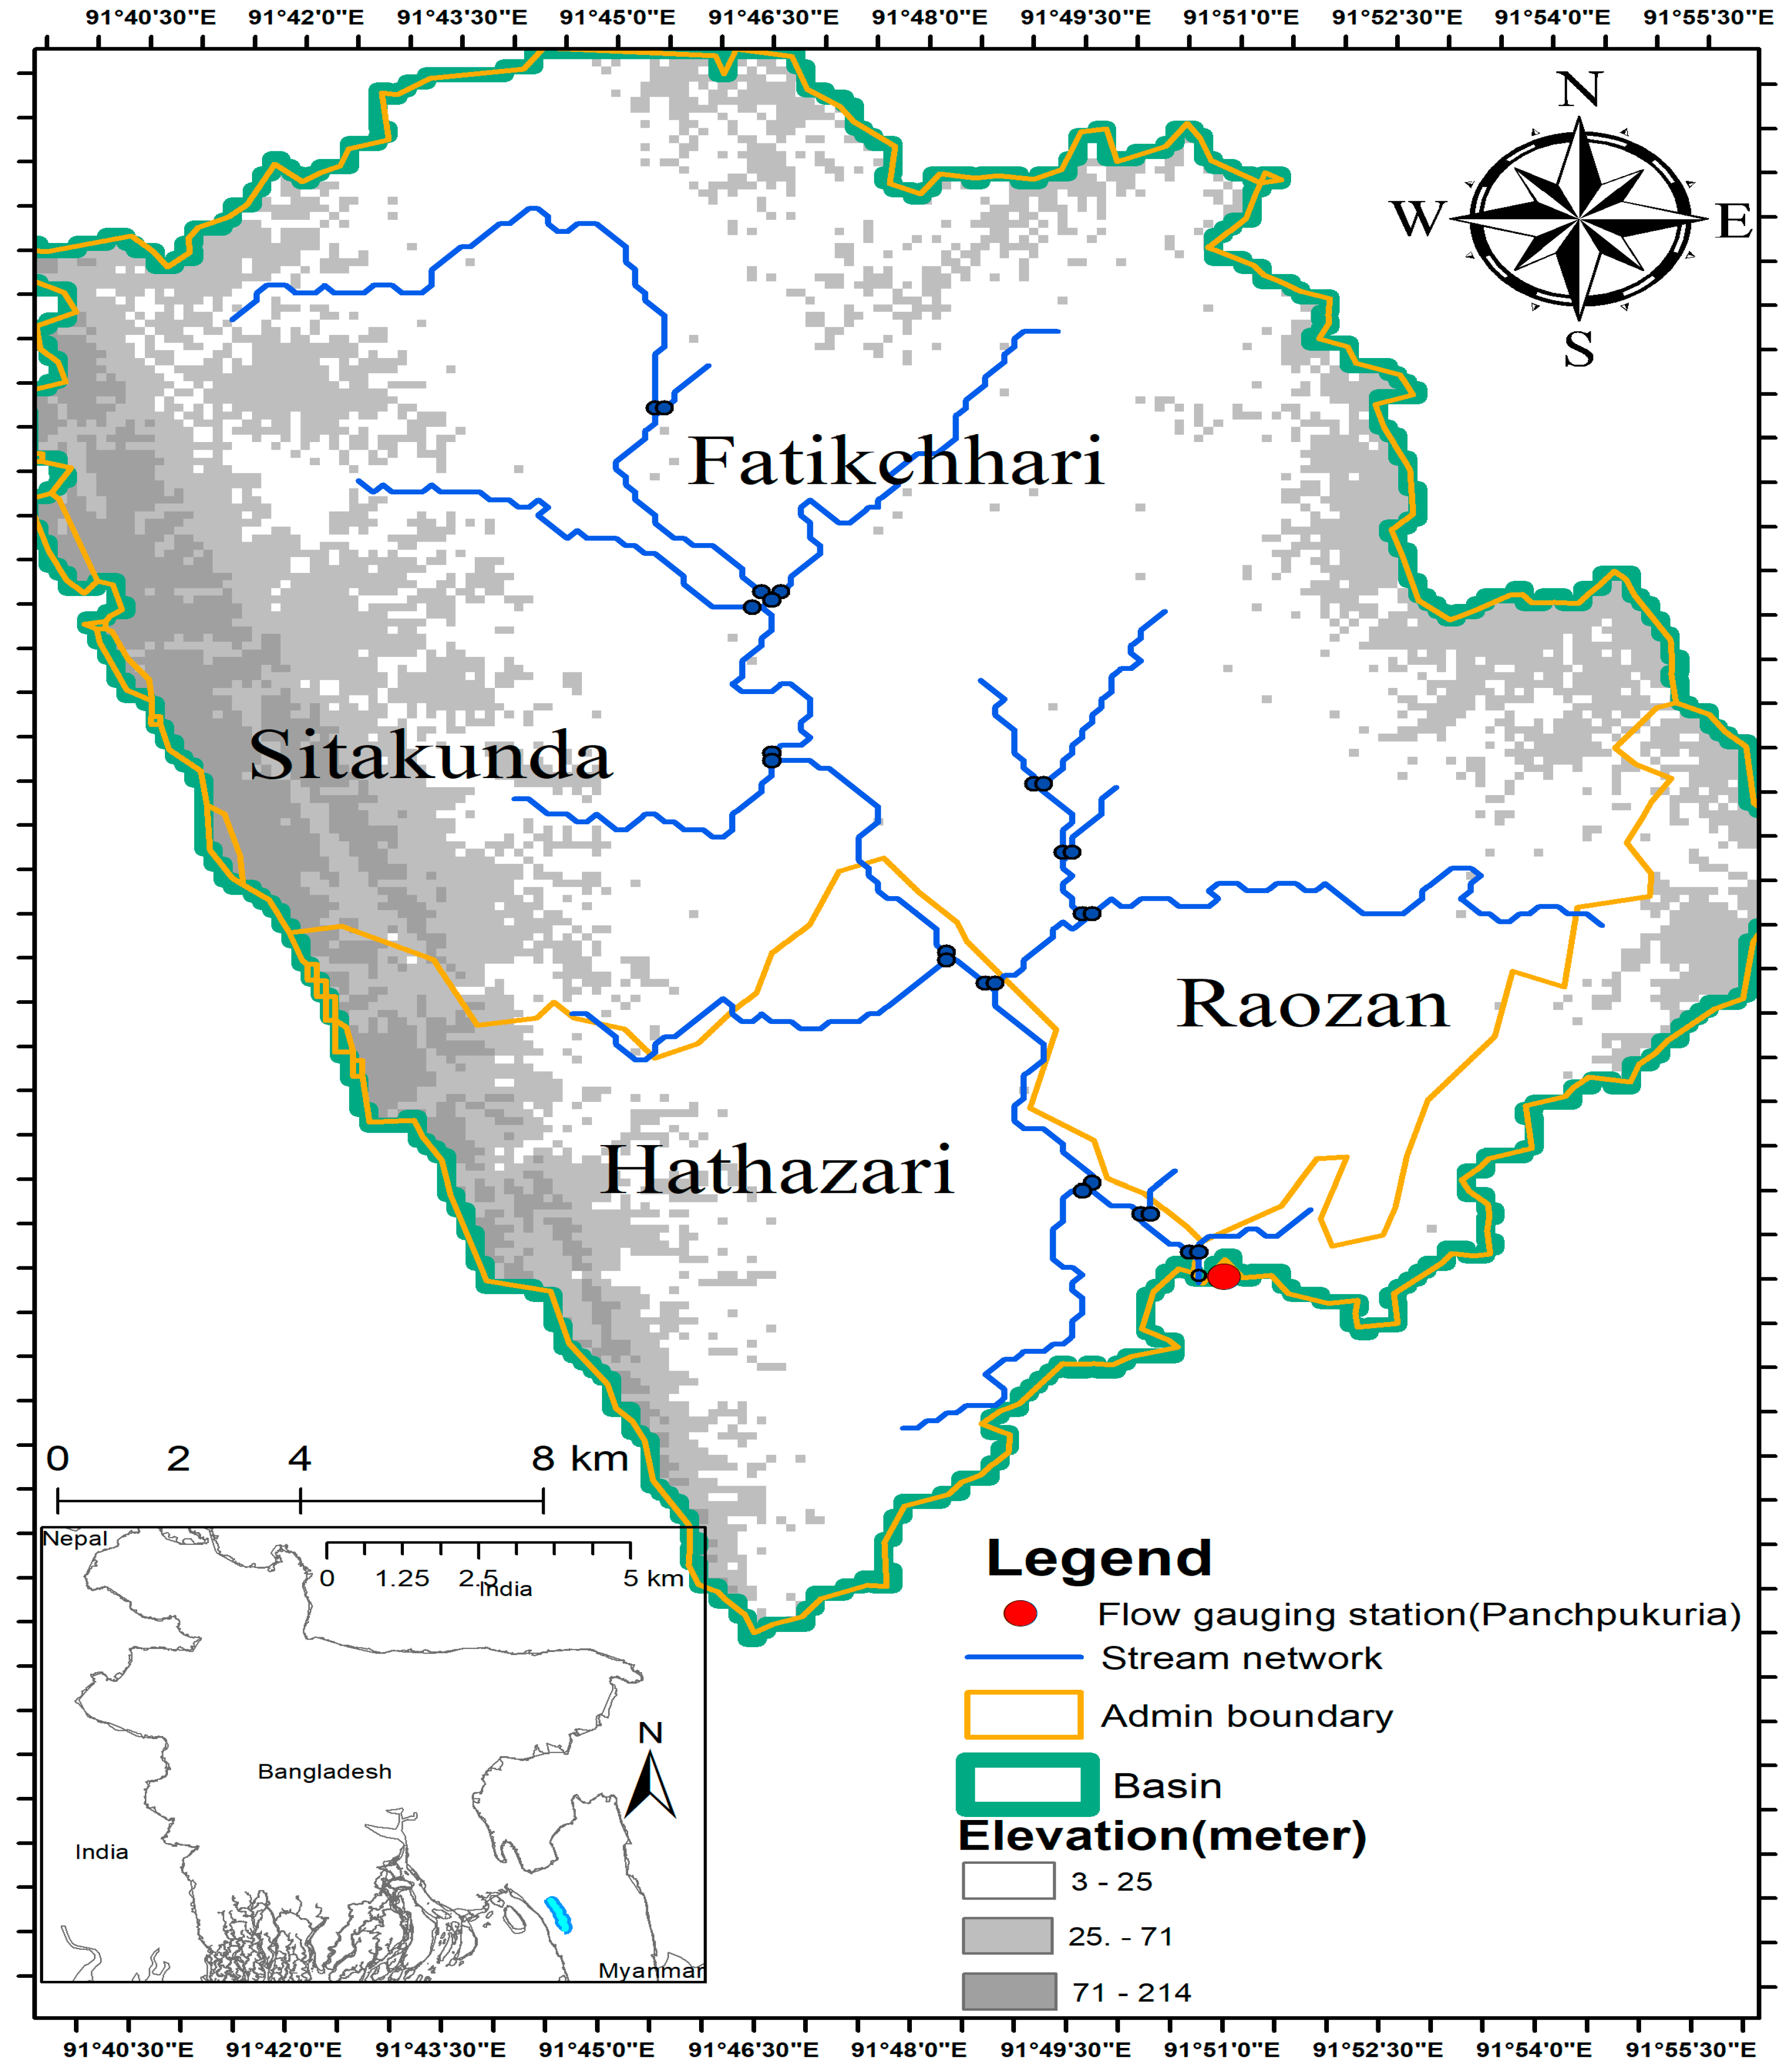
2.1. Study Area Description

The Halda Basin originates in the Chittagong Hill Tracts (Figure 1), where several hilly streams feed it along with 12 tributaries located in the downstream reaches. The Halda River has experienced substantial alterations to its flow pattern due to the construction of a rubber dam, rapid urbanization and industrialization, and increases in agriculture within the basin [34]. Subsequently, its rate of water discharge has declined, particularly in the dry season.

2.2. Data Sources and Methods

In this study, we projected future climate scenarios from two representative concentration pathways (RCP 4.5 and 8.5) and five regional climate models (RCM) (Table S1). RCP 4.5 is an intermediate scenario where radiative forcing (RF) stabilizes at 4.5 W m−2 by 2100, and atmospheric CO2 concentration reaches 576 ppm (ensemble average) by 2080, after which it stabilizes [35]. RCP 8.5 is a business-as-usual trajectory where RF reaches 8.5 Wm−2, and atmospheric CO2 concentration reaches 1231 ppm by 2100 [36].
A five-member ensemble of projected daily precipitation (prec) and daily maximum/minimum temperature (tmax and tmin, respectively) data were collected from the Coordinated Regional Climate Downscaling Experiment (CORDEX) South Asia domain database (http://cccr.tropmet.res.in/home/ftp_data.jsp, accessed on 24 September 2016). CORDEX is sponsored by the World Climate Research Program (WCRP) to produce an improved generation of regional climate change projections. CORDEX contains high-resolution data from 1971 to 2100, with a grid resolution of 0.5° latitude × 0.5° longitude. Although data from 11 regional climate models (RCM) are included in CORDEX, we downloaded data for only five RCMs for both RCPs to maximize data availability (Table S1).

2.3. Bias Correction of the RCM Outputs

Numerous bias correction methods have been developed for local climate studies [37] to reduce uncertainty from different climate models [38,39]. These methods range from simple scaling to more sophisticated approaches [40]. For this study, we used the delta method for temperature [41] and quantile mapping (QM) [10,42,43] for precipitation. This requires that the climate change signal (i.e., the delta or anomaly) is applied to the baseline climate to simulate future time periods based on the use of a change factor [41]. In doing so, daily variability is assumed to be of the same magnitude in the future and reference periods. The advantage of the delta method is that it is relatively straightforward to apply and can be applied to the full range of available non-stochastic variables (i.e., temperature). However, it cannot be applied to non-normal distributions, i.e., daily precipitation, and cannot account for changes in the length of dry and wet spells or extreme events [44]. To ensure realistic daily and inter-annual variability, we used QM to bias correct daily precipitation [37].

2.4. Projection of Land Cover Change

We obtained landcover maps for the years 2000 and 2010 from the Global Landcover Dataset (www.globeland30.org, accessed on 24 September 2016). The main land-use types for the two time periods were: cultivated land, forest, grassland, water bodies, and artificial surfaces. We used Clark Lab’s Land Change Modeler (LCM) of TerraSet (v 2016) to analyze land-use changes between 2000 and 2010, and forecast future land-uses for the 2020s, 2040s and 2060s. LCM consists of a transition potential sub-model (to assess drivers of land-use changes over the baseline period) and a change prediction model (a multi-layer Perception Markov Chain Model (MLP_ Markov)). Initially, each land cover category’s net gain and loss across the two historical periods were assessed.
In LCM, the usual constraints that alter LULC include existing built-up areas, water bodies, road networks, etc. Here, we considered slope, distance to roads and railways, and population growth as potential drivers of any changes for the transition sub-model. Next, the change prediction model forecasted the allocation of land cover for each of the future periods. This approach is summarized in the flow chart in Figure 2.

2.5. Hydrological Modeling

In this study, the Soil and Water Assessment Tool (SWAT, [45]) was used to assess the impact of climate and land-use changes on water resources across the Halda Basin.
The SWAT model was run at daily steps from 2006 to 2070 with RCP 4.5 and 8.5 scenarios of bias-corrected daily tmax, tmin and prec data for simulating future discharge. To determine the relative importance of climate change, land-use change, and their combined effect on streamflow, we generated two sets of simulations: a) climate change-only (CC) and b) climate and land-use change (CC + LUC). We then calculated the ratio of streamflow from the CC simulation compared to the CC + LUC simulation to calculate the portion of streamflow arising from land-use change only.
Linear regression between simulated streamflow and year was undertaken to determine whether there were trends in the simulated data [46]. A 95% cutoff for significance, i.e., the probability of accepting the null hypothesis of no change is <0.05, was used in this study.

3. Results and Discussion

We used an existing streamflow model that was previously developed and calibrated for the Halda Basin [47]. On validation, the model was found to have a satisfactory performance with a goodness of fit measure (R2) of 0.80 and NSE of 0.71 [47]. We ran the calibrated SWAT model at daily steps from 2006 to 2070 with RCP 4.5 and 8.5 scenarios of bias-corrected daily maximum/minimum temperature (tmax and tmin) and precipitation (prec) data for simulating future discharge.

3.1. Future Temperature and Precipitation Changes

The change in mean daily tmax and tmin for the projected 2006–2070 period, relative to the baseline 1986–2005 period, was calculated for all five RCM experiments under the RCP 4.5 and 8.5 scenarios (Figure S1). Monthly tmax is projected to increase across all months under both RCPs. By the 2060s, tmax is projected to be on average 0.95 °C and 2.3 °C warmer than the baseline period under RCP 4.5 and 8.5, respectively (Table 1). Although the increase under RCP 4.5 is relatively consistent across all months, under the higher emission pathway (RCP 8.5) winter temperature (December–February) is projected to increase slightly faster. Tmin is also projected to increase across the 21st Century, although at a lower rate than tmax. By the 2060s, tmin across the Halda Basin is likely to be 0.95 and 1.3 °C warmer than the baseline period for RCP4.5 and RCP 8.5, respectively (Table 1). Rates of increase are relatively uniform across all months under both RCPs.
The analysis of the decadal mean air temperature shows interdecadal variability (Table 1). Under RCP 4.5, tmax is projected to increase most rapidly in the 2030s, to 1.5 °C above the baseline, and then rises more slowly. By contrast, tmin is projected to continue to rise steadily until at least the 2060s. Under RCP 8.5, both tmin and tmax are projected to continue rising until at least the 2060s. Similar findings were also recently projected by [48], who report that Southeast Asia will face an increase in temperature through to the late 21st Century, which will cause frequent changes and shifts to monsoon precipitation.
Annual precipitation during the baseline period averaged 3225 mm p.a. (±609 mm). Precipitation over the monsoon period (June–September) averaged 565 mm (±128 mm) per month. In contrast, during winter (December–February), the driest part of the year, total precipitation over the baseline period averaged 13 mm per month (±12 mm).
Averaged across the five RCMs, annual precipitation for both RCP scenarios is projected to decrease ~231 mm from the baseline (269 mm). However, there is some variability in projections for the monsoon period (Figure 3). Future declines in precipitation were also reported by [49], who used RCMs to produce high-resolution climate data for evaluating climate effects in the Ganges-Brahmaputra-Meghna (GBM).
By the 2060s, annual precipitation is projected to decline ~234 mm compared to the baseline period (i.e., 13% decrease) (Table 2). Precipitation during the monsoon period (June–September) is projected to be an average of 16% per month lower than the baseline monsoon (565 mm), while the dry months are projected to experience an increase in precipitation of ~108% (14 mm) relative to the baseline. These results are consistent with [50], who reported projected increases in precipitation during the dry months (November–January) by 2075, in Bangladesh’s Brahmaputra Basin. Similarly, [51] argued that dry months would experience greater precipitation increases than the monsoon period. Our results also indicate that while the quantity of annual precipitation may decline, the overall number of wet days (i.e., >0.9 mm) is projected to increase (baseline = 133; 2060s, RCP 4.5 = 200, RCP 8.5 = 286).

3.2. Impact of Climate Change on Streamflow

Annual, monthly, and seasonal streamflow were calculated for 2006–2070 under both RCPs while retaining land-use conditions for the year 2000 (Figure 4). Averaged annual streamflow across the Halda River Basin is projected to increase during the 21st Century, compared to the baseline period 1986–2005 (562 m3/s). Simulated results for RCP 4.5 indicate that annual streamflow will continue to increase through to at least the 2060s (i.e., ~674 m3/s). While RCP 8.5 simulates a major increase in annual streamflow by 2020 (i.e., from 562 m3/s to 673 m3/s), a decline is projected to occur at some point between 2020 and the 2040s and continue until the 2060s (643 m3/s).
Considerable differences for monthly streamflow trends were found. By the 2060s, the greatest increase in monthly streamflow is projected to occur in February (16 m3/s for RCP 4.5 and 12 m3/s for RCP 8.5, representing 633% and 469% increase under these scenarios, respectively (Figure 5), relative to the baseline of 2.2 m3/s). In contrast, July is projected to experience the greatest decline, i.e., −21% (97 m3/s) and −24% (94 m3/s) for RCP 4.5 and 8.5, respectively. On a seasonal basis, these represent an increase in streamflow during the dry season of 134% and 110% for RCP 4.5 and 8.5, respectively, by 2060s. In contrast, streamflow during the monsoon season is projected to decline by −8% (RCP 4.5) to −13% (RCP 8.5). These results are in contrast to other hydrological studies for this region (e.g., [52,53,54]), which could be because the resolution of the RCM is too coarse for a small catchment and therefore, does not capture the behavior of land-atmosphere dynamics. Other uncertainties could be associated with local-scale patterns in downscaling or bias in modeled precipitation [55].
Ref. [56] also argued that future changes of hydrological variables are larger in the dry season, very likely because small absolute changes during the dry season lead to large proportional changes. These results of increasing streamflow in dry months are consistent with simulations for the Brahmaputra River Basin reported by [49,57]. To summarize, SWAT models indicate that, as a result of changes in precipitation, the Halda Basin is likely to experience lower streamflow in the monsoon period, thus reducing flood potential and risk in the wet season.
Imminent environmental change is anticipated to alter the global hydrological cycle, resulting in changes to the regional distribution of freshwater supplies. However, regional precipitation and temperature projections differ between models, making future water resource projections highly uncertain. Climate scenarios for this study were derived from five regionally downscaled RCMs and can show substantial variation in their precipitation forecasts. As such, streamflow may also vary depending upon which future eventuates. Correlations of streamflow and year based on data from individual RCMs can highlight some of these between-model differences (Figure 5). Indeed, there are substantial differences among some of these models, which could result in very different outcomes in terms of streamflow, depending on which ‘future’ eventuates. For instance, CSSM (RCP 4.5) simulates a period of very little change in streamflow for the pre-monsoon season, spanning almost 30 years, followed by an abrupt increase around the 2040s. In contrast, IHEC (RCP 4.5) has substantial inter-annual variability up until around 2050, after which there is considerably less variability in both the monsoon and pre-monsoon periods. IHEC (RCP 8.5) has several years with anomalously high pre-monsoon streamflow.

3.3. Impact of Land-Use Changes

The Halda River Basin covers 569 km2. Across this area, the primary LULC categories in the year 2000, were cultivated land (311 km2), followed by forest (176 km2), artificial surfaces (64.5 km2), grassland (16.1 km2) and waterbodies (0.6 km2) (Table 3).
During the period from 2000–2010, substantial changes in LULC took place across the Halda Basin. Generally, the trend was the conversion of grassland to forest and of grassland and cultivated land to settlement or artificial surfaces and forest (Figure 6). The changes were mainly caused by government reforestation policy, which led to spatial shifts in forests (with little overall increase in area) and decreases in grassland and cultivated land. The key changes were mostly found in the transition of cultivated land and grassland to artificial surfaces, which increased from 64.5 km2 in 2000 to 106.0 km2 in 2010.
Using the LCM, we created a map of transitions. Different constants or time-dependent drivers, such as slope, distance from road, railways, and population, were added as the transition sub-model. Multi-layer Perception Markov Chain Model (MLP Markov) was offset by gains elsewhere (via conversion of previously cultivated or built-up areas), resulting in a net change of −0.03%. Cultivated land lost 15.20% to forests and artificial surfaces and gained 4.04%, with a net change of −3.65%. We then used these changes to project future land-use and land cover maps for the 2020s, 2040s and 2060s (Figure S2).
This model suggests that artificial surfaces will continue to expand at the expense of other land cover categories. Due to urbanization and industrial development, the percentage of artificial surfaces is projected to increase by 206% (from 64.5 km2 in 2000 to 197.6 km2 in the 2060s). In contrast, cultivated land is projected to decline by 42% (from 311.3 km2 in 2000, to 181.5 km2 in the 2060s) and water bodies by 35% (from 0.58 km2 in 2000, to 0.37 km2 in the 2060s) (Figure 6). Ref. [58] also reported a significant LULC change over the period 1978–2017. According to their findings, economic development played a key role in the decline of vegetation cover and water bodies in the Halda Basin at a rate of 35.10% and 85.47%, respectively, across the last 40 years.

3.4. Combined Effects of Climate and Land-Use Change

Under RCP 4.5, streamflow is likely to decline by ~3% between the baseline 1986–2005 and 2005–2020, and then increase by ~14% over the period 2020–2040 and 2040–2060 (Table 4). Streamflow in the wet season is projected to decline across the three future time periods, although dry season streamflow is projected to more than double. While similar patterns are also projected for the wet and dry season under RCP 8.5, annual streamflow is projected to be 13 and 16% above the baseline by the 2020s (633 m3/s) and 2060s (654 m3/s), respectively.
By the 2060s, streamflow for the dry month of February is projected to increase by 600% (16 m3/s) and 452% (12 m3/s) under RCP 4.5 and 8.5, respectively, compared to the baseline period. Streamflow for the entire dry season is projected to increase to 110 m3/s under RCP 4.5 and 98 m3/s under RCP 8.5, relative to the baseline (47 m3/s). In contrast, streamflow during the monsoon is projected to decline from the baseline of 400 m3/s to 367 or 349 m3/s under RCP 4.5 and 8.5, respectively.
Hence, the results suggest that there will be higher precipitation and streamflow during the dry period, which may be beneficial to farmers. For example, an important crop in this region is Boro Rice, known as a high water-demanding crop. Currently, during the dry period from December–March, approximately 80 to 135 million m3 of water needs to be withdrawn from the Halda Basin to cultivate Boro Rice and winter vegetation [34].
These results demonstrate that streamflow will likely increase in the long term under both RCP scenarios under the combined impact of climate and land-use change. However, in the near term (i.e., from the baseline period to the 2020s), streamflow is projected to decline under RCP 4.5. This contrasts substantially with the considerable increase in streamflow projected under RCP 8.5 for the 2020s, and illustrates that very different water management actions may be required to reduce risks associated with this uncertainty.

3.5. Changes in Streamflow Resulting from Land-Use Changes

To assess the change in streamflow from the impact of projected LULC only, the proportional change in streamflow from the combined simulation compared to the climate change only simulation was calculated. The results indicate that annual streamflow will fluctuate across three time periods (the 2020s, 2040s and 2060s) (Table 4). Under RCP 4.5, streamflow is projected to increase by 10% in the 2020s, decline slightly during the 2040s, and again increase by 5% in the 2060s. Under RCP 8.5, it is projected to increase 6% for the 2020s then decline slightly for the latter two periods. Streamflow during both the wet and dry seasons is projected to remain very similar to baseline levels. A possible driver of the decline in streamflow may be the projected increase in forest cover in hydrologically sensitive areas (e.g., steep slopes) due to; (i) targeted afforestation of grasslands (Figure 6), as robust forest vegetation has higher evapotranspiration potential than croplands, grasslands and/or barren land [59], and (ii) the decline in rainfall during the wet monsoon season. While [27] reported that increases in streamflow might result from urban growth and larger areas of impervious surfaces, our model projected reductions in streamflow even though artificial surfaces increase. Potential explanations for these inconsistencies may be linked to additional complex hydrogeological parameters that regulate flow throughout the shallow and deep aquifers (e.g., [10]), but further studies are needed for elucidation.
Therefore, it is assumed that the changes in LULC (primarily artificial surfaces and forest cover) will likely result in a slight decline in flow across both the wet and dry seasons over the current decade. The simulated land-use change does not appear to substantially impact river flow, indicating that a larger LULC change would need to occur for the impact to be reflected in the flow amount.

4. Conclusions

The contribution of separate and combined impacts of climate and LULC changes on streamflow in the Halda Basin were evaluated using the SWAT model associated with the LCM model and two future scenarios using five RCM experiments. Multi-climate model comparisons showed substantial interannual variation in long-term projections of precipitation regimes. Despite projection uncertainties, this study indicates that the Halda Basin is expected to become warmer in the future, with more precipitation during the dry season but less in the wet monsoon period. Simulations also show that climate change is likely to increase future streamflow in the Halda River. Monthly streamflow changes were influenced mainly by the variability in precipitation. Simple LCMs projected decreases in the area of grassland along with cultivated land at the expense of artificial surfaces. Combined, future climate and land-use changes are projected to result in increases in annual streamflow. Results also indicate that climate change is likely to be a greater driver of changes in streamflow than land-use changes. However, there is considerable variation between RCP 4.5 and 8.5 and across the time periods. In addition, much of the variation is projected for the near future, indicating that adaptation plans will need to span very different scenarios.
Understanding the changes in streamflow caused by separate and combined impacts of future climate and land-use changes provides very useful information to all stakeholders involved in examined territorial freshwater use and management. It can facilitate effective decision-making with respect to the implementation of land and water resources planning and management.

Supplementary Materials

The following are available online at https://www.mdpi.com/article/10.3390/su132112067/s1, Figure S1: Mean monthly multi-model future temperature projection for RCP4.5 and 8.5 scenarios, Figure S2: Future land use/landcover maps arranged from 2010 to 2060, Table S1: List of Regional Climate Models (RCMs) and of their associated Global Climate Models (GCMs) used in this study.

Author Contributions

Conceptualization, F.R. and J.M.M.; formal analysis, F.R., M.S.I.; writing—original draft, F.R.; writing—review and editing, L.J.B. and G.O.; Supervision-LB and J.M.M. All authors have read and agreed to the published version of the manuscript.

Funding

This research was partially funded by SUST (Shahjalal University of Science and Technology), Sylhet, Bangladesh, Research Centre, Project Code: FES/2018/01/02. The APC was funded by Gabrijel Ondrasek, Faculty of Agriculture, University of Zagreb, 10000 Zagreb, Croatia.

Institutional Review Board Statement

Not applicable.

Informed Consent Statement

Not applicable.

Data Availability Statement

Not applicable.

Acknowledgments

Farzana Raihan was supported by the International Macquarie University Research Excellence scholarship (iMQRES) program. Authors particularly indebted to Monir Uddin Ahmed, Assistant Professor, Department of Economics, SUST, regarding his assistance with data analysis. Guangqi Li, University of Stirling, UK, A.K.M. Saiful Islam and Jamal Khan from IWFM, BUET, also gratefully acknowleged here for helping initial data extraction.

Conflicts of Interest

The authors declare that there is no conflict of interest regarding the publication of this article.

References

  1. Simonovic, S.P. Assessment of water resources through system dynamics simulation: From global issues to regional solutions. In Proceedings of the 36th Annual Hawaii International Conference on, Big Island, HI, USA, 6–9 January 2003; IEEE: Piscataway, NJ, USA; p. 9. [Google Scholar]
  2. Zhu, Y.; Li, Y.; Wang, Y.; Li, L. The Impact of Water and Soil Scarcity and Pollution on Industrial Agglomeration: Evidence from China. Sustainability 2021, 13, 5428. [Google Scholar] [CrossRef]
  3. IPCC. Climate Change 2013: The Physical Science Basis: Working Group I contribution to the Fifth Assessment Report of the Intergovernmental Panel on Climate Change; Cambridge University Press: Cambridge, UK; New York, NY, USA, 2013. [Google Scholar]
  4. Kundzewicz, Z.W.; Mata, L.J.; Arnell, N.W.; Döll, P.; Jimenez, B.; Miller, K.; Oki, T.; Şen, Z.; Shiklomanov, I. The implications of projected climate change for freshwater resources and their management. Hydrol. Sci. J. 2008, 53, 3–10. [Google Scholar] [CrossRef]
  5. Zhang, X.; Srinivasan, R.; Hao, F. Predicting hydrologic response to climate change in the Luohe River basin using the SWAT model. Trans. ASABE 2007, 50, 901–910. [Google Scholar] [CrossRef]
  6. Ha-Mim, N.M.; Hossain, M.; Rahaman, K.R.; Mallick, B. Exploring Vulnerability–Resilience–Livelihood Nexus in the Face of Climate Change: A Multi-Criteria Analysis for Mongla, Bangladesh. Sustainability 2020, 12, 7054. [Google Scholar] [CrossRef]
  7. Ahammed, S.J.; Chung, E.S.; Shahid, S. Parametric assessment of pre-monsoon agricultural water scarcity in Bangladesh. Sustainability 2018, 10, 819. [Google Scholar] [CrossRef] [Green Version]
  8. Gain, A.K.; Wada, Y. Assessment of future water scarcity at different spatial and temporal scales of the Brahmaputra River Basin. Water Resour. Manag. 2014, 28, 999–1012. [Google Scholar] [CrossRef]
  9. Hollander, D.; Ajroud, B.; Thomas, E.; Peabody, S.; Jordan, E.; Javernick-Will, A.; Linden, K. Monitoring Methods for Systems-Strengthening Activities Toward Sustainable Water and Sanitation Services in Low-Income Settings. Sustainability 2020, 12, 7044. [Google Scholar] [CrossRef]
  10. Ondrasek, G.; Begić, H.B.; Romić, D.; Brkić, Ž.; Husnjak, S.; Kovačić, M.B. A novel LUMNAqSoP approach for prioritising groundwater monitoring stations for implementation of the Nitrates Directive. Environ. Sci. Eur. 2021, 33, 1–16. [Google Scholar] [CrossRef]
  11. Papa, F.; Frappart, F.; Malbeteau, Y.; Shamsudduha, M.; Vuruputur, V.; Sekhar, M.; Ramillien, G.; Prigent, C.; Aires, F.; Pandey, R.K.; et al. Satellite-derived surface and sub-surface water storage in the Ganges–Brahmaputra River Basin. J. Hydrol. Reg. Stud. 2015, 4, 15–35. [Google Scholar] [CrossRef] [Green Version]
  12. Ukkola, A.M. Effects of Vegetation Processes on Water Resources at Global and Continental Scales. Ph.D. Thesis, Macquarie University, Sydney, Australia, 2015. [Google Scholar]
  13. Sterling, S.; Ducharne, A. Comprehensive data set of global land cover change for land surface model applications. Glob. Biogeochem. Cycles 2008, 22, GB3017. [Google Scholar] [CrossRef]
  14. Chhabra, A.; Geist, H.; Houghton, R.A.; Haberl, H.; Braimoh, A.K.; Vlek, P.L.; Patz, J.; Xu, J.; Ramankutty, N.; Coomes, O. Land-Use Land-Cover Chang; Springer: Berlin/Heidelberg, Germany, 2006; pp. 71–116. [Google Scholar]
  15. Stonestrom, D.A.; Scanlon, B.R.; Zhang, L. Introduction to special section on Impacts of Land Use Change on Water Resources. Water Resour. Res. 2009, 45, W00A00. [Google Scholar] [CrossRef] [Green Version]
  16. Arnold, C.L.; Gibbons, C.J. Impervious Surface Coverage: The Emergence of a Key Environmental Indicator. J. Am. Plan. Assoc. 1996, 62, 243–258. [Google Scholar] [CrossRef]
  17. Foley, J.A.; Defries, R.; Asner, G.P.; Barford, C.; Bonan, G.; Carpenter, S.R.; Chapin, F.S.; Coe, M.T.; Daily, G.C.; Gibbs, H.K.; et al. Global consequences of land use. Science 2005, 309, 570–574. [Google Scholar] [CrossRef] [Green Version]
  18. Wijesekara, G.; Gupta, A.; Valeo, C.; Hasbani, J.G.; Qiao, Y.; Delaney, P.; Marceau, D. Assessing the impact of future land-use changes on hydrological processes in the Elbow River watershed in southern Alberta, Canada. J. Hydrol. 2012, 412–413, 220–232. [Google Scholar] [CrossRef]
  19. Dixon, B.; Earls, J. Effects of urbanization on streamflow using SWAT with real and simulated meteorological data. Appl. Geogr. 2012, 35, 174–190. [Google Scholar] [CrossRef]
  20. Shi, P.; Chen, C.; Srinivasan, R.; Zhang, X.; Cai, T.; Fang, X.; Qu, S.; Chen, X.; Li, Q. Evaluating the SWAT model for hydrological modeling in the Xixian watershed and a comparison with the XAJ model. Water Resour. Manag. 2011, 25, 2595–2612. [Google Scholar] [CrossRef]
  21. Wilson, C.O.; Weng, Q. Simulating the impacts of future land use and climate changes on surface water quality in the Des Plaines River watershed, Chicago Metropolitan Statistical Area, Illinois. Sci. Total. Environ. 2011, 409, 4387–4405. [Google Scholar] [CrossRef] [PubMed]
  22. Lee, J.; Lee, Y.; Woo, S.; Kim, W.; Kim, S. Evaluation of water quality interaction by dam and weir operation using SWAT in the Nakdong River Basin of South Korea. Sustainability 2020, 12, 6845. [Google Scholar] [CrossRef]
  23. Ghaffari, G.; Keesstra, S.; Ghodousi, J.; Ahmadi, H. SWAT-simulated hydrological impact of land-use change in the Zanjanrood basin, Northwest Iran. Hydrol. Process. 2010, 24, 892–903. [Google Scholar] [CrossRef]
  24. Miller, S.N.; Kepner, W.G.; Mehaffey, M.H.; Hernandez, M.; Miller, R.C.; Goodrich, D.C.; Devonald, K.; Heggem, D.T.; Miller, W.P. Integrating landscape assessment and hydrologic modeling for land cover change analysis. JAWRA J. Am. Water Resour. Assoc. 2002, 38, 915–929. [Google Scholar] [CrossRef]
  25. Jha, M.K. Natural and Anthropogenic Disasters: Vulnerability, Preparedness and Mitigation; Springer Science & Business Media: Heidelberg, Germany, 2010. [Google Scholar]
  26. Liu, L.; Liu, Z.; Ren, X.; Fischer, T.; Xu, Y. Hydrological impacts of climate change in the Yellow River Basin for the 21st century using hydrological model and statistical downscaling model. Quat. Int. 2011, 244, 211–220. [Google Scholar] [CrossRef]
  27. Kim, J.; Choi, J.; Choi, C.; Park, S. Impacts of changes in climate and land use/land cover under IPCC RCP scenarios on streamflow in the Hoeya River Basin, Korea. Sci. Total. Environ. 2013, 181, 452–453. [Google Scholar] [CrossRef] [PubMed]
  28. Li, Z.; Liu, W.-Z.; Zhang, X.-C.; Zheng, F.-L. Impacts of land use change and climate variability on hydrology in an agricultural catchment on the Loess Plateau of China. J. Hydrol. 2009, 377, 35–42. [Google Scholar] [CrossRef]
  29. Mango, L.M.; Melesse, A.M.; Mcclain, M.E.; Gann, D.; Setegn, S.G. Land use and climate change impacts on the hydrology of the upper Mara River Basin, Kenya: Results of a modeling study to support better resource management. Hydrol. Earth Syst. Sci. 2011, 15, 2245–2258. [Google Scholar] [CrossRef] [Green Version]
  30. Tu, J. Combined impact of climate and land use changes on streamflow and water quality in eastern Massachusetts, USA. J. Hydrol. 2009, 379, 268–283. [Google Scholar] [CrossRef]
  31. Kabir, M.H.; Kibria, M.M.; Hossain, M.M. Indirect and non-use values of Halda River-a unique natural breeding ground of Indian carps in Bangladesh. J. Environ. Sci. Nat. Resour. 2013, 6, 31–36. [Google Scholar] [CrossRef] [Green Version]
  32. Raihan, F.; Li, G.; Harrison, S. Detection of recent changes in climate using meteorological data from south-eastern Bangladesh. J. Climatol. Weather. Forecast. 2015, 3, 137. [Google Scholar]
  33. Akter, A.; Ali, M.H. Environmental flow requirements assessment in the Halda River, Bangladesh. Hydrol. Sci. J. 2012, 57, 326–343. [Google Scholar] [CrossRef]
  34. MoFL. Ministry of Fisheries and Livestock Final Report: Impact Assessment on Upstream Water Withdrawal to Conserve Natural Breeding Habitat of Major Carps in the River Halda, Dhaka, Bangladesh; Bangladesh Fisheries Research Institute: Mymensingh, Bangladesh, 2016. [Google Scholar]
  35. Clarke, L.; Edmonds, J.; Jacoby, H.; Pitcher, H.; Reilly, J.; Richels, R. Scenarios of Greenhouse Gas Emissions and Atmospheric Concentrations; US Department of Energy Publications: Washington, DC, USA, 2007; p. 6. [Google Scholar]
  36. Riahi, K.; Grübler, A.; Nakicenovic, N. Scenarios of long-term socio-economic and environmental development under climate stabilization. Technol. Forecast. Soc. Chang. 2007, 74, 887–935. [Google Scholar] [CrossRef]
  37. Jakob Themessl, M.; Gobiet, A.; Leuprecht, A. Empirical-statistical downscaling and error correction of daily precipitation from regional climate models. Int. J. Climatol. 2011, 31, 1530–1544. [Google Scholar] [CrossRef]
  38. Chen, C.; Haerter, J.O.; Hagemann, S.; Piani, C. On the contribution of statistical bias correction to the uncertainty in the projected hydrological cycle. Geophys. Res. Lett. 2011, 38, L20403. [Google Scholar] [CrossRef] [Green Version]
  39. Johnson, F.; Sharma, A. A nesting model for bias correction of variability at multiple time scales in general circulation model precipitation simulations. Water Resour. Res. 2012, 48. [Google Scholar] [CrossRef] [Green Version]
  40. Teutschbein, C.; Seibert, J. Bias correction of regional climate model simulations for hydrological climate-change impact studies: Review and evaluation of different methods. J. Hydrol. 2012, 456, 12–29. [Google Scholar] [CrossRef]
  41. Hay, L.E.; Wilby, R.L.; Leavesley, G.H. A comparison of delta change and downscaled GCM scenarios for three mountainous basins in the United States. JAWRA J. Am. Water Resour. Assoc. 2000, 36, 387–397. [Google Scholar] [CrossRef]
  42. Sun, F.; Roderick, M.L.; Lim, W.H.; Farquhar, G.D. Hydroclimatic projections for the Murray-Darling Basin based on an ensemble derived from Intergovernmental Panel on Climate Change AR4 climate models. Water Resour. Res. 2011, 47, W00G02. [Google Scholar] [CrossRef]
  43. Wood, A.W.; Leung, L.R.; Sridhar, V.; Lettenmaier, D. Hydrologic implications of dynamical and statistical approaches to downscaling climate model outputs. Clim. Chang. 2004, 62, 189–216. [Google Scholar] [CrossRef]
  44. Trzaska, S.; Schnarr, E. A Review of Downscaling Methods for Climate Change Projections; United States Agency for International Development: Washington, DC, USA, 2014; pp. 1–42. [Google Scholar]
  45. Arnold, J.G.; Srinivasan, R.; Muttiah, R.S.; Williams, J.R. Large area hydrologic modeling and assessment part I: Model development 1. JAWRA J. Am. Water Resour. Assoc. 1998, 34, 73–89. [Google Scholar] [CrossRef]
  46. Blender, R.; Luksch, U.; Fraedrich, K.; Raible, C.C. Predictability study of the observed and simulated European climate using linear regression. Q. J. R. Meteorol. Soc. 2003, 129, 2299–2313. [Google Scholar] [CrossRef]
  47. Raihan, F.; Beaumont, L.J.; Maina, J.; Saiful Islam, A.; Harrison, S.P. Simulating streamflow in the Upper Halda Basin of southeastern Bangladesh using SWAT model. Hydrol. Sci. J. 2020, 65, 138–151. [Google Scholar] [CrossRef]
  48. Deb, J.C.; Phinn, S.; Butt, N.; McAlpine, C.A. The impact of climate change on the distribution of two threatened Dipterocarp trees. Ecol. Evol. 2017, 7, 2238–2248. [Google Scholar] [CrossRef]
  49. Janes, T.; McGrath, F.; Macadam, I.; Jones, R. High-resolution climate projections for South Asia to inform climate impacts and adaptation studies in the Ganges-Brahmaputra-Meghna and Mahanadi deltas. Sci. Total Environ. 2019, 650, 1499–1520. [Google Scholar] [CrossRef]
  50. Pervez, M.S.; Henebry, G.M. Assessing the impacts of climate and land use and land cover change on the freshwater availability in the Brahmaputra River basin. J. Hydrol. Reg. Stud. 2015, 3, 285–311. [Google Scholar] [CrossRef] [Green Version]
  51. Rajib, M.A.; Rahman, M.M.; Islam, A.S.; Mcbean, E.A. Analyzing the Future Monthly Precipitation Pattern in Bangladesh from Multi-Model Projections Using Both GCM and RCM. In Proceedings of the World Environmental and Water Resources Congress: Bearing Knowledge for Sustainability, Palm Springs, CA, USA, 22–26 May 2011; pp. 3843–3851. [Google Scholar]
  52. Immerzeel, W. Historical trends and future predictions of climate variability in the Brahmaputra basin. Int. J. Climatol. 2008, 28, 243–254. [Google Scholar] [CrossRef]
  53. Immerzeel, W.W.; Van Beek, L.P.; Bierkens, M.F. Climate change will affect the Asian water towers. Science 2010, 328, 1382–1385. [Google Scholar] [CrossRef] [PubMed]
  54. Immerzeel, W.; Petersen, L.; Ragettli, S.; Pellicciotti, F. The importance of observed gradients of air temperature and precipitation for modeling runoff from a glacierized watershed in the Nepalese Himalayas. Water Resour. Res. 2014, 50, 2212–2226. [Google Scholar] [CrossRef] [Green Version]
  55. Akhter, M.; Ahmad, N.; Booij, M. Use of regional climate model simulations as input for hydrological models for the Hindukush-Karakorum-Himalaya region. Hydrol. Earth Sci. 2009, 13, 1075–1089. [Google Scholar] [CrossRef] [Green Version]
  56. Masood, M.; Yeh, P.J.; Hanasaki, N.; Takeuchi, K. Model study of the impacts of future climate change on the hydrology of Ganges-Brahmaputra-Meghna basin. Hydrol. Earth Sci. 2015, 19, 747–770. [Google Scholar] [CrossRef] [Green Version]
  57. Alam, S.; Ali, M.M.; Islam, Z. Future Streamflow of Brahmaputra River Basin under Synthetic Climate Change Scenarios. J. Hydrol. Eng. 2016, 21, 05016027. [Google Scholar] [CrossRef]
  58. Chowdhury, M.; Hasan, M.E.; Abdullah-Al-Mamun, M.M. Land use/land cover change assessment of Halda watershed using remote sensing and GIS. Egypt. J. Remote. Sens. Space Sci. 2020, 23, 63–75. [Google Scholar] [CrossRef]
  59. Ma, X.; Xu, J.; Luo, Y.; Prasad Aggarwal, S.; Li, J. Response of hydrological processes to land-cover and climate changes in Kejie watershed, south-west China. Hydrol. Process. 2009, 23, 1179–1191. [Google Scholar] [CrossRef]
Figure 1. The Halda Basin, southeastern Bangladesh. The inset map shows the stream network of the Halda Basin.
Sustainability 13 12067 g001
Figure 2. Schematic diagram of the Land Change Model used to forecast future land-use across the Halda Basin, Bangladesh, for the 2020s, 2040s and 2060s.
Sustainability 13 12067 g002
Figure 3. Projected mean monthly precipitation for 2060–2069 compared to the baseline 1986–2005 period average.
Sustainability 13 12067 g003
Figure 4. Projected changes in monthly streamflow under RCP 4.5 and 8.5 climate scenarios for the decade 2060–2069. Logarithmic differences represent the change from the baseline (1986–2005).
Sustainability 13 12067 g004
Figure 5. Trends in streamflow for the future periods under RCP 4.5 (top) and RCP 8.5 (bottom) scenarios showing pre-monsoon (Mar–May), monsoon (Jun–Sep) and post-monsoon (Oct–Feb) seasons.
Sustainability 13 12067 g005
Figure 6. Gains and losses of land-use/cover types between 2000 and 2010 across the Halda River Basin.
Sustainability 13 12067 g006
Table 1. Inter-decadal variability in mean temperature changes (°C) relative to the baseline 1986–2005, for RCP 4.5 and RCP 8.5 scenarios. Results are based on the average of a five-member regional climate model ensemble.
DecadeTmax 4.5 Tmin 4.5 Change
Tmax 4.5
Change
Tmin 4.5
Tmax 8.5Tmin 8.5Change
Tmax 8.5
Change
Tmin 8.5
Baseline
1986–2005
30.621.0NANANANANANA
2010–201931.022.00.40.930.722.10.11.1
2020–202932.022.01.41.031.122.20.51.1
2030–203932.122.01.50.931.522.20.91.2
2040–204931.522.00.90.931.722.31.11.2
2050–205931.722.01.00.932.322.31.61.3
2060–206931.622.01.00.932.922.32.31.3
Table 2. Inter-decadal changes in monthly precipitation (mm) compared to the baseline period 1986–2005.
StatisticBaseline
1986–2005
2010–20192020–20292030–20392040–20492050–20592060–2069
Mean268.7235.5226.8227.0234.2237.8234.2
Median218.6230.8223.4223.4235.4239.0233.1
Maximum719256.3258.6255.3252.1251.9245.1
Minimum5.4213.8216.4201.5213.3219.0225.4
Std. Dev.249.715.812.116.712.311.96.7
Table 3. Land-use change in Halda River Basin between 2000 and 2010, and the area projected for each land-use category for the 2020s, 2040s and 2060s.
20002010Change2020s2040s2060s
Land Type(km2)(km2)(%)(km2)(km2)(km2)
Artificial surfaces *64.510664.2136.4175.3197.6
Cultivated land311.3273.7−12.1242.9203.9181.5
Forest175.6174.1−0.9174.1173.8173.8
Grass16.114.1−12.814.61515
Waterbody 0.60.4−38.70.40.40.4
* Artificial surfaces include residential, commercial and industrial zones.
Table 4. Simulated annual and seasonal changes in streamflow across the Halda River Basin for the future periods (2020s, 2040s and 2060s) under RCP 4.5 and 8.5 scenarios. Two simulations were run, one considering climate change only and a second considering climate and projected land cover changes. Values for streamflow and the ratio are presented in m3/sec and as medians of the five climate models. Here ± denotes standard deviation. Values for streamflow associated with changes in land-use only were then calculated as the ratio of the CC to CC/LULC simulations.
ReferenceStreamflow (m3/s)Baseline2020s (4.5)2040s (4.5)2060s (4.5)2020s (8.5)2040s (8.5)2060s (8.5)
Baseline
Annual562 (±119)
Wet Season400 (±17)
Dry Season47 (±13)
Climate change simulation
Annual 596 (±43)620 (±38)674 (±37)673 (±50)659 (±46)643 (±45)
Wet Season 355 (±11)349 (±10)367 (±9)365 (±11)358 (±10)349 (±9)
Dry Season 103 (±14)101 (±14)110 (±15)105 (±14)103 (±16)98 (±16)
Climate & Land-use change simulation
Annual 544 (±21)639 (±58)641 (±59)633 (±66)647 (±58)654 (±50)
Wet Season 360 (±10)353 (±10)360 (±9)371 (±11)356 (±9)348 (±10)
Dry Season 103 (±14)101 (±14)105 (±16)105 (±14)103 (±16)98 (±16)
Land-use simulationAnnual 1.10.971.051.061.020.98
Wet Season 0.990.991.010.9811
Dry Season 111.04111
Publisher’s Note: MDPI stays neutral with regard to jurisdictional claims in published maps and institutional affiliations.

