Article

Effects of Different Ingredients and Stabilisers on Properties of Mixes Based on Almond Drink for Vegan Ice Cream Production

Department of Food Engineering and Process Management, Insitute of Food Sciences, Warsaw University of Life Sciences (WULS-SGGW), Nowoursynowska 159C, 02-776 Warsaw, Poland
*
Author to whom correspondence should be addressed.
Sustainability 2021, 13(21), 12113; https://doi.org/10.3390/su132112113
Submission received: 30 September 2021 / Revised: 28 October 2021 / Accepted: 28 October 2021 / Published: 2 November 2021
(This article belongs to the Special Issue Innovative Food Science and Sustainable Process Management)

Abstract

:
A plant-based diet is beneficial not only to human health but also for environmental sustainability. As consumers, we play a vital role in balancing hedonic consumption with long-term sustainable behaviours, such as reduced animal products consumption. As a result of the changeable trend in the food industry, there are considerably more requirements for food manufacturers. This study aimed to determine the influence of different ingredients and selected stabilisers (iota carrageenan and its acid and enzymatic hydrolysates) on the physicochemical properties of ice-cream mixes. The effect of maturation during 24 h on the selected properties was also observed. The particle size distribution, stability, density, viscosity and morphology after preparation and after 24 h of maturation at the temperature of 4 °C were tested. Finally, it was found that the addition of stabilisers and the homogenisation process caused a decrease in the particle size diameter and they contributed to the obtained higher value of viscosity in comparison to samples without stabilisers. Moreover, the use of stabilisers and the homogenisation process negatively affected the stability of the ice-cream mix due to the fact that the stability rate (TSI) was about 6.0. The data provided by this paper are valuable for intensifying the potential application of vegan ice cream. Additionally, this product may be useful to reduce agricultural waste and for fundamental product development as an alternative beneficial food product in the close future.

1. Introduction

Food is essential for life, but it also causes an extensive impact on the environment. Having been increasingly industrialised and globalised, the food industry has faced a plethora of challenges. For instance, feeding the increasing population and simultaneously reducing environmental impacts, such as greenhouse gas or climate change. It was estimated that the food sector contributes to 26% of global greenhouse gas emissions. Therefore, finding sustainable alternatives is crucial to alleviate the associated environmental footprint [1,2,3]. The intake of animal products in our diet is the most significant factor which determines the footprint of worldwide food consumption, and the most effective approach to reducing “dietary emissions” is to decrease the consumption of animal products [2]. In this sense, a lifestyle based on pro-environmental behaviours enables consumers to adhere to a plant-based diet. Consequently, in the close future, such a global move toward changing our eating habits will be extremely beneficial for the environment [4]. Not only is a shift to a plant-based diet necessary to counteract the detrimental climate change but also it has been shown to deliver health benefits. For instance, shifting away from a meat-based diet would lead to lowering both cholesterol levels and blood pressure or balancing blood sugar, even reducing the risk of developing certain cancers. Additionally, the reduced intake of animal proteins can be driven by consumer dietary restrictions such as, for example, a cow milk allergy or lactose intolerance. Factors such as allergies for animal products or ethical choices (vegan, vegetarian or flexitarian), have tempted people and the food industry to scrutinise the idea of a plant-based diet and look for some alternatives in daily life [4,5,6].
It is widely acknowledged that ice cream is made and also eaten in almost every country. By means of their remarkable organoleptic properties, it stands out with tremendous popularity among society [7]. In ice cream-making, the first step is to blend the liquid and solid ingredients in the appropriate order, obtaining a liquid called ice-cream mix. In turn, the physicochemical and organoleptic properties of ice cream are determined by the relevant quality of the ice-cream mix; it is absolutely vital to select the best ingredients and focus on the properties of the ice-cream mix [7,8]. Ice-cream mix can be defined as hydrocolloidal dispersion, in which proteins and polysaccharides in concentrations over the phase separation threshold, create a two-aqueous system, according to the thermodynamic incompatibility [8,9,10].
Out of the numerous plant drinks, almond drink was typed to present research to preparing ice-cream mix. Firstly, the almond drink has become one of the most popular plant-based alternatives. Nonetheless, the various health benefits that are involved in the consumption of almonds are also the key factors that help boost the demands of consumers for an almond drink. It is medically proven that almond has a relatively high number of phytochemicals (including phenolic acids and phytosterols), polyphenolic compounds (flavonoids and pro-anthocyanidins), vitamin E, monounsaturated and polyunsaturated fatty acids, potassium and arginine. Because of this beneficial nutrient profile, almond has antioxidant and anti-inflammatory properties and it can reduce cardiovascular disease risk. Moreover, almond drink has advantages in a balanced diet, including preparing the low-calorie meals and unique taste [11,12].
Moreover, in the presented study, inulin was used as an ingredient to prepare a vegan ice-cream mix. Inulin can be used in ice cream production as a prebiotic, sugar or fat replacer and texture modifier. Inulin intake could be beneficial for human health. It can increase mineral absorption and promotes the growth of the micro-flora digestive tract. As an ingredient, it can be used to prepare low-caloric food for diabetics to control their blood sugar levels [13,14]. As a substitution for milk in powder, pea protein is used. It is emerging as an alternative to conventional products which are derived from animal proteins, one which is known as a nutritional ingredient in the food industry owing to its emulsifying and gelation properties or its hypoallergenic attributes. The protein fractions which were found in this pea protein are albumins, globulins and other minor fractions, such as prolamins and glutelins [15,16].
Stabilisers are a group of ingredients that are able to increase viscosity and stability during temperature fluctuations, improve texture or reduce the rate of meltdown and slow down moisture migration out of ice cream during storage. Moreover, they may control the incorporation of air in the factory freezer and help produce a stable foam [17]. The most common stabilisers in the ice cream industry are carrageenans. These are naturally occurring carbohydrate polymers. Chemically, they are made up of d-galactose and 3,6-anhydro-d-galactose units which are bonded together with α-1,3 and β-1,4 linkages in attendance of sulphate groups. Depending on the number and position of sulphate esters, three forms of carrageenan were mentioned: kappa, iota and lambda [18,19,20,21]. Iota carrageenan contains two sulphate groups per unit. Moreover, it has the ability to form a soft elastic gel in the presence of calcium ions [18,19,22]. In this paper, the acid and enzymatic hydrolysates of iota carrageenan were used as an alternative stabiliser instead of iota carrageenan. According to the satisfactory results of hydrolysis of kappa-carrageenan concerning the size of ice crystals of ice cream, described by Kamińska-Dwórznicka et al. [23,24] we decided to check the effectiveness of the hydrolysates of iota carrageenan in creating structure in the initial step of production of ice cream—ice-cream mix preparation.
In considering the significance of the influence of different ingredients and stabilisers in preparing ice-cream mix, in this research, the vegan ice-cream mix with the different sorts of stabilisers was scrutinised. Moreover, the physical properties analysis was conducted before and after the homogenisation process and 24 h after the maturation of the ice-cream mix.

2. Materials and Methods

2.1. Hydrolysates Preparation

Iota carrageenan powder samples were obtained from Sigma-Aldrich. The enzymes for enzymatic hydrolysis were: β-galactosidase (1000 U/mg, from Escherichia coli), soluble in glycerol and TRIS buffer (pH 7.4), which was obtained from Sigma-Aldrich, St. Louis, MI, USA and commercial lactase from Serowar s.c. Szczecin. For acid hydrolysis, 0.1 M hydrochloric acid and 0.1 M sodium hydroxide obtained from Chempur were used.
For enzymatic hydrolysis iota carrageenan was first dissolved in distilled water to obtain a 0.4 mg/mL solution and heated up to 40 °C. This hydrolysis was carried out using two different enzymes. The first one was β-galactosidase. It was conducted for 72 h at 37 °C and then the sample was neutralised at 48 °C for 5 min, cooled to stop any further reactions (Sigma-Aldrich—Product Information; [24]). After repeating the solution of iota carrageenan, the second enzyme was used—commercial lactase (1 mL/1 L solution; 1 drop/50 mL solution). It was conducted for 24 h, at 5 °C. then the sample was neutralised at 48 °C for 5 min, cooled in order to stop any further reactions (Serowar—Product Information). For both treatments samples were stored frozen at −18 °C and thawed just before analysis.
For acid hydrolysis (using 0.1 M hydrochloric acid) iota carrageenan was first dissolved in distilled water to obtain a 10 mg/mL solution and heated up to 40 °C. Samples after 3 h of hydrolysis were taken, then neutralised and cooled. Finally, samples were stored frozen at −18 °C and thawed before analysis [23].

2.2. Ice Crem Mixes

2.2.1. Materials for Use for Different Ice-Cream Mix Recipes

Vegan ice-cream mixes were prepared using: the roasted almond original (Enerbio, Rossmann, Hanover, Germany), almond syrup (Monin, Bourges, France), inulin (Orafti BENEO, Tienen, Belgium), pea protein (Nutralys S85 plus-, Roquette, Lestrem, France), emulsifier E471 (Fooding Shanghai, Shanghai, China), LBG-Locust Bean Gum (Fooding Shanghai, Shanghai, China), xanthan gum (Fooding Shanghai, Shanghai, China), iota carrageenan (Fluka, Sigma-Aldrich, St. Louis, MI, USA) or new obtained stabilisers: the hydrolysates of ɩ-carrageenan after acid hydrolysis, after enzymatic hydrolysis by β-galactosidase and after enzymatic hydrolysis by lactase. The characteristics of samples are described in Table 1.

2.2.2. The Ice-Cream Mix Production

All ingredients were weighed separately with a fixed recipe. Then dry components were mixed with the liquid ones, using Bosch MaxoMixx 750 W blender (Bosch, Gerlingen, Germany). For the pasteurisation process in the ice-cream mix, Vorwerk thermomixer was used at the temperature of 85 °C per 1.5 min. Afterwards, it was cooled to a temperature of 25 °C. Then the homogenisation was made using the homogeniser IKA T 25 digital ULTRA-TURRAX 20 rpm (IKA®-Werke GmbH & Co. KG, Staufen, Germany) through 2.5 min.

2.3. Ice-Cream Mix Properties Analysis

2.3.1. Density

Density is carried out using a glass pycnometer at ambient temperature. The pycnometer was weighed on an analytical weight with an accuracy of 0.1 g. Then it was filled with ice-cream mix and capped tightly and weighed on an analytical weight with an accuracy of 0.1 g. The mass of ice-cream mix was calculated from the mass difference, using the formula:
d = m v
where, d—density of ice cream (g/cm3), m—the weight of ice cream (g), v—the volume of ice cream (cm3), according to the method [25]. The density of the ice-cream mix was conducted before and after the ageing stage (24 h).

2.3.2. Particle Size Distribution

A laser diffraction instrument Cilas 1190 (Cilas, Orléans, France) was used to determine the particle size of the ice-cream mix. The emulsions were suspended in water at the obscuration of 10%. The results were presented as particle size distribution diagrams and expressed as the median diameter D50. This analysis of the ice-cream mix was conducted before and after the ice cream maturation (24 h).

2.3.3. Emulsion Stability Evaluation

Measurements of stability were conducted using a Turbiscan Lab Expert (Formulation SA, Toulouse, France). The date of backscattered (BS) light recorded during measurements was processed using Turbisoft 2.0.0.33 software, which allowed us to compare the stability based on the so-called Turbiscan Stability Index (TSI). This analysis of the ice-cream mix was conducted before and after the ice cream maturation (24 h).

2.3.4. Rheological Properties

Rheological measurements of different ice-cream mix samples and after ageing (24 h) were conducted using a Haake Mars 40 rheometer (Thermo Scientific Inc., Karlsruhe, Germany) equipped with a TM-PE-C temperature module controller. The measurements were carried out with a CCB/CC25 DIN/Ti concentric cylinder geometry (gap size 5.3 mm) within the shear rate of 0–100 s−1 at a constant temperature of 25 °C. All measurements were performed in triplicate for each kind of ice-cream mix. The data obtained from RheoWin v.4.86. Job Manager (Thermo Scientific, Karlsruhe, Germany) were plotted with apparent viscosity (ηapp) as a function of shear rate ( γ ˙ ) in the semi-logarithmic scale (the viscosity curves). The flow behaviour was also analysed and obtained data were fitted to the following models:
Bingham:
η a p p = η p + τ 0 γ ˙ 1
Ostwald de Waele:
η a p p = K γ ˙ n 1
Herschel–Bulkley:
η a p p = τ 0 γ ˙ 1 + K γ ˙ n 1
where, ηapp—the apparent viscosity (Pa s), γ ˙ —the shear rate (s−1), ηp—the plastic viscosity (Pa s), τ0—yield stress (Pa), K—the consistency index (Pa sn), n—flow behaviour index (dimensionless).
The adequacy of fitted models was estimated using the regression analysis which delivered the values of a correlation coefficient (R) and a chi-square (χ2).

2.3.5. Microstructural Analysis of Ice-Cream Mix

Ice crystal mix was analysed based on the images taken before and after 24 h of maturation at 4 °C. The first step of this determination was sampling. A small amount of ice-cream mix was put on the slide using a spatula and covered by a slip glass. The images were taken using the Olympus BX 43F microscope and camera Olympus CAM-SC 50 (Olympus, Tokyo, Japan). This analysis of the ice-cream mix was conducted before and after the ice cream maturation (24 h).

2.3.6. Statistical Analysis

The analysis of variance (ANOVA) was performed using STATISTICA 13 software. The significance of the test was set on α = 0.05. Data are expressed as a mean with standard deviation (±SD) and the differences between groups were evaluated using the Tukey HSD test.

3. Results and Discussion

3.1. The Density of Ice-Cream Mix

Table 2 show the influence of stabilisers and the homogenisation process on the density of ice-cream mixes. Overall, the density of the ice-cream mixes varies with composition and it can be changed by the variable amount of ingredients [26,27]. Additionally, the increasing density of the ice-cream mix is not a desirable factor, due to the fact that it could have a detrimental influence on the overrun of ice cream [28].
In the presented study the density before the maturation ranged from 0.92 to 1.09 g/cm3 (Table 1 and Table 2). The statistical appraisal showed that significant differences in density were observed between samples with different stabilisers before the maturation. The lowest value of density was noticed for the sample LH (ice-cream mix with the addition of enzymatic (lactase treatment) hydrolysates of iota carrageenan). However, the highest value of density was obtained by sample with the addition of iota carrageenan without homogenisation treatment IWH. The difference between samples indicates that the stabilisers and the homogenisation influence density of ice-cream mixes. After the maturation, the density of ice-cream mix varied from 0.97 to 1.09 g/cm3 but there were no statistically significant differences in this parameter among analysed samples. The results indicate that the maturation stage contributes to obtaining the stability of ice-cream mixes (Table 1). According to the study of Warren and Hartel [29], the density of commercial ice-cream mix was reported from 1070 to 1160 kg/m3. These values are similar to the density which was found in our study. Additionally, in a study conducted by Alves et al. [30], the density of non-dairy ice-cream mixes was observed at approximately the same level as in our study, between 1096.51 to 1122.85 g/L.

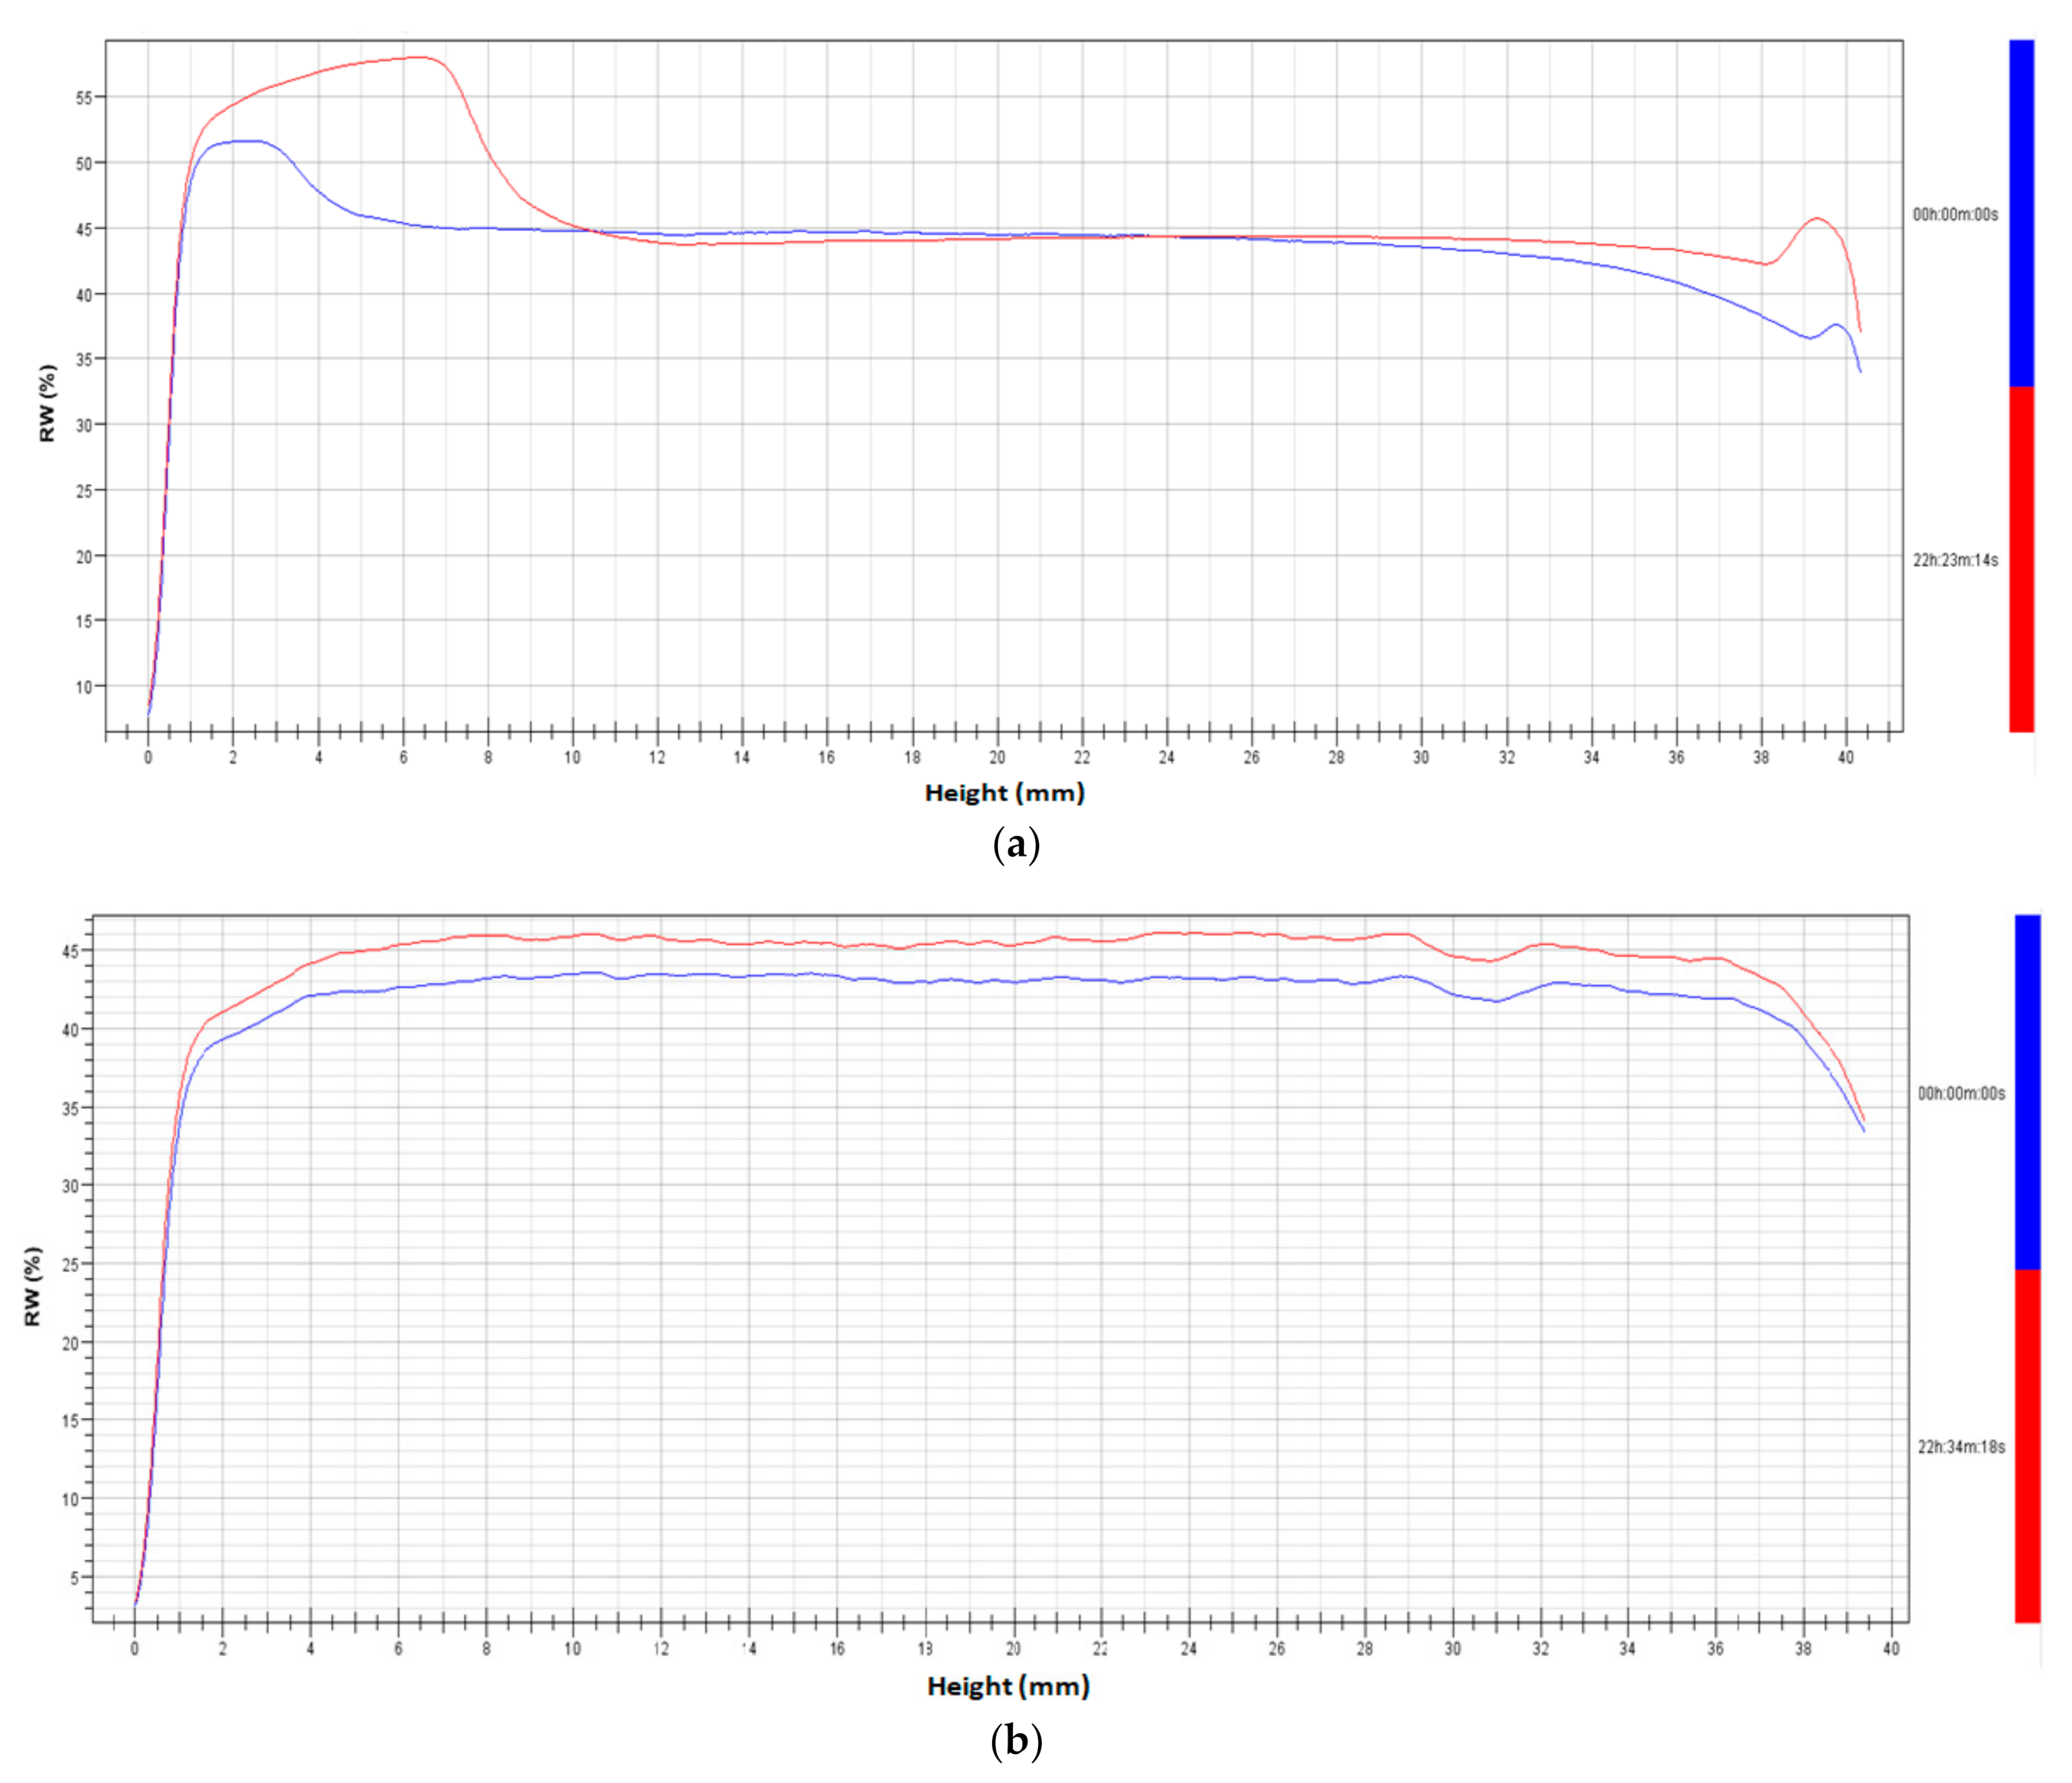
3.2. The Stability of Ice-Cream Mix

Ice-cream mix is a multiphase product and when ice cream contains fat it can be treated as an oil-in-water emulsion. In this sense, describing the physical properties of ice cream bases, it is necessary to investigate such factors as stability and particle size distribution. Additionally, the stability of the emulsion refers to resisting the undesirable changes during the storage time (for example sedimentation or coalescence) [31]. In the presented study, the stability of ice-cream mixes was scrutinised using the turbidimetric method. This method contributed to collecting information about the profile of emulsion and ongoing changes which are not visible to the human eye. The destabilisation of emulsion often occurs due to particle size increase (coalescence), particle aggregation (flocculation) or particle migration (creaming and sedimentation) [32]. The results of the stability of ice-cream mixes were expressed as the TSI factor values (Turbiscan Stability Index) in Table 3 and as the Back Scattering (Figure 1a,b).
Based on the presented results it was noticed that the homogenisation treatment had a significant influence on the stability of ice-cream mixes. TSI value of samples without homogenisation treatment achieved the lowest value and at the same, the highest stability. In those groups of samples without homogenisation treatment, the ice-cream mix with the addition of enzymatic (lactase treatment) hydrolysates of iota carrageenan (LWH) had the lowest TSI 1.7 (Table 3). The highest TSI value (the lowest stability) was observed for the sample with the addition of enzymatic (β-galactosidase treatment) hydrolysates of iota carrageenan BWH (3.6). The sample IWH and AWH had the TSI value close to the control sample (CWH), around two.
In comparison to samples after homogenisation treatment, deterioration was observed. The TSI value was recorded from 3 to 6.5 (Table 1 and Table 3). The lowest value of TSI was recorded for the control sample (CH– at 3 value) while in the sample with the addition of stabilisers, the highest destabilisation has occurred. The sample with mentioned stabilisers, BH, AH and LH, had the highest destabilisation; TSI was noticed in order at 6.5, 6.4 and 5.2 values. Moreover, for sample AH (with the addition of acid hydrolysates of iota carrageenan) the highest increase in TSI value was recorded compared to the same sample (with the same stabilisers-AWH) but without the homogenisation treatment.
As a result of BS% (Back Scattering), the ice-cream mixes (with the addition of stabilisers and no matter of homogenisation treatment) were prone to coalescence during the 24 h of maturation (Figure 1a,b). This destabilisation was caused by decreasing the size of particles. Additionally, this dependence was confirmed by the particle size distribution in the presented research (Table 4). On the other hand in the control sample (CWH and CH), despite homogenisation treatment, a different sort of destabilisation was noticed. Based on the results of Back Scattering, it was pointed out that the creaming occurred on the top of the test vial, while sedimentation occurred at the bottom of the vial (Figure 1a). This process was explained as the moving of particles in ice-cream mixes. Presumably, the lack of stabilisers in this control recipe of ice-cream mix contributed to the additional space between particles and a different relationship could be observed. Nonetheless, in a study by Voronin et al. [17] the disability of milk ice-cream mixes was noticed after the HPJ technology. Most samples were similarly stable to creaming and, additionally, rapid separation was seen. The authors hypothesised that the separation in samples was due to the presence of particles with air that was less dense than the serum phase. Moreover, the ability of samples in direction to the creaming was occurred by partially coalesced fat [17]. Then in research conducted by Cheng et al. [33] destabilisation was also observed in ice-cream mix model solutions. In this research, the interaction of polysaccharides with milk protein was studied as a result of the destabilisation of the emulsion system. It was indicated that the stability of the ice cream model emulsion depends on the types and concentrations of polysaccharides. For instance, carboxymethylcellulose may effectively be used to delay phase separation than guar gum [33]. In our study, the differences between the stabilisation of emulsion in using stabilisers were noticed. However, the homogenisation process significantly contributed to the decreasing stability of ice-cream mixes. Therefore, in all probability, the air bubbles may be the reason for such phenomena, as the researchers noticed in the study by Voronin et al. [17]. Additionally, Keeney [34] established that a certain amount of fat destabilisation is necessary to obtain good properties of the texture of ice cream. Moreover, the study conducted by Berger and White [35] and Berger et al. [36] proved that such destabilisation influences the properties of ice cream concerning creamy mouthfeel or meltdown behaviour [37].

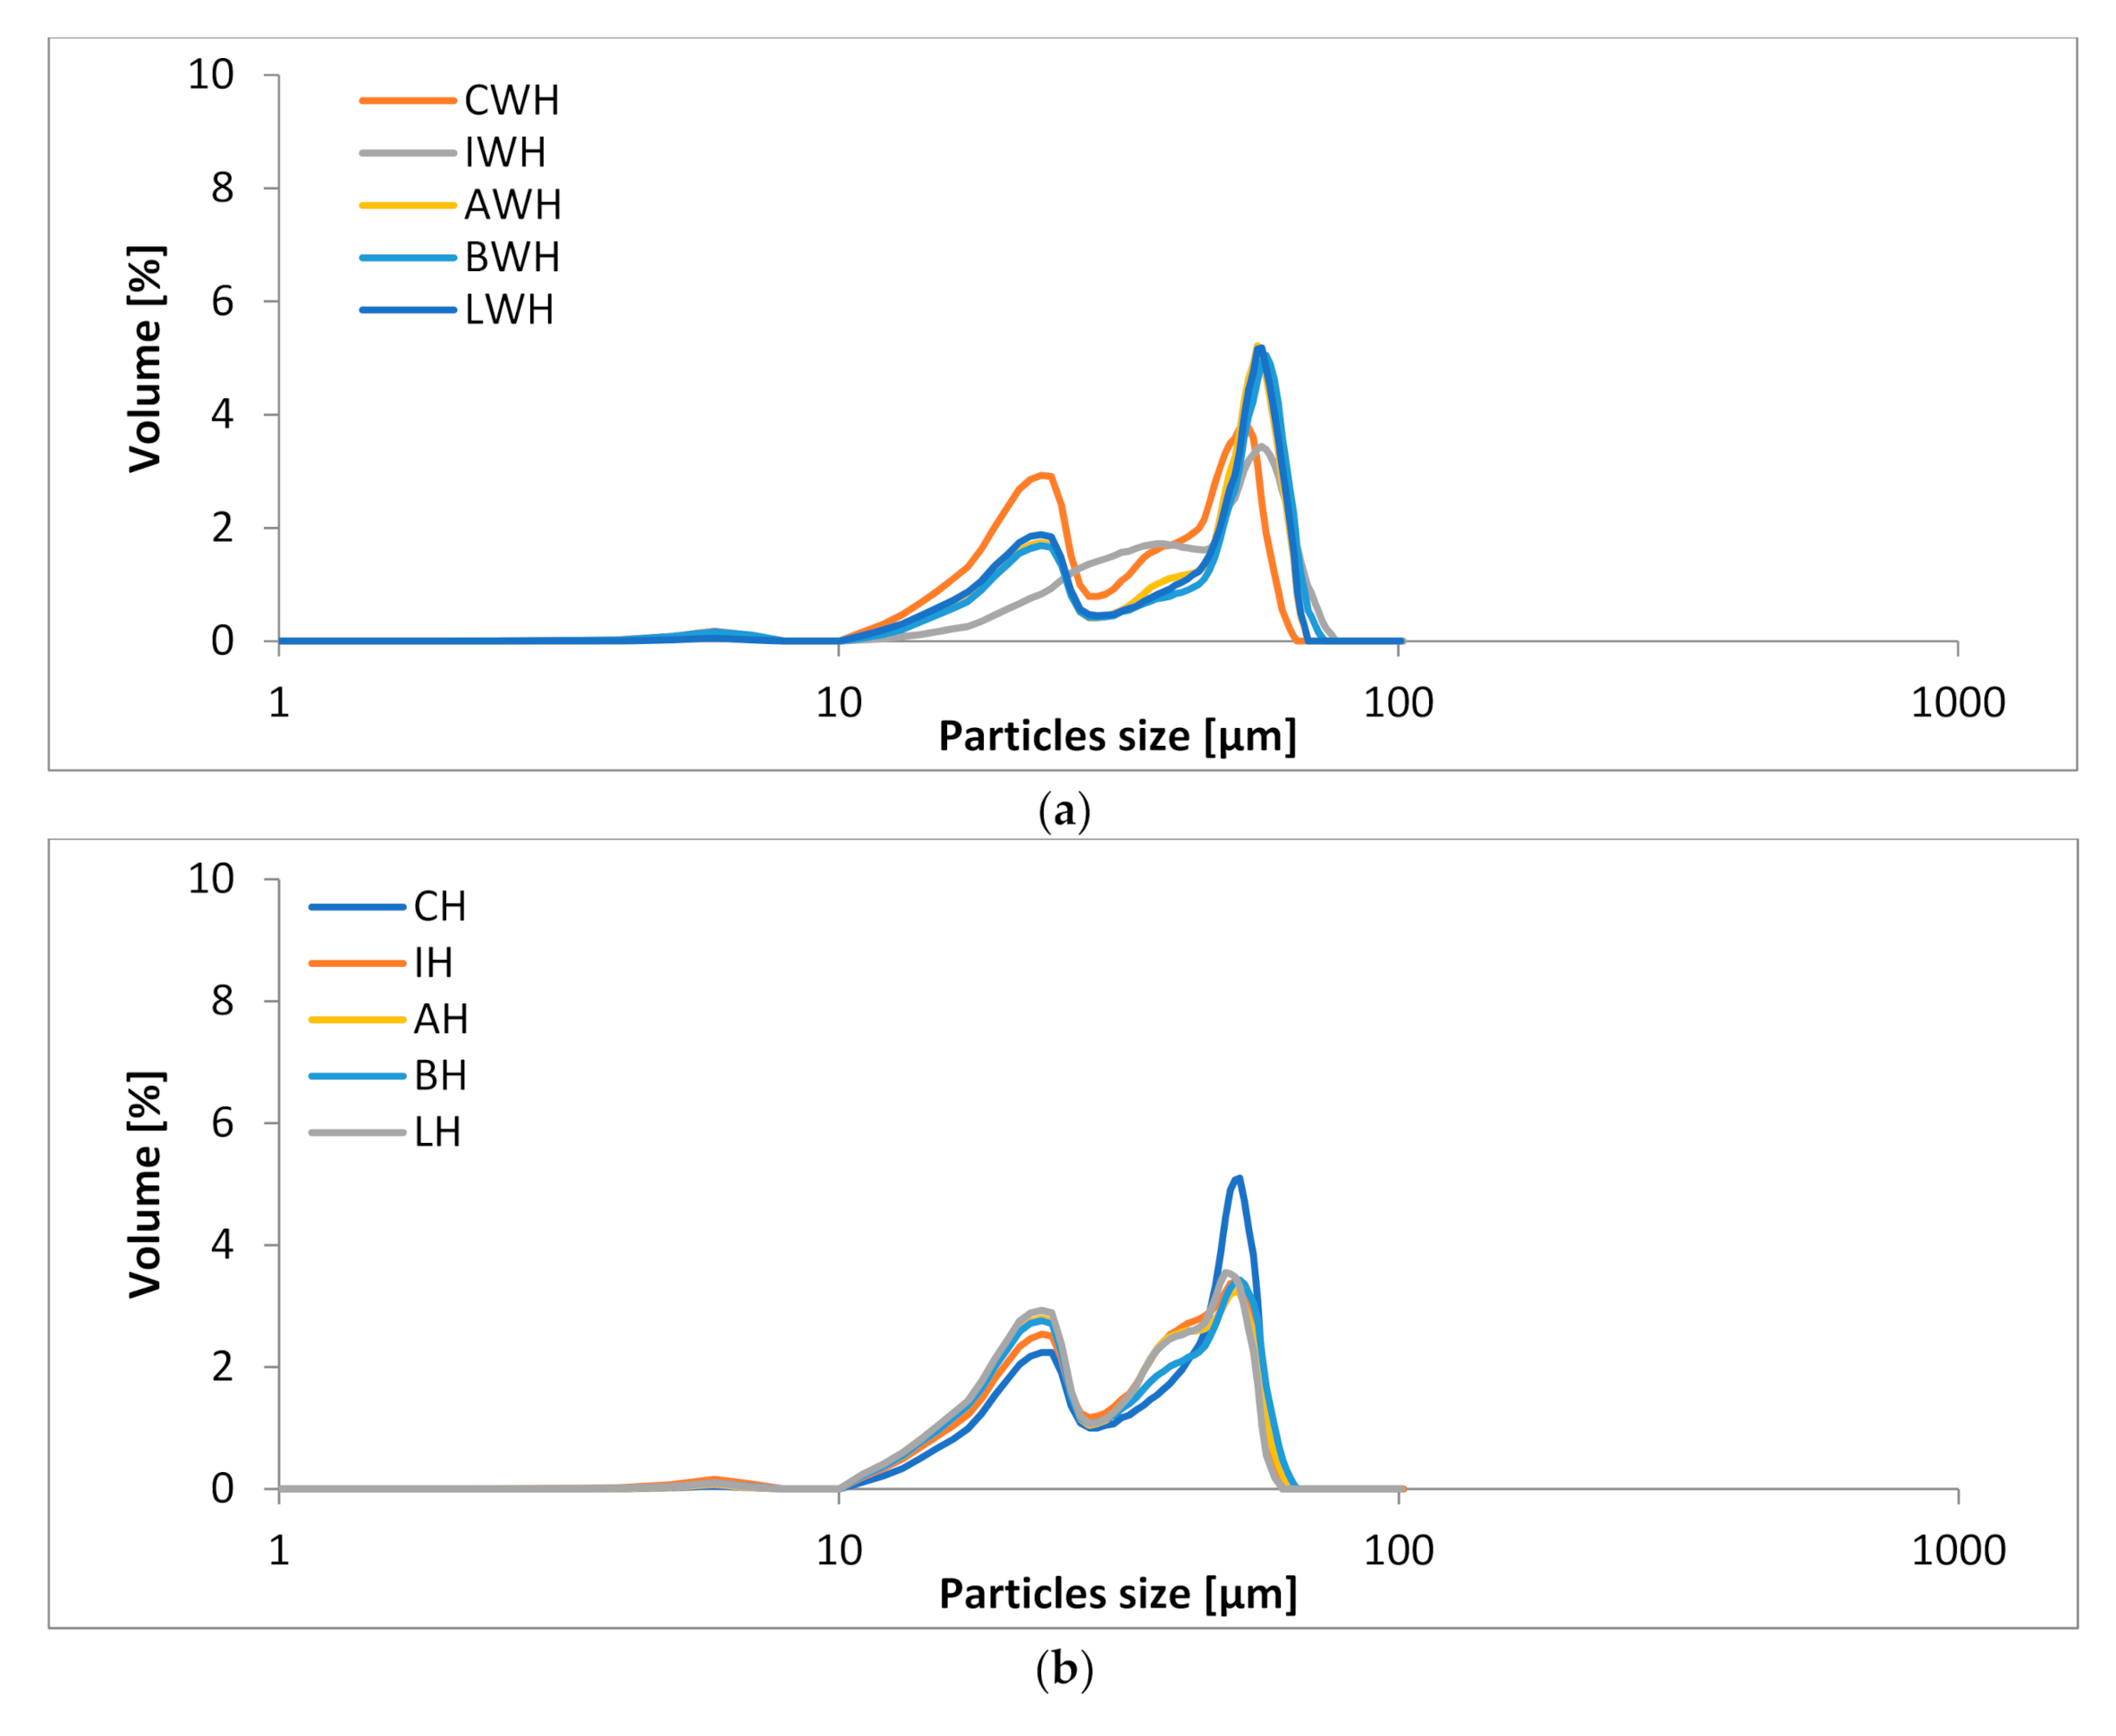
3.3. The Particle Sizes of Ice-Cream Mixes

The particle size of the dispersed phase is influential on the stability of the emulsion, according to Stoke’s law. As a result, the higher stability is connected with the smaller size of particles, along with being homogenously distributed [31]. Additionally, the size of particles would have the beneficial or detrimental influence of creating the ice crystal structure in the final product.
The mean diameter was conducted before and after 24 h of maturation. The mean diameter D (4, 3) before 24 h of maturation ranged from 11.91 to 42.15 µm (Table 1 and Table 4). The lowest value of mean diameter (11.91 µm) was observed for the sample LH (with the addition of the enzymatic (lactase) hydrolysates of ɩ-carrageenan) after the homogenisation. For ice-cream mixes with the addition of ɩ-carrageenan (IH) and its other two hydrolysates (BH and AH) with the homogenisation treatment, the mean diameter was around 13 µm. To summarise, the samples with the addition of the hydrolysates of ɩ-carrageenan and after the homogenisation treatment had the lowest value of particle size. Innocente et al. [9], in their research on the impact of the pressure (mechanical) and high-pressure homogenisation process on the particle size distribution in ice-cream mixes for the production of milk ice cream, showed that mechanical homogenisation reduces the mean volume diameters of the particles of the dispersed phase compared to the non-homogenised mixture. Additionally, in a study by Biasutti et al. [38] on the effects of high-pressure homogenisation of ice-cream mixes, the sample which was treated by conventional homogenisation had the lowest value of particle size compared to the sample without homogenisation.
After the maturation, the value of D (4, 3) was observed from 6.33 to 28.50 µm (Table 1 and Table 4). The lowest value of mean diameter was observed for the samples AH, LH and BH (with the addition of hydrolysates of ɩ-carrageenan after the homogenisation treatment), the mean diameter was around 6 µm. In comparison to this value before maturation time, it was almost half of the reduction of particle size. The highest value of mean diameter was noticed for the sample with the ɩ-carrageenan and without the homogenisation treatment (IWH). Additionally, there was a visible increase in particle size in the control sample CWH. The statistical analysis resulted in significant differences between samples before and after the maturation time. Based on that, used stabilisers—but also the homogenisation treatment—influenced particle size in ice-cream mixes. Moreover, looking at the level of reduction of D (4, 3), the samples with the stabilisers (the hydrolysates of iota carrageenan addition) and without the homogenisation treatment significantly decreased the size of particles. For instance, the sample with the enzymatic (β-galactosidase) hydrolysates of ɩ-carrageenan reduced the mean diameter by almost 31 µm (Table 1 and Table 4). Similar results were observed for other hydrolysates of ɩ-carrageenan. However, for the sample with the addition of iota carrageenan, there was a non-significant reduction. Based on the literature, in the study by Kamińska-Dwórznicka et al. [23,24] on the influence of kappa-carrageenan and its hydrolysates on the recrystallisation process in ice model sucrose solution, better results of prohibition of excessive growth of ice crystals had the hydrolysates of carrageenan than pure carrageenan were proven. We can suppose that the addition of kappa-carrageenan was also active in the emulsion stage, which resulted in better ice crystal structure creation.
Considering the size of the particle, the particle size distribution of the ice-cream mix before and after the maturation was also analysed (Figure 2a–d). Before the maturation, all samples without homogenisation treatment had a double or trimodal particle size distribution (Figure 2a). However, after 24 h of maturation, in all mentioned ice-cream mixes the trimodal of particle size distribution was observed based on three characteristic peaks in the figure (Figure 2b). Only sample CWH (without the stabilisers) and AWH (with the addition of acid hydrolysates of iota carrageenan) did not change the sort of distribution of particles. Moreover, for samples with the homogenisation treatment more unification was noticed. Before the maturation, all samples had the double modal of size distribution (Figure 2c). Additionally, after the 24 h of maturation for all ice-cream mixes the same fourfold particle size of the distribution was also observed. The four peaks are pointed out in Figure 2d. The changes of the model of size distribution were confirmed by the value of D50 (Table 1 and Table 4), in which a significant reduction of particle size was observed. Innocente et al. [9] showed in their research that homogenised mixtures were characterised by a monomodal (single) particle size distribution, while the non-homogenised mixture was characterised by bimodal distribution. The homogenisation process made the particles uniform in size, therefore there is only one peak in the particle size distribution graphs of homogenised blends. Additionally, in a study by Voronin et al. [17], monomodal distribution was observed for the control sample of ice-cream mix and samples which were treated by HPJ. However, it was noticed that the sample with the addition of emulsifier had a bimodal distribution. Additionally in research conducted by Warren and Hartel [39] on the influence of emulsifiers on ice-cream mix and ice cream structure, bimodal and also trimodal distribution of particle size was observed, which may reflect enhanced partial coalescence of fat droplets in ice-cream mixes. Therefore, based on our results of RW%, the coalescence was also observed for ice-cream mixes. It may be concluded that this destabilisation of ice-cream mixes contributed to increasing diversity in the distribution of particle size.

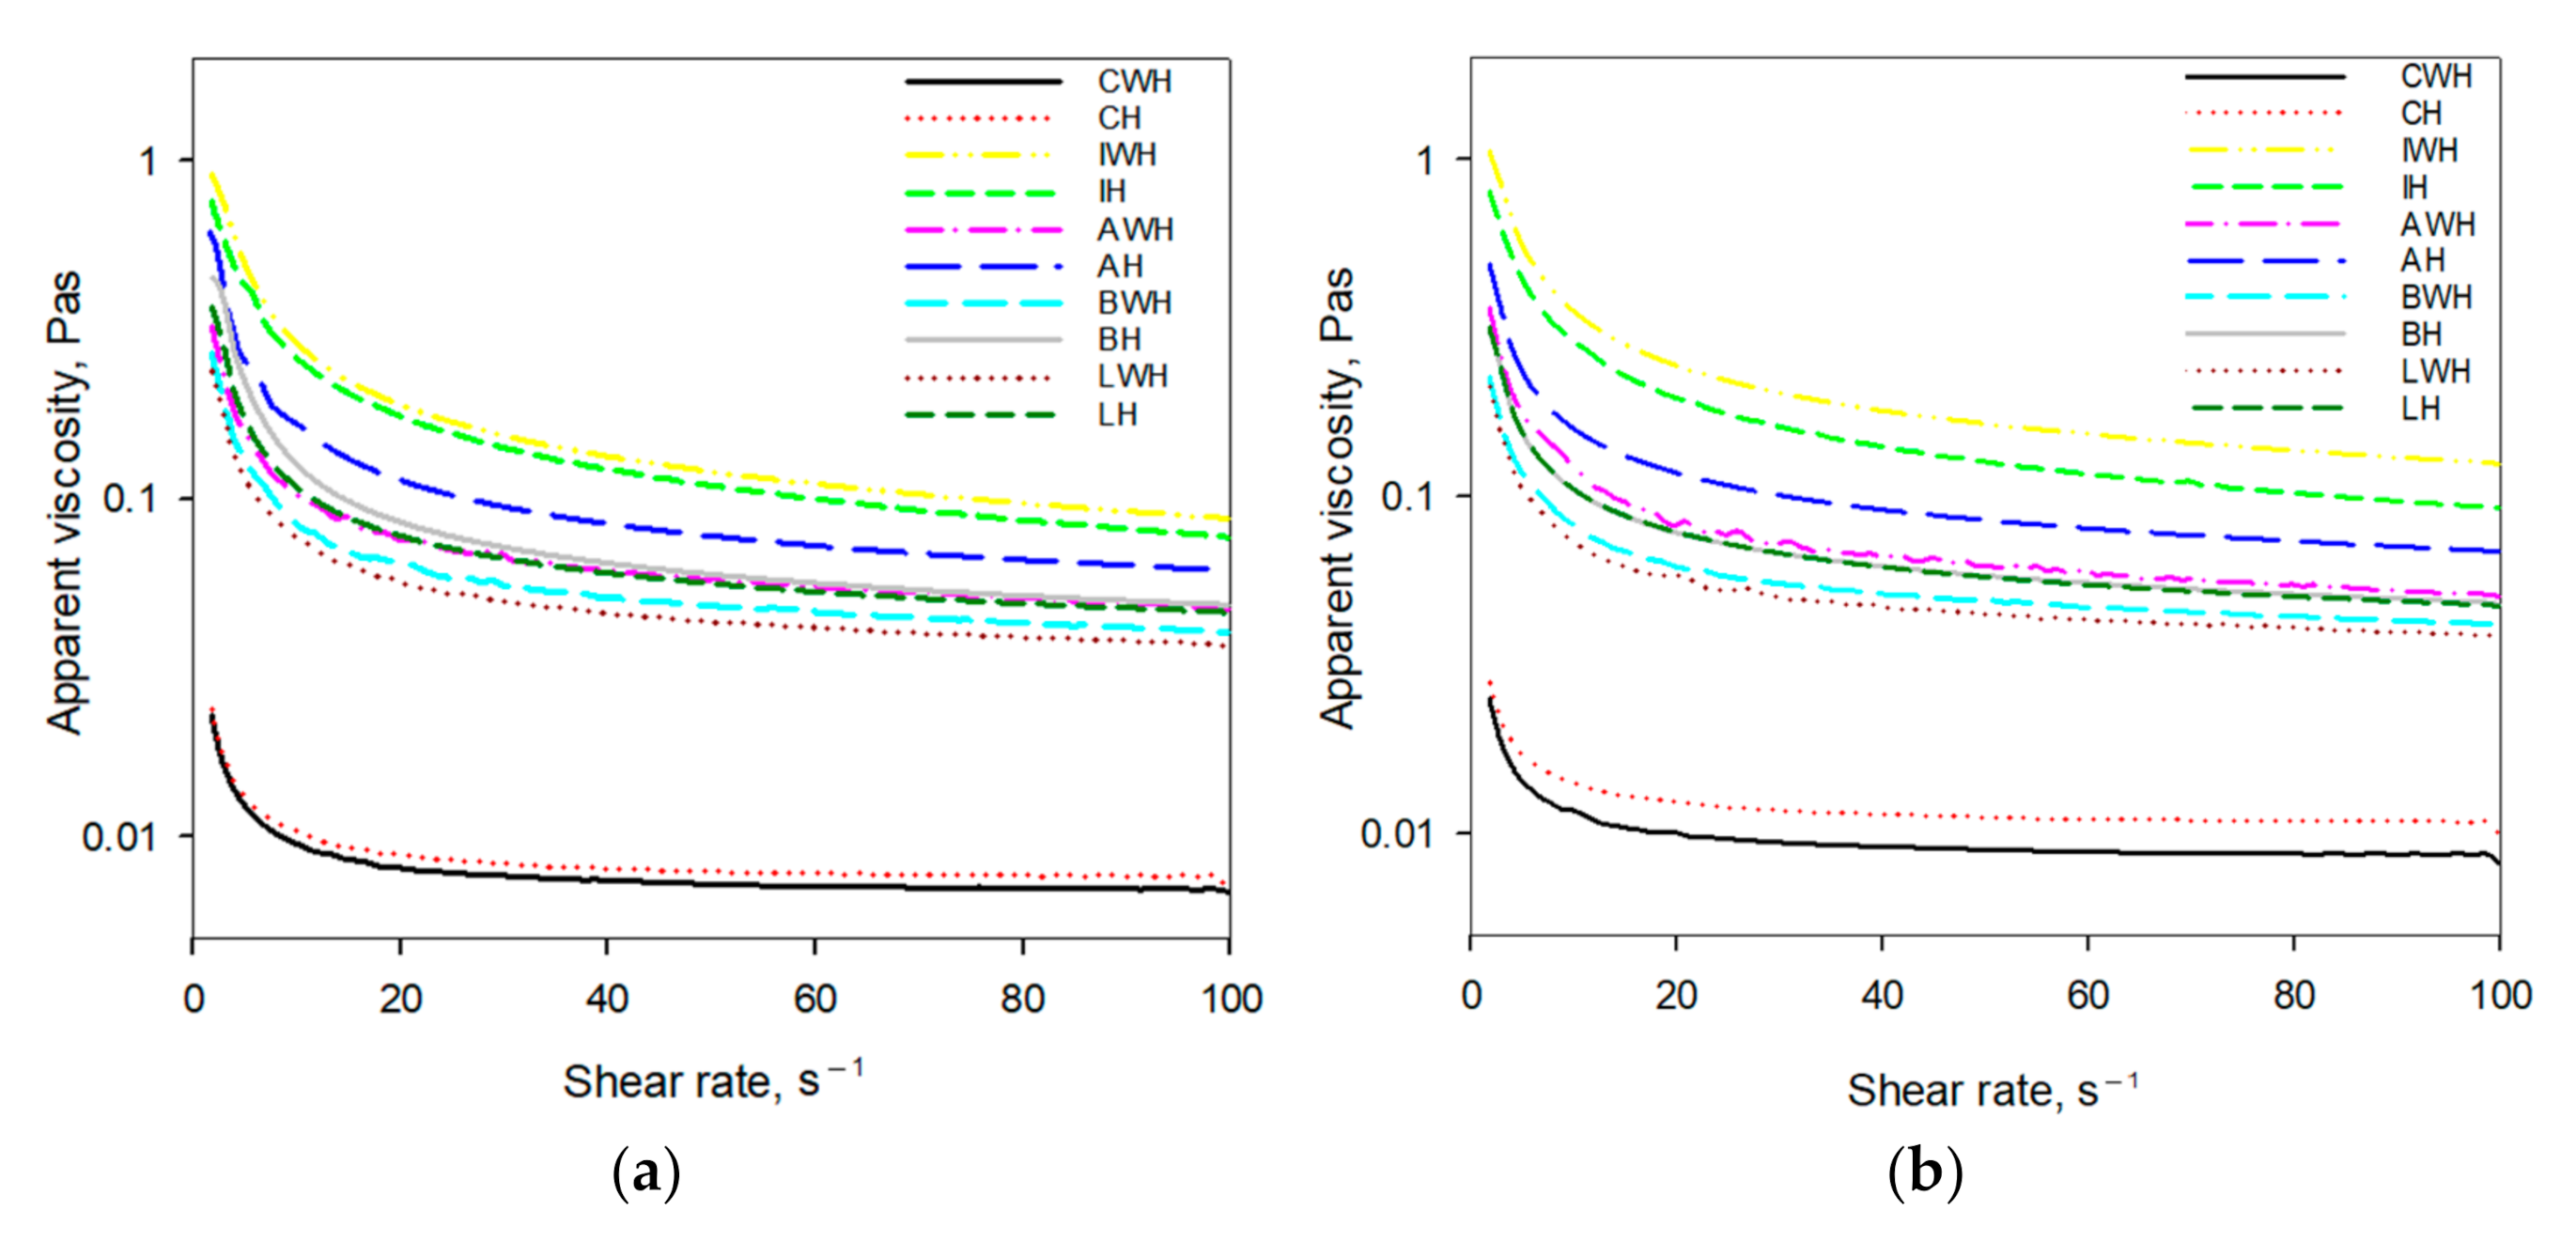
3.4. The Rheological Properties

The rheological properties refer to the flow behaviour and mouthfeel of ice cream. They are crucial in mechanical treatment of ice-cream mix such as stirring and flowing through pipelines and other technological equipment during continuous process [40]. The rheological behaviour of fluids can be described by different models using Newtonian, Bingham Plastic, Casson, Ostwald de Waele and Herschel–Bulkley equations. Rheological models present the mathematical description of the relation between the shear rate and shear stress or shear rate and apparent viscosity. The accuracy of fitting the rheological models to properties of ice-cream mix samples was carried out using a non-linear regression method. The model that best fit the rheological data was conducted by comparison of coefficients R and Chi-square. The best model should be described by the highest correlation coefficient (R) and the lowest values of Chi-square parameter (χ2). Table 5 and Table 6 show that R and χ2 parameters of the Herschel–Bulkley model fulfilled this requirement. The values of the correlation coefficient for this model ranged from 0.9984 to 1 and the chi-square parameter varied from 19.4 to 21,495.1, which can be considered to be satisfying for analysed ice-cream mix samples. Thus, the Herschel–Bulkley model was selected as adequate to characterise the rheological properties of all samples. This model was also applied to describe the flow behaviour of ice-cream mixes with different compositions [9,33,40,41,42].
Table 7 presents the estimated parameters of the Herschel–Bulkley model (τo, K, n). The values of the flow behaviour index n were lower than 1 (Table 1 and Table 7) and the apparent viscosity decreased as the shear rate increased (Figure 3). It indicates that all ice-cream mix samples showed non-Newtonian shear-thinning (pseudoplastic) behaviour. The smaller values of n indicate a departure from Newtonian behaviour and characterise the higher shear-thinning attitude as well as pseudoplasticity of materials [42]. The lowest flow behaviour index was observed for the IWH (0.633–0.653) and IH (0.742–0.757) ice-cream mix which may indicate the higher stability of the product during processing. Concerning the stability of ice-cream mixes, the samples IWH and IH also had a low TSI value (at 2.3 and 4.1) which contributed to better stability properties during the maturation time. Moreover, according to other described properties, for those mentioned samples, the increase in density and additionally the decrease in particle size was observed (Table 2 and Table 4). The higher shear thinning behaviour facilitates the pumping of mix and allows us to obtain a final product with desirable texture and mouthfeel properties [40,43]. Atalar et al. [44] observed that the addition of high-pressure homogenised hazelnut milk to ice-cream mix caused the decrease in n values and the higher shear thinning behaviour may lead to a reduction in energy consumption during the mixing of ice cream. The higher values of flow behaviour index (0.949–0.991) showed that ice-cream mixes without stabilisers (CWH, CH) were less pseudoplastic (Table 7). Morover, also based on the Back Scattering (Figure 1a,b) the different sorts of destabilisation were observed (creaming and sedimentation) compared to samples with the addition of stablisers. After maturation, the n values did not differ for the same type of ice-cream mix with exception of the BH sample where the low behaviour index was lower after 24 h of storage. Dogan and Kayacier [45] noticed that the flow behaviour index of the ice-cream mix decreased until 24 h of maturation and then it increased up to 42 h. The effect of homogenisation was not noticeable for many samples (Table 7). However, homogenised ice-cream mix LH and BH showed lower values of index n than samples without this treatment. The composition and type of stabiliser significantly affected the shear-thinning behaviour of mixes which can be related to different water-binding capacities of investigated stabilisers.
A significant increase in consistency K (Table 7) and apparent viscosity (Figure 3) was observed for samples after the addition of stabilisers. The ice-cream mix with iota carrageenan (IWH, IH) characterised the highest consistency index values (255.6–462.3 m Pa sn). It was noted that the consistency index of the vast majority of samples increased after 24 h of maturation, which is in agreement with results obtained by Dogan and Kayacier [45]. The increase in viscosity can be explained by better interaction between biopolymer molecules with water, lipids and proteins after ageing. The consistency index increased for the same samples (AH and LH) after homogenisation or remained at the same level (Table 7). Yield stress τo also increased with the addition of stabilisers (Table 7). Samples with iota carrageenan showed the highest values of yield stress (9410.8–1508.3 m Pa sn). Rao [46] concluded that the higher values of yield stress indicated the creation of firmer structures and more stable systems. The statistical analysis showed that yield stress did not differ after maturation but values of this parameter increased after homogenisation for most samples. The higher values of viscosity, consistency index and yield stress for IWH and IH cream mixes indicated that applied stabiliser can be a good candidate to obtain the stable product.

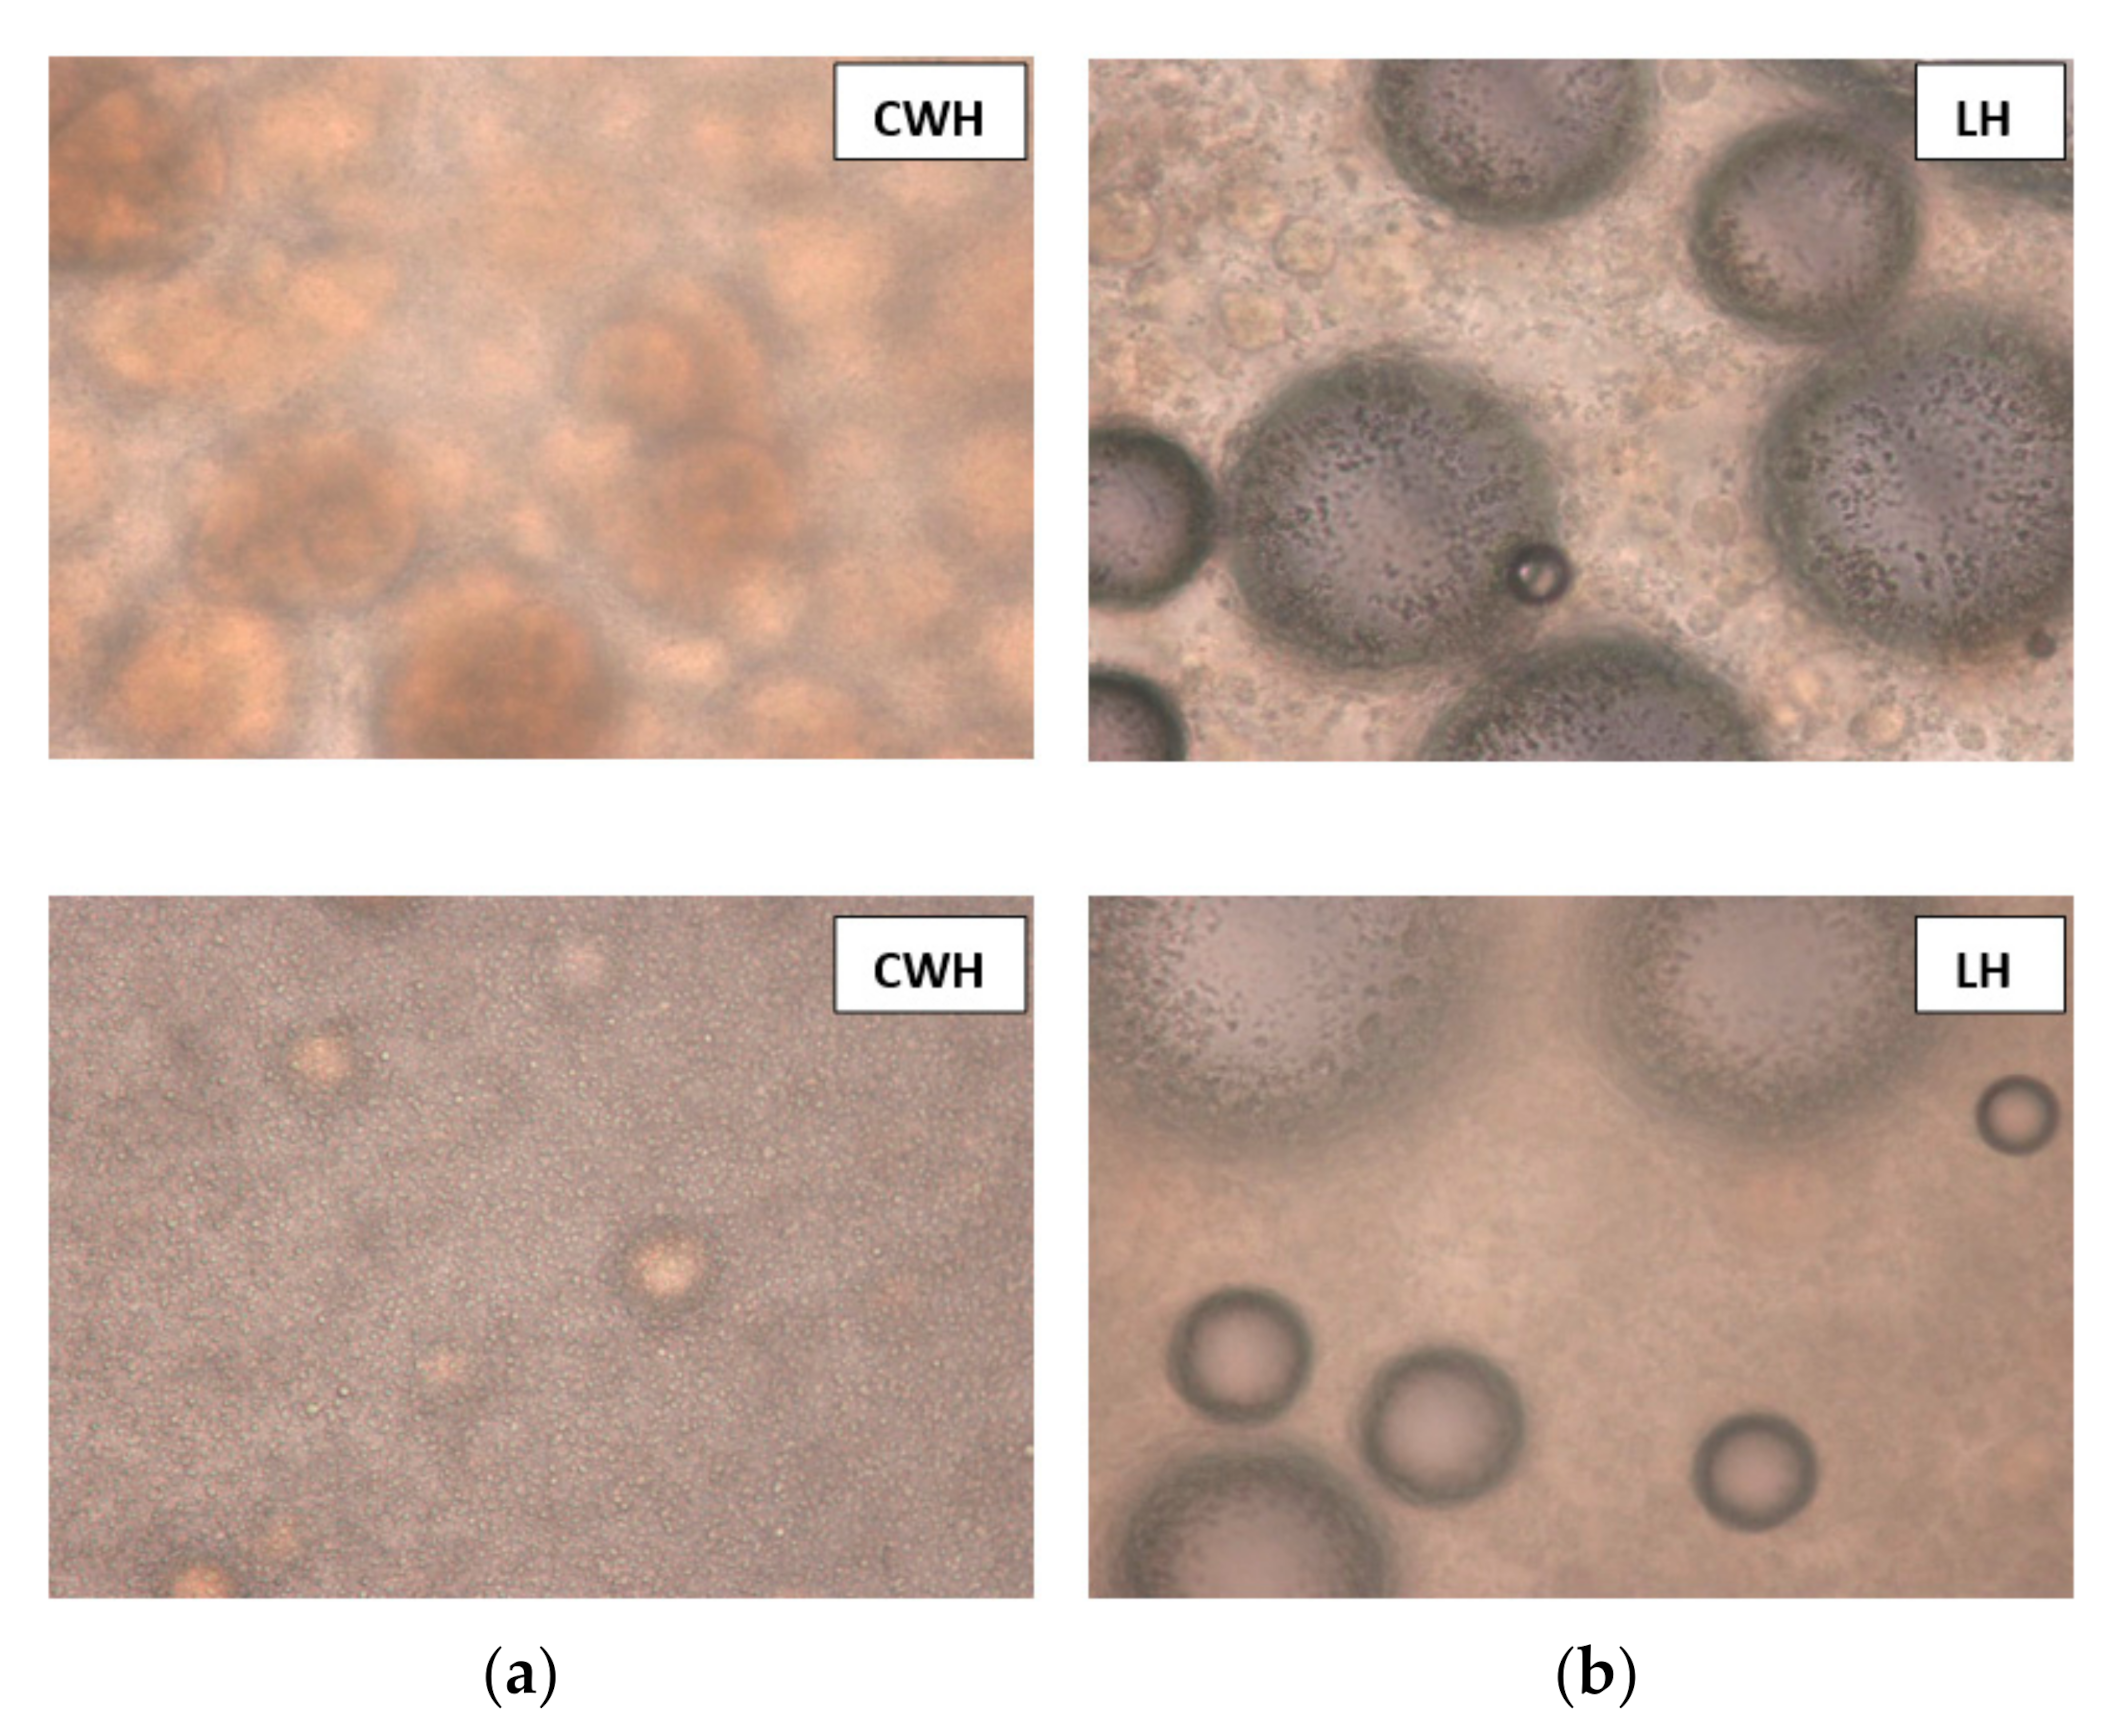
3.5. The Microscopic Analysis

The analysis of microscopic images of ice-cream mixes enables the assessment of the effectiveness of the two stabilisation methods used by observing the differences in particle size and their homogeneity. The process of homogenisation contributed to implementing the air bubbles into ice-cream mixes, which was visible in the picture before and after the maturation (Figure 4).
The reduction of particle size was also observed for all samples, which was confirmed by the particle size analysis (Table 3). The ice-cream mixes were characterised by irregular distribution of fat particles. Samples not subjected to the homogenisation methods have larger fat particles, which is also confirmed by the particle size analysis. The presented photos also show agglomerates of particles. After the 24 h maturation period, despite the decrease in particle diameter, no significant change in the degree or order in the structure of the mixtures was observed. In a study by Voronin et al. [17] in the visualisation of the microstructure of milk ice-cream mixes, the destabilised fat aggregates were also visible.

4. Conclusions

This presented study showed that the iota carrageenan, new stabilisers and homogenisation contributed to a significant influence on the physical properties of vegan ice cream. The homogenisation process did not affect the density of ice-cream mixes but on the other hand, this process caused the destabilisation of ice-cream mixes during the maturation time. According to the TSI (3.0 to 6.5), the higher value of this parameter was noted for the samples after homogenisation independently on the addition of stabilisers. Based on the rheological properties, the homogenisation process influenced the flow behaviour index but only for the samples after maturation time. A significant increase in consistency K and apparent viscosity was noted only for the samples with the addition of stabilisers after homogenisation. Similarly to the tendency observed for rheological properties, significant decrease in the particles sizes were noted for the samples after homogenisation and after the maturation process (D50 11.51 to 6.37 µm).
The stabilisers did not influence the density of ice-cream mixes. Moreover, the used stabilisers influenced the stability of the product considerably more significant than the homogenisation process. The lowest TSI values were noted for the sample without homogenisation treatment but with the addition of stabilisers (with hydrolysates after lactase treatment LWH) at 1.7 value. Additionally, for the samples, IWH and IH (iota carrageenan addition) low TSI value was noted, which contributed to better stability properties during the maturation time. In addition, based on the rheological analysis the samples IH and IWH had higher stability according to the lowest values of the flow behaviour index. The use of stabilisers contributed to significantly decreasing particle sizes (the range of D50 after the maturation was from 11.29 to 28.50 µm). However, the most effective results was observed for samples with the use of hydrolysates of iota carrageenan (after acid hydrolysis-AH), which with the combination of homogenisation treatment decreased the size of particles to 6.33 µm. This particle size decrease in samples with the hydrolysates addition promises more favourable crystal structure creation in ice cream.
To sum up, the satisfying physical properties of ice-cream mixes contributed to obtaining more stable products which can be considered as the potential application of vegan ice cream. Consequently, there exists the significant possibility of decreasing the waste during production and thereby increasing the positive influence on the environment. Such an approach will be treated as the main goal to attain and the main priority for the potential producer for whom sustainable development plays a key role.

Author Contributions

Conceptualisation, A.K. and A.K.-D.; methodology, A.K. and E.J.; software, A.K.; validation, A.K., A.K.-D., E.J. and S.G.; formal analysis, A.K. and A.K.-D.; investigation, A.K., A.K.-D. and E.J.; resources, S.G.; data curation, A.K., A.K.-D. and E.J.; writing—original draft preparation, A.K., A.K.-D. and E.J.; writing—review and editing, A.K., A.K.-D. and E.J.; visualisation, A.K.; supervision, E.J. and S.G.; project administration, A.K.-D. All authors have read and agreed to the published version of the manuscript.

Funding

This research received no external funding.

Institutional Review Board Statement

Not applicable.

Informed Consent Statement

Not applicable.

Data Availability Statement

The data generated or analysed during this study are available from the corresponding author on reasonable request.

Conflicts of Interest

The authors declare no conflict of interest.

References

  1. Konstantas, A.; Stamford, L.; Azapagic, A. Environmental impacts of ice cream. J. Clean. Prod. 2019, 209, 259–272. [Google Scholar] [CrossRef]
  2. Sandström, V.; Valin, H.; Krisztin, T.; Havlik, P.; Herrero, M.; Kastner, T. The role of trade in the greenhouse gas footprints of EU diets. Glob. Food Secur. 2018, 19, 48–55. [Google Scholar] [CrossRef]
  3. Saget, S.; Costa, M.; Santos, C.S.; Vasconcelos, M.W.; Gibbons, J.; Styles, D.; Williams, M. Substitution of beef with pea protein reduces the environmental footprint of meat balls whilst supporting health and climate stabilization goals. J. Clean. Prod. 2021, 297, 126447. [Google Scholar] [CrossRef]
  4. Krizanova, J.; Rosenfeld, L.D.; Tomiyama, J.A.; Guardiola, J. Pro-environmental behaviour predicts adherence to plant-based diets. Appetite 2021, 163, 105243. [Google Scholar] [CrossRef] [PubMed]
  5. Baukid, F.; Rosell, C.M.; Castellari, M. Pea protein ingredients: A mainstream ingredient to (re)formulate innovative foods and beverages. Trends Food Sci. Technol. 2021, 110, 729–742. [Google Scholar] [CrossRef]
  6. Vanga, S.K.; Raghavan, V. How well do plant based alternatives fare nutritionally compared to cow’s milk? J. Food Sci. Technol. 2018, 55, 10–20. [Google Scholar] [CrossRef]
  7. Akdeniz, V.; Akalin Sibel, A. New approach for yoghurt and ice cream production: High intensity ultrasound. Trends Food Sci. Technol. 2019, 86, 392–398. [Google Scholar] [CrossRef]
  8. Fiol, C.; Prado, D.; Romero, C.; Laburu, N.; Mora, M.; Alava, I.J. Introduction of a new family of ice creams. Int. J. Gastron. Food Sci. 2017, 7, 5–10. [Google Scholar] [CrossRef]
  9. Innocente, N.; Biasutti, M.; Venir, E.; Spaziani, M.; Marchesini, G. Effect of high-pressure homogenization on droplet size distribution and rheological properties of ice cream mixes. J. Dairy Sci. 2009, 92, 1864–1875. [Google Scholar] [CrossRef]
  10. Tolstoguzov, V. Some thermodynamic considerations in food formulation. Food Hydrocoll. 2003, 17, 1–23. [Google Scholar] [CrossRef]
  11. Yüksel, A.; Şat, İ.; Yüksel, M.; Çakmakçı, S. A comparative study on the physicochemical characteristics, organic acid profiles, mineral compositions and sensory properties of ice creams produced with different types of nuts. Carpathian J. Food Sci. Technol. 2017, 9, 137–151. [Google Scholar]
  12. O’Neli, C.E.; Nicklas, T.A.; Flugoni, V.L., III. Almond consumption is associated with better nutrient intake, nutrient adequacy, and diet quality in adult: National health and nutrition examination survey 2001–2010. Food Sci. Nutr. 2016, 7, 504–515. [Google Scholar]
  13. Shoaib, M.; Shehzad, A.; Omar, M.; Rakha, A.; Raza, H.; Sharif, H.; Shakeel, A.; Ansari, A.; Niazi, S. Inulin: Properties, health benefits and food applications. Carbohydr. Polym. 2016, 147, 444–454. [Google Scholar] [CrossRef]
  14. Watzl, B.; Girrbach, S.; Roller, M. Inulin, oligofructose and immunomodulation. Br. J. Nutr. 2005, 93 (Suppl. 1), S49–S55. [Google Scholar] [CrossRef]
  15. O’Sullivan, J.; Beevers, J.; Park, M.; Greenwood, R.; Norton, I. Comparative assessment of the effect of ultrasound treatment on protein functionality pre- and post-emulsification. Colloids Surf. A Physicochem. Eng. Asp. 2015, 484, 89–98. [Google Scholar] [CrossRef] [Green Version]
  16. O’Sullivan, J.; Murray, B.; Flynn, C.R.; Norton, I. The effect of ultrasound on the structural, physical and emulsifying properties of animal and vegetable proteins. Food Hydrocoll. 2016, 53, 141–154. [Google Scholar] [CrossRef] [Green Version]
  17. Voronin, G.L.; Roberts, R.; Felix, T.L.; Coupland, J.N.; Harte, F.M. Effect of high-pressure-jest processing on the physiochemical properties of low-fat ice cream mix. J. Dairy Sci. 2020, 103, 6003–6014. [Google Scholar] [CrossRef] [PubMed]
  18. Chauhan, P.; Saxena, A. Bacterial carrageenans: An overview of production and biotechnological applications. 3 Biotech 2016, 6, 1–18. [Google Scholar] [CrossRef] [PubMed] [Green Version]
  19. Kiran-Yildirim, B.; Hale, J.; Wefers, D.; Gaukel, V. Ice recrystallisation inhibition of commercial κ-, ι-, and λ-carrageenans. J. Food Eng. 2021, 290, 110269. [Google Scholar] [CrossRef]
  20. Weiner, L.M. Toxicological properties of carrageenan. Agents Actions 1991, 32, 46–51. [Google Scholar] [CrossRef] [PubMed]
  21. Thrimawithana, T.; Young, S.; Dunstan, D.; Alany, R. Texture and rheological characterisation of kappa and iota carrageenan in the presence of counter ions. Carbohydr. Polym. 2010, 82, 69–77. [Google Scholar] [CrossRef]
  22. Henares, B.M.; Enriquez, E.P.; Dayrit, F.M.; Rojas, N.R.L. Iota-carrageenan hydrolysis by Pseudoalteromonas carrageenovora IFO12985. Philipp. J. Sci. 2010, 139, 131–138. [Google Scholar]
  23. Kamińska-Dwórznicka, A.; Antczak, A.; Samborska, K.; Lenart, A. Acid hydrolysis of kappa-carrageenan as a way of gaining new substances for freezing process modification and protection from excessive recrystallisation of ice. Int. J. Food Sci. Technol. 2015, 50, 1799–1806. [Google Scholar] [CrossRef]
  24. Kamińska-Dwórznicka, A.; Skrzypczak, P.; Gondek, E. Modification of kappa carrageenan by β-galactosidase as a new method to inhibit recrystallization of ice. Food Hydrocoll. 2016, 61, 31–35. [Google Scholar] [CrossRef]
  25. Dłużewska, E.; Gazda, B.; Leszczyński, K. Wpływ wybranych hydrokoloidów polisacharydowych na jakość koncentratów lodów owocowych. Acta Sci. Pol. Technol. Aliment. 2003, 2, 97–107. [Google Scholar]
  26. Goff, H.D.; Hartel, R.W. Ice Cream, 7th ed.; Springer: New York, NY, USA, 2013. [Google Scholar]
  27. Zambrano-Mayorga, L.; Ramirez-Navas, J.; Ochoa-Martinez, C.I. Influence of the formulation on the thermophysical properties and the quality parameters of diary ice cream. DYNA 2019, 86, 117–125. [Google Scholar] [CrossRef]
  28. Florowska, A.; Wójcik, E.; Florowski, T.; Dłużewska, E. Wpływ dodatków preparatów błonnikowych na wybrane wyróżniki jakości lodów. Zesz. Probl. Postępów Nauk Rol. 2013, 574, 11–18. [Google Scholar]
  29. Warren, M.M.; Hartel, R.W. Structural, compositional, and sensorial properties of United States commercial ice cream products. J. Food Sci. 2014, 79, E2005-13. [Google Scholar] [CrossRef]
  30. Alves, A.B.; Santos, W.F.D., Jr.; Faria, W.C.S.; Nascimento, E.; Lanzarin, M.; Siqueria, P.B.; Siqueria, N.F.M.P.; Barros, W.M.D. Developmnet, characterization, and shelf-life of lactose-free artisan ice cream produces with different bases. Res. Soc. Dev. 2021, 10, 1–16. [Google Scholar]
  31. Hu, Y.; Ting, Y.; Hu, J.; Hsieh, S. Techniques and methods to study functional characteristics of emulsion systems. J. Food Drug Anal. 2017, 25, 16–26. [Google Scholar] [CrossRef]
  32. Mengual, O.; Meunier, G.; Cayre, I.; Puech, K.; Snabre, P. Characterisation of instability of concentrated dispersion by a new optical analyser: The TURBISCAN MA 1000. Colloids Surf. A Physicochem. Eng. Asp. 1999, 152, 111–123. [Google Scholar] [CrossRef]
  33. Cheng, J.; Ma, Y.; Li, X.; Yan, T.; Cui, J. Effects of milk protein-polysaccharide interactions on the stability of ice cream mix model systems. Food Hydrocoll. 2015, 45, 327–336. [Google Scholar] [CrossRef]
  34. Keeney, P.G. The fat stability problem in ice cream. Ice Cream Rev. 1958, 8, 42–45. [Google Scholar]
  35. Berger, K.G.; White, G.W. An electron microscopical investigation of fat destabilization in ice cream. J. Food Technol. 1971, 6, 285–294. [Google Scholar] [CrossRef]
  36. Berger, K.G.; Bullimore, B.K.; White, G.W.; Wright, W.B. The structure of ice cream. Dairy Ind. 1972, 419–425, 493–497. [Google Scholar]
  37. Koxholt, M.; Eisenmann, B.; Hinrichs, J. Effect of the fat globule size on the meltdown of ice cream. J. Dairy Sci. 2001, 84, 31–37. [Google Scholar] [CrossRef]
  38. Biasutti, M.; Venir, E.; Marino, M.; Maifreni, M.; Innocente, N. Effects of high pressure homogenisation of ice cream mix on the physical and structural properties of ice cream. Int. Dairy J. 2013, 32, 40–45. [Google Scholar] [CrossRef]
  39. Warren, M.M.; Hartel, R.W. Effects of emulsifier, overrun and dasher speed on ice cream microstructure and melting properties. J. Food Sci. 2018, 83, 639–647. [Google Scholar] [CrossRef]
  40. Kurt, A.; Atalar, I. Effects of quince seed on the rheological, structural and sensory characteristics of ice cream. Food Hydrocoll. 2018, 82, 186–195. [Google Scholar] [CrossRef]
  41. Javidi, F.; Razavi, S.M.; Behrouzian, F.; Alghooneh, A. The influence of basil seed gum, guar gum and their blend on the rheological, physical and sensory properties of low fat ice cream. Food Hydrocoll. 2016, 52, 625–633. [Google Scholar] [CrossRef]
  42. Mostafavi, F.S.; Tehrani, M.M.; Mohebbi, M. Rheological and sensory properties of fat reduced vanilla ice creams containing milk protein concentrate (MPC). J. Food Meas. Charact. 2017, 11, 567–575. [Google Scholar] [CrossRef]
  43. BahramParvar, M.; Razavi, S.M.; Khodaparast, M.H. Rheological characterization and sensory evaluation of a typical soft ice cream made with selected food hydrocolloids. Food Sci. Technol. Int. 2010, 16, 79–88. [Google Scholar] [CrossRef] [PubMed]
  44. Atalar, I.; Kurt, A.; Gul, O.; Yazici, F. Improved physicochemical, rheological and bioactive properties of ice cream: Enrichment with high pressure homogenized hazelnut milk. Int. J. Gastron. Food Sci. 2021, 24, 100358. [Google Scholar] [CrossRef]
  45. Dogan, M.; Kayacier, A. The effect of ageing at a low temperature on the rheological properties of Kahramanmaras-type ice cream mix. Int. J. Food Prop. 2007, 10, 19–24. [Google Scholar] [CrossRef]
  46. Rao, M.A. Rheology of Fluid And Semisolid Foods: Principles and Applications; Springer Science & Business Media: New York, NY, USA, 2007. [Google Scholar]
Figure 1. Variation of backscatter with time for chosen samples during maturation under refrigeration ((a)—sedimentation and creaming; (b)—coalescence).
Sustainability 13 12113 g001
Figure 2. Particles size distribution: (a) before 24 h of maturation of ice-cream mix; (b) after 24 h of maturation of ice-cream mix; (c) before 24 h of maturation of ice-cream mix; (d) after 24 h of maturation of ice-cream mix.
Sustainability 13 12113 g002aSustainability 13 12113 g002b
Figure 3. The viscosity curves of ice-cream mix (a) and after 24 h of maturation (b).
Sustainability 13 12113 g003
Figure 4. The chosen photo of ice-cream mix before (a) and after 24 h of maturation (b).
Sustainability 13 12113 g004
Table 1. The characteristic of samples.
SampleCharacteristics
CWHcontrol sample without the stabilisers and without the homogenisation treatment
CHcontrol sample without the mix of stabilisers and with the homogenisation treatment
IWHsample with the addition of the stabilisers (ɩ-carrageenan, locust bean gum, xanthan gum) and without the homogenisation treatment
IHsample with the addition of the stabilisers (ɩ-carrageenan, locust bean gum, xanthan gum) and with the homogenisation treatment
AWHsample with the addition of the stabilisers (the acid hydrolysates of ɩ-carrageenan, locust bean gum, xanthan gum) and without the homogenisation treatment
AHsample with the addition of the stabilisers (the acid hydrolysates of ɩ-carrageenan, locust bean gum, xanthan gum) and with the homogenisation treatment
BWHsample with the addition of the stabilisers (the enzymatic β-galactosidase hydrolysates of ɩ-carrageenan, locust bean gum, xanthan gum) and without the homogenisation treatment
BHsample with the addition of the stabilisers (the enzymatic β-galactosidase hydrolysates of ɩ-carrageenan, locust bean gum, xanthan gum) and with the homogenisation treatment
LWHsample with the addition of the stabilisers (the enzymatic commercial lactase hydrolysates of ɩ-carrageenan, locust bean gum, xanthan gum) without the homogenisation treatment
LHsample with the addition of the stabilisers (the enzymatic commercial lactase hydrolysates of ɩ-carrageenan, locust bean gum, xanthan gum) and with the homogenisation treatment
Table 2. The density of ice-cream mixes.
SampleDensity [g/cm3]Density after 24 h of Maturation [g/cm3]
CWH1.00 ± 0.03 a,b1.00 ± 0.03 a
CH1.00 ± 0.03 a,b1.00 ± 0.03 a
IWH1.09 ± 0.11 b1.09 ± 0.11 a
IH0.98 ± 0.06 a,b0.98 ± 0.06 a
AWH1.00 ± 0.03 a,b0.98 ± 0.03 a
AH0.94 ± 0.03 a0.98 ± 0.02 a
BWH1.00 ± 0.03 a,b1.01 ± 0.02 a
BH0.94 ± 0.05 a0.99 ± 0.03 a
LWH0.99 ± 0.03 a,b1.01 ± 0.04 a
LH0.92 ± 0.03 a0.97 ± 0.03 a
a–b The differences between mean values with the same letter in rows are statistically insignificant (p < 0.05).
Table 3. The stability of ice-cream mixes.
SampleTSI
CWH2.1
CH3.0
IWH2.3
IH4.1
AWH2.1
AH6.4
BWH3.6
BH6.5
LWH1.7
LH5.2
Table 4. Median D50 of ice-cream mixes.
SampleD50D50 after 24 h of Maturation
CWH15.65 ± 0.62 c17.23 ± 0.49 d
CH20.54 ± 0.45 d11,35 ± 0.48 b
IWH30.40 ± 0.44 e28.50 ± 0.43 e
IH13.77 ± 0.19 b11.51 ± 0.94 b
AWH38.36 ± 0.49 f11.41 ± 0.97 b
AH13.06 ± 0.53 a,b6.33 ± 0.12 a
BWH42.15 ± 0.19 g11.29 ± 0.53 b
BH13.42 ± 0.40 b6.88 ± 0.33 a
LWH38.31 ± 0.66 f13.20 ± 0.45 c
LH11.91 ± 0.16 a6.37 ± 0.48 a
a–g The differences between mean values with the same letter in rows are statistically insignificant (p < 0.05).
Table 5. The goodness of fit of Bingham, Ostwald de Waele and Herschel–Bulkley models for ice-cream mix samples.
SampleCoefficientsBingham
Model
Ostwald de Waele
Model
Herschel–Bulkley
Model
CWHχ21511.15629.726.4
R0.99980.99920.9999
CHχ23794.67782.741.0
R0.99910.99880.9999
IWHχ26,400,003.1653,333.35252
R0.98480.98440.9999
IHχ29,023,333.3656,333.37259
R0.98400.99890.9999
AWHχ2897,667.6402,666.77436.5
R0.99700.99870.9993
AHχ21,393,333.31,823,333.38200.3
R0.99610.99580.9998
BWHχ2476,000.0497,667.016,984.1
R0.99780.99770.9984
BHχ2826,333.3131,000.05919.7
R20.99790.99510.9998
LWHχ2252,666.7281,666.77536.3
R0.99830.99850.9996
LHχ2522,666.7611,100.0831.3
R0.99730.99781.0000
Table 6. The goodness of fit of Bingham, Ostwald de Waele and Herschel–Bulkley models for ice-cream mix samples after 24 h.
SampleCoefficientsBingham
Model
Ostwald De Waele
Model
Herschel–Bulkley
Model
CWHχ213,470.028,005.65101.1
R0.99880.99740.9997
CHχ24144.79231.719.4
R0.99960.99951.0000
IWHχ2122,000.0798,333.39784.3
R0.98710.99910.9997
IHχ213,900,000.02,810,000.02787.7
R0.99250.99851.0000
AWHχ2862,000604,666.721,495.1
R0.99750.99820.9990
AHχ22,513,333.3611,666.7383.0
R0.99580.99891.0000
BWHχ2495,666.7327,000.01537.1
R0.99800.99210.9999
BHχ2852,333.3327,333.3125.0
R0.99720.99891.0000
LWHχ2291,114.0187,333.34069
R0.99870.99910.9997
LHχ2939,000.0230,666.7166.7
R0.99680.99901.0000
Table 7. Herschel–Bulkley model parameters of ice-cream mix at different maturation times (0 and 24 h).
SampleAgeing Time, hτo, 10−3 PaK, 10−3 Pa snn
CWH026.6 ± 0.6 a6.8 ± 2.0 a0.991 ± 0.005 i
2428.6 ± 1.9 a9.4 ± 1.8 a0.978 ± 0.004 g,h,i
CH027.6± 0.8 a7.8 ± 1.3 a0.979 ± 0.010 h,i
2429.9 ± 1.2 a11.8 ± 3.2 a0.949 ± 0.036 f,g,h,i
IWH01080.3 ± 49.9 f336.0 ± 14.7 h,i0.653 ± 0.011 a
24910.8 ± 113.1 e,f462.3 ± 65.7 j0.633 ± 0.029 a
IH01410.3 ± 316.1 g255.6 ± 78.4 g,h0.742 ± 0.056 b
241508.3 ± 119.1 g349.2 ± 21.7 i0.757 ± 0.011 b,c
AWH0444.3 ± 65.7 c75.7 ± 9.7 c,d0.889 ± 0.030 e,f,g
24509.8 ± 7.3 c,d67.7 ± 1.8 c0.927 ± 0.006 e,f,g,h,i
AH0815.8 ± 99.1 d,e,f106.5 ± 18.0 e,f0.855 ± 0.037 d,e,f
24510.2 ± 32.0 c,d176.9 ± 7.7 g0.777 ± 0.010 b,c,d
BWH0396.9 ± 13.1 c55.5 ± 2.3 b0.918 ± 0.008 e,f,g,h
24321.0 ± 42.4 b,c56.6 ± 4.5 b0.925 ± 0.020 e,f,g,h
BH0737.3 ± 105.1 d,e56.9 ± 13.9 b,c0.940 ± 0.051 f,g,h,i
24360.2 ± 34.8 b,c97.7 ± 3.2 e0.830 ± 0.010 c,d,e
LWH0315.8 ± 22.1 b,c53.6 ± 3.6 b0.907 ± 0.010 e,f,g,h
24265.0 ± 43.3 b,c55.2 ± 6.9 b0.913 ± 0.027 e,f,g,h
LH0469.2 ± 36.9 c,d87.5 ± 7.9 d,e0.884 ± 0.018 d,e
24330.8 ± 23.9 b,c108.5 ± 1.0 f0.806 ± 0.019 b,c,d
a–j The differences between mean values with the same letter in rows are statistically insignificant (p < 0.05).
Publisher’s Note: MDPI stays neutral with regard to jurisdictional claims in published maps and institutional affiliations.

