Article

Physical Activity and Well-Being during the Second COVID19-Related Lockdown in Germany in 2021

1
Division of Preventive and Sports Medicine, Institute of Occupational, Social and Environmental Medicine, Goethe-University Frankfurt, Theodor-Stern-Kai 7, 60590 Frankfurt, Germany
2
Department of Sports Medicine, Faculty for Psychology and Human Movement Science, Institute for Human Movement Science, University of Hamburg, Turmweg 2, 20148 Hamburg, Germany
*
Author to whom correspondence should be addressed.
Contributed equally.
Sustainability 2021, 13(21), 12172; https://doi.org/10.3390/su132112172
Submission received: 5 October 2021 / Revised: 30 October 2021 / Accepted: 2 November 2021 / Published: 4 November 2021
(This article belongs to the Section Health, Well-Being and Sustainability)

Abstract

:
In the second wave of the COVID-19 pandemic in Germany, lockdown measures were reinstalled and were in place between November 2020 and April 2021, including the closure of physical activity facilities. The aim of the current online survey was to assess the lockdown effects on physical activity and well-being in the general population. Pre-lockdown vs. lockdown differences were tested with the Χ2 test and the Student’s t-test for paired data. Predictor variables to explain compliance with physical activity recommendations were identified using a fixed-effects binary logistic regression analysis. Data of 993 respondents were analyzed. Transport-related and leisure-time physical activity decreased (p < 0.001, d = 0.25, and p < 0.001, d = 0.33, respectively). Compliance with physical activity recommendations decreased from 42.2% to 29.4% (chi2 (1, 1986) = 35.335, p < 0.001, V = 0.13). Well-being decreased significantly (t (990) = 23.405, p < 0.001) by 16.3 points (d = 0.74). Physical activity and well-being declined in German adults during the second COVID-19-related lockdown. Physical activity should be promoted also in light of the emerging evidence on its protective effects against COVID-19.

1. Introduction

The COVID-19 disease pandemic, caused by the novel coronavirus, has progressed in waves in Germany [1]. The first wave lasted from week 10 until week 20 in 2020 [1]. After the summer with relatively low levels of incidence, hospitalization and mortality, the second wave hit the country in late September 2020, peaked at the end of the year and lasted until the end of February 2021 [1]. The second wave was considerably longer than the first one, with diffused outbreaks and exponential growth of the number of cases [1]. Conditional marketing authorization of preventive vaccines was issued on 21 December 2020 [2], but vaccination rates increased very slowly in the first months of 2021 [3]. Therefore, traditional public health measures that had been in force during the first wave were reintroduced in late 2020. In order to curb infection and mortality, a moderately strict lockdown came into force on 2 November 2020 in Germany [4]. Upon the failure of these measures to effectively reduce the spread of the virus, stricter lockdown measures were implemented as of 16 December 2020, including closure of schools, non-essential shops, restaurants and hotels. Already the measures of the 2 November included the closure of physical activity (PA) facilities, such as sports and fitness clubs and swimming pools. On 23 April 2021 a unified “Federal Emergency Brake” was implemented, which made all potential future restrictions and reopening measures dependent on regional incidence values [5]. Though with some regional differences, widespread reopening of PA facilities did not take place before April 2021, which means they were closed for about six months.
Some risk factors for severe symptoms and mortality related to the COVID-19 disease have been established relatively early during the pandemic. These include non-modifiable factors, such as male sex and older age, and acquired conditions, including obesity, hypertension, diabetes and cardiovascular disease [6]. Now there is a growing recognition of the potentially protective effect of PA and physical fitness against severe symptoms, hospitalization, intensive care and mortality. In a sample of 48,440 patients in the US, PA in compliance with current recommendations was associated with a reduced risk of hospitalization, intensive care unit admission and mortality [7]. Similar results were reported in a nationwide study in South-Korea [8]. Brawner and colleagues found that cardiorespiratory fitness was independently and inversely associated with the risk of COVID-19-related hospitalization [9].
Given these results, findings from the first wave of the pandemic and the ensuing lockdowns are alarming. Numerous studies worldwide and in Germany have documented reduced PA at the level of overall samples [10,11,12]. We found that all PA measures declined during the first lockdown; compliance with current PA recommendations sunk from 38.1% to 30.4% [11]. In contrast to the first lockdown, data on PA during the second lockdown are scarce. A representative study in children and youth in Germany found that, during the first lockdown, unorganized PA (e.g., walking and playing) could, to some extent, compensate for the complete loss of organized sports including physical education [13]. During the second lockdown, however, unorganized PA fell to less than half of the level of the first lockdown, and organized PA was as low as 3.7 min per day [13]. The data of the nationwide, school-based physical fitness surveillance program “SLOfit” in Slovenia documented a dramatic drop in fitness in both boys and girls [14].
Social distancing was judged indispensable until higher vaccination rates were achieved. It has been shown that quarantine can induce detrimental mental health symptoms such as depression, stress, low mood, irritability, insomnia, post-traumatic stress symptoms and anxiety [15]. A recent systematic review and meta-analysis of studies worldwide observed a small increase in anxiety and a moderate increase in depressive symptoms in the general population in the early phase of the pandemic [16]. Ahrens and colleagues found that, in Germany, the first lockdown exerted heterogeneous mental health effects; i.e., while vulnerable groups such as patients with psychiatric disorders and people with weak social networks reported deteriorated mental health, the large majority (83.6%) of the sample maintained or even improved their mental health [17]. Similarly, the representative National Health Survey came to the conclusion that the level of depressive symptoms remained stable until September 2020 [18]. More recent data from Norway [19] and Austria [20], however, indicated substantial negative changes in psychosocial well-being during the second lockdown. Coping mechanisms that were adequate in the early stage might be exhausted in the face of ongoing, accumulated and diffused stressors [19].
In light of these findings, it is plausible that the second lockdown had different effects on people’s behavior and mood. We, therefore, aimed to assess PA and mental well-being in the general German population during the second COVID-19-related lockdown in the spring of 2021.

2. Materials and Methods

2.1. Study Design

The present study used the methodology of our previous survey, with a slight modification in the questionnaire content [11]. We used the SoSci Survey tool (SoSci Survey GmbH, Munich, Germany, https://www.soscisurvey.de/ (accessed on 8 April–2 July 2021)) to conduct a cross-sectional survey in the general German public. Ethical approval was given by Goethe University, Frankfurt (reference number 2020-18). Potential participants received an invitation with a disclosure statement on study aims, data handling and security and the possibility of discontinuation of the study at any time. After reading the information, participants provided informed consent. The identity of respondents was not traceable. The authors’ professional and personal networks were used to distribute the link to the survey with the snowball method (addressees of the mailings were invited to recruit other participants using their respective networks). Addressees were asked to communicate the survey link as applicable and appropriate, e.g., on their websites or in their newsletters. The survey link was accessible between 8 April and 2 July 2021.

2.2. Questionnaire

The survey questionnaire was identical to the one we used in our previous research [11], with the difference that we included the assessment of well-being. In short, we investigated habitual PA, the use of and attitude toward virtual PA offers and well-being. In the present study, we report on habitual PA and well-being. PA, anthropometric data and data on self-reported health were assessed using the relevant questions of the European Health Interview Survey (EHIS) questionnaire [21]. Participants indicated their highest level of education according to the International Standard Classification of Education (ISCED 2011) [22]. Further, participants provided information on their family status, on whether they worked on a short-term work scheme [23] and whether they were working remotely during the COVID-19-related lockdown.
Well-being was assessed using the World Health Organization Well-Being Index (WHO-5). The WHO-5 is a five-item generic global rating scale to measure subjective well-being with adequate validity as a screening tool for depression [24]. Participants provide answers on a five-point Likert scale (0 to 5 points; 0 = never, 1 = sometimes, 2 = less than half of the time, 3 = more than half of the time, 4 = mostly, 5 = always) to five positively phrased items. General population mean scores are available for a large number of countries, and the cut-off value of 50 out of the maximal 100 has been established for depression [24].
Questions relating to PA and well-being were posed twice, once referring to pre-COVID-19 times (“normal”) and once referring to the second lockdown, specifically to the time period March–April 2021, thus providing a clear anchor point [25].

2.3. Data Processing and Statistical Analysis

PA data were analyzed and operationalized based on the official EHIS scoring protocol and as in our previous study [11,26]. In short, we computed the following PA measures: (a) work-related PA (WRPA), (b) transport-related PA (transport-related walking and cycling minutes per week; TRPA), (c) leisure-time PA (total minutes of sports, fitness and recreational leisure-time activities in at least 10 min bouts per week; LTPA), (d) days of muscle-strengthening activities per week (DMSA) and (e) compliance with World Health Organization (WHO) PA recommendations [23] (aerobic activities > 150 min/week determined from LTPA and cycling from TRPA and ≥2 days muscle-strengthening activities/week; active vs. inactive). For participants under 18 years old, the respective WHO PA recommendations (at least 60 min/day aerobic activities and ≥3 days muscle-strengthening activities/week) were applied [27].
We calculated body mass index (BMI) using self-reported body weight and height.
Well-being data were scored according to the WHO-5 scoring protocol [24]. A sum score of 50 points or less is deemed to indicate a depressive mood state (0 = non-normal = depressive mood state vs. 1 = normal = no depressive mood state), and changes of 10 points or more indicate clinically relevant changes [24].
Categorical data are presented as frequencies and scaled parameters as mean and standard deviation (SD). Differences between conditions were tested via Chi2-test (Χ2 test) for categorical variables, with Cramer’s V as a measure for the effect size (small, moderate or large V = 0.1, V = 0.3 and V = 0.5, respectively) in case of significant differences, and via the Student’s t-test for paired data for scaled datasets, including the respective confidence interval for difference of means (95% CI) and effect size (Cohen’s d; small, moderate and large effect sizes were indicated by |d| = 0.2, |d| = 0.5 and |d| = 0.8, respectively). We ran a two-way repeated measures ANOVA (rANOVA) to identify probable interaction effects with specific factors, e.g., family status (living with or without a partner, with or without child(ren)) and COVID-19-related working condition changes such as remote work or no remote work. In the case of a significant interaction, an additional one-way ANOVA was computed for the two conditions separately (normal, lockdown) if there were more than two groups (e.g., family status). We analyzed the change in PA (increases, no changes or decreases) as counts and % values from the normal to the lockdown condition separately for participants complying and not complying with WHO PA recommendations in the normal condition.
We employed a fixed-effects binary logistic regression analysis to identify relevant predictor variables to explain the compliance with WHO recommendations (0 = inactive/1 = active). Measures used in the analysis included WRPA (work effort: 0 = no task (newly encoded), 1 = sitting/standing, 2 = moderate, 3 = demanding interpreted as scaled variable), TRPA, LTPA and DMSA plus the WHO-5 well-being score interpreted as scaled variable and demographic data including sex (0 = female, 1 = male), education level (1 = secondary I (middle school/junior high school), 2 = secondary II (senior high school), 3 = post-secondary (college foundation course), 4 = master craftsman, 5 = university bachelor’s degree, 6 = university master’s degree, 7 = doctoral degree) interpreted as scaled variable, age and BMI. Additionally, remote working condition (encoded as 0 = non-normal = remote, 1 = normal) and the “normal” and “lockdown” conditions (encoded as 0 = non-normal = lockdown, 1 = normal) were entered as categorical variables.
Statistical analyses were conducted using IBM SPSS software (V.22, IBM, Armonk, VA, USA). Significance was accepted for p-values ≤ 0.05.

3. Results

3.1. Descriptive Statistics

After excluding 12 datasets because of missing values for sex, age and BMI and because of an age under fifteen, a sample size of 993 datasets (n = 708, 71.3% females; n = 285, 28.7% males) underwent detailed analysis. Respondents were 45.8 ± 14.7 years old and had a BMI of 24.9 ± 5.1 kg/m2). In total, 1.8%, 59.0%, 26.8% and 11.9% of respondents were underweight (BMI < 18.5), normal weight (BMI 18.5–24.9), overweight (BMI 25–29.9) and obese (BMI ≥ 30), respectively. Sample characteristics are presented in Table 1.
Little less than one third (n = 322 or 32.4%) of respondents reported very good, 544 or 54.8% good, 114 or 11.5% moderate, 11 or 1.1% poor and 2 or 0.2% very poor health, respectively, demonstrating a central tendency (median) of “good”. Almost four in ten participants (39.8%) reported having at least one chronic disease.
Highest educational attainment is presented in Table 2, and family status is shown in Table 3. Over two thirds (69.2%) of the study participants had an academic degree (bachelor’s, master’s, doctoral degree), and none of them had only primary education.
During the survey period, 68 (6.8%) participants were on short-term work, while 754 (75.9%) were not, and 171 (17.2%) were retired, students or pupils. In addition, 441 (44.4%) participants were working remotely, while 403 (40.6%) were not, and 149 (15.0%) answered that they were retired, students or pupils.

3.2. Inferential Statistics

3.2.1. Transport-Related Physical Activity (TRPA)

We documented significant declines in walking minutes per week and in the respective MET minutes, as well as in cycling minutes per week and in the respective MET minutes (p < 0.001, d = 0.21, and p < 0.001, d = 0.18, respectively). In addition, the combined measure TRPA (walking and cycling) showed a significant decrease with a small effect size (p < 0.001, d = 0.25), cf. also Table 4.

3.2.2. Leisure-Time Physical Activity (LTPA) and Muscle-Strengthening Activities (DMSA)

We observed a significant drop in time spent on LTPA (p < 0.001) with a small effect size (d = 0.33). DMSA declined slightly but significantly on average by 0.2 days (p < 0.001) and with a trivial effect size (d = 0.13), cf. Table 5.

3.2.3. Subjective Well-Being

Well-being decreased significantly (t (990) = 23.405, p < 0.001) by 16.3 points on average indicating a more depressive mood under lockdown conditions with a high-moderate effect size (d = 0.74), cf. Table 6.
Changes in well-being differed markedly between the individuals (16.3 ± 22 points) ranging from a drop of −92 points to an increase of +68 points. We found that 565 (56.9%) respondents showed clinically relevant decreases of 10 or more points from normal to lockdown conditions in their well-being.
Applying the WHO-5 cut-off value of ≥50 points, we identified a significant increase of the proportion of persons showing a depressive mood state from normal (11.8%) to lockdown (46.8%) conditions demonstrating a moderate effect size (chi2 (1, 1986) = 294.339, p < 0.001, V = 0.39), cf. Table 7.

3.2.4. Confounding Effects of Short-Term Work, Remote Working or Family Status on Physical Activity or Subjective Well-Being

In a two-factorial model with normal vs. lockdown and changed working conditions (remote working) (n = 441) vs. no changes of working conditions (no remote working, incl. retired, students, pupils) (n = 552) or short-term work (n = 68) vs. no short-term work (incl. retired, students, pupils) (n = 925), respectively, we found a significant interaction for differences in decreases in TRPA, with a larger decrease in the remote-work subsample compared to the non-remote-working part of the sample (F (1, 911) = 28.105, p < 0.001, eta2p = 0.028) (Figure 1).
No significant interaction effects were found of remote working on LTPA (F(1, 991) = 0.380, p = 0.537, eta2p < 0.001) or of short-term work on TRPA (F(1, 991) = 1.276, p = 0.259, eta2p = 0.001) or on LTPA (F(1, 991) = 0.155, p = 0.694, eta2p < 0.001).
Furthermore, there was no significant interaction effect of remote working on decreases in well-being (F(1, 989) = 0.095, p = 0.758, eta2p < 0.001), cf. Table 8.
In the two-factorial model with normal vs. lockdown condition and family status (no partner and no child(ren) (n = 215) vs. with partner and no child(ren) (n = 421) vs. with partner and child(ren) (n = 217) vs. no partner and child(ren) (n = 32) vs. other (n = 108)), we found a significant interaction for differences in the decreases in LTPA (F (4, 988) = 3.707, p = 0.005, eta2p = 0.015). The small (n = 32) subsample of respondents without a partner but with child(ren) showed an unaltered LTPA level from normal to lockdown conditions, while all other subsamples demonstrated a decline in LTPA, although these decreases occurred at different LTPA levels (Figure 2).
An additional one-way ANOVA was significant for the time under normal conditions (F (4, 988) = 3.713, p = 0.005, eta2p = 0.015) revealing a significantly lower LTPA level for the participants with a partner and child(ren) compared to those having no partner and no child(ren) (p = 0.006). This difference was no longer apparent at the time point under lockdown conditions (F (4, 988) = 1.001, p = 0.406, eta2p = 0.004).
We did not observe an interaction effect of family status on well-being under normal or lockdown conditions (F (4, 986) = 1.772, p = 0.132, eta2p = 0.007), cf. Table 8.

3.2.5. Compliance with WHO Physical Activity Recommendations

We documented a significant decrease in the compliance with both parts of the WHO recommendations (aerobic activity from 72.9% to 55.7% (chi2 (1, 1986) = 64.141, p < 0.001, V = 0.18); muscle-strengthening activity from 48.2% to 38.9% (chi2 (1, 1986) = 17.714, p < 0.001, V = 0.09)) in the lockdown condition. The compliance with the combined recommendations dropped from 42.2% to 29.4% (chi2 (1, 1986) = 35.335, p < 0.001, V = 0.13).
In the normal condition, 419 respondents were active (met the combined WHO PA recommendations), and 574 respondents were inactive (failed to meet the combined WHO PA recommendations). The type of changes (decreasers, increasers, maintainers) from normal to lockdown conditions partly differ markedly between active and inactive respondents. The number of decreasers among the inactive is lower, e.g., for LTPA, 34.8% vs. 58.0%, and for DMSA, 12.9% vs. 48.4% (Table 9 and Figure 3).

3.2.6. Binary Logistic Regression Analysis

We ran binary logistic regressions to predict compliance with WHO PA recommendations using demographic data (sex (male vs. female), age and BMI, education, remote working (yes vs. no)) as well as PA (WRPA, TRPA, LTPA and DMSA), well-being (categorical WHO-5 ≤ 50 points = 0 = non-normal = depressive) and the categorical variable “lockdown vs. normal” condition.
The regression model explained 64.2% of the total variance of the compliance with the WHO recommendations (R2Nagelkerke = 0.723) with a correct estimation of 89.0%. Only the predictors LTPA and DMSA (p < 0.001), as well as the lockdown vs. normal categorical variable (p < 0.001), showed a significant contribution, while sex (p = 0.427), age (p = 0.098), BMI (p = 0.124), education level (p = 0.477), remote working (p = 0.417), WRPA (p = 0.921), TRPA (p = 0.717) and well-being (p = 0.821) did not. We found small or negligible odds ratios for the non-significant parameters and LTPA but relevant for DMSA and the lockdown condition. The odds ratio (OR 0.468, 95% CI 0.334–0.654) indicates a reduced chance (−53.2%) to comply with WHO PA recommendations under the lockdown condition (p < 0.001). Respondents not working remotely and categorized as non-depressed had an increased chance (+13.9% and +4.6%, respectively) to be active according to WHO PA recommendations during lockdown, even though results did not reach statistical significance. Males showed a non-significantly reduced chance (−13.6%) to fulfill the PA recommendations. DMSA indicated a highly increased chance (+483.2%) to comply with WHO PA recommendations, cf. Table 10.

4. Discussion

We present here data on the changes in PA and well-being in the second COVID-19-related lockdown in Germany. We documented significant declines in all PA measures and well-being in the overall sample.
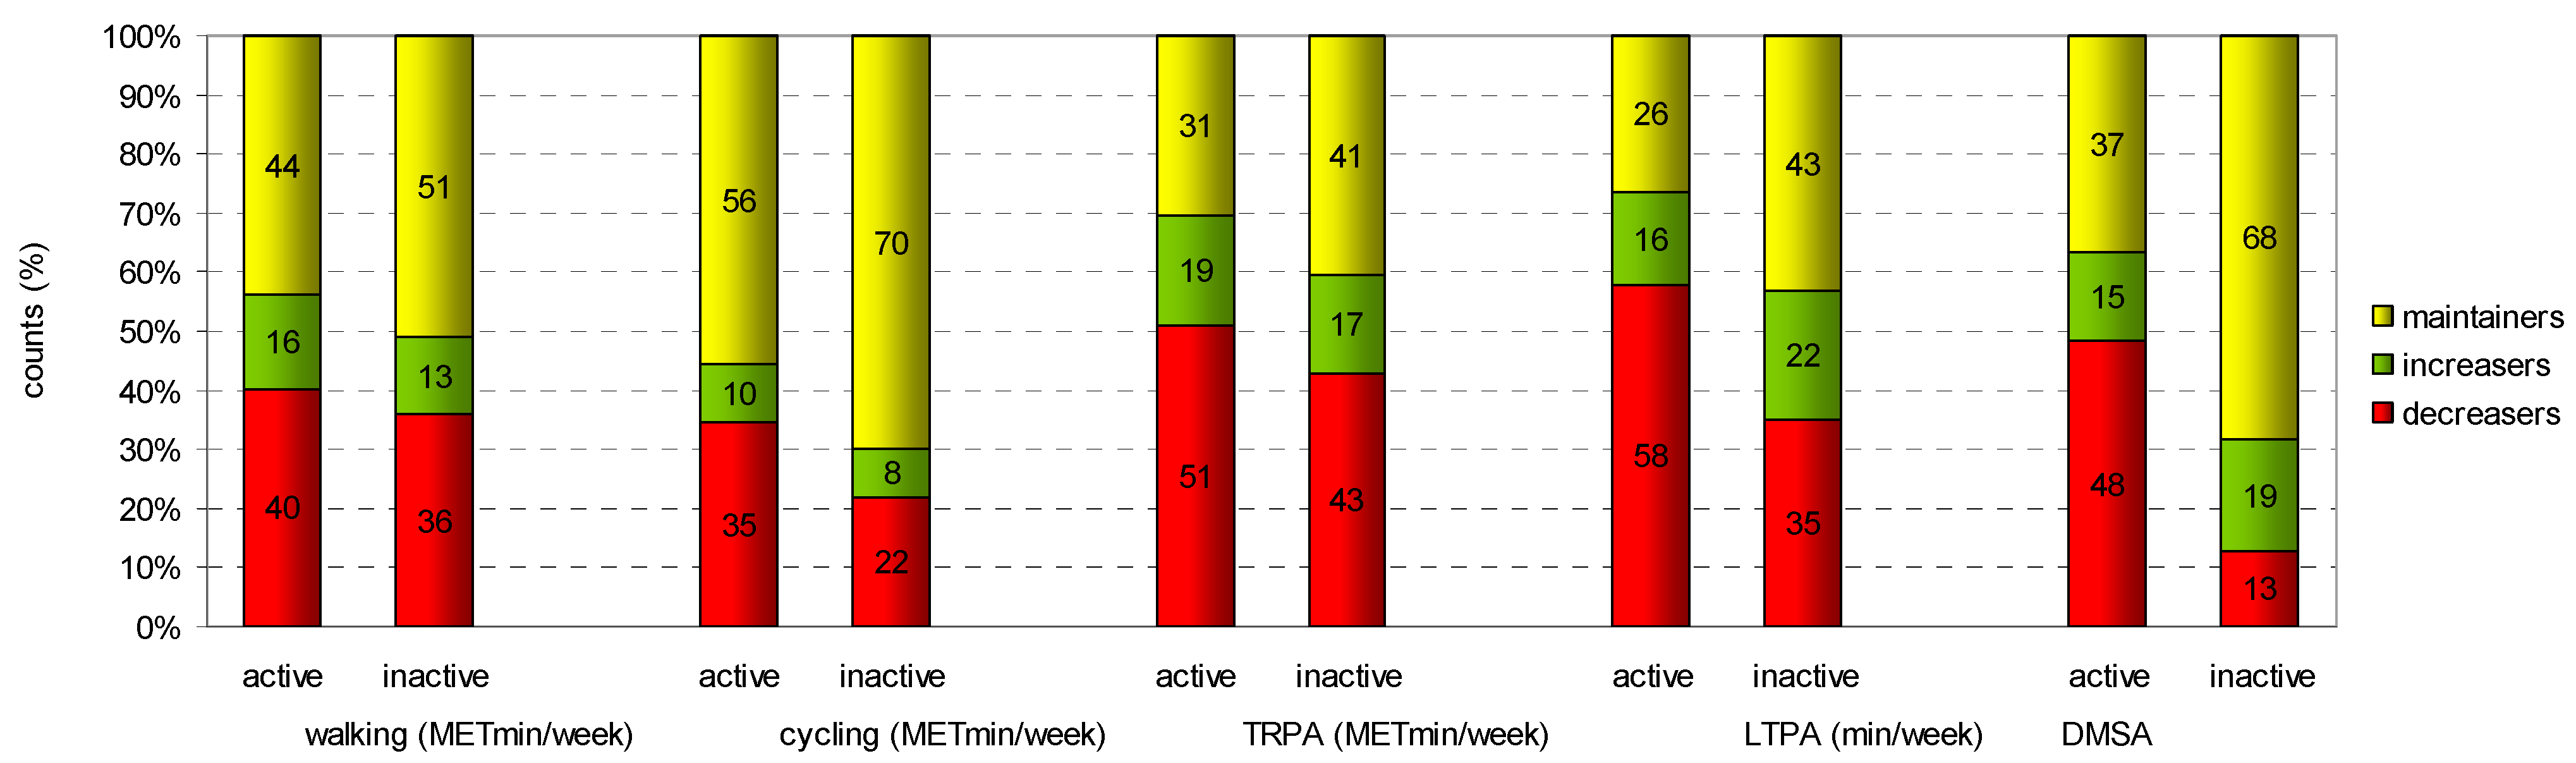
Participants reported about 16% less walking MET minutes and 25% less cycling MET minutes during the lockdown than under normal circumstances. LTPA was also reduced by 20%, and compliance with current PA recommendations also dropped from 42.2% to 29.4%. We found in both the active and inactive subsamples different behavioral patterns—decreasers, maintainers and increasers—the numbers of which were quite similar in the two subsamples, except for the measures LTPA and DMSA. While large proportions of inactive respondents further reduced their activities, 22% and 19% increased LTPA and muscle-strengthening activities, respectively.
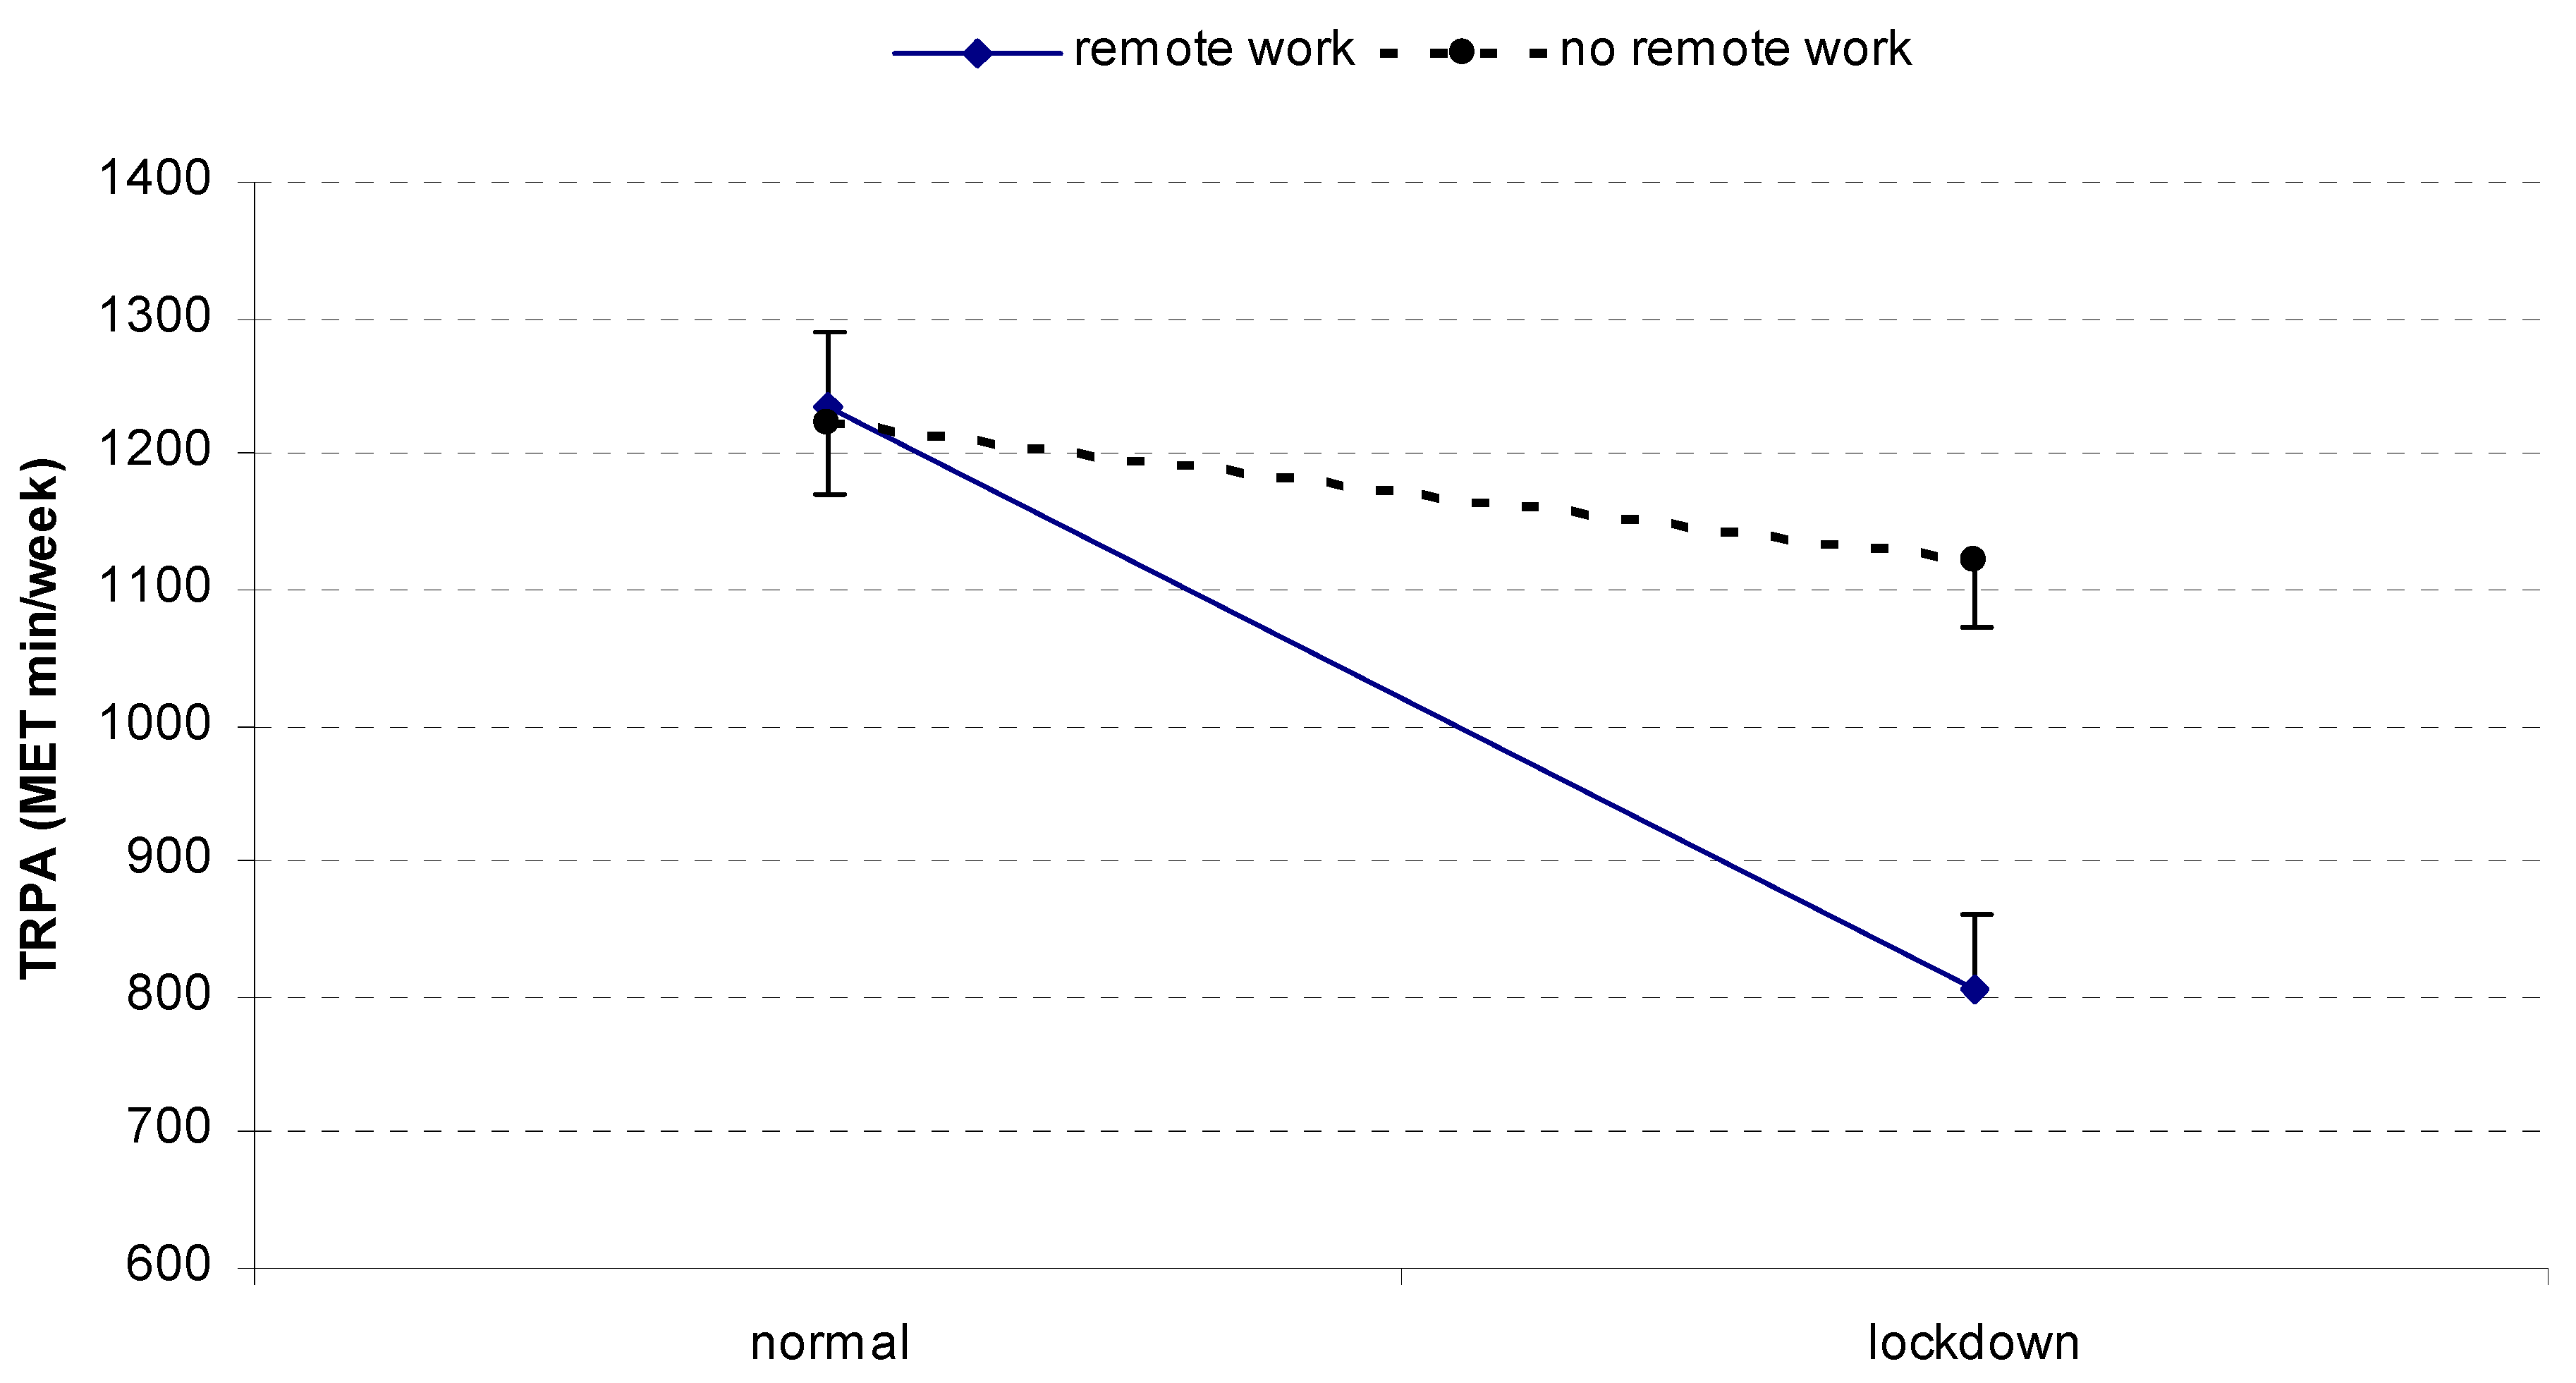
During the lockdown, remote working was highly encouraged, whenever possible. Transport-related activities declined in respondents working from their homes, which is easily explained by the loss of active commuting, but remote working did not affect LTPA nor did it lead to depressive mood in these respondents.
The regression analysis underscored the significance of muscle-strengthening activities. Muscle strengthening had received less attention than endurance type of activities, but now there is a growing appreciation of the health-related effects of these activities. A recent review of prospective cohort studies found epidemiologic evidence that muscle-strengthening activities might contribute to reducing the risk of major chronic diseases [28], and even small-to-moderate increases might bring measurable public health benefits [29]. Muscle strength has been shown to be associated with a lower risk to be hospitalized because of COVID-19 in older adults even after adjusting for established risk factors for severe COVID-19 [30]. Prevalence of muscle-strengthening activities is, generally speaking, lower than that of endurance activities [31]. Aerobic type of activities can be more easily performed in daily life, e.g., by brisk walking or cycling, while engaging in muscle-strengthening activities might be more challenging without fitness studios and similar PA facilities. There seems to be an explicit need to also promote muscle-strengthening activities that are easily adoptable [32].
There is a paucity of comparable studies during the second wave of the pandemic. A small study in German university students, conducted in February 2021, also reported reductions in PA, but these declines cannot be directly compared to our results because of different methodologies employed [33].
Respondents’ well-being during normal conditions (67.8 points) compares very well with norm values (65.7 points) for Germany [24]. However, the decline during the lockdown period is truly alarming. Almost 57% of respondents reported a decline of 10 points or more, which is classified as clinically relevant [24]. The number of participants with values indicating depressive symptoms has increased almost fourfold from normal to lockdown conditions. Moradian and colleagues also found increased depressive symptoms in November 2020 (i.e., at the beginning of the second lockdown in Germany) compared to March 2020 (during the first lockdown) [34]. Similar findings were reported from Norway and Austria [19,20]. It is likely that the ongoing state of alert and seemingly unending uncertainty made people weary and led to emotional exhaustion.
Interestingly, in our sample, well-being was not related to PA. This is in line with the large Mannheim Corona Study [35] but in contrast to the aforementioned study in German students [33]. Investigations from the first wave of the pandemic also found positive associations between PA and well-being [36,37]. However, it is not clear to what extent results from the first wave are generalizable to the second one.
Data on the decline in PA compare well but with larger effect sizes with our previous study conducted in the first lockdown in a sample that was very similar to the present one in terms of sample size, sex distribution, age, BMI, educational attainment, general self-rated health, prevalence of chronic conditions, remote working and PA levels in the normal condition [11]. In addition, the proportions of decreasers, increasers and maintainers from normal to lockdown conditions were similar to those during the first lockdown in [11]. The larger effect sizes in the current study might reflect the cumulative effects of prolonged and recurring coronavirus restrictions.
Based on our data, we cannot say whether PA has reverted to normal levels between the lockdowns. In the Mannheim Corona Study, PA levels in the overall sample surpassed pre-lockdown values in June 2020 (i.e., after the lifting of the restrictions), but certain groups, such as women, parents and people with compromised health, were less active [35]. In Canada, moderate-vigorous PA returned to pre-lockdown levels after the first wave; incidental PA and walking, however, remained significantly lower [38]. In a US study conducted in middle-aged and older adults, moderate-intensity PA returned to pre-pandemic levels after the lockdown; walking, vigorous PA and overall PA, however, did not [39]. Smartphone-tracked PA data from the United Kingdom also indicated heterogeneous changes post-lockdown: while previously active people managed to increase their activity upon the lifting of the restrictions, moderately active people remained at their lockdown low [40]. The COVID-19 Social Study with 35,915 participants identified six different trajectories in the longitudinal change of PA [41]. Almost 30% of respondents reduced their activities, and 12% remained inactive over time [41]. Taken together, it seems plausible that at least some PA measures in certain population groups could have been reduced sustainably following the first lockdown. Health effects of temporarily reduced levels of PA vary depending on fitness and health status, reductions in PA volume and intensity and the length of the period with reduced PA [42,43]. Decreased levels of PA might, however, also contribute to increased energy storage in the adipose tissue [44] and lead to loss of newly acquired improvement in cardiorespiratory fitness [42]. Reduced levels of PA imply reduced overall energy expenditure, which might lead to a positive energy balance in the absence of a reduced energy intake [45]. Indeed, the representative German National Health Survey documented a mean weight increase of about 1 kg and a BMI increase of 0.5 kg/m2 between April-August 2019 and April-August 2020 [18]. Taken together, ongoing and recurrent reduced levels of PA might further enhance the public health challenge of widespread physical inactivity [46]. It might not be realistic to expect PA levels to automatically revert to pre-pandemic values just because most restrictions have been lifted. Rather, targeted PA programming seems to be needed to reach the “old” and “new” inactive.
In the meantime, evidence that PA and fitness might protect against severe COVID-19 symptoms and mortality has been accumulating [7]. Indeed a current systematic review and meta-analysis concluded that higher levels of PA are associated with a 31% lower risk of contracting infectious diseases and 37% lower risk of infectious disease mortality [47]. These protective effects can be explained by various PA-induced mechanisms. Regular PA strengthens the immune system, reduces low-level systemic inflammation and improves mitochondrial fitness [47,48,49].
Our study has several strengths but also some limitations that have to be mentioned. The use of the validated EHIS PAQ helped collect detailed PA data and included a variety of PA measures. The explicit assessment of muscle-strengthening activities allows the establishment of compliance with current PA guidelines. In addition, the WHO-5 is a validated and often used tool. We could analyze data of a reasonably large sample, which, however, was not representative. Since all our data were based on self-report, reporting bias and the effects of social desirability must be considered. Our respondents were highly educated and predominantly female, which might limit the generalizability of our results to other samples. Further, self-selection bias cannot be ruled out either.

5. Conclusions

Our study is one of the first on PA and well-being in the second wave of the COVID-19 pandemic. We documented considerable declines in all PA measures as well as a dramatic increase in depressive mood during the second lockdown in Germany in 2021. Our data expand the existing body of evidence from the first wave of the pandemic and highlight the importance of intensifying efforts to relaunch PA offers and take measures to improve psychological well-being.

Author Contributions

Conceptualization, E.F. and W.B.; methodology, E.F., W.B., R.R. and D.A.G.; formal analysis, J.S.; investigation, E.F., W.B., R.R. and D.A.G.; resources, E.F., W.B., R.R. and D.A.G.; data curation, J.S.; writing—original draft preparation, E.F. and J.S.; writing—review and editing, E.F., W.B., J.S., R.R. and D.A.G.; visualization, J.S.; supervision, E.F. and W.B.; project administration, E.F. All authors have read and agreed to the published version of the manuscript.

Funding

This research received no external funding.

Institutional Review Board Statement

Prior to launching the survey, the ethical approval by Goethe University, Frankfurt, was obtained (reference number 2020-18).

Informed Consent Statement

Informed consent was obtained from all subjects involved in the study.

Data Availability Statement

The data presented in this study are available on request from J.S.

Conflicts of Interest

The authors declare no conflict of interest.

References

  1. Schilling, J.; Tolksdorf, K.; Marquis, A.; Faber, M.; Pfoch, T.; Buda, S.; Haas, W.; Schuler, E.; Altmann, D.; Grote, U.; et al. Die verschiedenen Phasen der COVID-19-Pandemie in Deutschland: Eine deskriptive Analyse von Januar 2020 bis Februar 2021. Bundesgesundheitsblatt Gesundh. Gesundh. 2021, 64, 1093–1106. [Google Scholar] [CrossRef] [PubMed]
  2. European Commission. First Safe and Effective Vaccine against COVID-19. 2020. Available online: https://ec.europa.eu/commission/presscorner/detail/en/ip_20_2466 (accessed on 17 September 2021).
  3. RKI-Coronavirus SARS-CoV-2-Tabelle Mit Den Gemeldeten Impfungen Nach Bundesländern und Impfquoten Nach Altersgruppen (17.9.2021, Tabelle Wird Montags Bis Freitags Aktualisiert). Available online: https://www.rki.de/DE/Content/InfAZ/N/Neuartiges_Coronavirus/Daten/Impfquotenmonitoring.html;jsessionid=849C98AD0E80580CEF7AD57876BFADC1.internet061?nn=13490888 (accessed on 17 September 2021).
  4. Schuppert, A.; Polotzek, K.; Schmitt, J.; Busse, R.; Karschau, J.; Karagiannidis, C. Different spreading dynamics throughout Germany during the second wave of the COVID-19 pandemic: A time series study based on national surveillance data. Lancet Reg. Health-Eur. 2021, 6, 100151. [Google Scholar] [CrossRef]
  5. Bundesregierung. Infektionsschutzgesetz: Das Regelt Die Bundeseinheitliche Notbremse. Available online: https://www.bundesregierung.de/breg-de/suche/bundesweite-notbremse-1888982 (accessed on 17 September 2021).
  6. Hu, J.; Wang, Y. The Clinical Characteristics and Risk Factors of Severe COVID-19. Gerontology 2021, 67, 255–266. [Google Scholar] [CrossRef] [PubMed]
  7. Sallis, R.; Young, D.R.; Tartof, S.Y.; Sallis, J.F.; Sall, J.; Li, Q.; Smith, G.N.; Cohen, D.A. Physical inactivity is associated with a higher risk for severe COVID-19 outcomes: A study in 48 440 adult patients. Br. J. Sports Med. 2021. Available online: https://bjsm.bmj.com/content/bjsports/55/19/1099.full.pdf (accessed on 15 September 2021). [CrossRef]
  8. Lee, S.W.; Lee, J.; Moon, S.Y.; Jin, H.Y.; Yang, J.M.; Ogino, S.; Song, M.; Hong, S.H.; Abou Ghayda, R.; Kronbichler, A.; et al. Physical activity and the risk of SARS-CoV-2 infection, severe COVID-19 illness and COVID-19 related mortality in South Korea: A nationwide cohort study. Br. J. Sports Med. 2021. Available online: https://bjsm.bmj.com/content/bjsports/early/2021/07/21/bjsports-2021-104203.full.pdf (accessed on 15 September 2021). [CrossRef]
  9. Brawner, C.A.; Ehrman, J.K.; Bole, S.; Kerrigan, D.J.; Parikh, S.S.; Lewis, B.K.; Gindi, R.M.; Keteyian, C.; Abdul-Nour, K.; Keteyian, S.J. Inverse Relationship of Maximal Exercise Capacity to Hospitalization Secondary to Coronavirus Disease 2019. Mayo Clin. Proc. 2021, 96, 32–39. [Google Scholar] [CrossRef]
  10. Stockwell, S.; Trott, M.; Tully, M.; Shin, J.; Barnett, Y.; Butler, L.; McDermott, D.; Schuch, F.; Smith, L. Changes in physical activity and sedentary behaviours from before to during the COVID-19 pandemic lockdown: A systematic review. BMJ Open Sport Exerc. Med. 2021, 7, e000960. [Google Scholar] [CrossRef]
  11. Füzéki, E.; Schröder, J.; Groneberg, D.A.; Banzer, W. Physical Activity and Its Related Factors during the First COVID-19 Lockdown in Germany. Sustainability 2021, 13, 5711. [Google Scholar] [CrossRef]
  12. Tison, G.H.; Avram, R.; Kuhar, P.; Abreau, S.; Marcus, G.M.; Pletcher, M.J.; Olgin, J.E. Worldwide Effect of COVID-19 on Physical Activity: A Descriptive Study. Ann. Intern. Med. 2020, 173, 767–770. [Google Scholar] [CrossRef]
  13. Schmidt, S.C.E.; Burchartz, A.; Kolb, S.; Niessner, C.; Oriwol, D.; Hanssen-Doose, A.; Worth, A.; Woll, A. Zur Situation der Körperlich-Sportlichen Aktivität von Kindern und Jugendlichen Während der COVID-19 Pandemie in Deutschland: Die Motorik-Modul Studie (MoMo). 2021. Available online: https://publikationen.bibliothek.kit.edu/1000133697 (accessed on 15 September 2021).
  14. Jurak, G.; Morrison, S.A.; Kovač, M.; Leskošek, B.; Sember, V.; Strel, J.; Starc, G. A COVID-19 Crisis in Child Physical Fitness: Creating a Barometric Tool of Public Health Engagement for the Republic of Slovenia. Front. Public Health 2021, 9, 644235. [Google Scholar] [CrossRef]
  15. Brooks, S.K.; Webster, R.K.; Smith, L.E.; Woodland, L.; Wessely, S.; Greenberg, N.; Rubin, G.J. The psychological impact of quarantine and how to reduce it: Rapid review of the evidence. Lancet 2020, 395, 912–920. [Google Scholar] [CrossRef] [Green Version]
  16. Kunzler, A.M.; Röthke, N.; Günthner, L.; Stoffers-Winterling, J.; Tüscher, O.; Coenen, M.; Rehfuess, E.; Schwarzer, G.; Binder, H.; Schmucker, C.; et al. Mental burden and its risk and protective factors during the early phase of the SARS-CoV-2 pandemic: Systematic review and meta-analyses. Glob. Health 2021, 17, 34. [Google Scholar] [CrossRef] [PubMed]
  17. Ahrens, K.F.; Neumann, R.J.; Kollmann, B.; Plichta, M.M.; Lieb, K.; Tüscher, O.; Reif, A. Differential impact of COVID-related lockdown on mental health in Germany. World Psychiatry 2021, 20, 140–141. [Google Scholar] [CrossRef]
  18. Damerow, S.; Rommel, A.; Prütz, F.; Beyer, A.-K.; Hapke, U.; Schienkiewitz, A.; Starker, A.; Richter, A.; Baumert, J.; Fuchs, J.; et al. Gesundheitliche Lage der Bevölkerung zu Beginn der COVID-19-Pandemie. J. Health Monit. 2020. Available online: https://www.rki.de/DE/Content/Gesundheitsmonitoring/Gesundheitsberichterstattung/GBEDownloadsJ/JoHM_04_2020_Gesundheitliche_Lage_COVID-19.pdf?__blob=publicationFile (accessed on 15 September 2021).
  19. Hansen, T.; Sevenius Nilsen, T.; Knapstad, M.; Skirbekk, V.; Skogen, J.; Vedaa, Ø.; Nes, R.B. COVID-fatigued? A longitudinal study of Norwegian older adults’ psychosocial well-being before and during early and later stages of the COVID-19 pandemic. Eur. J. Ageing 2021, 1–11. Available online: https://link.springer.com/article/10.1007/s10433-021-00648-0 (accessed on 15 September 2021). [CrossRef]
  20. Dale, R.; Budimir, S.; Probst, T.; Stippl, P.; Pieh, C. Mental Health during the COVID-19 Lockdown over the Christmas Period in Austria and the Effects of Sociodemographic and Lifestyle Factors. IJERPH 2021, 18, 3679. [Google Scholar] [CrossRef]
  21. European Health Interview Survey (EHIS Wave 2): Methodological Manual: 2013 Edition; Publications Office: Luxembourg, 2013; ISBN 978-92-79-29424-2.
  22. International Standard Classification of Education (ISCED)-Statistics Explained. Available online: https://ec.europa.eu/eurostat/statistics-explained/index.php/International_Standard_Classification_of_Education_(ISCED) (accessed on 26 March 2021).
  23. Eurofound. Short-Time Work. Available online: https://www.eurofound.europa.eu/observatories/eurwork/industrial-relations-dictionary/short-time-work (accessed on 21 September 2021).
  24. Topp, C.W.; Østergaard, S.D.; Søndergaard, S.; Bech, P. The WHO-5 Well-Being Index: A systematic review of the literature. Psychother. Psychosom. 2015, 84, 167–176. [Google Scholar] [CrossRef] [PubMed]
  25. Hipp, L.; Bünning, M.; Munnes, S.; Sauermann, A. Problems and pitfalls of retrospective survey questions in COVID-19 studies. 109–114 Pages/Survey Research Methods, Vol 14 No 2 (2020): Survey Research Methods During the COVID-19 Crisis/Survey Research Methods, Vol 14 No 2 (2020): Survey Research Methods During the COVID-19 Crisis. J. Eur. Surv. Res. Assoc. 2020, 14, 109–114. [Google Scholar] [CrossRef]
  26. Finger, J.D.; Tafforeau, J.; Gisle, L.; Oja, L.; Ziese, T.; Thelen, J.; Mensink, G.B.M.; Lange, C. Development of the European Health Interview Survey-Physical Activity Questionnaire (EHIS-PAQ) to monitor physical activity in the European Union. Arch. Public Health 2015, 73, 59. [Google Scholar] [CrossRef] [Green Version]
  27. Bull, F.C.; Al-Ansari, S.S.; Biddle, S.; Borodulin, K.; Buman, M.P.; Cardon, G.; Carty, C.; Chaput, J.-P.; Chastin, S.; Chou, R.; et al. World Health Organization 2020 guidelines on physical activity and sedentary behaviour. Br. J. Sports Med. 2020, 54, 1451–1462. [Google Scholar] [CrossRef] [PubMed]
  28. Giovannucci, E.L.; Rezende, L.F.M.; Lee, D.H. Muscle-strengthening activities and risk of cardiovascular disease, type 2 diabetes, cancer and mortality: A review of prospective cohort studies. J. Intern. Med. 2021, 290, 789–805. [Google Scholar] [CrossRef]
  29. Bennie, J.A.; Shakespear-Druery, J.; de Cocker, K. Muscle-strengthening Exercise Epidemiology: A New Frontier in Chronic Disease Prevention. Sports Med. Open 2020, 6, 40. [Google Scholar] [CrossRef]
  30. Cheval, B.; Sieber, S.; Maltagliati, S.; Millet, G.P.; Formánek, T.; Chalabaev, A.; Cullati, S.; Boisgontier, M.P. Muscle strength is associated with COVID-19 hospitalization in adults 50 years of age or older. In J. Cachexia Sarcopenia Muscle; 2021. Available online: https://www.ncbi.nlm.nih.gov/pmc/articles/PMC7941660/ (accessed on 22 September 2021). [CrossRef]
  31. Finger, J.D.; Mensink, G.B.; Lange, C. Health-enhancing physical activity during leisure time among adults in Germany. J. Health Monit. 2017, 2, 35–42. [Google Scholar]
  32. Füzéki, E.; Banzer, W. Physical Activity Recommendations for Health and Beyond in Currently Inactive Populations. Int. J. Environ. Res. Public Health 2018, 15, 1042. [Google Scholar] [CrossRef] [Green Version]
  33. Pietsch, S.; Linder, S.; Jansen, P. Well-being and its relationship with sports and physical activity of students during the coronavirus pandemic. Ger. J. Exerc. Sport Res. 2021. Available online: https://link.springer.com/article/10.1007/s12662-021-00750-6 (accessed on 22 September 2021). [CrossRef]
  34. Moradian, S.; Bäuerle, A.; Schweda, A.; Musche, V.; Kohler, H.; Fink, M.; Weismüller, B.; Benecke, A.-V.; Dörrie, N.; Skoda, E.-M.; et al. Differences and similarities between the impact of the first and the second COVID-19-lockdown on mental health and safety behaviour in Germany. In J. Public Health; 2021; p. fdab037. Available online: https://www.ncbi.nlm.nih.gov/pmc/articles/PMC7989220/ (accessed on 24 September 2021). [CrossRef]
  35. Mata, J.; Wenz, A.; Rettig, T.; Reifenscheid, M.; Möhring, K.; Krieger, U.; Friedel, S.; Fikel, M.; Cornesse, C.; Blom, A.G.; et al. Health behaviors and mental health during the COVID-19 pandemic: A longitudinal population-based survey in Germany. Soc. Sci. Med. 2021, 287, 114333. [Google Scholar] [CrossRef] [PubMed]
  36. Jenkins, M.; Houge Mackenzie, S.; Hodge, K.; Hargreaves, E.A.; Calverley, J.R.; Lee, C. Physical Activity and Psychological Well-Being During the COVID-19 Lockdown: Relationships With Motivational Quality and Nature Contexts. Front. Sports Act. Living 2021, 3, 637576. [Google Scholar] [CrossRef] [PubMed]
  37. Carriedo, A.; Cecchini, J.A.; Fernandez-Rio, J.; Méndez-Giménez, A. COVID-19, Psychological Well-being and Physical Activity Levels in Older Adults During the Nationwide Lockdown in Spain. Am. J. Geriatr. Psychiatry 2020, 28, 1146–1155. [Google Scholar] [CrossRef] [PubMed]
  38. Di Sebastiano, K.M.; Chulak-Bozzer, T.; Vanderloo, L.M.; Faulkner, G. Don’t Walk So Close to Me: Physical Distancing and Adult Physical Activity in Canada. Front. Psychol. 2020, 11, 1895. [Google Scholar] [CrossRef]
  39. Joseph, R.P.; Pituch, K.A.; Guest, M.A.; Maxfield, M.; Peckham, A.; Coon, D.W.; Kim, W.; Langer, S.L. Physical Activity Among Predominantly White Middle-Aged and Older US Adults During the SARS-CoV-2 Pandemic: Results From a National Longitudinal Survey. Front. Public Health 2021, 9, 652197. [Google Scholar] [CrossRef] [PubMed]
  40. McCarthy, H.; Potts, H.W.W.; Fisher, A. Physical Activity Behavior Before, During, and After COVID-19 Restrictions: Longitudinal Smartphone-Tracking Study of Adults in the United Kingdom. J. Med. Internet Res. 2021, 23, e23701. [Google Scholar] [CrossRef] [PubMed]
  41. Bu, F.; Bone, J.K.; Mitchell, J.J.; Steptoe, A.; Fancourt, D. Longitudinal changes in physical activity during and after the first national lockdown due to the COVID-19 pandemic in England. Sci. Rep. 2021, 11, 17723. [Google Scholar] [CrossRef] [PubMed]
  42. Mujika, I.; Padilla, S. Detraining: Loss of training-induced physiological and performance adaptations. Part II: Long term insufficient training stimulus. Sports Med. 2000, 30, 145–154. [Google Scholar] [CrossRef] [PubMed]
  43. Bowden Davies, K.A.; Pickles, S.; Sprung, V.S.; Kemp, G.J.; Alam, U.; Moore, D.R.; Tahrani, A.A.; Cuthbertson, D.J. Reduced physical activity in young and older adults: Metabolic and musculoskeletal implications. Ther. Adv. Endocrinol. Metab. 2019, 10, 2042018819888824. [Google Scholar] [CrossRef] [PubMed]
  44. Del Vecchio, F.B.; Coswig, V.S.; Cabistany, L.D.; Orcy, R.B.; Gentil, P. Effects of exercise cessation on adipose tissue physiological markers related to fat regain: A systematic review. SAGE Open Med. 2020, 8, 2050312120936956. [Google Scholar] [CrossRef] [PubMed]
  45. Hill, J.O.; Wyatt, H.R.; Peters, J.C. The Importance of Energy Balance. Eur. Endocrinol. 2013, 9, 111–115. [Google Scholar] [CrossRef] [PubMed] [Green Version]
  46. Ramirez Varela, A.; Sallis, R.; Rowlands, A.V.; Sallis, J.F. Physical Inactivity and COVID-19: When Pandemics Collide. J. Phys. Act. Health 2021, 18, 1–2. [Google Scholar] [CrossRef] [PubMed]
  47. Chastin, S.F.M.; Abaraogu, U.; Bourgois, J.G.; Dall, P.M.; Darnborough, J.; Duncan, E.; Dumortier, J.; Pavón, D.J.; McParland, J.; Roberts, N.J.; et al. Effects of Regular Physical Activity on the Immune System, Vaccination and Risk of Community-Acquired Infectious Disease in the General Population: Systematic Review and Meta-Analysis. Sports Med. 2021, 51, 1673–1686. [Google Scholar] [CrossRef]
  48. Burtscher, J.; Millet, G.P.; Burtscher, M. Low cardiorespiratory and mitochondrial fitness as risk factors in viral infections: Implications for COVID-19. Br. J. Sports Med. 2020, 55, 413–415. [Google Scholar] [CrossRef] [PubMed]
  49. Zbinden-Foncea, H.; Francaux, M.; Deldicque, L.; Hawley, J.A. Does High Cardiorespiratory Fitness Confer Some Protection Against Proinflammatory Responses After Infection by SARS-CoV-2? Obes. Silver Spring 2020, 28, 1378–1381. [Google Scholar] [CrossRef] [PubMed]
Figure 1. Transport-related physical activity (MET min/week) changes from normal to lockdown conditions in respondents working remotely under COVID-19-related social distancing rules vs. not working remotely (mean ± SEM). TRPA = transport-related physical activity, MET min/week = metabolic-equivalent-of-task minutes per week.
Sustainability 13 12172 g001
Figure 2. Changes in leisure-time physical activity (min/week) from normal to lockdown conditions according to family status (mean ± SEM).
Sustainability 13 12172 g002
Figure 3. Counts (%) changes from normal to lockdown in the active and inactive subsamples.
Sustainability 13 12172 g003
Table 1. Sample characteristics.
nMean ± SD
Age (y)females70744.9 ± 14.2
males28547.9 ± 15.8
Weight (kg)females70469.4 ± 14.9
males28484.6 ± 14.2
Height (m)females7051.68 ± 0.06
males2841.81 ± 0.08
BMI (kg/m2)females70424.5 ± 5.0
males28426.0 ± 5.3
BMI = body mass index.
Table 2. Highest educational attainment.
Highest Educational Attainmentn (%)
Missing1 (0.1)
Lower secondary education85 (8.6)
Higher secondary education151 (15.2)
Post-secondary non-tertiary education44 (4.4)
Short-cycle tertiary education25 (2.5)
Bachelor’s or equivalent level169 (17.0)
Master’s or equivalent level383 (38.6)
Doctoral or equivalent level135 (13.6)
Total993 (100)
Table 3. Family status.
Family Statusn (%)
Missing0 (0.0)
No partner, no child(ren)215 (21.7)
With partner, no child(ren)421 (42.4)
With partner, child(ren)217 (21.9)
No partner, child(ren)32 (3.2)
Other108 (10.9)
Total993 (100)
Table 4. Change in transport-related physical activity from normal to lockdown condition (n = 993).
MeanSDSEMMean Difft-Valuep-ValueCohen’s d95% CI Lower95% CI Upper
Walking (min/week)normal216.6219.07.035.76.614<0.0010.2125.146.3
lockdown181.0218.56.9
Walking (MET min/week)normal714.9722.822.9117.76.614<0.0010.2182.8152.6
lockdown597.2720.922.9
Cycling (min/week)normal85.3144.24.621.35.553<0.0010.1813.828.8
lockdown64.0136.74.3
Cycling (MET min/week)normal511.6865.027.5127.85.553<0.0010.1882.6173.0
lockdown383.8820.526.0
TRPA (MET min/week)normal1226.51167.137.0245.57.883<0.0010.25184.4306.6
lockdown981.01162.936.9
TRPA = transport-related physical activity, MET min/week = metabolic-equivalent-of-task minutes per week.
Table 5. Change in leisure-time physical activity (LTPA) and muscle-strengthening activities (DMSA) from normal to lockdown condition (n = 993).
MeanSDSEMMean Difft-Valuep-ValueCohen’s d95% CI Lower95% CI Upper
LTPA (min/week)normal238.2210.66.752.710.321<0.0010.3342.762.7
lockdown185.5206.06.5
DMSAnormal1.71.70.10.23.999<0.0010.130.10.3
lockdown1.52.00.1
LTPA = leisure-time physical activity, DMSA= days of muscle-strengthening activities per week.
Table 6. Change in subjective well-being from normal to lockdown condition (n = 991).
MeanSDSEMMean Difft-Valuep-ValueCohen’s d95% CI Lower95% CI Upper
WHO-5 (pts.)normal67.815.20.516.323.405<0.0010.7414.917.6
lockdown51.521.30.7
Table 7. Depressive mood state under normal and lockdown conditions (WHO-5 pts. ≤50 vs. >50 pts.).
Depressive Mood (≤50 pts.)Non-Depressive Mood (>50 pts.)Total
normal conditionn117876993
(percent)11.8%88.2%100%
lockdown conditionn465528993
(percent)46.8%53.2%100%
Table 8. Two-way rANOVA results.
Normal ConditionLockdown ConditionGroupConditionGroup X Condition
MSDMSDF-Valuep-Valueeta2 Part.F-Valuep-Valueeta2 Part.F-Valuep-Valueeta2 Part.
TRPAshort-work1046.51023.7930.8904.90.8660.3520.0019.0450.0030.0091.2760.2590.001
no short-work1239.71176.4984.71179.9
remote work1233.11160.5805.41008.85.0910.0240.00572.799<0.0010.06828.10<0.0010.028
no remote work1221.21173.41121.31256.0
LTPAshort-work249.9284.1189.8255.90.1250.7230.00030.810<0.0010.0300.1550.6940.000
no short-work237.4204.3185.2202.1
remote work236.8198.6180.6190.70.2230.6370.000106.54<0.0010.0970.3800.5370.000
no remote work239.4219.9189.5217.6
family 1265.4234.5186.7219.62.1480.0730.00934.320<0.001.0343.7070.0050.015
family 2241.3216.0186.2208.8
family 3195.6166.2166.8175.9
family 4214.1149.0219.1226.4
family 5264.8223.3208.5217.1
Well-beingremote work66.715.150.220.95.3720.0210.005542.03<0.0010.3540.0950.7580.000
no remote work68.715.352.621.5
family 168.015.849.522.40.3090.8720.001234.37<0.0010.1921.7720.1320.007
family 267.815.551.720.5
family 368.714.051.821.5
family 466.414.553.623.5
family 566.115.954.020.7
Family 1 = no partner and no child(ren), family 2 = with partner and no child(ren), family 3 = with partner and child(ren), family 4 = no partner and child(ren), family 5 = other, TRPA= transport-related physical activity, LTPA = leisure-time physical activity.
Table 9. Counts (%) changes from normal to lockdown in the total, active and inactive subsamples.
Total (n = 993)Active (n = 419)Inactive (n = 574)
Counts(%)Counts(%)Counts(%)
walking (MET min/week)decreasers37637.916940.320736.1
increasers14014.16615.87412.9
maintainers47748.018443.929351.0
cycling (MET min/week)decreasers27027.214534.612521.8
increasers888.9419.8478.2
maintainers63563.923355.640270.0
TRPA (MET min/week)decreasers45946.221350.824642.9
increasers17317.47818.69516.6
maintainers36136.412830.523340.6
LTPA (min/week)decreasers44344.624358.020034.8
increasers19219.36515.512722.1
maintainers35836.111126.524743.0
DMSAdecreasers27727.920348.47412.9
increasers17017.16214.810818.8
maintainers54655.015436.839268.3
TRPA = transport-related physical activity, LTPA = leisure-time physical activity, DMSA = days of muscle-strengthening activities per week, MET min/week = metabolic-equivalent-of-task minutes per week.
Table 10. Binary logistic regression model with odds ratios (95% CI) for the explanation of compliance with physical activity recommendations including sex, age, BMI, WRPA, TRPA, LTPA and DMSA and well-being (categorical variable) and the categorical variable “lockdown vs. normal” condition.
BSEWalddfSig.Exp(B)95% CI EXP(B)
LowerUpper
Lockdown−0.7600.17119.69310.0000.4680.3340.654
Sex−0.1420.1780.63110.4270.8680.6121.231
Age−0.0090.0062.73010.0980.9910.9801.002
BMI−0.0260.0172.37110.1240.9740.9431.007
Education0.0290.0410.50510.4771.0300.9501.116
Remote working0.1300.1600.65910.4171.1390.8321.558
WRPA−0.0160.1610.01010.9210.9840.7181.349
TRPA0.0000.0000.13110.7171.0001.0001.000
LTPA0.0060.001134.58710.0001.0061.0051.007
DMSA1.5750.081379.83910.0004.8324.1245.662
Well-being0.0450.1980.05110.8211.0460.7101.541
Constant−3.3450.60830.29010.0000.035
WRPA = work-related physical activity, TRPA = transport-related physical activity, LTPA = leisure-time physical activity, DMSA = days of muscle-strengthening activity, Well-being = WHO-5 sum score ≤ 50 pts. indicating depression: 0 = non-normal = depressive, 1 = normal = not depressive.
Publisher’s Note: MDPI stays neutral with regard to jurisdictional claims in published maps and institutional affiliations.

